Cities with the Most Immigrants from Micronesia in Washington
RELATED REPORTS & OPTIONS
Micronesia
Washington
Compare Cities
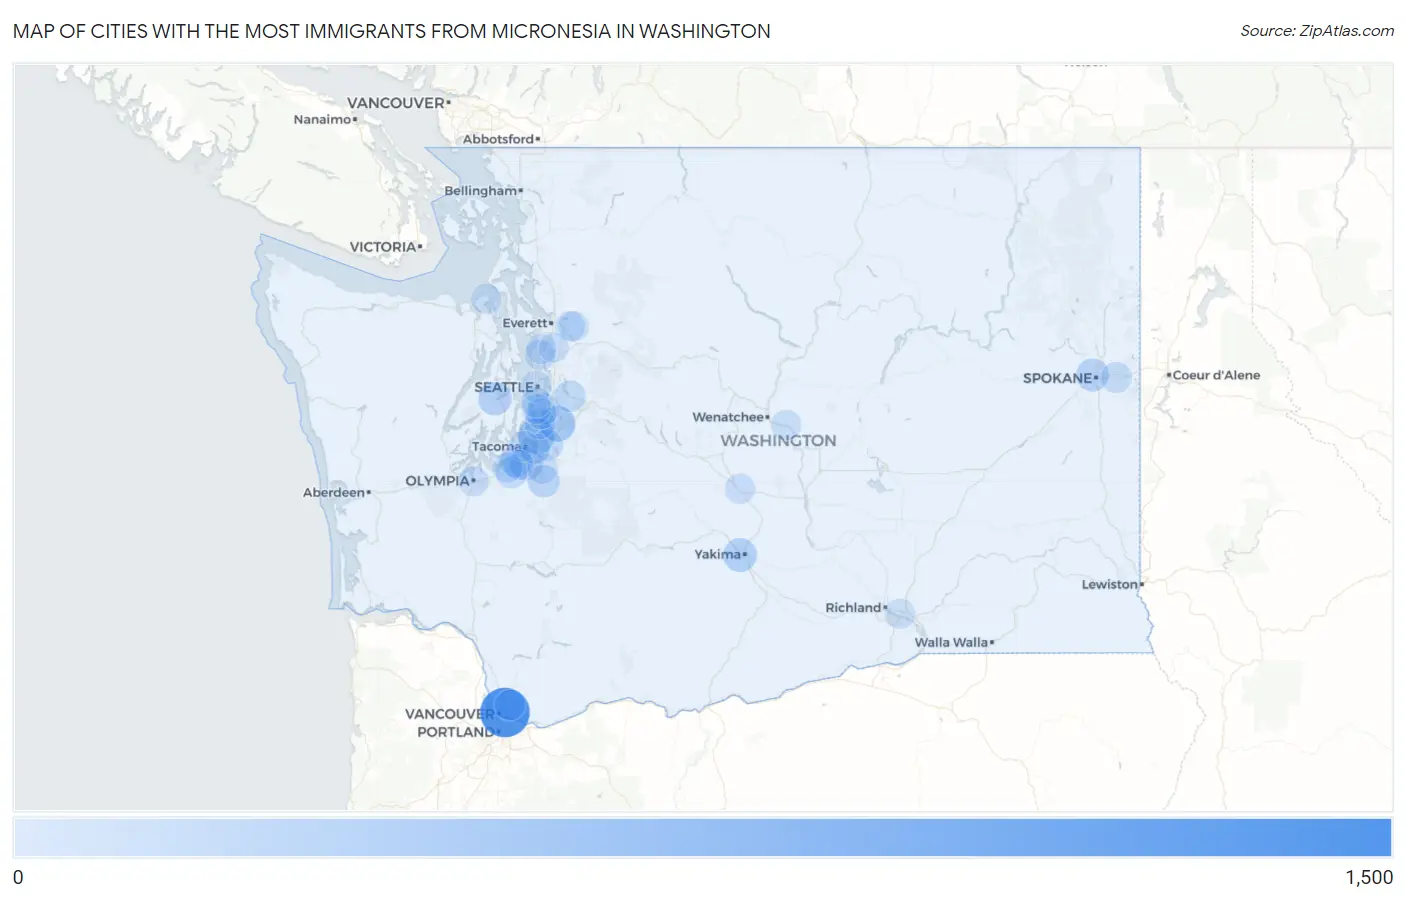
Map of Cities with the Most Immigrants from Micronesia in Washington
0
1,500
Cities with the Most Immigrants from Micronesia in Washington
| City | Micronesia | vs State | vs National | |
| 1. | Vancouver | 1,362 | 4,144(32.87%)#1 | 32,739(4.16%)#2 |
| 2. | Federal Way | 431 | 4,144(10.40%)#2 | 32,739(1.32%)#7 |
| 3. | Kent | 390 | 4,144(9.41%)#3 | 32,739(1.19%)#8 |
| 4. | Yakima | 245 | 4,144(5.91%)#4 | 32,739(0.75%)#19 |
| 5. | Bremerton | 217 | 4,144(5.24%)#5 | 32,739(0.66%)#25 |
| 6. | Parkland | 191 | 4,144(4.61%)#6 | 32,739(0.58%)#33 |
| 7. | Spokane | 189 | 4,144(4.56%)#7 | 32,739(0.58%)#34 |
| 8. | Lakewood | 135 | 4,144(3.26%)#8 | 32,739(0.41%)#58 |
| 9. | Graham | 130 | 4,144(3.14%)#9 | 32,739(0.40%)#61 |
| 10. | Fort Lewis | 94 | 4,144(2.27%)#10 | 32,739(0.29%)#86 |
| 11. | Tukwila | 89 | 4,144(2.15%)#11 | 32,739(0.27%)#94 |
| 12. | Issaquah | 81 | 4,144(1.95%)#12 | 32,739(0.25%)#99 |
| 13. | Seattle | 65 | 4,144(1.57%)#13 | 32,739(0.20%)#114 |
| 14. | Spokane Valley | 59 | 4,144(1.42%)#14 | 32,739(0.18%)#118 |
| 15. | Pacific | 58 | 4,144(1.40%)#15 | 32,739(0.18%)#122 |
| 16. | Mountlake Terrace | 40 | 4,144(0.97%)#16 | 32,739(0.12%)#146 |
| 17. | Five Corners | 32 | 4,144(0.77%)#17 | 32,739(0.10%)#168 |
| 18. | South Hill | 31 | 4,144(0.75%)#18 | 32,739(0.09%)#172 |
| 19. | Fife | 30 | 4,144(0.72%)#19 | 32,739(0.09%)#177 |
| 20. | Des Moines | 28 | 4,144(0.68%)#20 | 32,739(0.09%)#178 |
| 21. | Seatac | 26 | 4,144(0.63%)#21 | 32,739(0.08%)#186 |
| 22. | Olympia | 21 | 4,144(0.51%)#22 | 32,739(0.06%)#204 |
| 23. | Snohomish | 20 | 4,144(0.48%)#23 | 32,739(0.06%)#216 |
| 24. | Tacoma | 18 | 4,144(0.43%)#24 | 32,739(0.05%)#224 |
| 25. | Rock Island | 17 | 4,144(0.41%)#25 | 32,739(0.05%)#237 |
| 26. | Ellensburg | 13 | 4,144(0.31%)#26 | 32,739(0.04%)#260 |
| 27. | Pasco | 10 | 4,144(0.24%)#27 | 32,739(0.03%)#281 |
| 28. | Burien | 8 | 4,144(0.19%)#28 | 32,739(0.02%)#295 |
| 29. | Lynnwood | 5 | 4,144(0.12%)#29 | 32,739(0.02%)#319 |
| 30. | White Center | 4 | 4,144(0.10%)#30 | 32,739(0.01%)#329 |
| 31. | Mcchord Afb | 4 | 4,144(0.10%)#31 | 32,739(0.01%)#334 |
| 32. | Everett | 3 | 4,144(0.07%)#32 | 32,739(0.01%)#343 |
| 33. | Port Townsend | 2 | 4,144(0.05%)#33 | 32,739(0.01%)#358 |
| 34. | North Fort Lewis | 2 | 4,144(0.05%)#34 | 32,739(0.01%)#360 |
| 35. | Mill Creek East | 1 | 4,144(0.02%)#35 | 32,739(0.00%)#376 |
Common Questions
What are the Top 10 Cities with the Most Immigrants from Micronesia in Washington?
Top 10 Cities with the Most Immigrants from Micronesia in Washington are:
#1
1,362
#2
431
#3
390
#4
245
#5
217
#6
191
#7
189
#8
135
#9
130
#10
94
What city has the Most Immigrants from Micronesia in Washington?
Vancouver has the Most Immigrants from Micronesia in Washington with 1,362.
What is the Total Immigrants from Micronesia in the State of Washington?
Total Immigrants from Micronesia in Washington is 4,144.
What is the Total Immigrants from Micronesia in the United States?
Total Immigrants from Micronesia in the United States is 32,739.