Olympia, WA
Olympia Map
Olympia Overview
55,151
TOTAL POPULATION
27,195
MALE POPULATION
27,956
FEMALE POPULATION
97.28
MALES / 100 FEMALES
102.80
FEMALES / 100 MALES
38.7
MEDIAN AGE
2.9
AVG FAMILY SIZE
2.2
AVG HOUSEHOLD SIZE
$41,904
PER CAPITA INCOME
$95,617
AVG FAMILY INCOME
$73,851
AVG HOUSEHOLD INCOME
18.2%
WAGE / INCOME GAP [ % ]
81.8¢/ $1
WAGE / INCOME GAP [ $ ]
$12,582
FAMILY INCOME DEFICIT
0.44
INEQUALITY / GINI INDEX
28,671
LABOR FORCE [ PEOPLE ]
61.9%
PERCENT IN LABOR FORCE
6.9%
UNEMPLOYMENT RATE
Olympia Area Codes
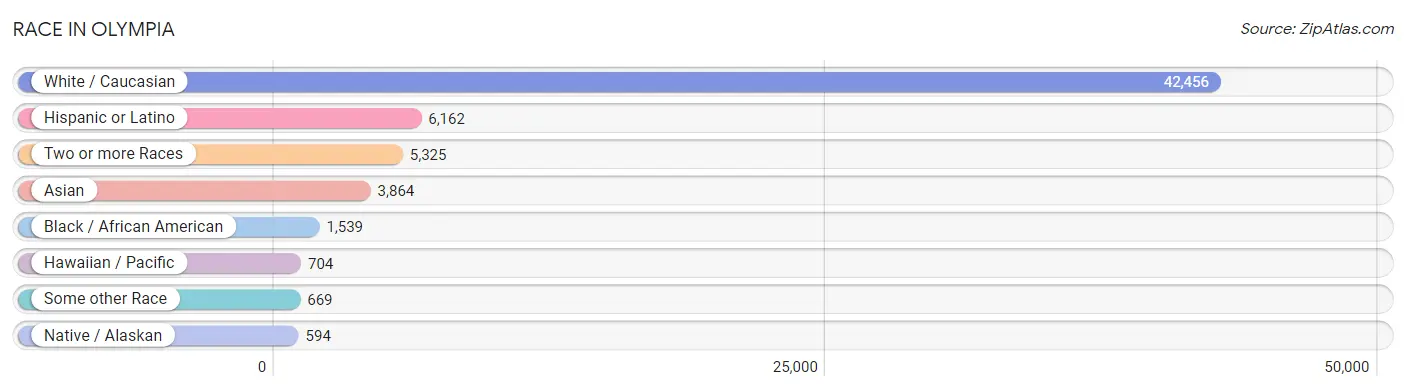
Race in Olympia
The most populous races in Olympia are White / Caucasian (42,456 | 77.0%), Hispanic or Latino (6,162 | 11.2%), and Two or more Races (5,325 | 9.7%).
| Race | # Population | % Population |
| Asian | 3,864 | 7.0% |
| Black / African American | 1,539 | 2.8% |
| Hawaiian / Pacific | 704 | 1.3% |
| Hispanic or Latino | 6,162 | 11.2% |
| Native / Alaskan | 594 | 1.1% |
| White / Caucasian | 42,456 | 77.0% |
| Two or more Races | 5,325 | 9.7% |
| Some other Race | 669 | 1.2% |
| Total | 55,151 | 100.0% |
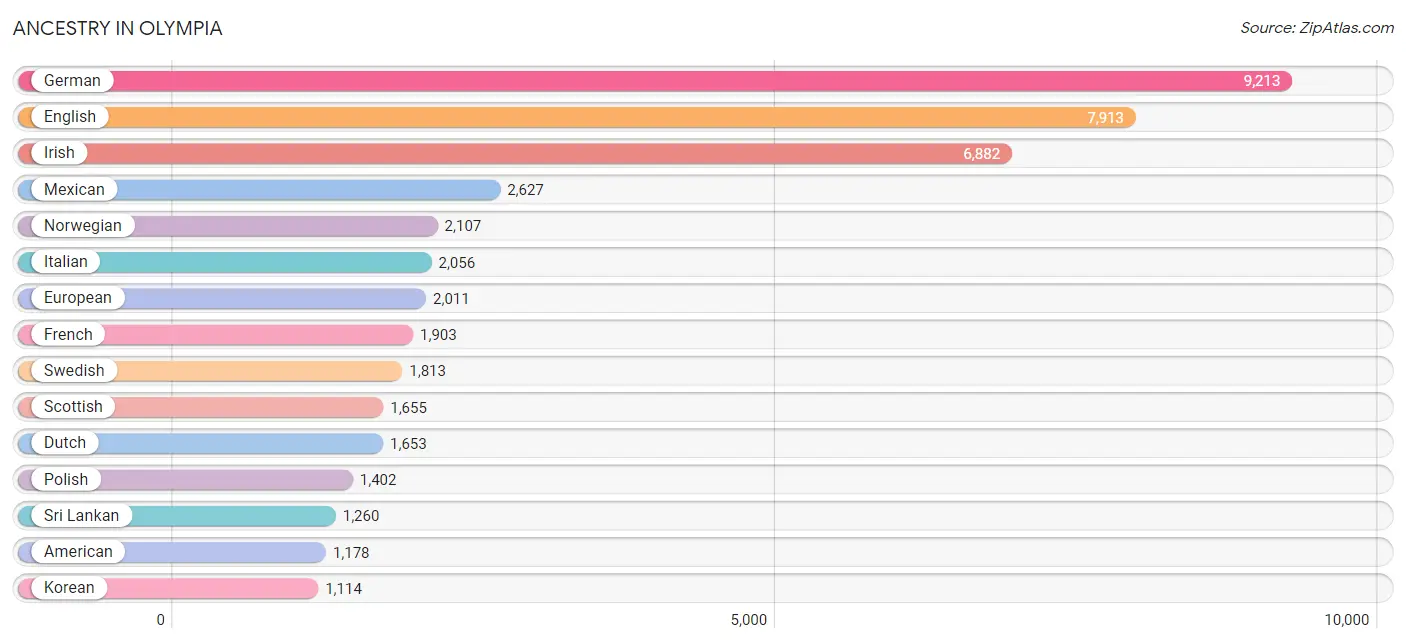
Ancestry in Olympia
The most populous ancestries reported in Olympia are German (9,213 | 16.7%), English (7,913 | 14.3%), Irish (6,882 | 12.5%), Mexican (2,627 | 4.8%), and Norwegian (2,107 | 3.8%), together accounting for 52.1% of all Olympia residents.
| Ancestry | # Population | % Population |
| Afghan | 130 | 0.2% |
| African | 396 | 0.7% |
| Alaskan Athabascan | 17 | 0.0% |
| Albanian | 16 | 0.0% |
| Aleut | 45 | 0.1% |
| Alsatian | 18 | 0.0% |
| American | 1,178 | 2.1% |
| Arab | 146 | 0.3% |
| Armenian | 45 | 0.1% |
| Austrian | 166 | 0.3% |
| Bangladeshi | 12 | 0.0% |
| Basque | 14 | 0.0% |
| Belgian | 58 | 0.1% |
| Bhutanese | 608 | 1.1% |
| Blackfeet | 10 | 0.0% |
| Brazilian | 16 | 0.0% |
| British | 957 | 1.7% |
| British West Indian | 163 | 0.3% |
| Bulgarian | 16 | 0.0% |
| Burmese | 847 | 1.5% |
| Cajun | 20 | 0.0% |
| Canadian | 104 | 0.2% |
| Celtic | 80 | 0.2% |
| Central American | 879 | 1.6% |
| Cherokee | 134 | 0.2% |
| Chilean | 142 | 0.3% |
| Choctaw | 14 | 0.0% |
| Colombian | 77 | 0.1% |
| Colville | 98 | 0.2% |
| Comanche | 13 | 0.0% |
| Croatian | 46 | 0.1% |
| Cuban | 157 | 0.3% |
| Czech | 163 | 0.3% |
| Czechoslovakian | 97 | 0.2% |
| Danish | 588 | 1.1% |
| Dominican | 140 | 0.3% |
| Dutch | 1,653 | 3.0% |
| Eastern European | 297 | 0.5% |
| Ecuadorian | 46 | 0.1% |
| English | 7,913 | 14.3% |
| Estonian | 19 | 0.0% |
| Ethiopian | 16 | 0.0% |
| European | 2,011 | 3.6% |
| Filipino | 10 | 0.0% |
| Finnish | 503 | 0.9% |
| French | 1,903 | 3.5% |
| French American Indian | 17 | 0.0% |
| French Canadian | 196 | 0.4% |
| German | 9,213 | 16.7% |
| Greek | 306 | 0.5% |
| Guamanian / Chamorro | 514 | 0.9% |
| Guatemalan | 258 | 0.5% |
| Haitian | 164 | 0.3% |
| Honduran | 299 | 0.5% |
| Hungarian | 84 | 0.2% |
| Icelander | 33 | 0.1% |
| Indian (Asian) | 826 | 1.5% |
| Iranian | 18 | 0.0% |
| Irish | 6,882 | 12.5% |
| Iroquois | 30 | 0.1% |
| Israeli | 6 | 0.0% |
| Italian | 2,056 | 3.7% |
| Japanese | 68 | 0.1% |
| Kenyan | 37 | 0.1% |
| Korean | 1,114 | 2.0% |
| Laotian | 73 | 0.1% |
| Latvian | 44 | 0.1% |
| Lebanese | 46 | 0.1% |
| Liberian | 9 | 0.0% |
| Lithuanian | 58 | 0.1% |
| Lumbee | 51 | 0.1% |
| Luxembourger | 61 | 0.1% |
| Malaysian | 38 | 0.1% |
| Mexican | 2,627 | 4.8% |
| Mexican American Indian | 144 | 0.3% |
| Moroccan | 9 | 0.0% |
| Native Hawaiian | 153 | 0.3% |
| Nicaraguan | 42 | 0.1% |
| Nigerian | 74 | 0.1% |
| Northern European | 289 | 0.5% |
| Norwegian | 2,107 | 3.8% |
| Pakistani | 21 | 0.0% |
| Panamanian | 270 | 0.5% |
| Pennsylvania German | 31 | 0.1% |
| Peruvian | 196 | 0.4% |
| Polish | 1,402 | 2.5% |
| Portuguese | 144 | 0.3% |
| Puerto Rican | 1,018 | 1.8% |
| Puget Sound Salish | 121 | 0.2% |
| Romanian | 212 | 0.4% |
| Russian | 350 | 0.6% |
| Salvadoran | 10 | 0.0% |
| Samoan | 143 | 0.3% |
| Scandinavian | 1,012 | 1.8% |
| Scotch-Irish | 910 | 1.7% |
| Scottish | 1,655 | 3.0% |
| Serbian | 34 | 0.1% |
| Sioux | 128 | 0.2% |
| Slavic | 32 | 0.1% |
| Slovak | 119 | 0.2% |
| Slovene | 60 | 0.1% |
| South American | 461 | 0.8% |
| Spaniard | 341 | 0.6% |
| Spanish | 278 | 0.5% |
| Sri Lankan | 1,260 | 2.3% |
| Subsaharan African | 580 | 1.1% |
| Sudanese | 24 | 0.0% |
| Swedish | 1,813 | 3.3% |
| Swiss | 214 | 0.4% |
| Thai | 720 | 1.3% |
| Tlingit-Haida | 20 | 0.0% |
| Trinidadian and Tobagonian | 56 | 0.1% |
| Tsimshian | 10 | 0.0% |
| Turkish | 148 | 0.3% |
| Ukrainian | 368 | 0.7% |
| Welsh | 486 | 0.9% |
| West Indian | 27 | 0.1% |
| Yakama | 31 | 0.1% |
| Yaqui | 21 | 0.0% |
| Yup'ik | 13 | 0.0% | View All 120 Rows |
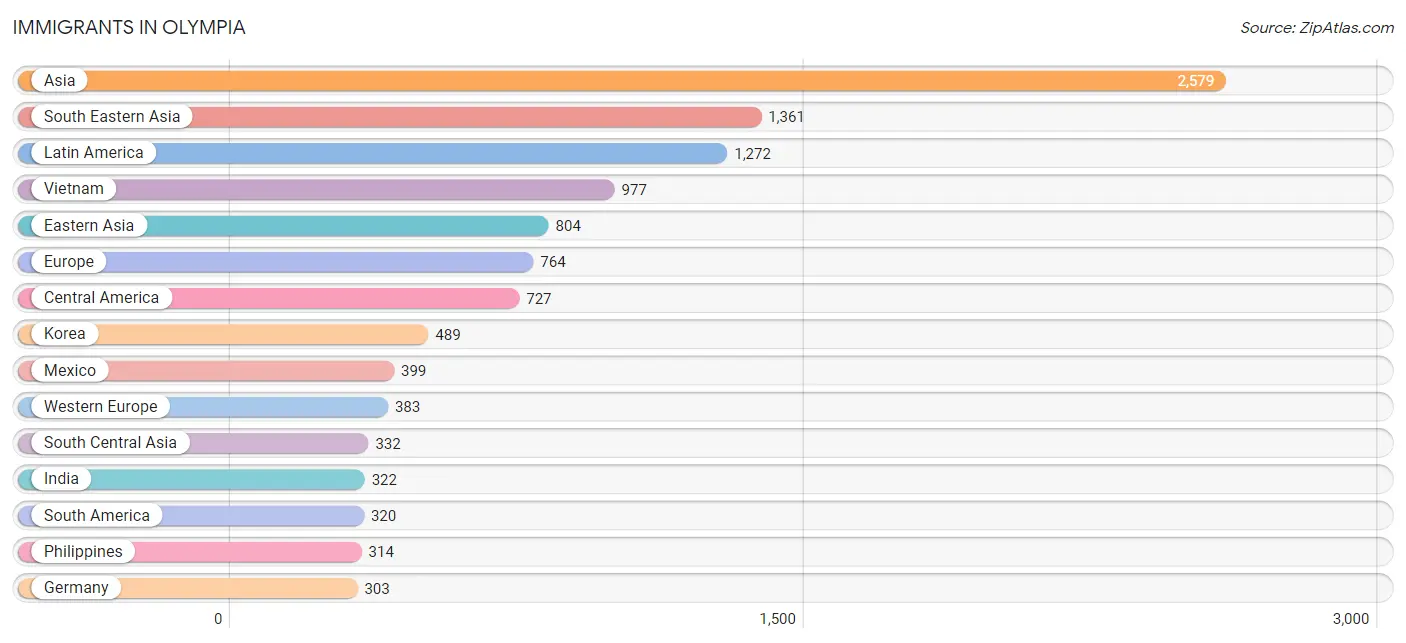
Immigrants in Olympia
The most numerous immigrant groups reported in Olympia came from Asia (2,579 | 4.7%), South Eastern Asia (1,361 | 2.5%), Latin America (1,272 | 2.3%), Vietnam (977 | 1.8%), and Eastern Asia (804 | 1.5%), together accounting for 12.7% of all Olympia residents.
| Immigration Origin | # Population | % Population |
| Afghanistan | 10 | 0.0% |
| Africa | 90 | 0.2% |
| Asia | 2,579 | 4.7% |
| Australia | 13 | 0.0% |
| Austria | 19 | 0.0% |
| Belgium | 9 | 0.0% |
| Canada | 135 | 0.2% |
| Caribbean | 225 | 0.4% |
| Central America | 727 | 1.3% |
| Chile | 41 | 0.1% |
| China | 257 | 0.5% |
| Colombia | 49 | 0.1% |
| Cuba | 57 | 0.1% |
| Czechoslovakia | 31 | 0.1% |
| Eastern Africa | 53 | 0.1% |
| Eastern Asia | 804 | 1.5% |
| Eastern Europe | 162 | 0.3% |
| Ecuador | 24 | 0.0% |
| Egypt | 6 | 0.0% |
| El Salvador | 10 | 0.0% |
| England | 91 | 0.2% |
| Ethiopia | 16 | 0.0% |
| Europe | 764 | 1.4% |
| Fiji | 1 | 0.0% |
| France | 22 | 0.0% |
| Germany | 303 | 0.5% |
| Grenada | 28 | 0.1% |
| Guatemala | 12 | 0.0% |
| Guyana | 10 | 0.0% |
| Haiti | 122 | 0.2% |
| Honduras | 145 | 0.3% |
| India | 322 | 0.6% |
| Indonesia | 18 | 0.0% |
| Iraq | 41 | 0.1% |
| Italy | 29 | 0.1% |
| Jamaica | 18 | 0.0% |
| Japan | 58 | 0.1% |
| Kenya | 37 | 0.1% |
| Korea | 489 | 0.9% |
| Laos | 22 | 0.0% |
| Latin America | 1,272 | 2.3% |
| Mexico | 399 | 0.7% |
| Micronesia | 21 | 0.0% |
| Netherlands | 30 | 0.1% |
| Nigeria | 7 | 0.0% |
| Northern Africa | 30 | 0.1% |
| Northern Europe | 190 | 0.3% |
| Oceania | 109 | 0.2% |
| Panama | 161 | 0.3% |
| Peru | 196 | 0.4% |
| Philippines | 314 | 0.6% |
| Poland | 37 | 0.1% |
| Romania | 33 | 0.1% |
| Russia | 53 | 0.1% |
| Saudi Arabia | 7 | 0.0% |
| Scotland | 47 | 0.1% |
| South America | 320 | 0.6% |
| South Central Asia | 332 | 0.6% |
| South Eastern Asia | 1,361 | 2.5% |
| Southern Europe | 29 | 0.1% |
| Sudan | 24 | 0.0% |
| Taiwan | 68 | 0.1% |
| Thailand | 30 | 0.1% |
| Turkey | 34 | 0.1% |
| Ukraine | 8 | 0.0% |
| Vietnam | 977 | 1.8% |
| Western Africa | 7 | 0.0% |
| Western Asia | 82 | 0.2% |
| Western Europe | 383 | 0.7% | View All 69 Rows |
Sex and Age in Olympia
Sex and Age in Olympia
The most populous age groups in Olympia are 25 to 29 Years (2,598 | 9.6%) for men and 40 to 44 Years (2,393 | 8.6%) for women.
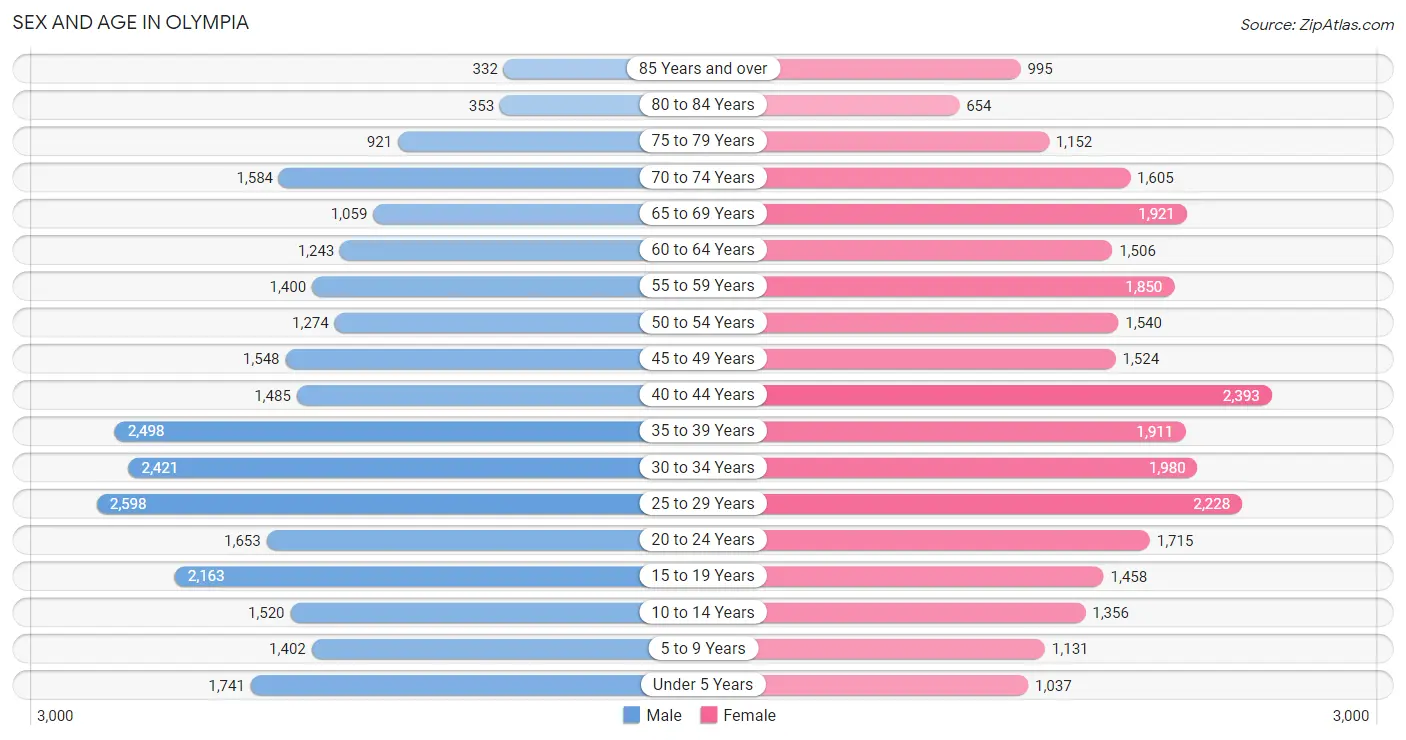
| Age Bracket | Male | Female |
| Under 5 Years | 1,741 (6.4%) | 1,037 (3.7%) |
| 5 to 9 Years | 1,402 (5.2%) | 1,131 (4.1%) |
| 10 to 14 Years | 1,520 (5.6%) | 1,356 (4.9%) |
| 15 to 19 Years | 2,163 (8.0%) | 1,458 (5.2%) |
| 20 to 24 Years | 1,653 (6.1%) | 1,715 (6.1%) |
| 25 to 29 Years | 2,598 (9.6%) | 2,228 (8.0%) |
| 30 to 34 Years | 2,421 (8.9%) | 1,980 (7.1%) |
| 35 to 39 Years | 2,498 (9.2%) | 1,911 (6.8%) |
| 40 to 44 Years | 1,485 (5.5%) | 2,393 (8.6%) |
| 45 to 49 Years | 1,548 (5.7%) | 1,524 (5.4%) |
| 50 to 54 Years | 1,274 (4.7%) | 1,540 (5.5%) |
| 55 to 59 Years | 1,400 (5.1%) | 1,850 (6.6%) |
| 60 to 64 Years | 1,243 (4.6%) | 1,506 (5.4%) |
| 65 to 69 Years | 1,059 (3.9%) | 1,921 (6.9%) |
| 70 to 74 Years | 1,584 (5.8%) | 1,605 (5.7%) |
| 75 to 79 Years | 921 (3.4%) | 1,152 (4.1%) |
| 80 to 84 Years | 353 (1.3%) | 654 (2.3%) |
| 85 Years and over | 332 (1.2%) | 995 (3.6%) |
| Total | 27,195 (100.0%) | 27,956 (100.0%) |
Families and Households in Olympia
Median Family Size in Olympia
The median family size in Olympia is 2.87 persons per family, with married-couple families (8,983 | 70.5%) accounting for the largest median family size of 2.94 persons per family. On the other hand, single male/father families (1,108 | 8.7%) represent the smallest median family size with 2.52 persons per family.
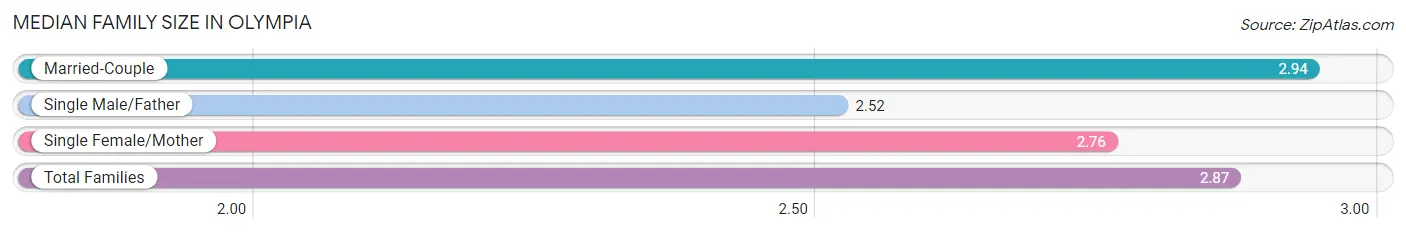
| Family Type | # Families | Family Size |
| Married-Couple | 8,983 (70.5%) | 2.94 |
| Single Male/Father | 1,108 (8.7%) | 2.52 |
| Single Female/Mother | 2,644 (20.8%) | 2.76 |
| Total Families | 12,735 (100.0%) | 2.87 |
Median Household Size in Olympia
The median household size in Olympia is 2.21 persons per household, with single male/father households (1,108 | 4.5%) accounting for the largest median household size of 3.05 persons per household. non-family households (11,832 | 48.2%) represent the smallest median household size with 1.35 persons per household.
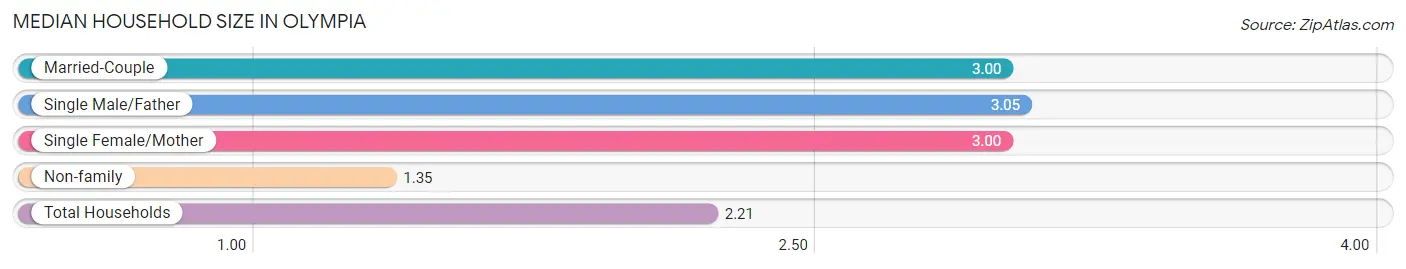
| Household Type | # Households | Household Size |
| Married-Couple | 8,983 (36.6%) | 3.00 |
| Single Male/Father | 1,108 (4.5%) | 3.05 |
| Single Female/Mother | 2,644 (10.8%) | 3.00 |
| Non-family | 11,832 (48.2%) | 1.35 |
| Total Households | 24,567 (100.0%) | 2.21 |
Household Size by Marriage Status in Olympia
Out of a total of 24,567 households in Olympia, 12,735 (51.8%) are family households, while 11,832 (48.2%) are nonfamily households. The most numerous type of family households are 2-person households, comprising 6,075, and the most common type of nonfamily households are 1-person households, comprising 8,625.
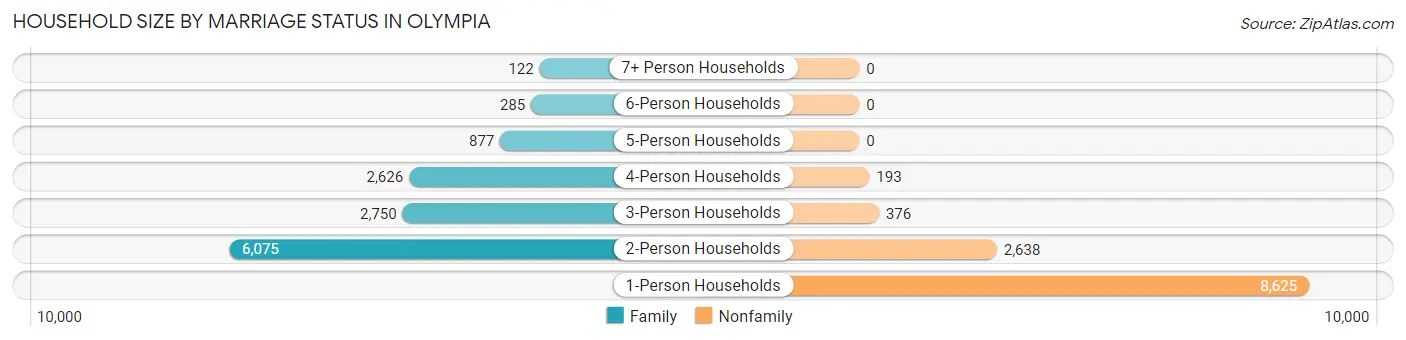
| Household Size | Family Households | Nonfamily Households |
| 1-Person Households | - | 8,625 (35.1%) |
| 2-Person Households | 6,075 (24.7%) | 2,638 (10.7%) |
| 3-Person Households | 2,750 (11.2%) | 376 (1.5%) |
| 4-Person Households | 2,626 (10.7%) | 193 (0.8%) |
| 5-Person Households | 877 (3.6%) | 0 (0.0%) |
| 6-Person Households | 285 (1.2%) | 0 (0.0%) |
| 7+ Person Households | 122 (0.5%) | 0 (0.0%) |
| Total | 12,735 (51.8%) | 11,832 (48.2%) |
Female Fertility in Olympia
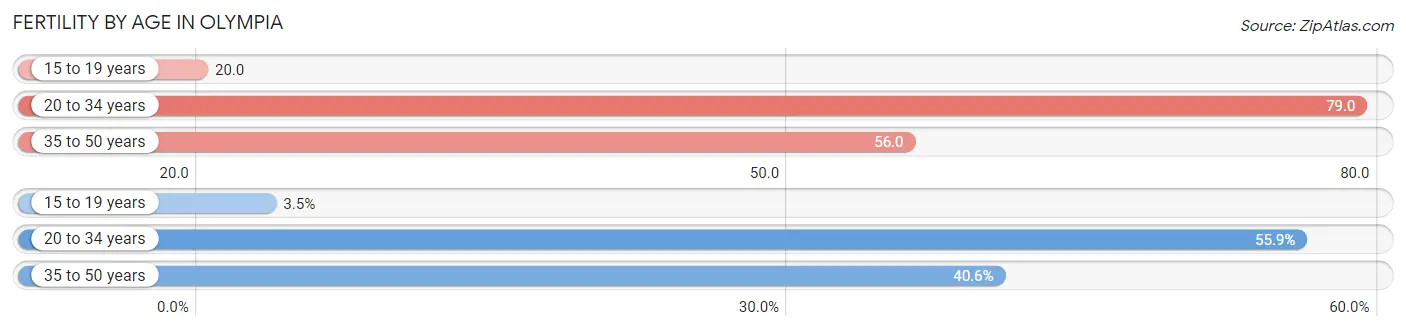
Fertility by Age in Olympia
Average fertility rate in Olympia is 62.0 births per 1,000 women. Women in the age bracket of 20 to 34 years have the highest fertility rate with 79.0 births per 1,000 women. Women in the age bracket of 20 to 34 years acount for 55.9% of all women with births.
| Age Bracket | Women with Births | Births / 1,000 Women |
| 15 to 19 years | 29 (3.5%) | 20.0 |
| 20 to 34 years | 466 (55.9%) | 79.0 |
| 35 to 50 years | 338 (40.6%) | 56.0 |
| Total | 833 (100.0%) | 62.0 |
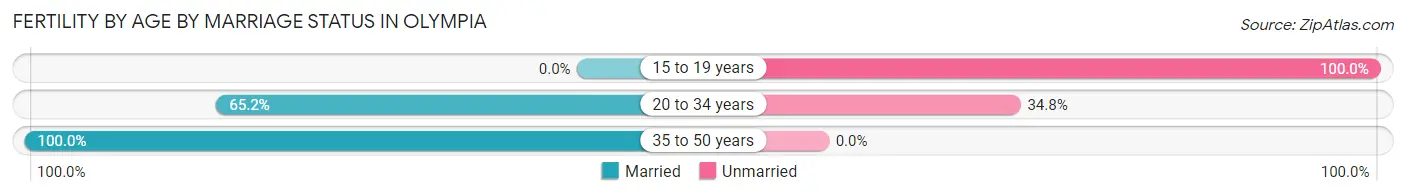
Fertility by Age by Marriage Status in Olympia
77.1% of women with births (833) in Olympia are married. The highest percentage of unmarried women with births falls into 15 to 19 years age bracket with 100.0% of them unmarried at the time of birth, while the lowest percentage of unmarried women with births belong to 35 to 50 years age bracket with 0.0% of them unmarried.
| Age Bracket | Married | Unmarried |
| 15 to 19 years | 0 (0.0%) | 29 (100.0%) |
| 20 to 34 years | 304 (65.2%) | 162 (34.8%) |
| 35 to 50 years | 338 (100.0%) | 0 (0.0%) |
| Total | 642 (77.1%) | 191 (22.9%) |
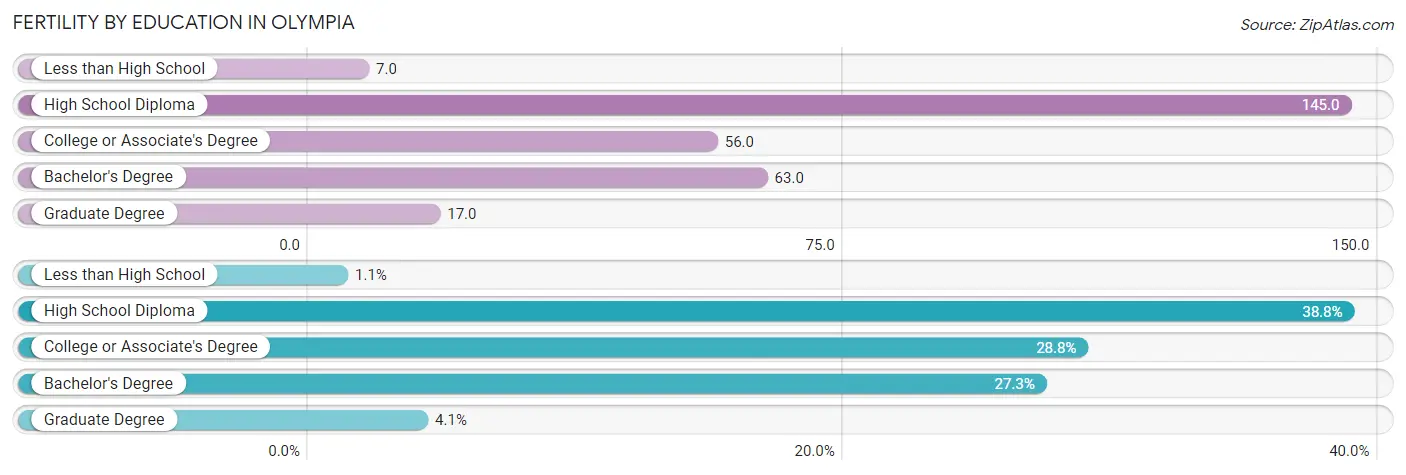
Fertility by Education in Olympia
Average fertility rate in Olympia is 62.0 births per 1,000 women. Women with the education attainment of high school diploma have the highest fertility rate of 145.0 births per 1,000 women, while women with the education attainment of less than high school have the lowest fertility at 7.0 births per 1,000 women. Women with the education attainment of high school diploma represent 38.8% of all women with births.
| Educational Attainment | Women with Births | Births / 1,000 Women |
| Less than High School | 9 (1.1%) | 7.0 |
| High School Diploma | 323 (38.8%) | 145.0 |
| College or Associate's Degree | 240 (28.8%) | 56.0 |
| Bachelor's Degree | 227 (27.3%) | 63.0 |
| Graduate Degree | 34 (4.1%) | 17.0 |
| Total | 833 (100.0%) | 62.0 |
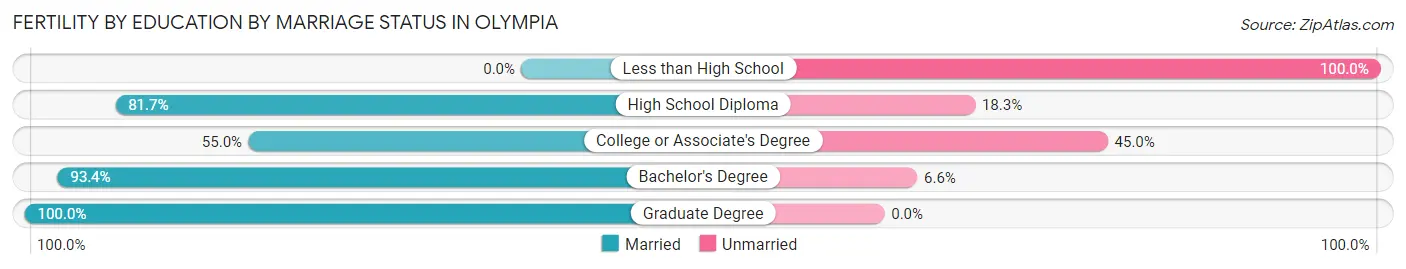
Fertility by Education by Marriage Status in Olympia
22.9% of women with births in Olympia are unmarried. Women with the educational attainment of graduate degree are most likely to be married with 100.0% of them married at childbirth, while women with the educational attainment of less than high school are least likely to be married with 100.0% of them unmarried at childbirth.
| Educational Attainment | Married | Unmarried |
| Less than High School | 0 (0.0%) | 9 (100.0%) |
| High School Diploma | 264 (81.7%) | 59 (18.3%) |
| College or Associate's Degree | 132 (55.0%) | 108 (45.0%) |
| Bachelor's Degree | 212 (93.4%) | 15 (6.6%) |
| Graduate Degree | 34 (100.0%) | 0 (0.0%) |
| Total | 642 (77.1%) | 191 (22.9%) |
Income in Olympia
Income Overview in Olympia
Per Capita Income in Olympia is $41,904, while median incomes of families and households are $95,617 and $73,851 respectively.
| Characteristic | Number | Measure |
| Per Capita Income | 55,151 | $41,904 |
| Median Family Income | 12,735 | $95,617 |
| Mean Family Income | 12,735 | $115,799 |
| Median Household Income | 24,567 | $73,851 |
| Mean Household Income | 24,567 | $92,649 |
| Income Deficit | 12,735 | $12,582 |
| Wage / Income Gap (%) | 55,151 | 18.21% |
| Wage / Income Gap ($) | 55,151 | 81.79¢ per $1 |
| Gini / Inequality Index | 55,151 | 0.44 |
Earnings by Sex in Olympia
Average Earnings in Olympia are $44,289, $50,111 for men and $40,986 for women, a difference of 18.2%.
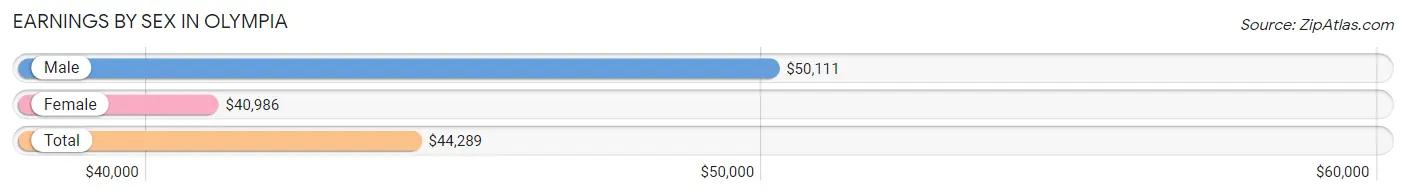
| Sex | Number | Average Earnings |
| Male | 15,333 (51.6%) | $50,111 |
| Female | 14,359 (48.4%) | $40,986 |
| Total | 29,692 (100.0%) | $44,289 |
Earnings by Sex by Income Bracket in Olympia
The most common earnings brackets in Olympia are $100,000+ for men (2,984 | 19.5%) and $100,000+ for women (1,764 | 12.3%).
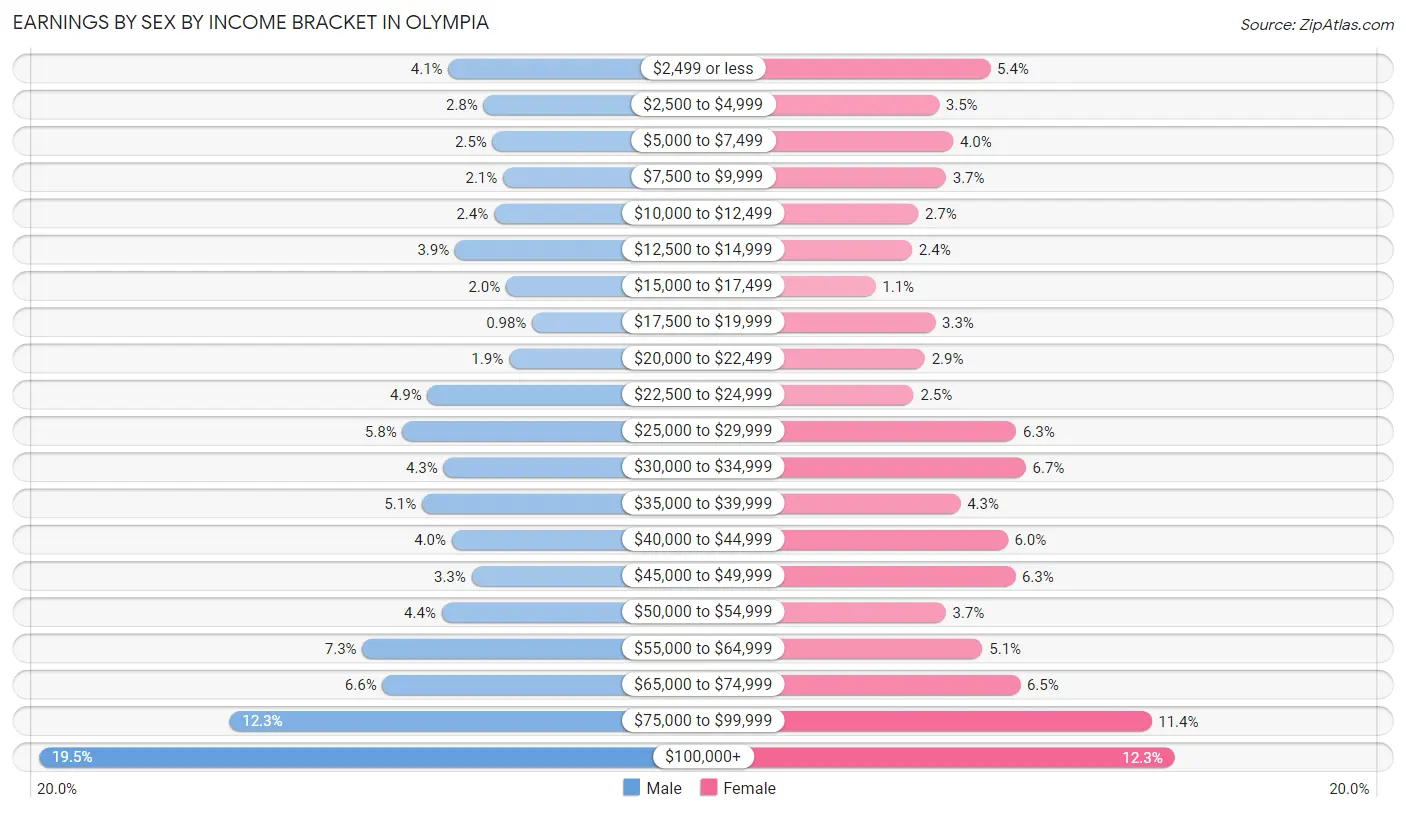
| Income | Male | Female |
| $2,499 or less | 631 (4.1%) | 771 (5.4%) |
| $2,500 to $4,999 | 430 (2.8%) | 495 (3.5%) |
| $5,000 to $7,499 | 377 (2.5%) | 572 (4.0%) |
| $7,500 to $9,999 | 317 (2.1%) | 533 (3.7%) |
| $10,000 to $12,499 | 369 (2.4%) | 383 (2.7%) |
| $12,500 to $14,999 | 593 (3.9%) | 351 (2.4%) |
| $15,000 to $17,499 | 301 (2.0%) | 154 (1.1%) |
| $17,500 to $19,999 | 151 (1.0%) | 475 (3.3%) |
| $20,000 to $22,499 | 283 (1.8%) | 420 (2.9%) |
| $22,500 to $24,999 | 751 (4.9%) | 359 (2.5%) |
| $25,000 to $29,999 | 895 (5.8%) | 910 (6.3%) |
| $30,000 to $34,999 | 659 (4.3%) | 962 (6.7%) |
| $35,000 to $39,999 | 783 (5.1%) | 610 (4.3%) |
| $40,000 to $44,999 | 612 (4.0%) | 864 (6.0%) |
| $45,000 to $49,999 | 499 (3.3%) | 905 (6.3%) |
| $50,000 to $54,999 | 670 (4.4%) | 531 (3.7%) |
| $55,000 to $64,999 | 1,126 (7.3%) | 729 (5.1%) |
| $65,000 to $74,999 | 1,011 (6.6%) | 932 (6.5%) |
| $75,000 to $99,999 | 1,891 (12.3%) | 1,639 (11.4%) |
| $100,000+ | 2,984 (19.5%) | 1,764 (12.3%) |
| Total | 15,333 (100.0%) | 14,359 (100.0%) |
Earnings by Sex by Educational Attainment in Olympia
Average earnings in Olympia are $59,134 for men and $45,910 for women, a difference of 22.4%. Men with an educational attainment of graduate degree enjoy the highest average annual earnings of $95,833, while those with less than high school education earn the least with $40,539. Women with an educational attainment of graduate degree earn the most with the average annual earnings of $73,084, while those with less than high school education have the smallest earnings of $30,792.
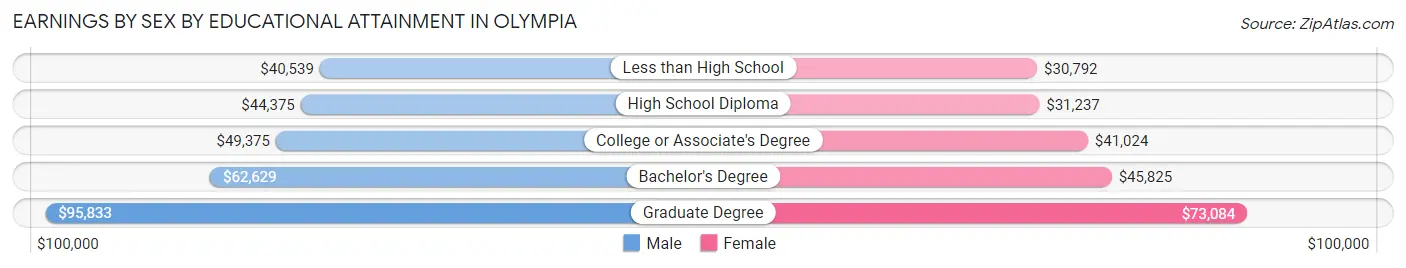
| Educational Attainment | Male Income | Female Income |
| Less than High School | $40,539 | $30,792 |
| High School Diploma | $44,375 | $31,237 |
| College or Associate's Degree | $49,375 | $41,024 |
| Bachelor's Degree | $62,629 | $45,825 |
| Graduate Degree | $95,833 | $73,084 |
| Total | $59,134 | $45,910 |
Family Income in Olympia
Family Income Brackets in Olympia
According to the Olympia family income data, there are 3,120 families falling into the $100,000 to $149,999 income range, which is the most common income bracket and makes up 24.5% of all families. Conversely, the $10,000 to $14,999 income bracket is the least frequent group with only 229 families (1.8%) belonging to this category.
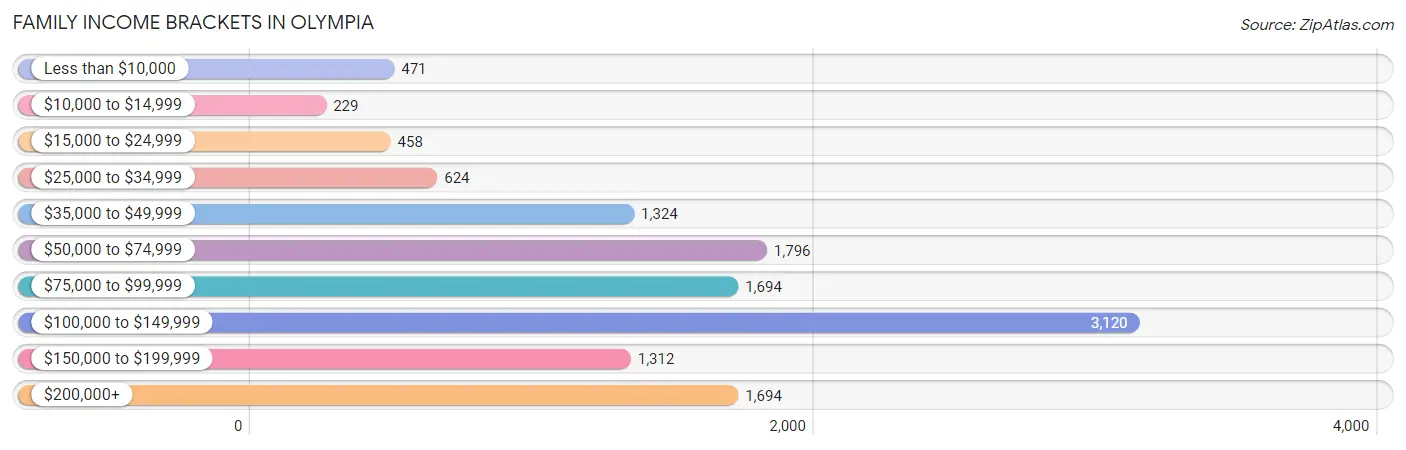
| Income Bracket | # Families | % Families |
| Less than $10,000 | 471 | 3.7% |
| $10,000 to $14,999 | 229 | 1.8% |
| $15,000 to $24,999 | 458 | 3.6% |
| $25,000 to $34,999 | 624 | 4.9% |
| $35,000 to $49,999 | 1,324 | 10.4% |
| $50,000 to $74,999 | 1,796 | 14.1% |
| $75,000 to $99,999 | 1,694 | 13.3% |
| $100,000 to $149,999 | 3,120 | 24.5% |
| $150,000 to $199,999 | 1,312 | 10.3% |
| $200,000+ | 1,694 | 13.3% |
Family Income by Famaliy Size in Olympia
5-person families (719 | 5.7%) account for the highest median family income in Olympia with $114,112 per family, while 2-person families (6,825 | 53.6%) have the highest median income of $43,266 per family member.
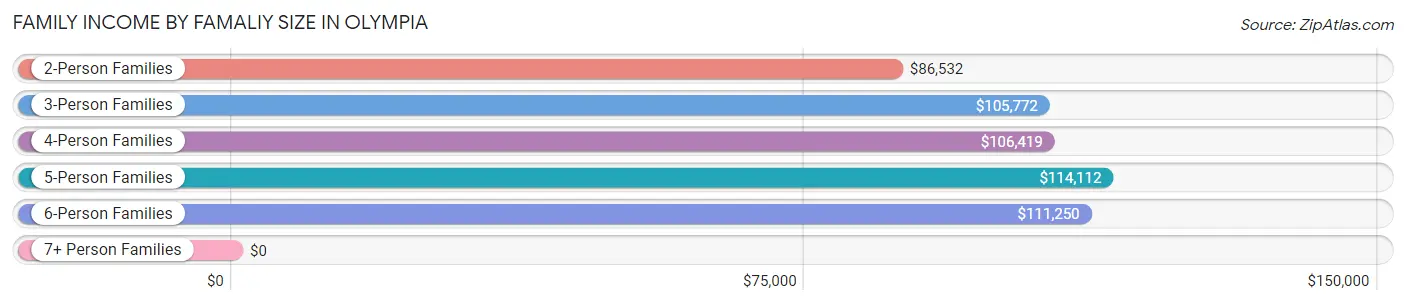
| Income Bracket | # Families | Median Income |
| 2-Person Families | 6,825 (53.6%) | $86,532 |
| 3-Person Families | 2,480 (19.5%) | $105,772 |
| 4-Person Families | 2,381 (18.7%) | $106,419 |
| 5-Person Families | 719 (5.7%) | $114,112 |
| 6-Person Families | 234 (1.8%) | $111,250 |
| 7+ Person Families | 96 (0.7%) | $0 |
| Total | 12,735 (100.0%) | $95,617 |
Family Income by Number of Earners in Olympia
The median family income in Olympia is $95,617, with families comprising 3+ earners (995) having the highest median family income of $143,134, while families with no earners (2,647) have the lowest median family income of $63,718, accounting for 7.8% and 20.8% of families, respectively.
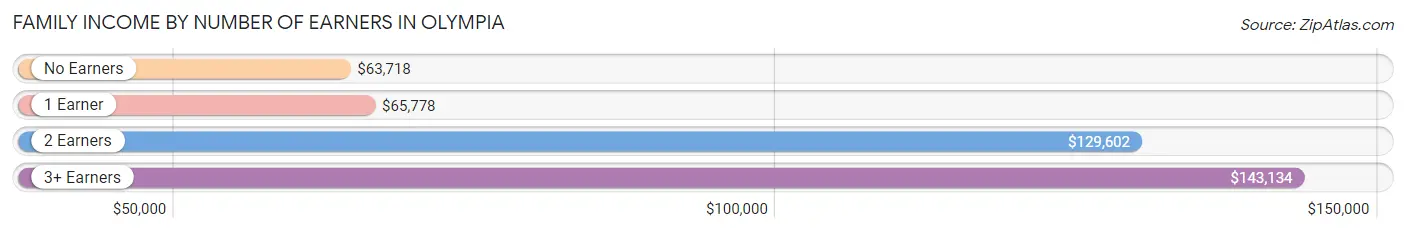
| Number of Earners | # Families | Median Income |
| No Earners | 2,647 (20.8%) | $63,718 |
| 1 Earner | 4,348 (34.1%) | $65,778 |
| 2 Earners | 4,745 (37.3%) | $129,602 |
| 3+ Earners | 995 (7.8%) | $143,134 |
| Total | 12,735 (100.0%) | $95,617 |
Household Income in Olympia
Household Income Brackets in Olympia
With 4,717 households falling in the category, the $100,000 to $149,999 income range is the most frequent in Olympia, accounting for 19.2% of all households. In contrast, only 860 households (3.5%) fall into the $10,000 to $14,999 income bracket, making it the least populous group.
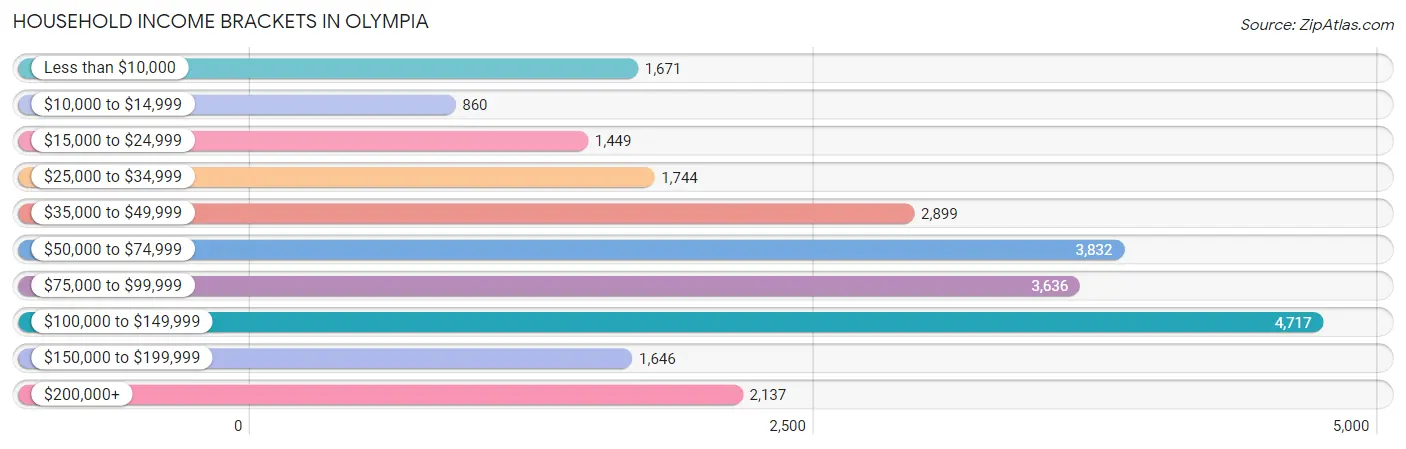
| Income Bracket | # Households | % Households |
| Less than $10,000 | 1,671 | 6.8% |
| $10,000 to $14,999 | 860 | 3.5% |
| $15,000 to $24,999 | 1,449 | 5.9% |
| $25,000 to $34,999 | 1,744 | 7.1% |
| $35,000 to $49,999 | 2,899 | 11.8% |
| $50,000 to $74,999 | 3,832 | 15.6% |
| $75,000 to $99,999 | 3,636 | 14.8% |
| $100,000 to $149,999 | 4,717 | 19.2% |
| $150,000 to $199,999 | 1,646 | 6.7% |
| $200,000+ | 2,137 | 8.7% |
Household Income by Householder Age in Olympia
The median household income in Olympia is $73,851, with the highest median household income of $91,654 found in the 45 to 64 years age bracket for the primary householder. A total of 7,204 households (29.3%) fall into this category. Meanwhile, the 15 to 24 years age bracket for the primary householder has the lowest median household income of $38,411, with 1,237 households (5.0%) in this group.
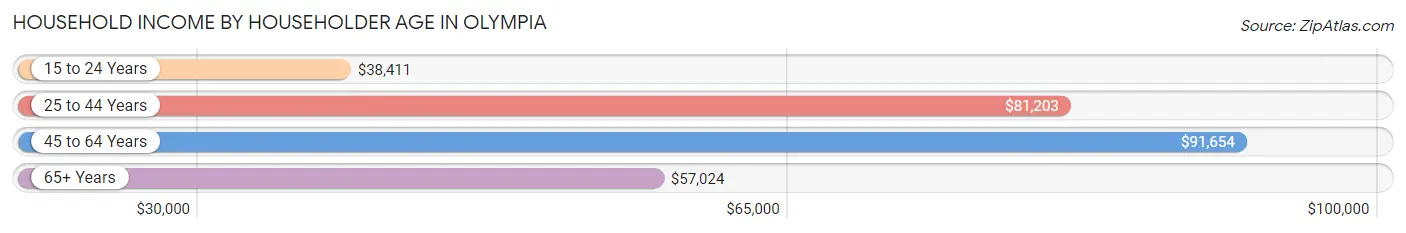
| Income Bracket | # Households | Median Income |
| 15 to 24 Years | 1,237 (5.0%) | $38,411 |
| 25 to 44 Years | 9,210 (37.5%) | $81,203 |
| 45 to 64 Years | 7,204 (29.3%) | $91,654 |
| 65+ Years | 6,916 (28.1%) | $57,024 |
| Total | 24,567 (100.0%) | $73,851 |
Poverty in Olympia
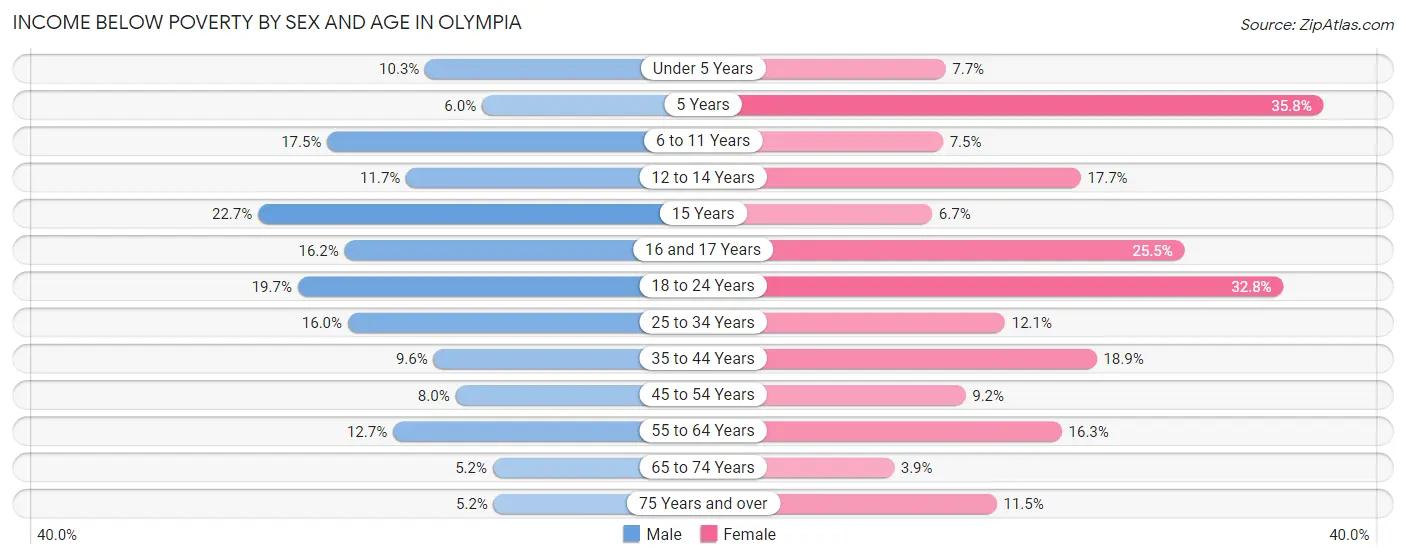
Income Below Poverty by Sex and Age in Olympia
With 12.2% poverty level for males and 14.3% for females among the residents of Olympia, 15 year old males and 5 year old females are the most vulnerable to poverty, with 78 males (22.7%) and 123 females (35.8%) in their respective age groups living below the poverty level.
| Age Bracket | Male | Female |
| Under 5 Years | 178 (10.3%) | 77 (7.7%) |
| 5 Years | 9 (6.0%) | 123 (35.8%) |
| 6 to 11 Years | 318 (17.5%) | 92 (7.5%) |
| 12 to 14 Years | 107 (11.7%) | 149 (17.7%) |
| 15 Years | 78 (22.7%) | 20 (6.7%) |
| 16 and 17 Years | 195 (16.2%) | 126 (25.5%) |
| 18 to 24 Years | 447 (19.7%) | 780 (32.8%) |
| 25 to 34 Years | 797 (16.0%) | 509 (12.1%) |
| 35 to 44 Years | 381 (9.6%) | 814 (18.9%) |
| 45 to 54 Years | 225 (8.0%) | 280 (9.2%) |
| 55 to 64 Years | 334 (12.7%) | 542 (16.3%) |
| 65 to 74 Years | 138 (5.2%) | 133 (3.9%) |
| 75 Years and over | 76 (5.2%) | 300 (11.5%) |
| Total | 3,283 (12.2%) | 3,945 (14.3%) |
Income Above Poverty by Sex and Age in Olympia
According to the poverty statistics in Olympia, males aged 75 years and over and females aged 65 to 74 years are the age groups that are most secure financially, with 94.8% of males and 96.1% of females in these age groups living above the poverty line.
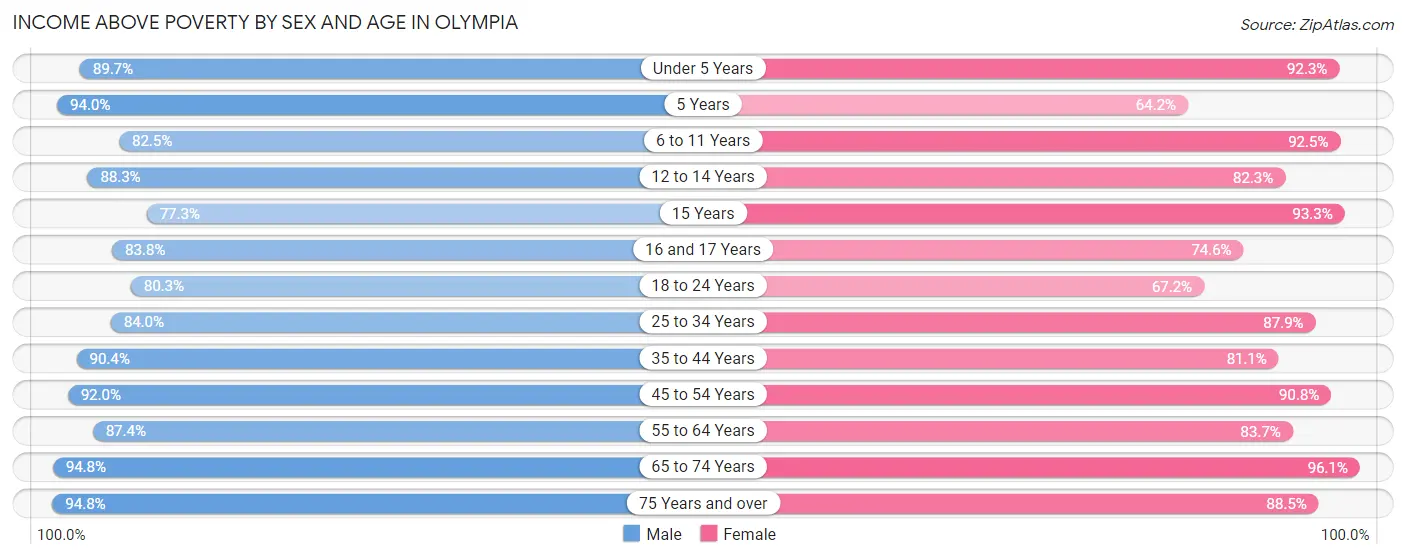
| Age Bracket | Male | Female |
| Under 5 Years | 1,557 (89.7%) | 924 (92.3%) |
| 5 Years | 140 (94.0%) | 221 (64.2%) |
| 6 to 11 Years | 1,496 (82.5%) | 1,136 (92.5%) |
| 12 to 14 Years | 810 (88.3%) | 692 (82.3%) |
| 15 Years | 266 (77.3%) | 279 (93.3%) |
| 16 and 17 Years | 1,006 (83.8%) | 369 (74.6%) |
| 18 to 24 Years | 1,820 (80.3%) | 1,599 (67.2%) |
| 25 to 34 Years | 4,185 (84.0%) | 3,699 (87.9%) |
| 35 to 44 Years | 3,571 (90.4%) | 3,490 (81.1%) |
| 45 to 54 Years | 2,584 (92.0%) | 2,773 (90.8%) |
| 55 to 64 Years | 2,306 (87.4%) | 2,779 (83.7%) |
| 65 to 74 Years | 2,496 (94.8%) | 3,314 (96.1%) |
| 75 Years and over | 1,395 (94.8%) | 2,311 (88.5%) |
| Total | 23,632 (87.8%) | 23,586 (85.7%) |
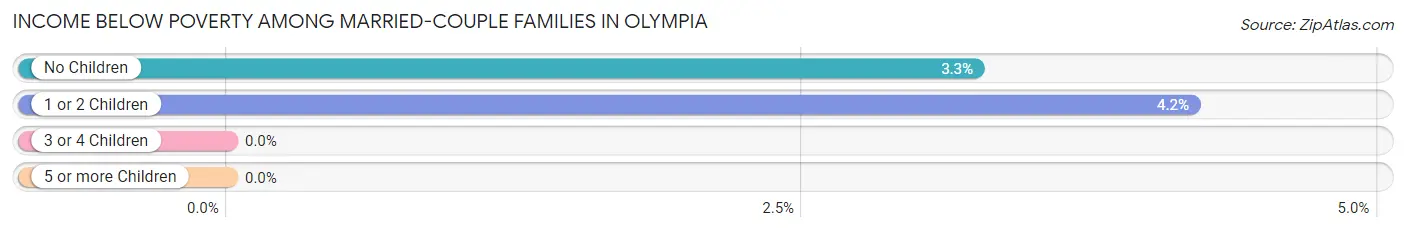
Income Below Poverty Among Married-Couple Families in Olympia
The poverty statistics for married-couple families in Olympia show that 3.4% or 306 of the total 8,983 families live below the poverty line. Families with 1 or 2 children have the highest poverty rate of 4.2%, comprising of 134 families. On the other hand, families with 3 or 4 children have the lowest poverty rate of 0.0%, which includes 0 families.
| Children | Above Poverty | Below Poverty |
| No Children | 5,120 (96.8%) | 172 (3.3%) |
| 1 or 2 Children | 3,061 (95.8%) | 134 (4.2%) |
| 3 or 4 Children | 470 (100.0%) | 0 (0.0%) |
| 5 or more Children | 26 (100.0%) | 0 (0.0%) |
| Total | 8,677 (96.6%) | 306 (3.4%) |
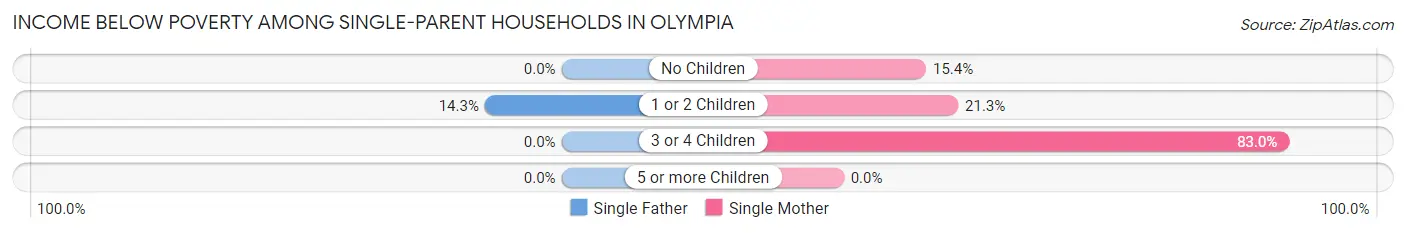
Income Below Poverty Among Single-Parent Households in Olympia
According to the poverty data in Olympia, 8.4% or 93 single-father households and 24.5% or 648 single-mother households are living below the poverty line. Among single-father households, those with 1 or 2 children have the highest poverty rate, with 93 households (14.3%) experiencing poverty. Likewise, among single-mother households, those with 3 or 4 children have the highest poverty rate, with 195 households (83.0%) falling below the poverty line.
| Children | Single Father | Single Mother |
| No Children | 0 (0.0%) | 136 (15.3%) |
| 1 or 2 Children | 93 (14.3%) | 317 (21.3%) |
| 3 or 4 Children | 0 (0.0%) | 195 (83.0%) |
| 5 or more Children | 0 (0.0%) | 0 (0.0%) |
| Total | 93 (8.4%) | 648 (24.5%) |
Income Below Poverty Among Married-Couple vs Single-Parent Households in Olympia
The poverty data for Olympia shows that 306 of the married-couple family households (3.4%) and 741 of the single-parent households (19.8%) are living below the poverty level. Within the married-couple family households, those with 1 or 2 children have the highest poverty rate, with 134 households (4.2%) falling below the poverty line. Among the single-parent households, those with 3 or 4 children have the highest poverty rate, with 195 household (67.0%) living below poverty.
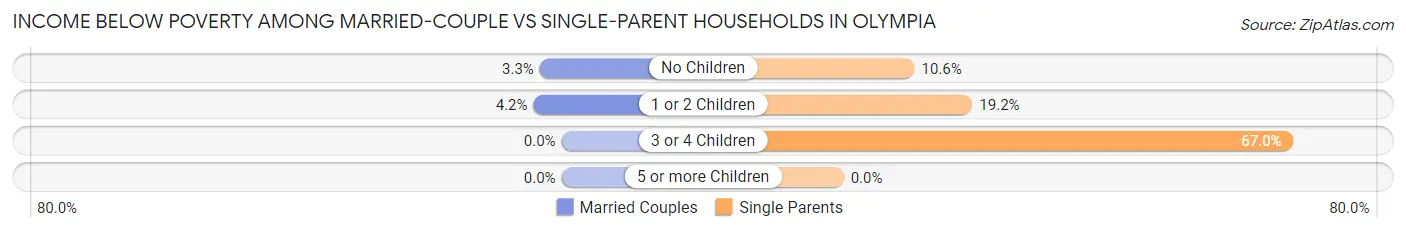
| Children | Married-Couple Families | Single-Parent Households |
| No Children | 172 (3.3%) | 136 (10.6%) |
| 1 or 2 Children | 134 (4.2%) | 410 (19.2%) |
| 3 or 4 Children | 0 (0.0%) | 195 (67.0%) |
| 5 or more Children | 0 (0.0%) | 0 (0.0%) |
| Total | 306 (3.4%) | 741 (19.8%) |
Employment Characteristics in Olympia
Employment by Class of Employer in Olympia
Among the 26,068 employed individuals in Olympia, private company employees (12,382 | 47.5%), state government employees (5,271 | 20.2%), and not-for-profit organizations (3,121 | 12.0%) make up the most common classes of employment.
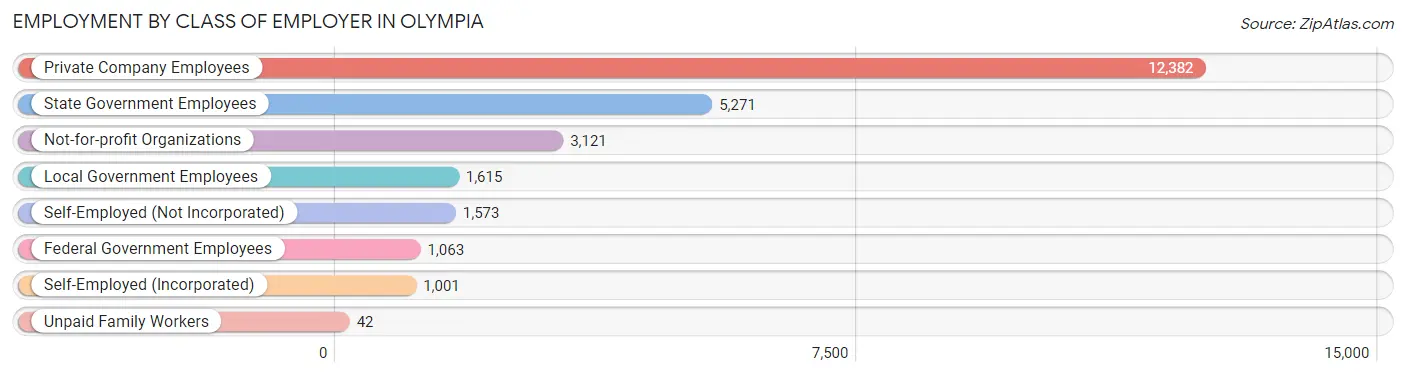
| Employer Class | # Employees | % Employees |
| Private Company Employees | 12,382 | 47.5% |
| Self-Employed (Incorporated) | 1,001 | 3.8% |
| Self-Employed (Not Incorporated) | 1,573 | 6.0% |
| Not-for-profit Organizations | 3,121 | 12.0% |
| Local Government Employees | 1,615 | 6.2% |
| State Government Employees | 5,271 | 20.2% |
| Federal Government Employees | 1,063 | 4.1% |
| Unpaid Family Workers | 42 | 0.2% |
| Total | 26,068 | 100.0% |
Employment Status by Age in Olympia
According to the labor force statistics for Olympia, out of the total population over 16 years of age (46,319), 61.9% or 28,671 individuals are in the labor force, with 6.9% or 1,978 of them unemployed. The age group with the highest labor force participation rate is 25 to 29 years, with 87.0% or 4,199 individuals in the labor force. Within the labor force, the 16 to 19 years age range has the highest percentage of unemployed individuals, with 28.5% or 346 of them being unemployed.
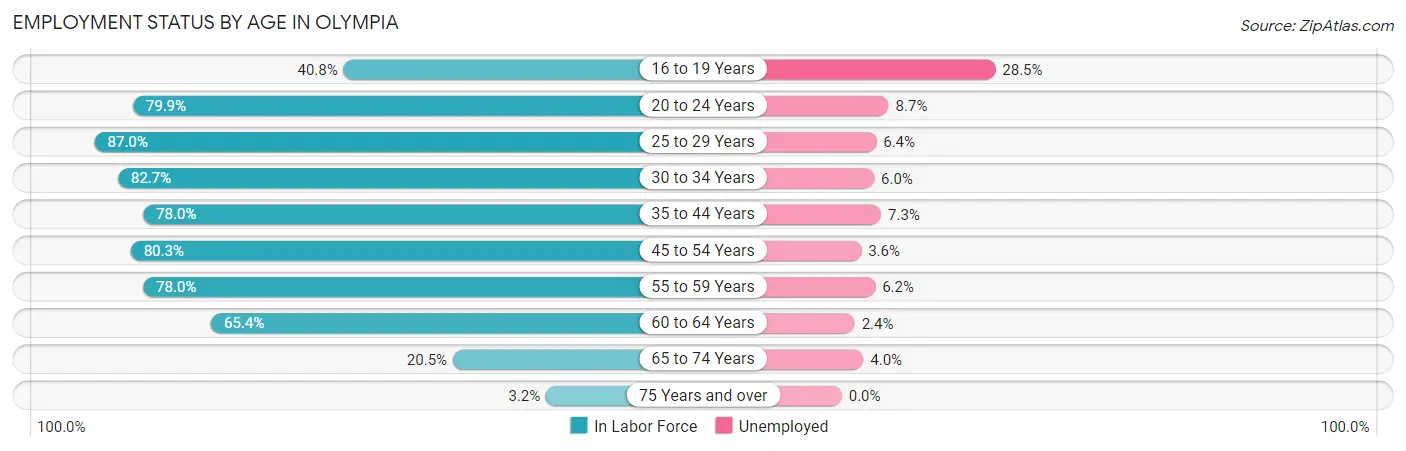
| Age Bracket | In Labor Force | Unemployed |
| 16 to 19 Years | 1,214 (40.8%) | 346 (28.5%) |
| 20 to 24 Years | 2,691 (79.9%) | 234 (8.7%) |
| 25 to 29 Years | 4,199 (87.0%) | 269 (6.4%) |
| 30 to 34 Years | 3,640 (82.7%) | 218 (6.0%) |
| 35 to 44 Years | 6,464 (78.0%) | 472 (7.3%) |
| 45 to 54 Years | 4,726 (80.3%) | 170 (3.6%) |
| 55 to 59 Years | 2,535 (78.0%) | 157 (6.2%) |
| 60 to 64 Years | 1,798 (65.4%) | 43 (2.4%) |
| 65 to 74 Years | 1,265 (20.5%) | 51 (4.0%) |
| 75 Years and over | 141 (3.2%) | 0 (0.0%) |
| Total | 28,671 (61.9%) | 1,978 (6.9%) |
Employment Status by Educational Attainment in Olympia
According to labor force statistics for Olympia, 79.5% of individuals (23,372) out of the total population between 25 and 64 years of age (29,399) are in the labor force, with 5.7% or 1,332 of them being unemployed. The group with the highest labor force participation rate are those with the educational attainment of bachelor's degree or higher, with 87.0% or 12,388 individuals in the labor force. Within the labor force, individuals with high school diploma education have the highest percentage of unemployment, with 18.3% or 611 of them being unemployed.
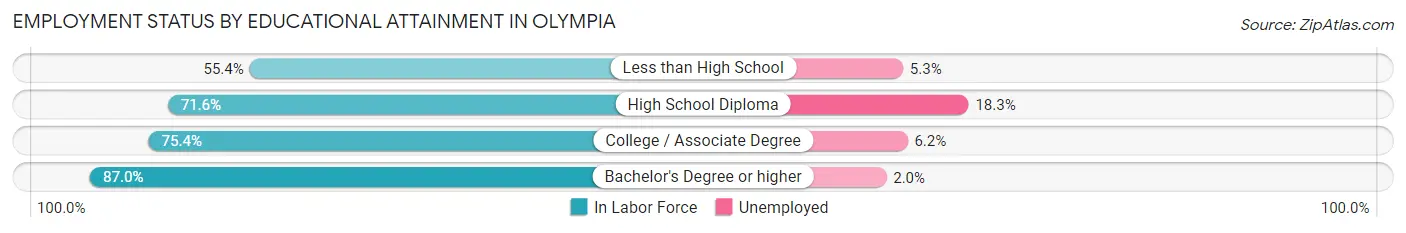
| Educational Attainment | In Labor Force | Unemployed |
| Less than High School | 749 (55.4%) | 72 (5.3%) |
| High School Diploma | 3,339 (71.6%) | 853 (18.3%) |
| College / Associate Degree | 6,895 (75.4%) | 567 (6.2%) |
| Bachelor's Degree or higher | 12,388 (87.0%) | 285 (2.0%) |
| Total | 23,372 (79.5%) | 1,676 (5.7%) |
Employment Occupations by Sex in Olympia
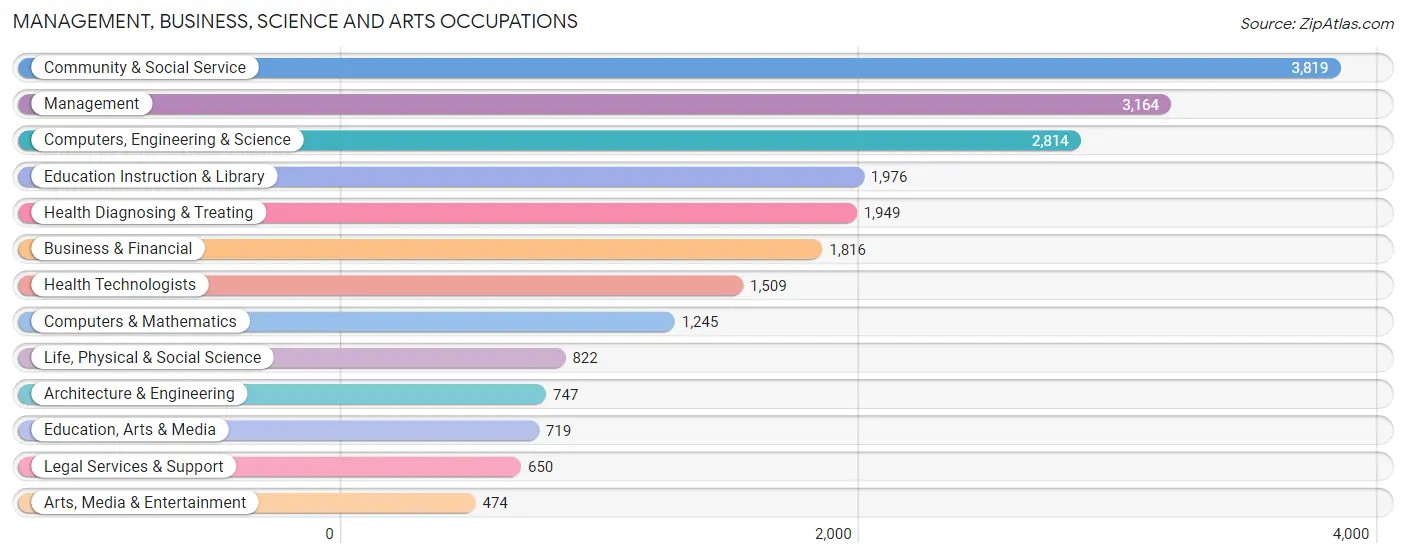
Management, Business, Science and Arts Occupations
The most common Management, Business, Science and Arts occupations in Olympia are Community & Social Service (3,819 | 14.6%), Management (3,164 | 12.1%), Computers, Engineering & Science (2,814 | 10.7%), Education Instruction & Library (1,976 | 7.5%), and Health Diagnosing & Treating (1,949 | 7.4%).
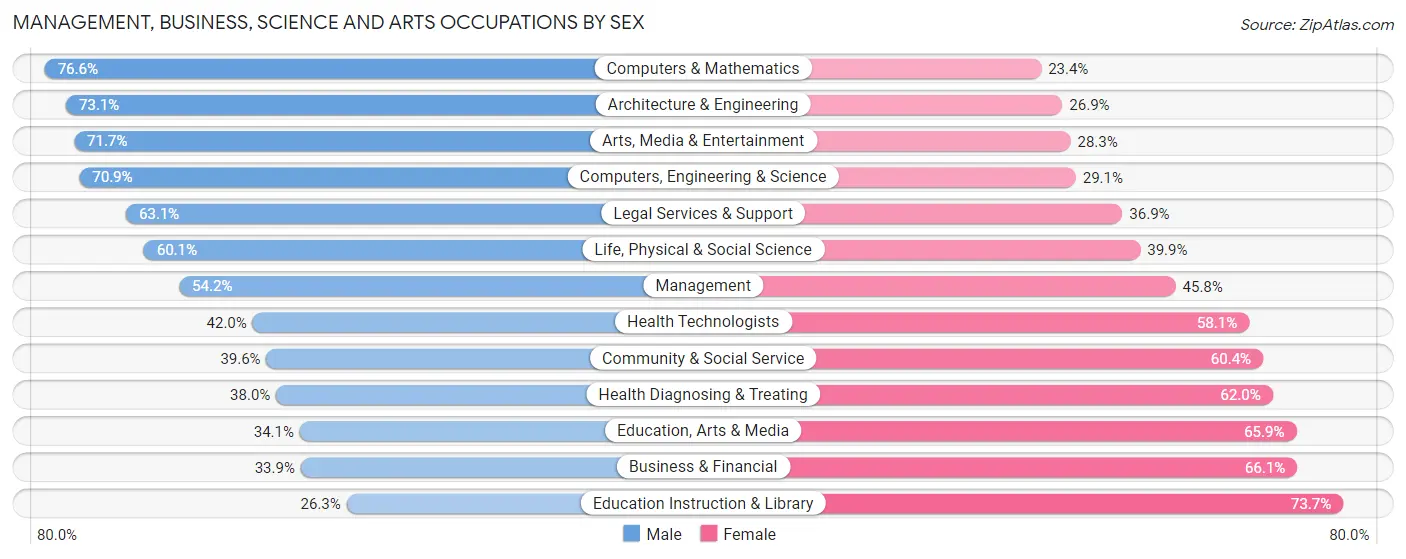
Management, Business, Science and Arts Occupations by Sex
Within the Management, Business, Science and Arts occupations in Olympia, the most male-oriented occupations are Computers & Mathematics (76.6%), Architecture & Engineering (73.1%), and Arts, Media & Entertainment (71.7%), while the most female-oriented occupations are Education Instruction & Library (73.7%), Business & Financial (66.1%), and Education, Arts & Media (65.9%).
| Occupation | Male | Female |
| Management | 1,715 (54.2%) | 1,449 (45.8%) |
| Business & Financial | 616 (33.9%) | 1,200 (66.1%) |
| Computers, Engineering & Science | 1,994 (70.9%) | 820 (29.1%) |
| Computers & Mathematics | 954 (76.6%) | 291 (23.4%) |
| Architecture & Engineering | 546 (73.1%) | 201 (26.9%) |
| Life, Physical & Social Science | 494 (60.1%) | 328 (39.9%) |
| Community & Social Service | 1,514 (39.6%) | 2,305 (60.4%) |
| Education, Arts & Media | 245 (34.1%) | 474 (65.9%) |
| Legal Services & Support | 410 (63.1%) | 240 (36.9%) |
| Education Instruction & Library | 519 (26.3%) | 1,457 (73.7%) |
| Arts, Media & Entertainment | 340 (71.7%) | 134 (28.3%) |
| Health Diagnosing & Treating | 741 (38.0%) | 1,208 (62.0%) |
| Health Technologists | 633 (41.9%) | 876 (58.1%) |
| Total (Category) | 6,580 (48.5%) | 6,982 (51.5%) |
| Total (Overall) | 13,287 (50.7%) | 12,942 (49.3%) |
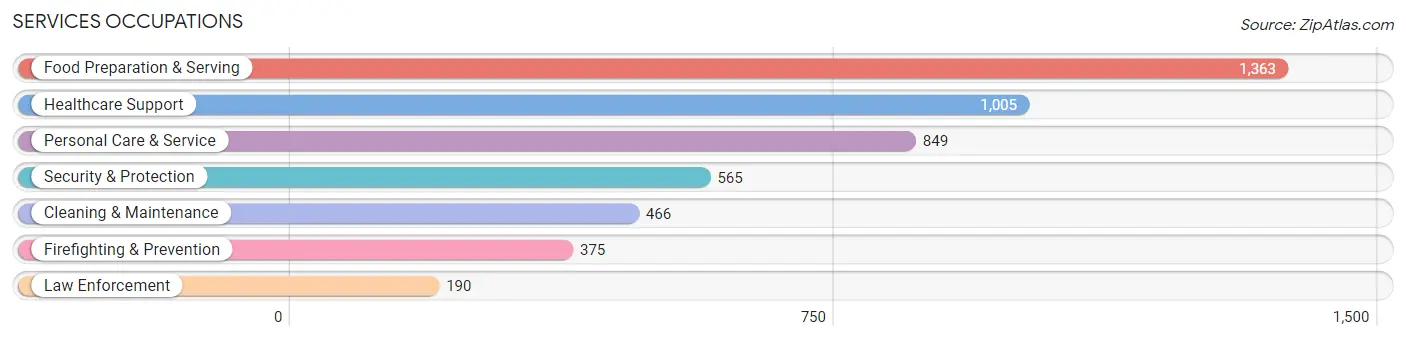
Services Occupations
The most common Services occupations in Olympia are Food Preparation & Serving (1,363 | 5.2%), Healthcare Support (1,005 | 3.8%), Personal Care & Service (849 | 3.2%), Security & Protection (565 | 2.1%), and Cleaning & Maintenance (466 | 1.8%).
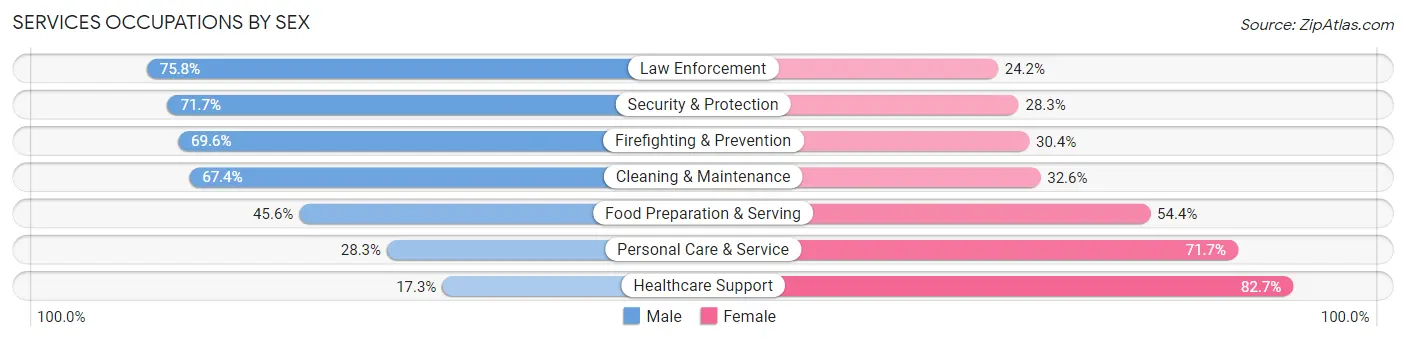
Services Occupations by Sex
Within the Services occupations in Olympia, the most male-oriented occupations are Law Enforcement (75.8%), Security & Protection (71.7%), and Firefighting & Prevention (69.6%), while the most female-oriented occupations are Healthcare Support (82.7%), Personal Care & Service (71.7%), and Food Preparation & Serving (54.4%).
| Occupation | Male | Female |
| Healthcare Support | 174 (17.3%) | 831 (82.7%) |
| Security & Protection | 405 (71.7%) | 160 (28.3%) |
| Firefighting & Prevention | 261 (69.6%) | 114 (30.4%) |
| Law Enforcement | 144 (75.8%) | 46 (24.2%) |
| Food Preparation & Serving | 622 (45.6%) | 741 (54.4%) |
| Cleaning & Maintenance | 314 (67.4%) | 152 (32.6%) |
| Personal Care & Service | 240 (28.3%) | 609 (71.7%) |
| Total (Category) | 1,755 (41.3%) | 2,493 (58.7%) |
| Total (Overall) | 13,287 (50.7%) | 12,942 (49.3%) |
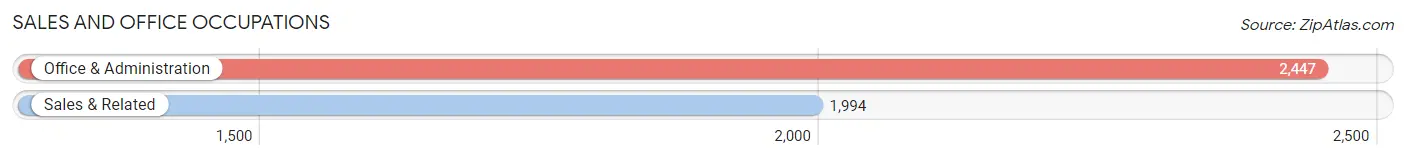
Sales and Office Occupations
The most common Sales and Office occupations in Olympia are Office & Administration (2,447 | 9.3%), and Sales & Related (1,994 | 7.6%).
Sales and Office Occupations by Sex
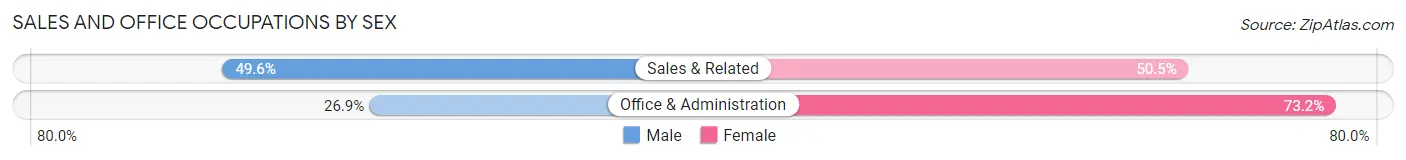
| Occupation | Male | Female |
| Sales & Related | 988 (49.5%) | 1,006 (50.4%) |
| Office & Administration | 657 (26.9%) | 1,790 (73.2%) |
| Total (Category) | 1,645 (37.0%) | 2,796 (63.0%) |
| Total (Overall) | 13,287 (50.7%) | 12,942 (49.3%) |
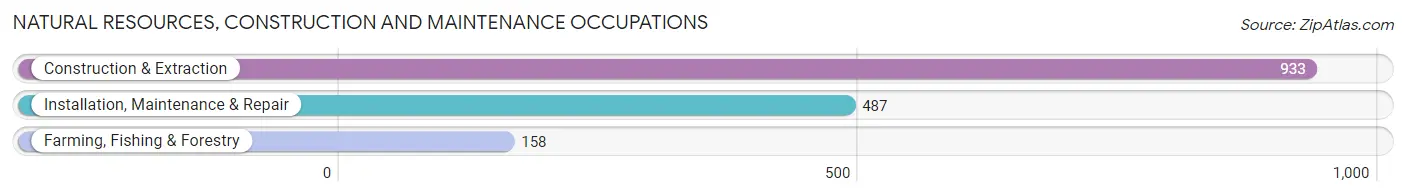
Natural Resources, Construction and Maintenance Occupations
The most common Natural Resources, Construction and Maintenance occupations in Olympia are Construction & Extraction (933 | 3.6%), Installation, Maintenance & Repair (487 | 1.9%), and Farming, Fishing & Forestry (158 | 0.6%).
Natural Resources, Construction and Maintenance Occupations by Sex
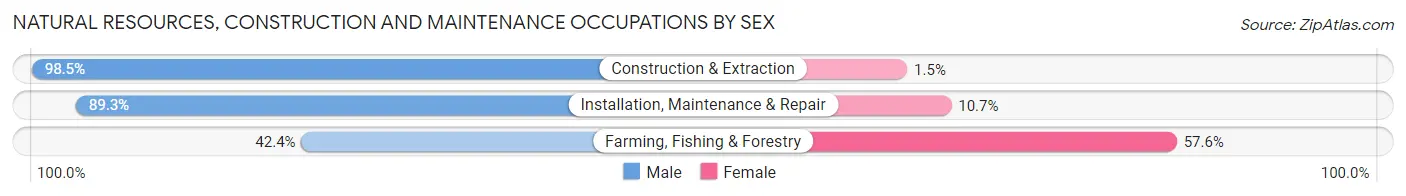
| Occupation | Male | Female |
| Farming, Fishing & Forestry | 67 (42.4%) | 91 (57.6%) |
| Construction & Extraction | 919 (98.5%) | 14 (1.5%) |
| Installation, Maintenance & Repair | 435 (89.3%) | 52 (10.7%) |
| Total (Category) | 1,421 (90.0%) | 157 (10.0%) |
| Total (Overall) | 13,287 (50.7%) | 12,942 (49.3%) |
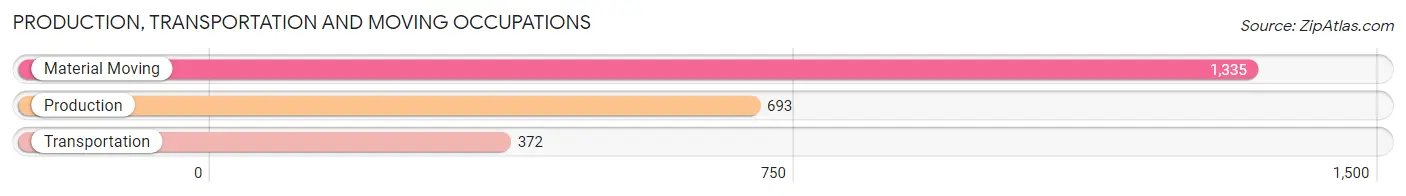
Production, Transportation and Moving Occupations
The most common Production, Transportation and Moving occupations in Olympia are Material Moving (1,335 | 5.1%), Production (693 | 2.6%), and Transportation (372 | 1.4%).
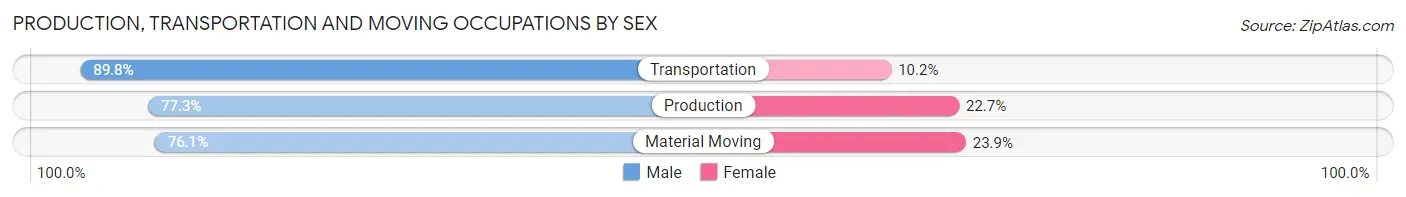
Production, Transportation and Moving Occupations by Sex
| Occupation | Male | Female |
| Production | 536 (77.3%) | 157 (22.7%) |
| Transportation | 334 (89.8%) | 38 (10.2%) |
| Material Moving | 1,016 (76.1%) | 319 (23.9%) |
| Total (Category) | 1,886 (78.6%) | 514 (21.4%) |
| Total (Overall) | 13,287 (50.7%) | 12,942 (49.3%) |
Employment Industries by Sex in Olympia
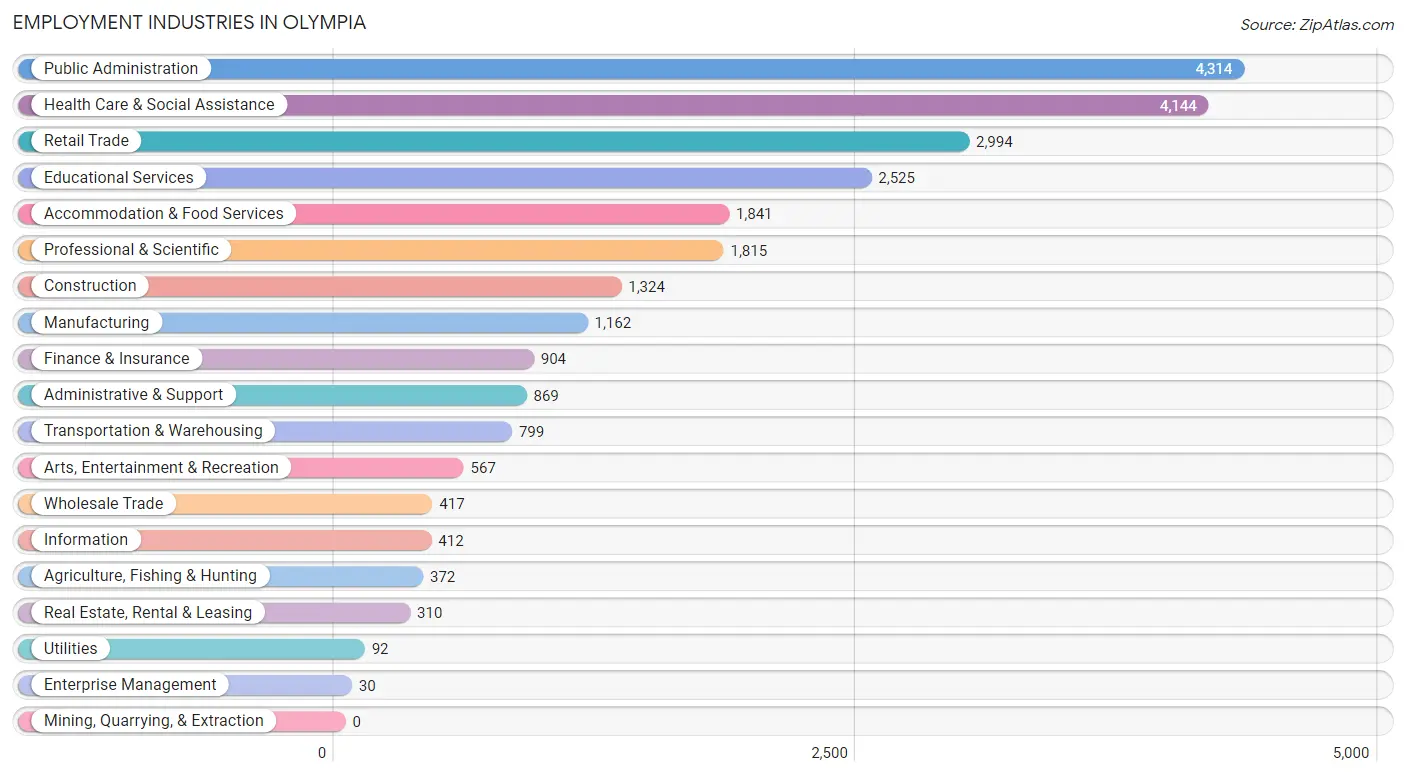
Employment Industries in Olympia
The major employment industries in Olympia include Public Administration (4,314 | 16.5%), Health Care & Social Assistance (4,144 | 15.8%), Retail Trade (2,994 | 11.4%), Educational Services (2,525 | 9.6%), and Accommodation & Food Services (1,841 | 7.0%).
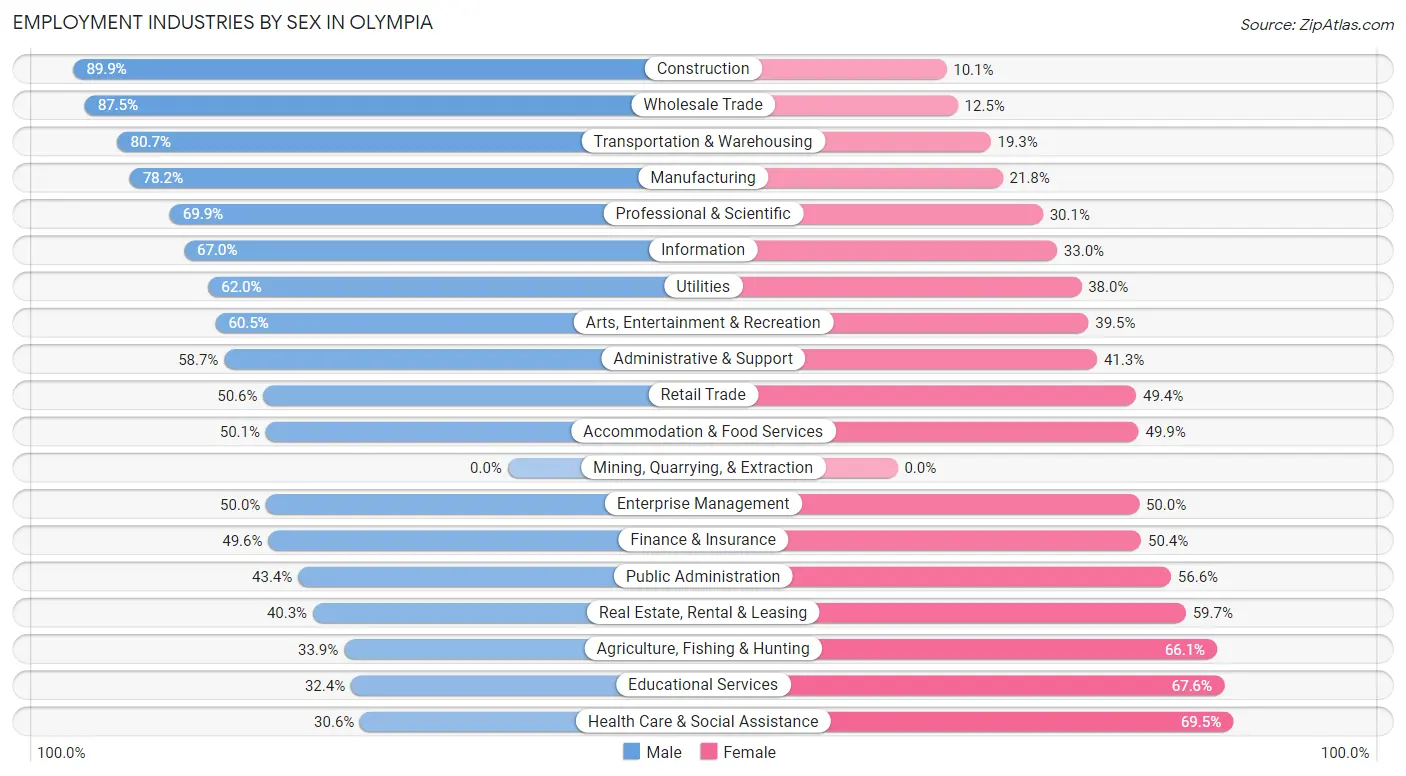
Employment Industries by Sex in Olympia
The Olympia industries that see more men than women are Construction (89.9%), Wholesale Trade (87.5%), and Transportation & Warehousing (80.7%), whereas the industries that tend to have a higher number of women are Health Care & Social Assistance (69.5%), Educational Services (67.6%), and Agriculture, Fishing & Hunting (66.1%).
| Industry | Male | Female |
| Agriculture, Fishing & Hunting | 126 (33.9%) | 246 (66.1%) |
| Mining, Quarrying, & Extraction | 0 (0.0%) | 0 (0.0%) |
| Construction | 1,190 (89.9%) | 134 (10.1%) |
| Manufacturing | 909 (78.2%) | 253 (21.8%) |
| Wholesale Trade | 365 (87.5%) | 52 (12.5%) |
| Retail Trade | 1,515 (50.6%) | 1,479 (49.4%) |
| Transportation & Warehousing | 645 (80.7%) | 154 (19.3%) |
| Utilities | 57 (62.0%) | 35 (38.0%) |
| Information | 276 (67.0%) | 136 (33.0%) |
| Finance & Insurance | 448 (49.6%) | 456 (50.4%) |
| Real Estate, Rental & Leasing | 125 (40.3%) | 185 (59.7%) |
| Professional & Scientific | 1,269 (69.9%) | 546 (30.1%) |
| Enterprise Management | 15 (50.0%) | 15 (50.0%) |
| Administrative & Support | 510 (58.7%) | 359 (41.3%) |
| Educational Services | 819 (32.4%) | 1,706 (67.6%) |
| Health Care & Social Assistance | 1,266 (30.5%) | 2,878 (69.5%) |
| Arts, Entertainment & Recreation | 343 (60.5%) | 224 (39.5%) |
| Accommodation & Food Services | 922 (50.1%) | 919 (49.9%) |
| Public Administration | 1,872 (43.4%) | 2,442 (56.6%) |
| Total | 13,287 (50.7%) | 12,942 (49.3%) |
Education in Olympia
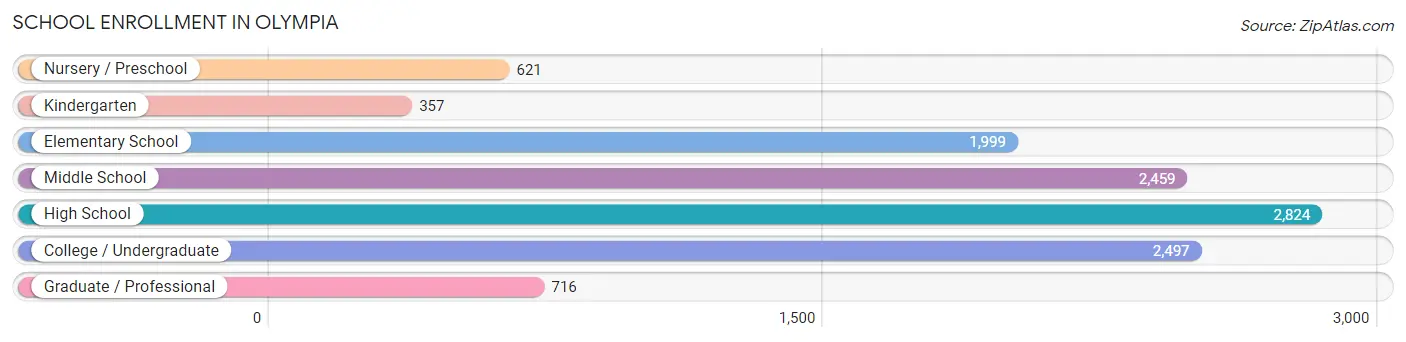
School Enrollment in Olympia
The most common levels of schooling among the 11,473 students in Olympia are high school (2,824 | 24.6%), college / undergraduate (2,497 | 21.8%), and middle school (2,459 | 21.4%).
| School Level | # Students | % Students |
| Nursery / Preschool | 621 | 5.4% |
| Kindergarten | 357 | 3.1% |
| Elementary School | 1,999 | 17.4% |
| Middle School | 2,459 | 21.4% |
| High School | 2,824 | 24.6% |
| College / Undergraduate | 2,497 | 21.8% |
| Graduate / Professional | 716 | 6.2% |
| Total | 11,473 | 100.0% |
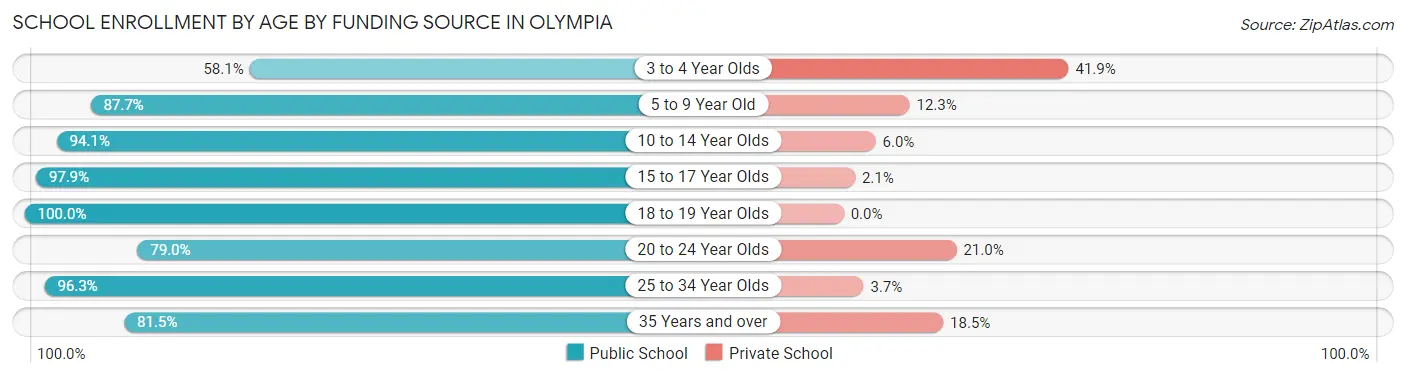
School Enrollment by Age by Funding Source in Olympia
Out of a total of 11,473 students who are enrolled in schools in Olympia, 1,101 (9.6%) attend a private institution, while the remaining 10,372 (90.4%) are enrolled in public schools. The age group of 3 to 4 year olds has the highest likelihood of being enrolled in private schools, with 191 (41.9% in the age bracket) enrolled. Conversely, the age group of 18 to 19 year olds has the lowest likelihood of being enrolled in a private school, with 647 (100.0% in the age bracket) attending a public institution.
| Age Bracket | Public School | Private School |
| 3 to 4 Year Olds | 265 (58.1%) | 191 (41.9%) |
| 5 to 9 Year Old | 2,030 (87.7%) | 284 (12.3%) |
| 10 to 14 Year Olds | 2,671 (94.1%) | 169 (5.9%) |
| 15 to 17 Year Olds | 2,196 (97.9%) | 47 (2.1%) |
| 18 to 19 Year Olds | 647 (100.0%) | 0 (0.0%) |
| 20 to 24 Year Olds | 786 (79.0%) | 209 (21.0%) |
| 25 to 34 Year Olds | 1,042 (96.3%) | 40 (3.7%) |
| 35 Years and over | 730 (81.5%) | 166 (18.5%) |
| Total | 10,372 (90.4%) | 1,101 (9.6%) |
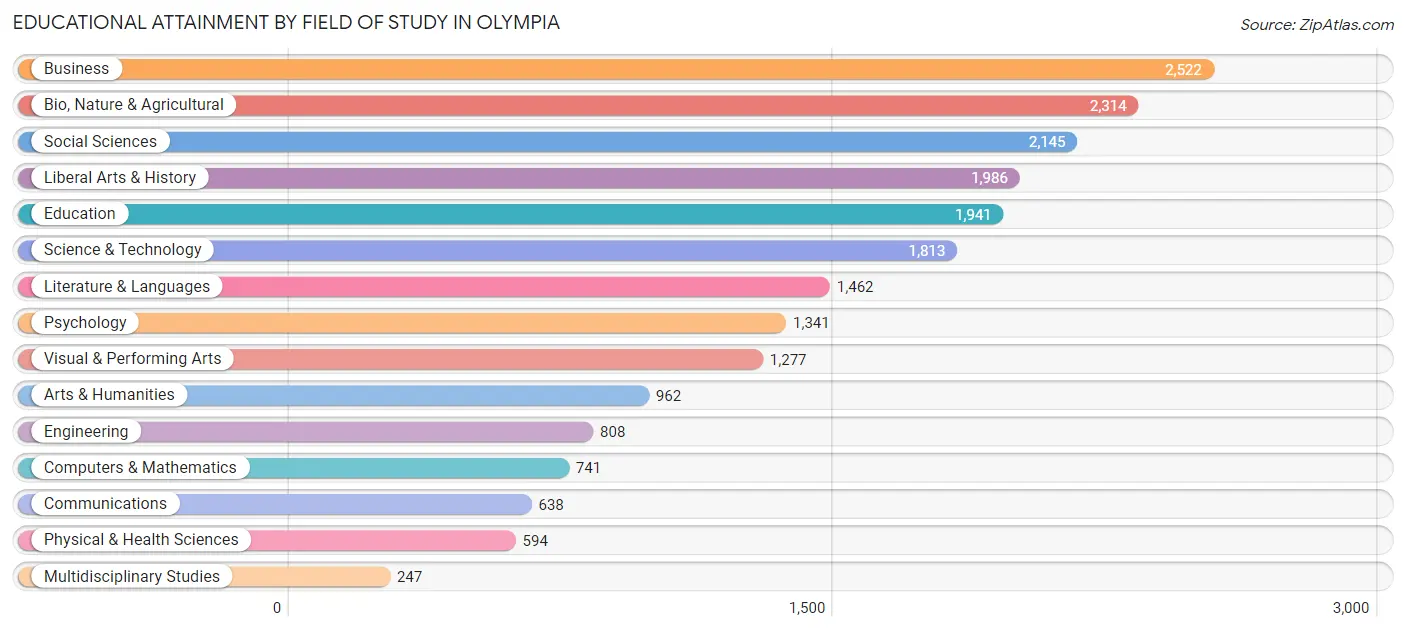
Educational Attainment by Field of Study in Olympia
Business (2,522 | 12.1%), bio, nature & agricultural (2,314 | 11.1%), social sciences (2,145 | 10.3%), liberal arts & history (1,986 | 9.6%), and education (1,941 | 9.3%) are the most common fields of study among 20,791 individuals in Olympia who have obtained a bachelor's degree or higher.
| Field of Study | # Graduates | % Graduates |
| Computers & Mathematics | 741 | 3.6% |
| Bio, Nature & Agricultural | 2,314 | 11.1% |
| Physical & Health Sciences | 594 | 2.9% |
| Psychology | 1,341 | 6.5% |
| Social Sciences | 2,145 | 10.3% |
| Engineering | 808 | 3.9% |
| Multidisciplinary Studies | 247 | 1.2% |
| Science & Technology | 1,813 | 8.7% |
| Business | 2,522 | 12.1% |
| Education | 1,941 | 9.3% |
| Literature & Languages | 1,462 | 7.0% |
| Liberal Arts & History | 1,986 | 9.6% |
| Visual & Performing Arts | 1,277 | 6.1% |
| Communications | 638 | 3.1% |
| Arts & Humanities | 962 | 4.6% |
| Total | 20,791 | 100.0% |
Transportation & Commute in Olympia
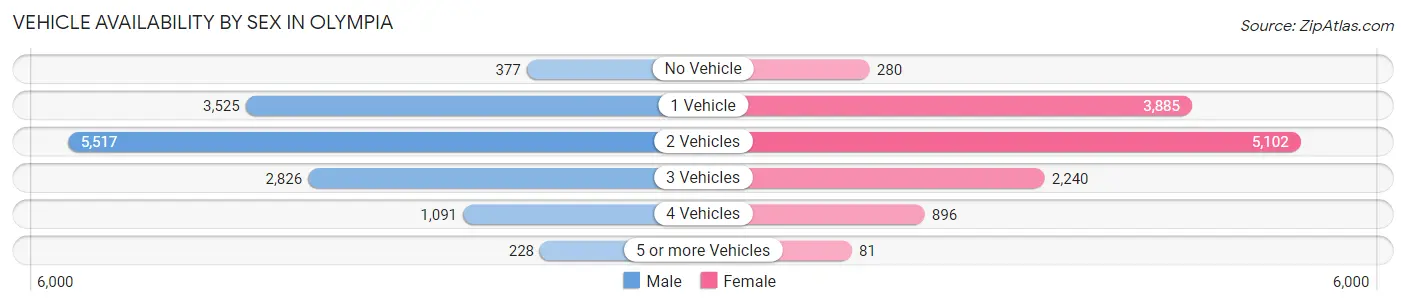
Vehicle Availability by Sex in Olympia
The most prevalent vehicle ownership categories in Olympia are males with 2 vehicles (5,517, accounting for 40.7%) and females with 2 vehicles (5,102, making up 44.2%).
| Vehicles Available | Male | Female |
| No Vehicle | 377 (2.8%) | 280 (2.2%) |
| 1 Vehicle | 3,525 (26.0%) | 3,885 (31.1%) |
| 2 Vehicles | 5,517 (40.7%) | 5,102 (40.9%) |
| 3 Vehicles | 2,826 (20.8%) | 2,240 (17.9%) |
| 4 Vehicles | 1,091 (8.0%) | 896 (7.2%) |
| 5 or more Vehicles | 228 (1.7%) | 81 (0.6%) |
| Total | 13,564 (100.0%) | 12,484 (100.0%) |
Commute Time in Olympia
The most frequently occuring commute durations in Olympia are 15 to 19 minutes (4,767 commuters, 22.3%), 5 to 9 minutes (4,160 commuters, 19.5%), and 10 to 14 minutes (4,027 commuters, 18.8%).
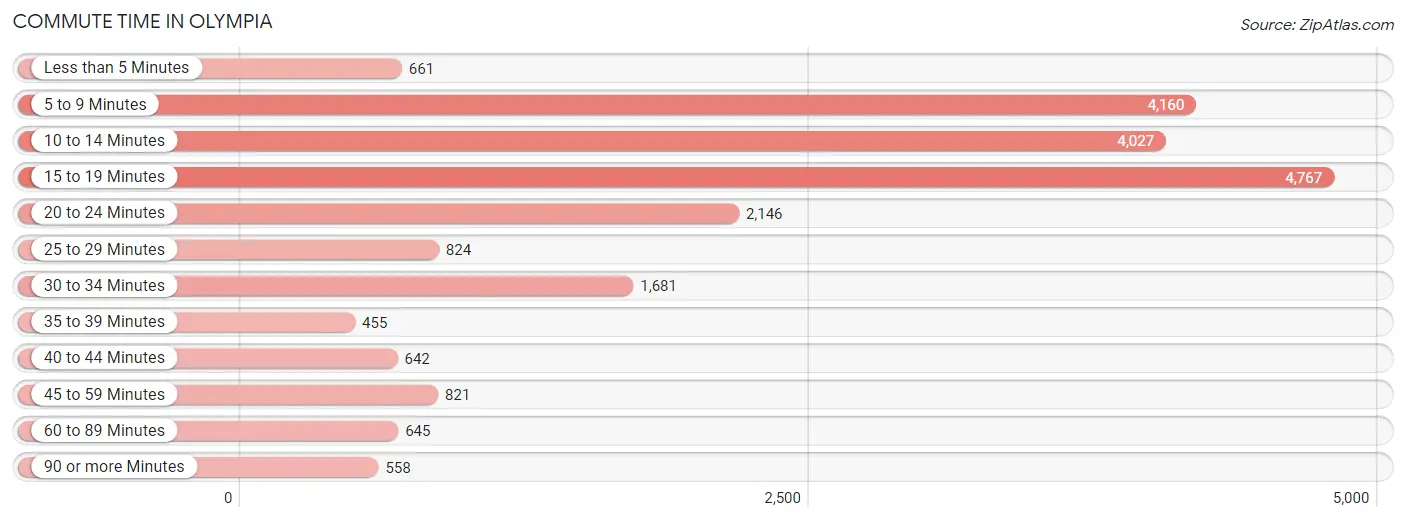
| Commute Time | # Commuters | % Commuters |
| Less than 5 Minutes | 661 | 3.1% |
| 5 to 9 Minutes | 4,160 | 19.5% |
| 10 to 14 Minutes | 4,027 | 18.8% |
| 15 to 19 Minutes | 4,767 | 22.3% |
| 20 to 24 Minutes | 2,146 | 10.0% |
| 25 to 29 Minutes | 824 | 3.8% |
| 30 to 34 Minutes | 1,681 | 7.9% |
| 35 to 39 Minutes | 455 | 2.1% |
| 40 to 44 Minutes | 642 | 3.0% |
| 45 to 59 Minutes | 821 | 3.8% |
| 60 to 89 Minutes | 645 | 3.0% |
| 90 or more Minutes | 558 | 2.6% |
Commute Time by Sex in Olympia
The most common commute times in Olympia are 15 to 19 minutes (2,336 commuters, 20.7%) for males and 15 to 19 minutes (2,431 commuters, 24.1%) for females.
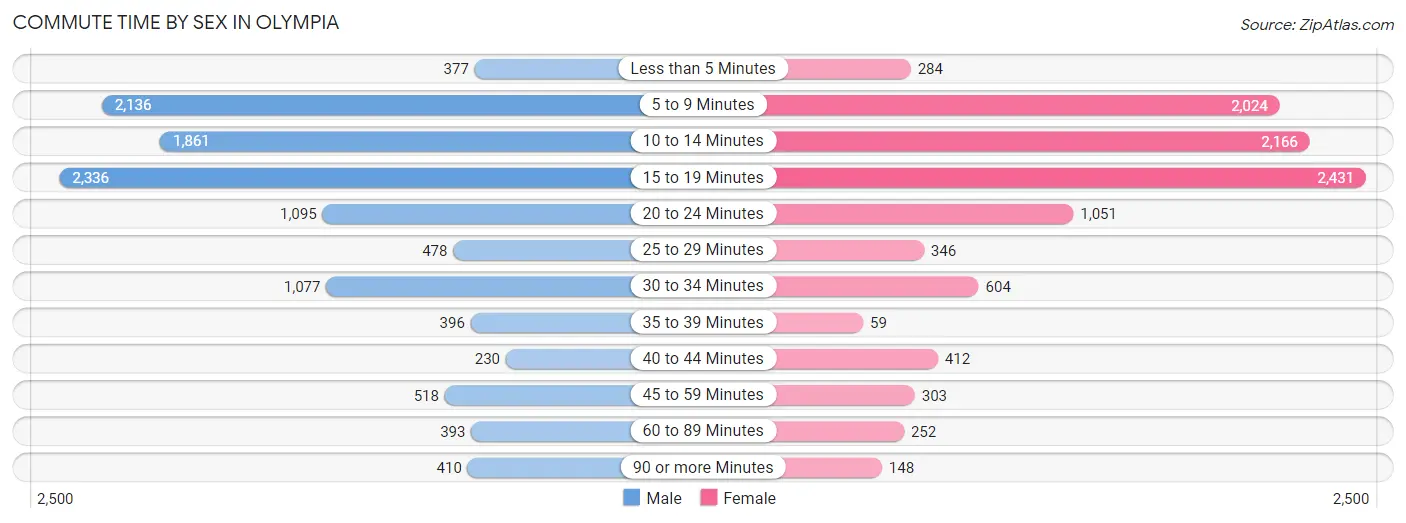
| Commute Time | Male | Female |
| Less than 5 Minutes | 377 (3.3%) | 284 (2.8%) |
| 5 to 9 Minutes | 2,136 (18.9%) | 2,024 (20.1%) |
| 10 to 14 Minutes | 1,861 (16.5%) | 2,166 (21.5%) |
| 15 to 19 Minutes | 2,336 (20.7%) | 2,431 (24.1%) |
| 20 to 24 Minutes | 1,095 (9.7%) | 1,051 (10.4%) |
| 25 to 29 Minutes | 478 (4.2%) | 346 (3.4%) |
| 30 to 34 Minutes | 1,077 (9.5%) | 604 (6.0%) |
| 35 to 39 Minutes | 396 (3.5%) | 59 (0.6%) |
| 40 to 44 Minutes | 230 (2.0%) | 412 (4.1%) |
| 45 to 59 Minutes | 518 (4.6%) | 303 (3.0%) |
| 60 to 89 Minutes | 393 (3.5%) | 252 (2.5%) |
| 90 or more Minutes | 410 (3.6%) | 148 (1.5%) |
Time of Departure to Work by Sex in Olympia
The most frequent times of departure to work in Olympia are 7:30 AM to 7:59 AM (1,703, 15.1%) for males and 7:30 AM to 7:59 AM (1,878, 18.6%) for females.
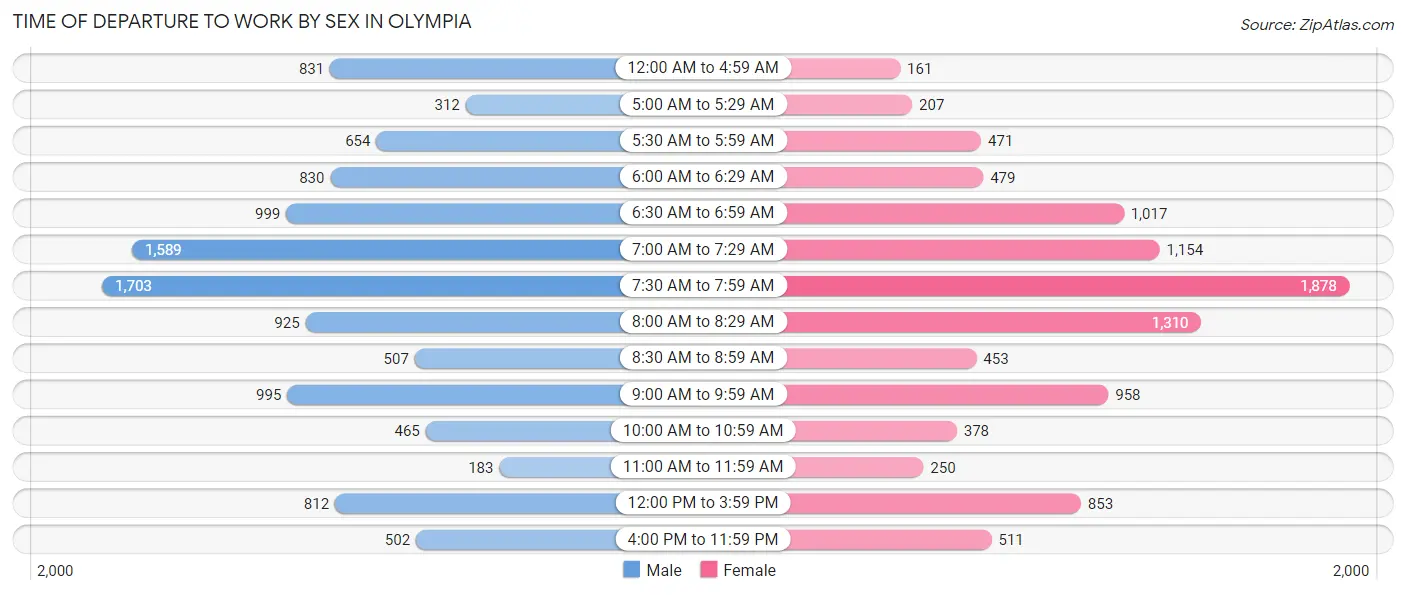
| Time of Departure | Male | Female |
| 12:00 AM to 4:59 AM | 831 (7.3%) | 161 (1.6%) |
| 5:00 AM to 5:29 AM | 312 (2.8%) | 207 (2.1%) |
| 5:30 AM to 5:59 AM | 654 (5.8%) | 471 (4.7%) |
| 6:00 AM to 6:29 AM | 830 (7.3%) | 479 (4.8%) |
| 6:30 AM to 6:59 AM | 999 (8.8%) | 1,017 (10.1%) |
| 7:00 AM to 7:29 AM | 1,589 (14.1%) | 1,154 (11.5%) |
| 7:30 AM to 7:59 AM | 1,703 (15.1%) | 1,878 (18.6%) |
| 8:00 AM to 8:29 AM | 925 (8.2%) | 1,310 (13.0%) |
| 8:30 AM to 8:59 AM | 507 (4.5%) | 453 (4.5%) |
| 9:00 AM to 9:59 AM | 995 (8.8%) | 958 (9.5%) |
| 10:00 AM to 10:59 AM | 465 (4.1%) | 378 (3.7%) |
| 11:00 AM to 11:59 AM | 183 (1.6%) | 250 (2.5%) |
| 12:00 PM to 3:59 PM | 812 (7.2%) | 853 (8.5%) |
| 4:00 PM to 11:59 PM | 502 (4.4%) | 511 (5.1%) |
| Total | 11,307 (100.0%) | 10,080 (100.0%) |
Housing Occupancy in Olympia
Occupancy by Ownership in Olympia
Of the total 24,567 dwellings in Olympia, owner-occupied units account for 11,858 (48.3%), while renter-occupied units make up 12,709 (51.7%).
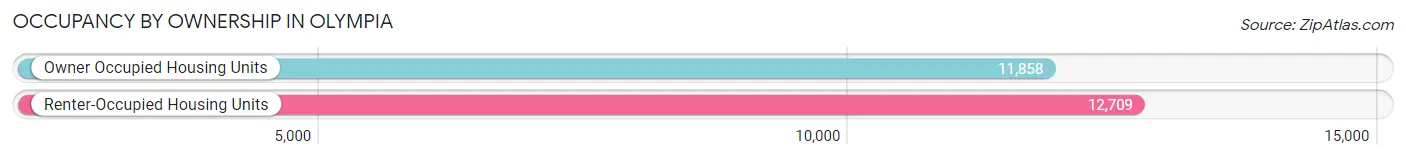
| Occupancy | # Housing Units | % Housing Units |
| Owner Occupied Housing Units | 11,858 | 48.3% |
| Renter-Occupied Housing Units | 12,709 | 51.7% |
| Total Occupied Housing Units | 24,567 | 100.0% |
Occupancy by Household Size in Olympia
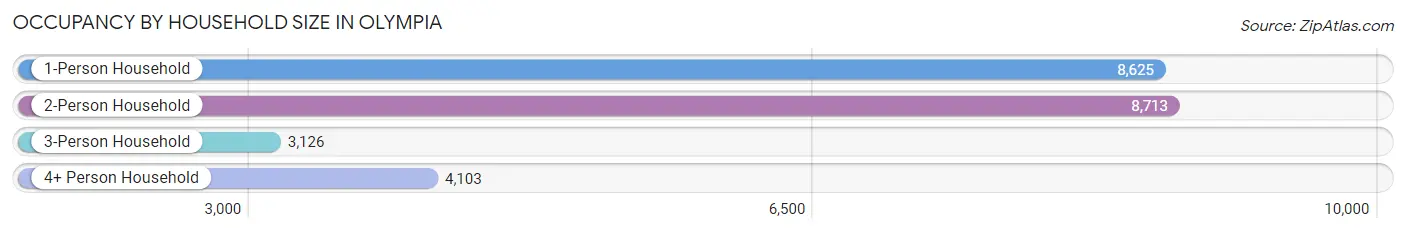
| Household Size | # Housing Units | % Housing Units |
| 1-Person Household | 8,625 | 35.1% |
| 2-Person Household | 8,713 | 35.5% |
| 3-Person Household | 3,126 | 12.7% |
| 4+ Person Household | 4,103 | 16.7% |
| Total Housing Units | 24,567 | 100.0% |
Occupancy by Ownership by Household Size in Olympia
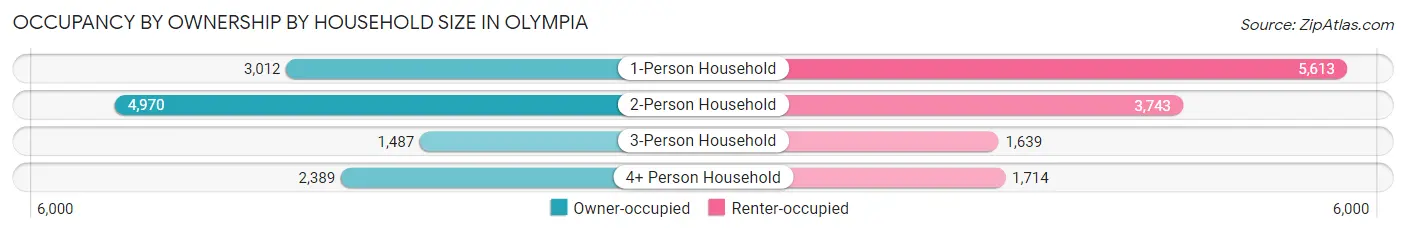
| Household Size | Owner-occupied | Renter-occupied |
| 1-Person Household | 3,012 (34.9%) | 5,613 (65.1%) |
| 2-Person Household | 4,970 (57.0%) | 3,743 (43.0%) |
| 3-Person Household | 1,487 (47.6%) | 1,639 (52.4%) |
| 4+ Person Household | 2,389 (58.2%) | 1,714 (41.8%) |
| Total Housing Units | 11,858 (48.3%) | 12,709 (51.7%) |
Occupancy by Educational Attainment in Olympia
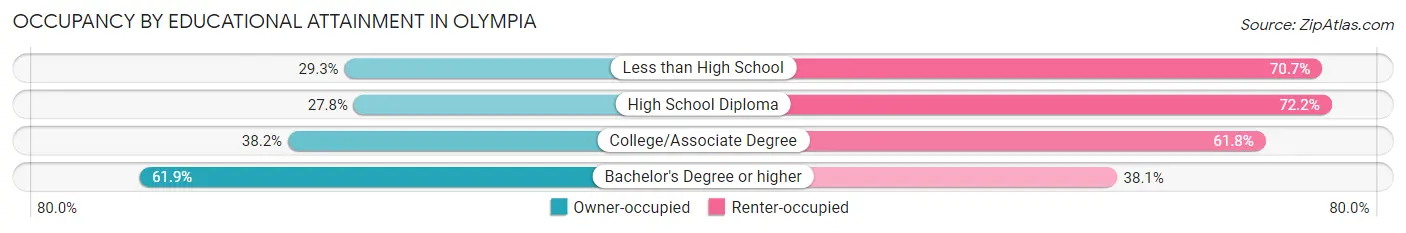
| Household Size | Owner-occupied | Renter-occupied |
| Less than High School | 293 (29.3%) | 708 (70.7%) |
| High School Diploma | 968 (27.8%) | 2,515 (72.2%) |
| College/Associate Degree | 2,957 (38.2%) | 4,775 (61.8%) |
| Bachelor's Degree or higher | 7,640 (61.9%) | 4,711 (38.1%) |
Occupancy by Age of Householder in Olympia
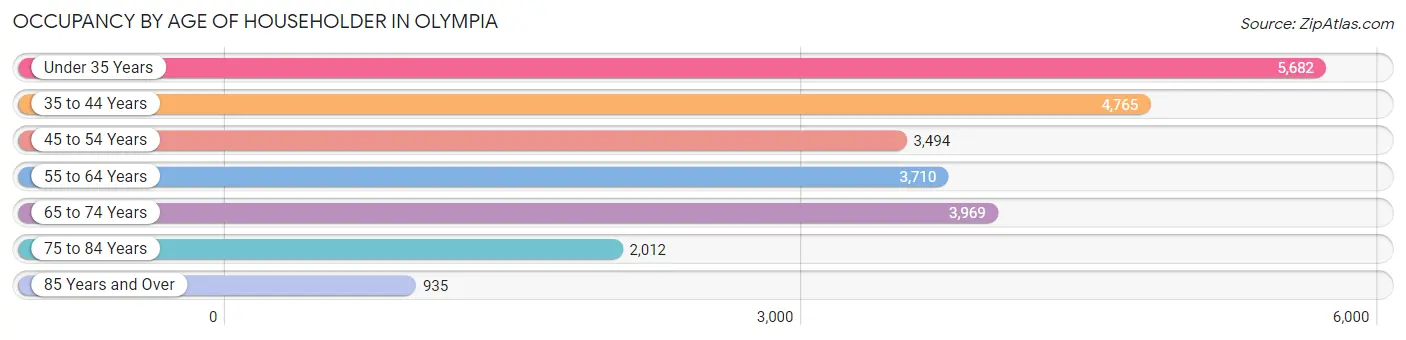
| Age Bracket | # Households | % Households |
| Under 35 Years | 5,682 | 23.1% |
| 35 to 44 Years | 4,765 | 19.4% |
| 45 to 54 Years | 3,494 | 14.2% |
| 55 to 64 Years | 3,710 | 15.1% |
| 65 to 74 Years | 3,969 | 16.2% |
| 75 to 84 Years | 2,012 | 8.2% |
| 85 Years and Over | 935 | 3.8% |
| Total | 24,567 | 100.0% |
Housing Finances in Olympia
Median Income by Occupancy in Olympia
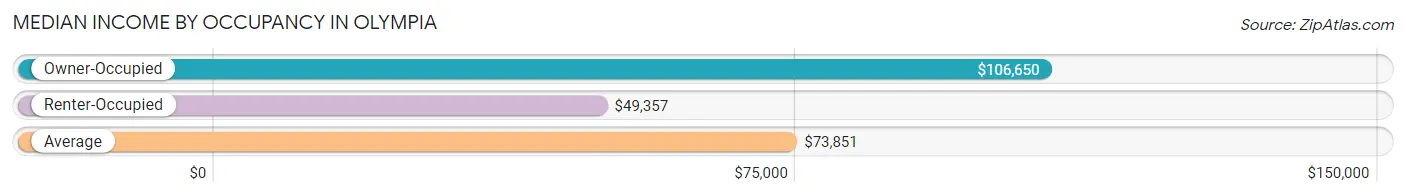
| Occupancy Type | # Households | Median Income |
| Owner-Occupied | 11,858 (48.3%) | $106,650 |
| Renter-Occupied | 12,709 (51.7%) | $49,357 |
| Average | 24,567 (100.0%) | $73,851 |
Occupancy by Householder Income Bracket in Olympia
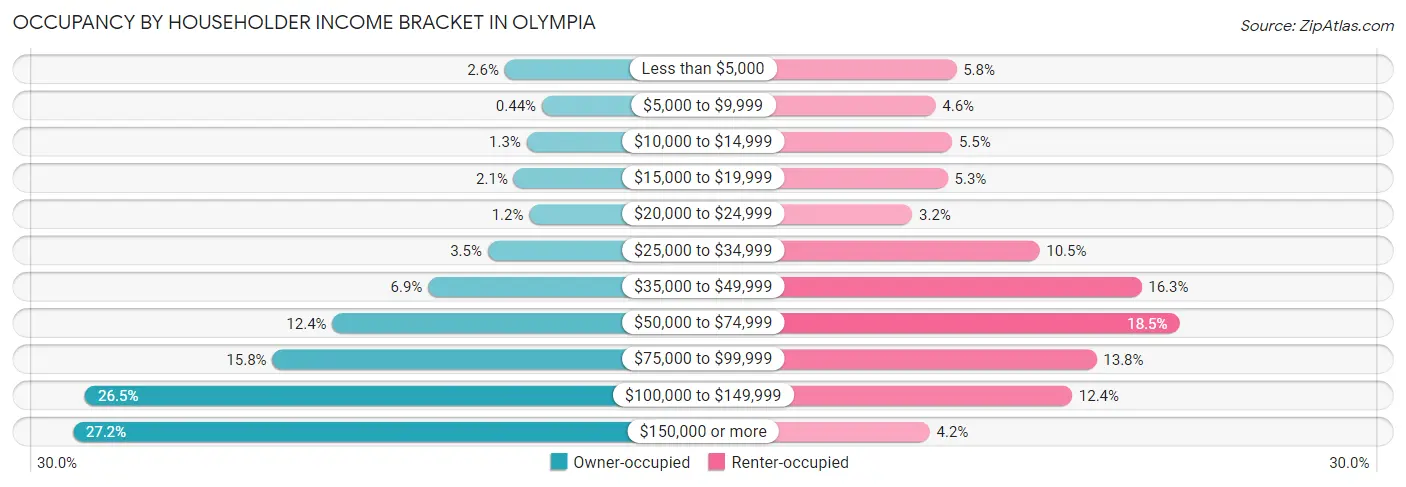
| Income Bracket | Owner-occupied | Renter-occupied |
| Less than $5,000 | 303 (2.6%) | 731 (5.8%) |
| $5,000 to $9,999 | 52 (0.4%) | 580 (4.6%) |
| $10,000 to $14,999 | 155 (1.3%) | 700 (5.5%) |
| $15,000 to $19,999 | 243 (2.1%) | 669 (5.3%) |
| $20,000 to $24,999 | 137 (1.2%) | 411 (3.2%) |
| $25,000 to $34,999 | 419 (3.5%) | 1,334 (10.5%) |
| $35,000 to $49,999 | 823 (6.9%) | 2,075 (16.3%) |
| $50,000 to $74,999 | 1,471 (12.4%) | 2,351 (18.5%) |
| $75,000 to $99,999 | 1,878 (15.8%) | 1,749 (13.8%) |
| $100,000 to $149,999 | 3,147 (26.5%) | 1,571 (12.4%) |
| $150,000 or more | 3,230 (27.2%) | 538 (4.2%) |
| Total | 11,858 (100.0%) | 12,709 (100.0%) |
Monthly Housing Cost Tiers in Olympia
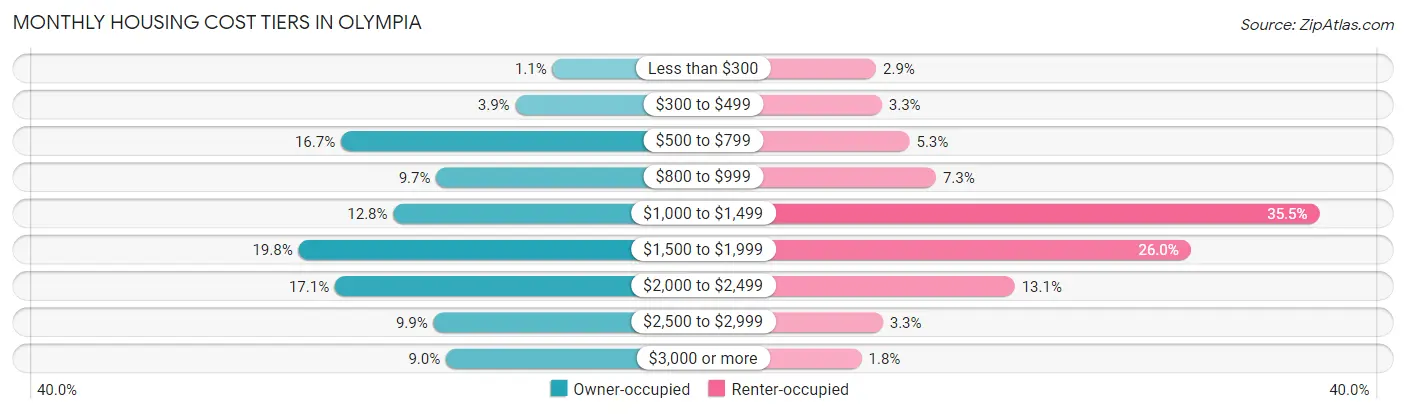
| Monthly Cost | Owner-occupied | Renter-occupied |
| Less than $300 | 133 (1.1%) | 362 (2.9%) |
| $300 to $499 | 456 (3.8%) | 416 (3.3%) |
| $500 to $799 | 1,980 (16.7%) | 675 (5.3%) |
| $800 to $999 | 1,148 (9.7%) | 923 (7.3%) |
| $1,000 to $1,499 | 1,522 (12.8%) | 4,511 (35.5%) |
| $1,500 to $1,999 | 2,351 (19.8%) | 3,306 (26.0%) |
| $2,000 to $2,499 | 2,033 (17.1%) | 1,660 (13.1%) |
| $2,500 to $2,999 | 1,172 (9.9%) | 425 (3.3%) |
| $3,000 or more | 1,063 (9.0%) | 226 (1.8%) |
| Total | 11,858 (100.0%) | 12,709 (100.0%) |
Physical Housing Characteristics in Olympia
Housing Structures in Olympia
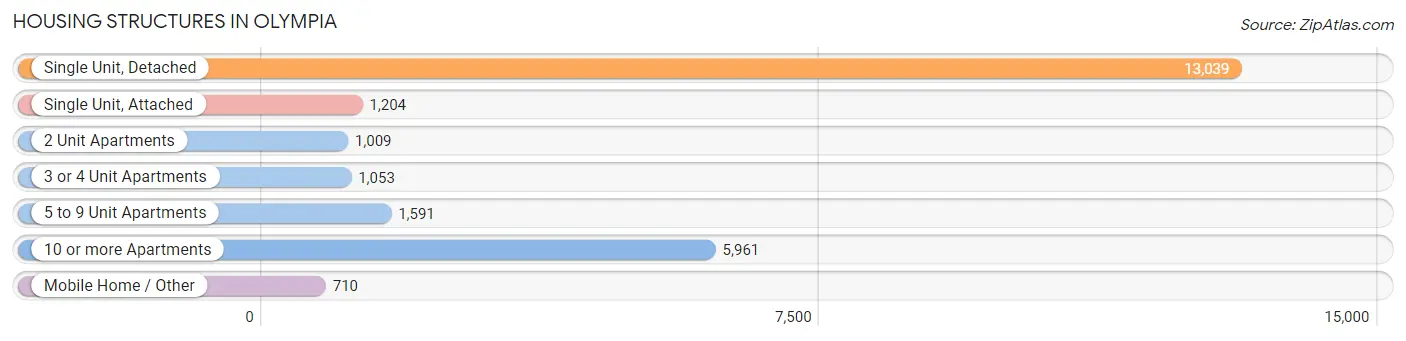
| Structure Type | # Housing Units | % Housing Units |
| Single Unit, Detached | 13,039 | 53.1% |
| Single Unit, Attached | 1,204 | 4.9% |
| 2 Unit Apartments | 1,009 | 4.1% |
| 3 or 4 Unit Apartments | 1,053 | 4.3% |
| 5 to 9 Unit Apartments | 1,591 | 6.5% |
| 10 or more Apartments | 5,961 | 24.3% |
| Mobile Home / Other | 710 | 2.9% |
| Total | 24,567 | 100.0% |
Housing Structures by Occupancy in Olympia
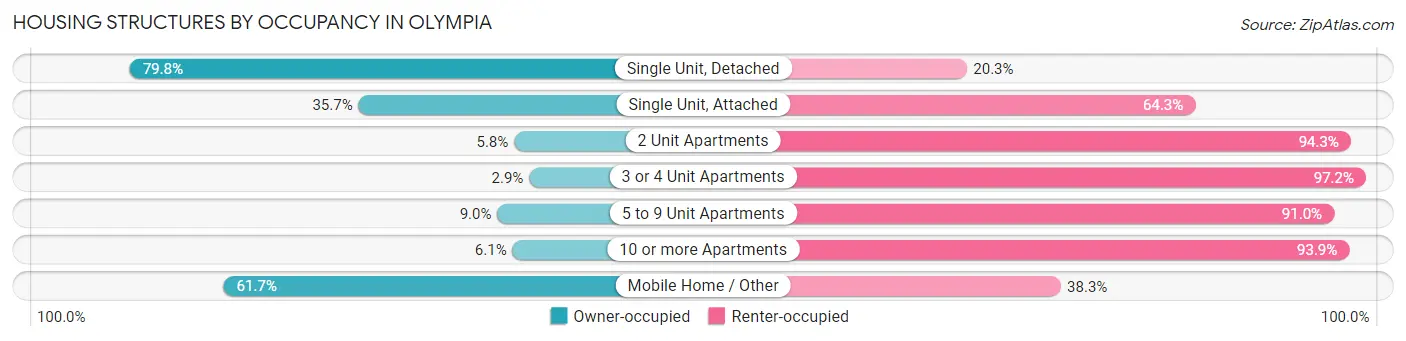
| Structure Type | Owner-occupied | Renter-occupied |
| Single Unit, Detached | 10,398 (79.7%) | 2,641 (20.3%) |
| Single Unit, Attached | 430 (35.7%) | 774 (64.3%) |
| 2 Unit Apartments | 58 (5.8%) | 951 (94.3%) |
| 3 or 4 Unit Apartments | 30 (2.9%) | 1,023 (97.2%) |
| 5 to 9 Unit Apartments | 143 (9.0%) | 1,448 (91.0%) |
| 10 or more Apartments | 361 (6.1%) | 5,600 (93.9%) |
| Mobile Home / Other | 438 (61.7%) | 272 (38.3%) |
| Total | 11,858 (48.3%) | 12,709 (51.7%) |
Housing Structures by Number of Rooms in Olympia
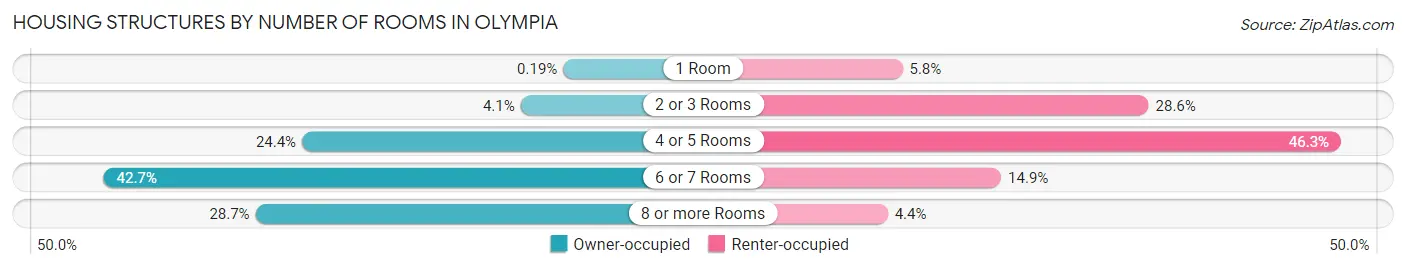
| Number of Rooms | Owner-occupied | Renter-occupied |
| 1 Room | 22 (0.2%) | 736 (5.8%) |
| 2 or 3 Rooms | 490 (4.1%) | 3,628 (28.5%) |
| 4 or 5 Rooms | 2,887 (24.3%) | 5,888 (46.3%) |
| 6 or 7 Rooms | 5,062 (42.7%) | 1,895 (14.9%) |
| 8 or more Rooms | 3,397 (28.6%) | 562 (4.4%) |
| Total | 11,858 (100.0%) | 12,709 (100.0%) |
Housing Structure by Heating Type in Olympia
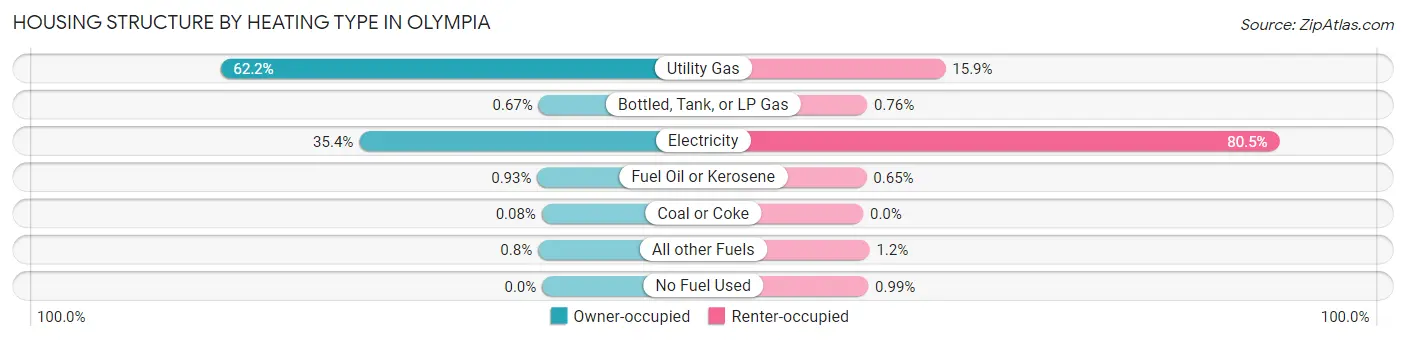
| Heating Type | Owner-occupied | Renter-occupied |
| Utility Gas | 7,372 (62.2%) | 2,022 (15.9%) |
| Bottled, Tank, or LP Gas | 80 (0.7%) | 96 (0.8%) |
| Electricity | 4,192 (35.3%) | 10,225 (80.4%) |
| Fuel Oil or Kerosene | 110 (0.9%) | 83 (0.6%) |
| Coal or Coke | 9 (0.1%) | 0 (0.0%) |
| All other Fuels | 95 (0.8%) | 157 (1.2%) |
| No Fuel Used | 0 (0.0%) | 126 (1.0%) |
| Total | 11,858 (100.0%) | 12,709 (100.0%) |
Household Vehicle Usage in Olympia
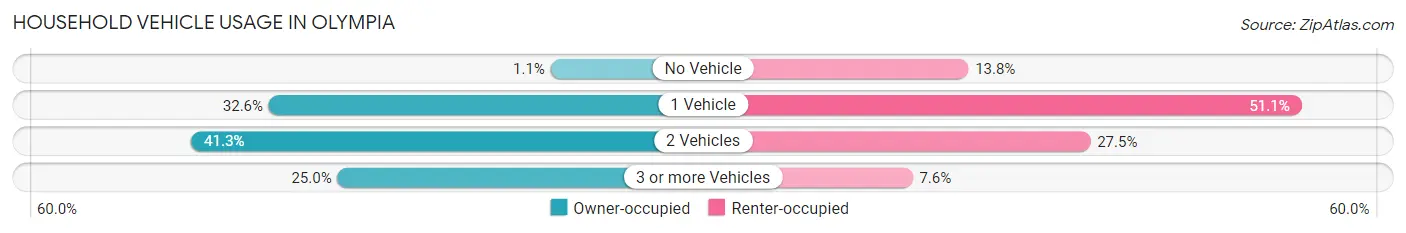
| Vehicles per Household | Owner-occupied | Renter-occupied |
| No Vehicle | 127 (1.1%) | 1,755 (13.8%) |
| 1 Vehicle | 3,870 (32.6%) | 6,500 (51.1%) |
| 2 Vehicles | 4,902 (41.3%) | 3,492 (27.5%) |
| 3 or more Vehicles | 2,959 (24.9%) | 962 (7.6%) |
| Total | 11,858 (100.0%) | 12,709 (100.0%) |
Real Estate & Mortgages in Olympia
Real Estate and Mortgage Overview in Olympia
| Characteristic | Without Mortgage | With Mortgage |
| Housing Units | 4,322 | 7,536 |
| Median Property Value | $382,500 | $424,000 |
| Median Household Income | $85,147 | $2,434 |
| Monthly Housing Costs | $759 | $1,063 |
| Real Estate Taxes | $3,848 | $23 |
Property Value by Mortgage Status in Olympia
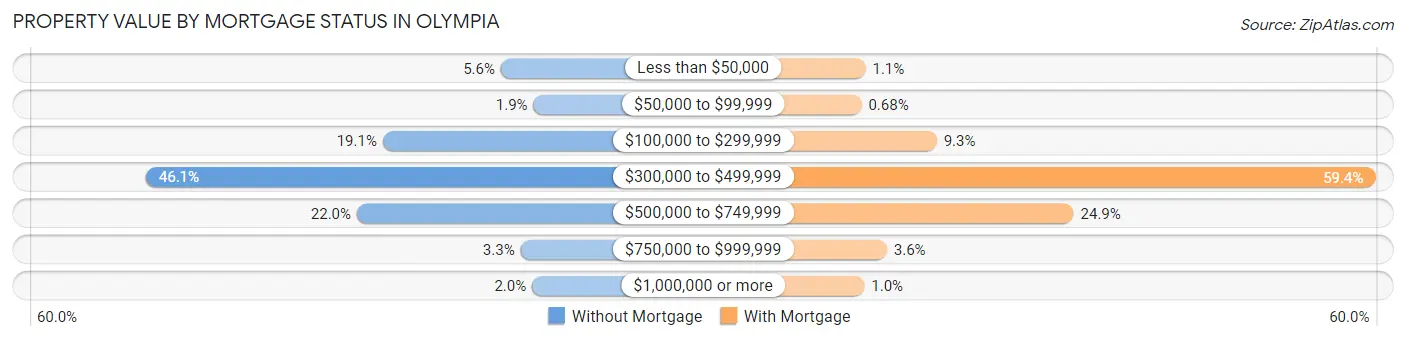
| Property Value | Without Mortgage | With Mortgage |
| Less than $50,000 | 241 (5.6%) | 86 (1.1%) |
| $50,000 to $99,999 | 80 (1.8%) | 51 (0.7%) |
| $100,000 to $299,999 | 824 (19.1%) | 699 (9.3%) |
| $300,000 to $499,999 | 1,994 (46.1%) | 4,476 (59.4%) |
| $500,000 to $749,999 | 952 (22.0%) | 1,878 (24.9%) |
| $750,000 to $999,999 | 144 (3.3%) | 270 (3.6%) |
| $1,000,000 or more | 87 (2.0%) | 76 (1.0%) |
| Total | 4,322 (100.0%) | 7,536 (100.0%) |
Household Income by Mortgage Status in Olympia
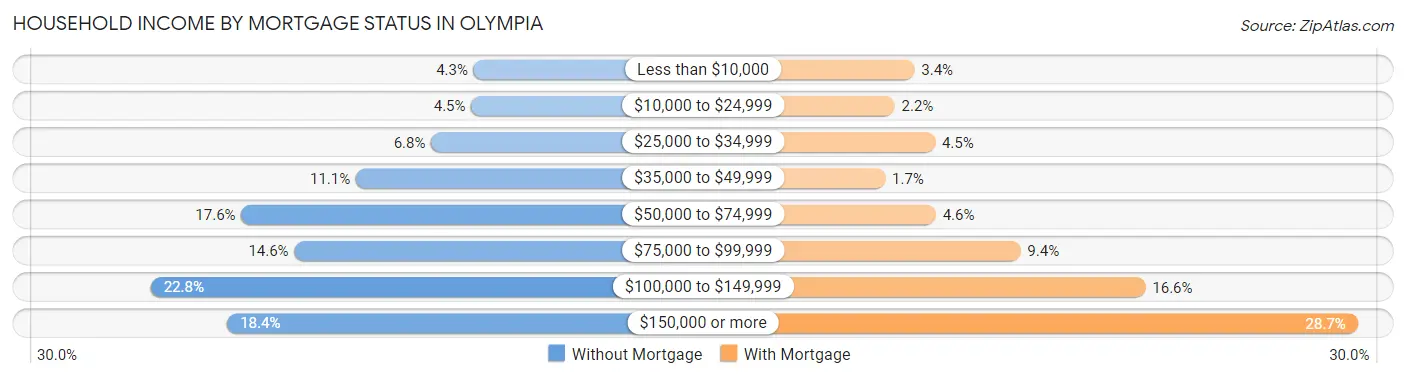
| Household Income | Without Mortgage | With Mortgage |
| Less than $10,000 | 187 (4.3%) | 253 (3.4%) |
| $10,000 to $24,999 | 193 (4.5%) | 168 (2.2%) |
| $25,000 to $34,999 | 292 (6.8%) | 342 (4.5%) |
| $35,000 to $49,999 | 478 (11.1%) | 127 (1.7%) |
| $50,000 to $74,999 | 761 (17.6%) | 345 (4.6%) |
| $75,000 to $99,999 | 630 (14.6%) | 710 (9.4%) |
| $100,000 to $149,999 | 985 (22.8%) | 1,248 (16.6%) |
| $150,000 or more | 796 (18.4%) | 2,162 (28.7%) |
| Total | 4,322 (100.0%) | 7,536 (100.0%) |
Property Value to Household Income Ratio in Olympia
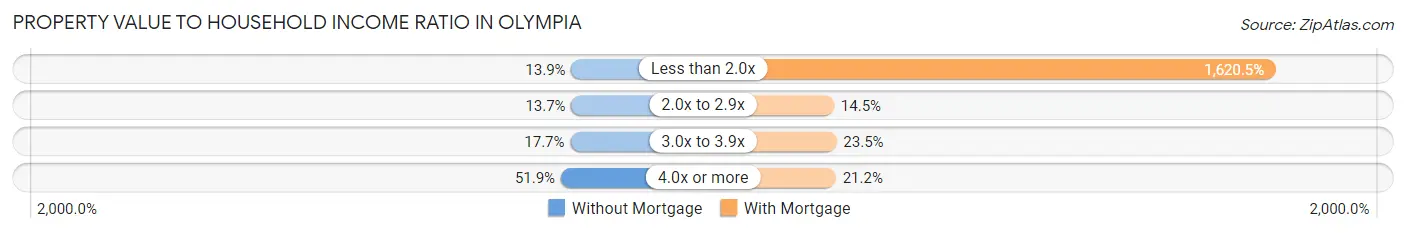
| Value-to-Income Ratio | Without Mortgage | With Mortgage |
| Less than 2.0x | 600 (13.9%) | 122,118 (1,620.5%) |
| 2.0x to 2.9x | 592 (13.7%) | 1,090 (14.5%) |
| 3.0x to 3.9x | 764 (17.7%) | 1,773 (23.5%) |
| 4.0x or more | 2,243 (51.9%) | 1,598 (21.2%) |
| Total | 4,322 (100.0%) | 7,536 (100.0%) |
Real Estate Taxes by Mortgage Status in Olympia
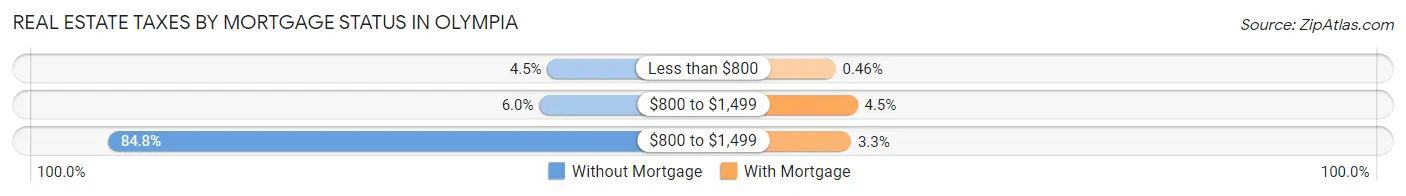
| Property Taxes | Without Mortgage | With Mortgage |
| Less than $800 | 195 (4.5%) | 35 (0.5%) |
| $800 to $1,499 | 259 (6.0%) | 337 (4.5%) |
| $800 to $1,499 | 3,665 (84.8%) | 247 (3.3%) |
| Total | 4,322 (100.0%) | 7,536 (100.0%) |
Health & Disability in Olympia
Health Insurance Coverage by Age in Olympia
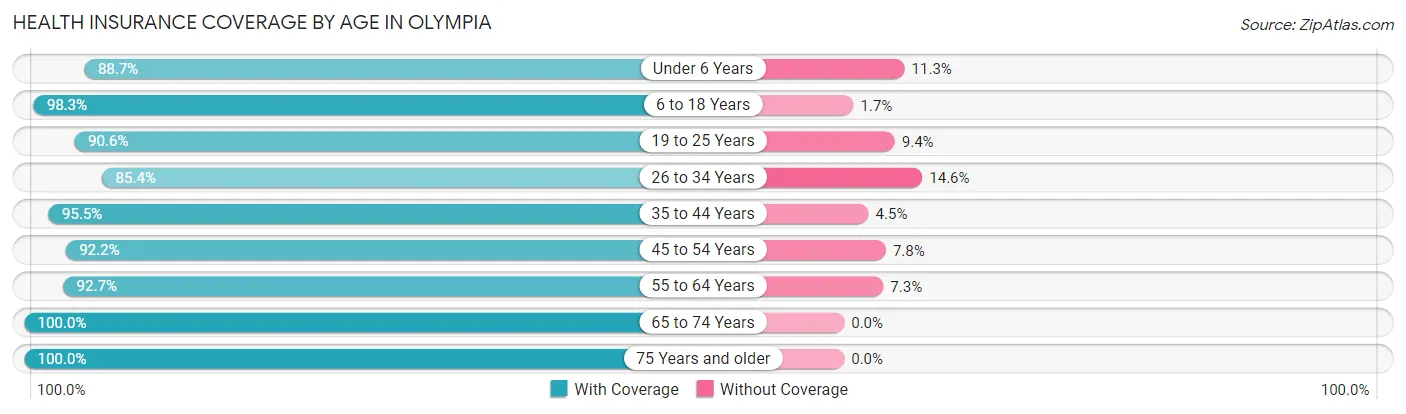
| Age Bracket | With Coverage | Without Coverage |
| Under 6 Years | 2,917 (88.7%) | 370 (11.3%) |
| 6 to 18 Years | 8,000 (98.3%) | 141 (1.7%) |
| 19 to 25 Years | 4,232 (90.6%) | 440 (9.4%) |
| 26 to 34 Years | 6,761 (85.4%) | 1,152 (14.6%) |
| 35 to 44 Years | 7,744 (95.5%) | 368 (4.5%) |
| 45 to 54 Years | 5,402 (92.2%) | 455 (7.8%) |
| 55 to 64 Years | 5,506 (92.7%) | 433 (7.3%) |
| 65 to 74 Years | 6,081 (100.0%) | 0 (0.0%) |
| 75 Years and older | 4,082 (100.0%) | 0 (0.0%) |
| Total | 50,725 (93.8%) | 3,359 (6.2%) |
Health Insurance Coverage by Citizenship Status in Olympia
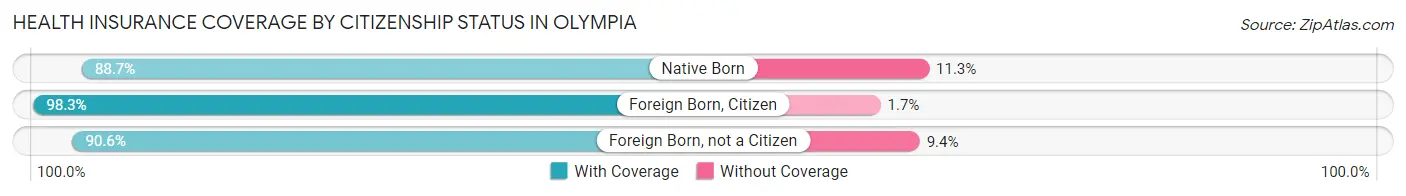
| Citizenship Status | With Coverage | Without Coverage |
| Native Born | 2,917 (88.7%) | 370 (11.3%) |
| Foreign Born, Citizen | 8,000 (98.3%) | 141 (1.7%) |
| Foreign Born, not a Citizen | 4,232 (90.6%) | 440 (9.4%) |
Health Insurance Coverage by Household Income in Olympia
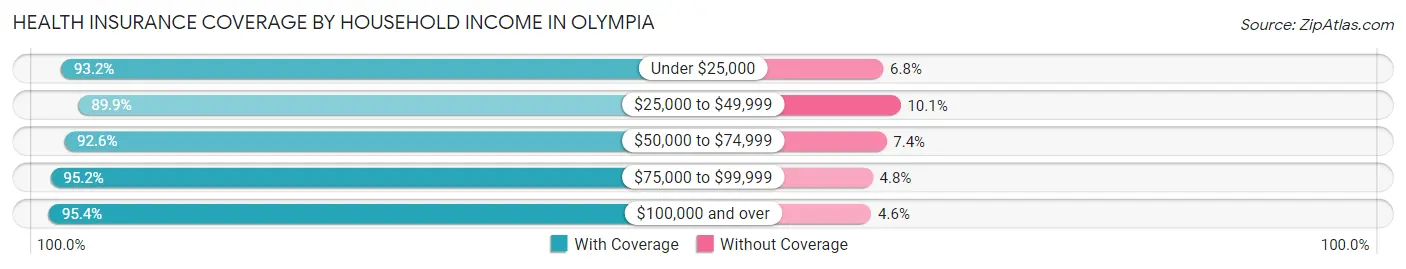
| Household Income | With Coverage | Without Coverage |
| Under $25,000 | 5,653 (93.2%) | 413 (6.8%) |
| $25,000 to $49,999 | 7,748 (89.9%) | 867 (10.1%) |
| $50,000 to $74,999 | 7,046 (92.6%) | 564 (7.4%) |
| $75,000 to $99,999 | 7,636 (95.2%) | 388 (4.8%) |
| $100,000 and over | 22,314 (95.4%) | 1,067 (4.6%) |
Public vs Private Health Insurance Coverage by Age in Olympia
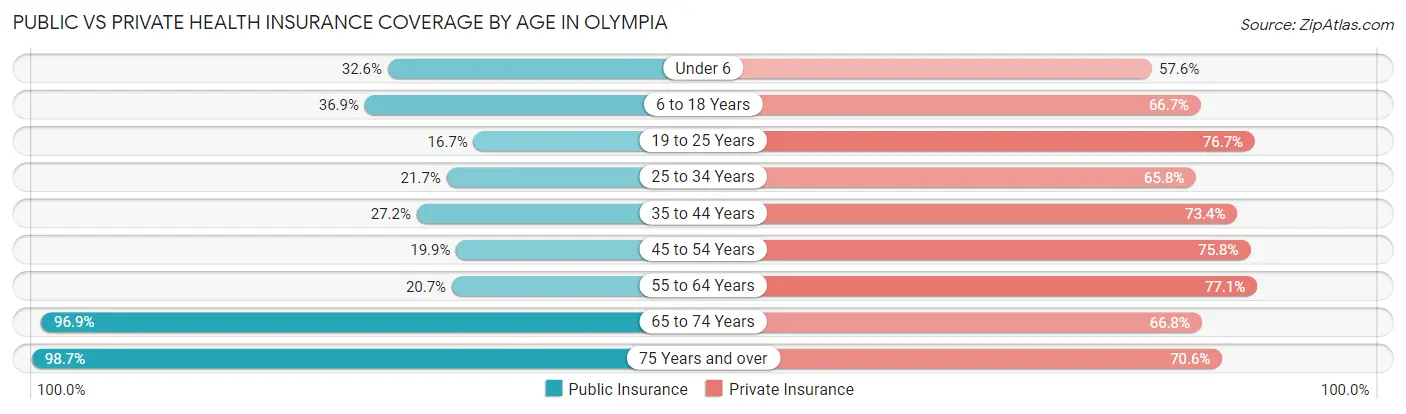
| Age Bracket | Public Insurance | Private Insurance |
| Under 6 | 1,071 (32.6%) | 1,893 (57.6%) |
| 6 to 18 Years | 3,000 (36.8%) | 5,427 (66.7%) |
| 19 to 25 Years | 778 (16.7%) | 3,582 (76.7%) |
| 25 to 34 Years | 1,714 (21.7%) | 5,204 (65.8%) |
| 35 to 44 Years | 2,207 (27.2%) | 5,954 (73.4%) |
| 45 to 54 Years | 1,164 (19.9%) | 4,441 (75.8%) |
| 55 to 64 Years | 1,228 (20.7%) | 4,577 (77.1%) |
| 65 to 74 Years | 5,894 (96.9%) | 4,064 (66.8%) |
| 75 Years and over | 4,027 (98.7%) | 2,882 (70.6%) |
| Total | 21,083 (39.0%) | 38,024 (70.3%) |
Disability Status by Sex by Age in Olympia
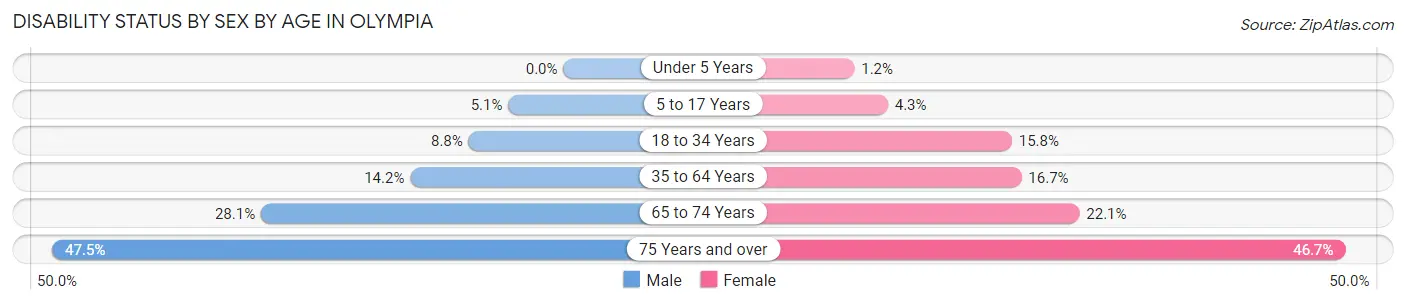
| Age Bracket | Male | Female |
| Under 5 Years | 0 (0.0%) | 12 (1.2%) |
| 5 to 17 Years | 228 (5.1%) | 140 (4.3%) |
| 18 to 34 Years | 608 (8.8%) | 1,038 (15.8%) |
| 35 to 64 Years | 1,316 (14.2%) | 1,775 (16.7%) |
| 65 to 74 Years | 739 (28.1%) | 760 (22.1%) |
| 75 Years and over | 698 (47.4%) | 1,220 (46.7%) |
Disability Class by Sex by Age in Olympia
Disability Class: Hearing Difficulty
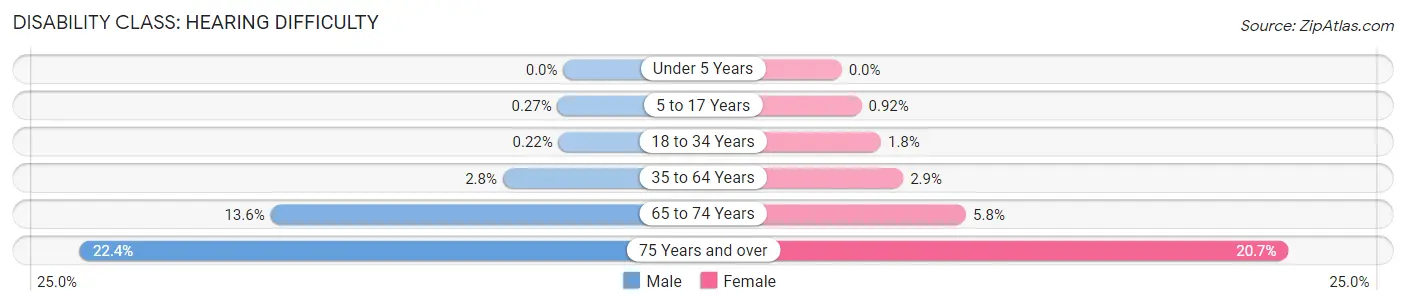
| Age Bracket | Male | Female |
| Under 5 Years | 0 (0.0%) | 0 (0.0%) |
| 5 to 17 Years | 12 (0.3%) | 30 (0.9%) |
| 18 to 34 Years | 15 (0.2%) | 120 (1.8%) |
| 35 to 64 Years | 260 (2.8%) | 303 (2.9%) |
| 65 to 74 Years | 358 (13.6%) | 199 (5.8%) |
| 75 Years and over | 330 (22.4%) | 541 (20.7%) |
Disability Class: Vision Difficulty
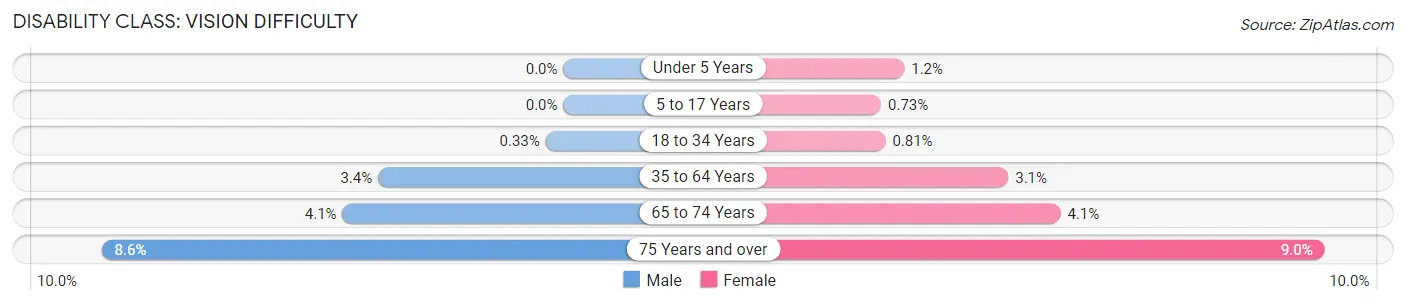
| Age Bracket | Male | Female |
| Under 5 Years | 0 (0.0%) | 12 (1.2%) |
| 5 to 17 Years | 0 (0.0%) | 24 (0.7%) |
| 18 to 34 Years | 23 (0.3%) | 53 (0.8%) |
| 35 to 64 Years | 319 (3.4%) | 329 (3.1%) |
| 65 to 74 Years | 108 (4.1%) | 140 (4.1%) |
| 75 Years and over | 126 (8.6%) | 234 (9.0%) |
Disability Class: Cognitive Difficulty
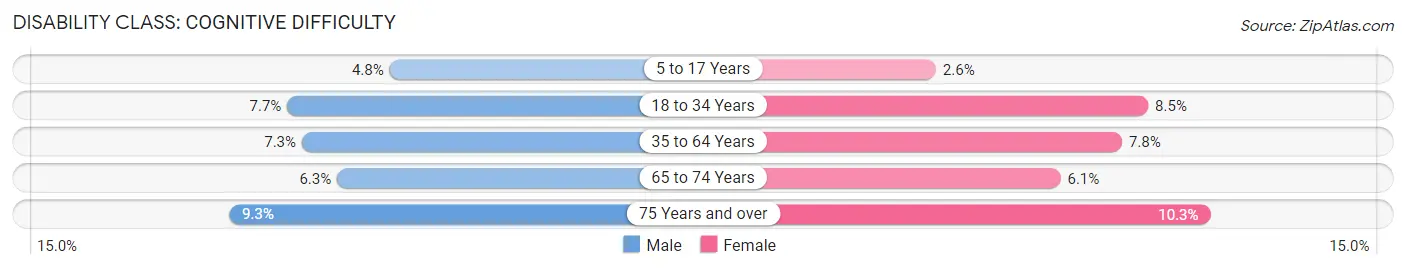
| Age Bracket | Male | Female |
| 5 to 17 Years | 216 (4.8%) | 86 (2.6%) |
| 18 to 34 Years | 532 (7.7%) | 561 (8.5%) |
| 35 to 64 Years | 674 (7.3%) | 830 (7.8%) |
| 65 to 74 Years | 166 (6.3%) | 210 (6.1%) |
| 75 Years and over | 137 (9.3%) | 268 (10.3%) |
Disability Class: Ambulatory Difficulty
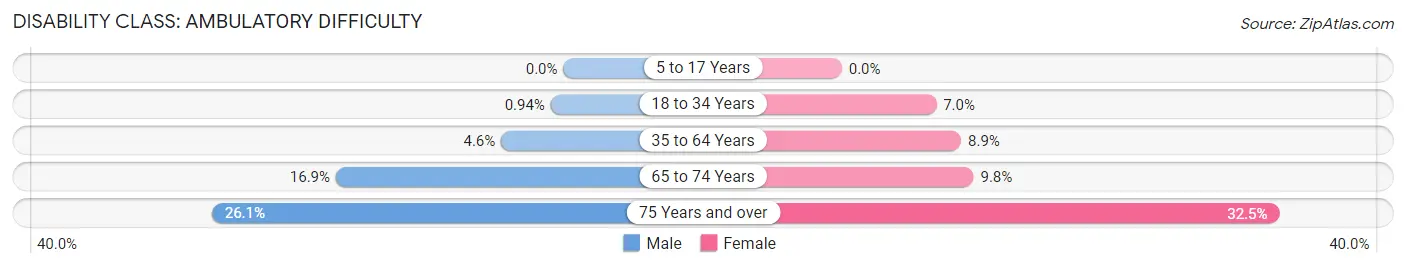
| Age Bracket | Male | Female |
| 5 to 17 Years | 0 (0.0%) | 0 (0.0%) |
| 18 to 34 Years | 65 (0.9%) | 461 (7.0%) |
| 35 to 64 Years | 428 (4.6%) | 943 (8.9%) |
| 65 to 74 Years | 445 (16.9%) | 337 (9.8%) |
| 75 Years and over | 384 (26.1%) | 848 (32.5%) |
Disability Class: Self-Care Difficulty
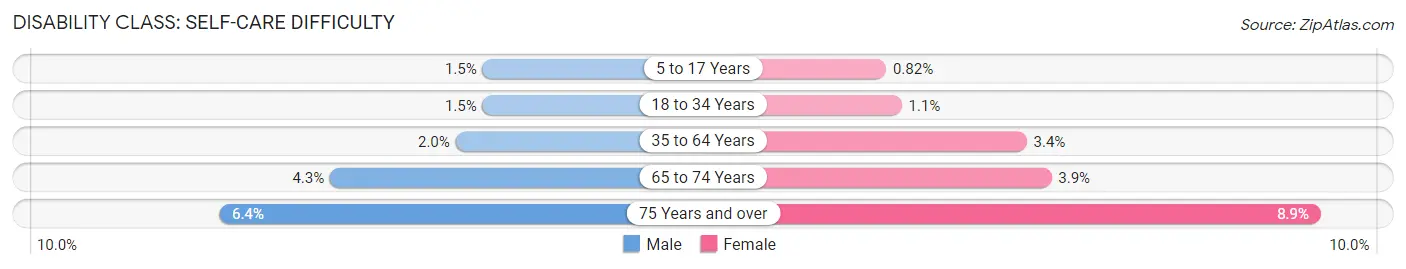
| Age Bracket | Male | Female |
| 5 to 17 Years | 67 (1.5%) | 27 (0.8%) |
| 18 to 34 Years | 104 (1.5%) | 73 (1.1%) |
| 35 to 64 Years | 185 (2.0%) | 365 (3.4%) |
| 65 to 74 Years | 114 (4.3%) | 134 (3.9%) |
| 75 Years and over | 94 (6.4%) | 232 (8.9%) |
Technology Access in Olympia
Computing Device Access in Olympia
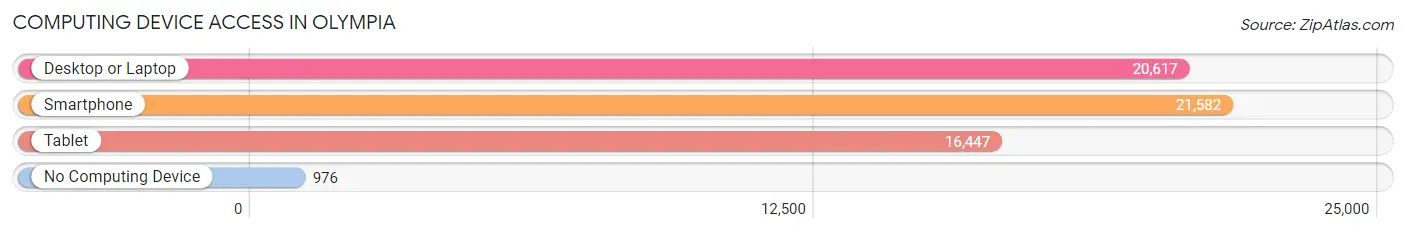
| Device Type | # Households | % Households |
| Desktop or Laptop | 20,617 | 83.9% |
| Smartphone | 21,582 | 87.8% |
| Tablet | 16,447 | 66.9% |
| No Computing Device | 976 | 4.0% |
| Total | 24,567 | 100.0% |
Internet Access in Olympia
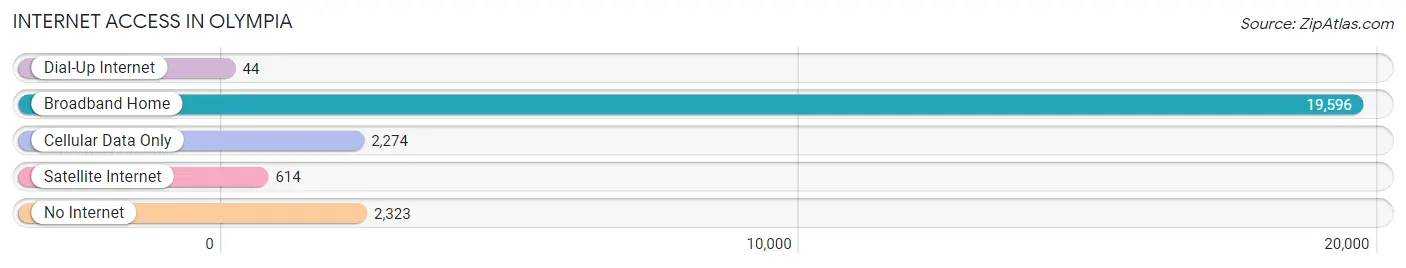
| Internet Type | # Households | % Households |
| Dial-Up Internet | 44 | 0.2% |
| Broadband Home | 19,596 | 79.8% |
| Cellular Data Only | 2,274 | 9.3% |
| Satellite Internet | 614 | 2.5% |
| No Internet | 2,323 | 9.5% |
| Total | 24,567 | 100.0% |
Olympia Summary
Olympia is the capital of the state of Washington and the county seat of Thurston County. It is located in the Puget Sound region of the Pacific Northwest, approximately 60 miles southwest of Seattle. Olympia is the largest city in Thurston County and the third largest in the state, with a population of approximately 46,000 in 2000.
History
The area that is now Olympia was inhabited by Native Americans for thousands of years before the arrival of European settlers. The first recorded European exploration of the area was by the Spanish explorer Francisco de Eliza in 1792. The first permanent European settlement was established in 1846 by the Hudson’s Bay Company. The settlement was named Olympia after the nearby Olympic Mountains.
In 1853, Olympia was officially incorporated as a city. During the late 19th century, Olympia became a center for logging and lumber production. The city also became a major port for the export of goods to the Pacific Coast and Asia.
In 1889, Washington became the 42nd state in the Union and Olympia was chosen as the state capital. The city experienced a period of rapid growth in the early 20th century, with the population increasing from 4,000 in 1900 to over 20,000 by 1930.
Geography
Olympia is located in the Puget Sound region of the Pacific Northwest, approximately 60 miles southwest of Seattle. The city is situated on the southern end of Puget Sound, at the eastern base of the Olympic Mountains. The city is bordered by the Deschutes River to the north and the Budd Inlet to the south.
The city has a total area of 28.2 square miles, of which 26.2 square miles is land and 2.0 square miles is water. The city is located at an elevation of approximately 200 feet above sea level.
Economy
Olympia’s economy is largely based on government and services. The city is home to the state government, as well as several state agencies and departments. The city is also home to several large employers, including the Olympia School District, Providence St. Peter Hospital, and the State of Washington.
The city is also home to several large retail and commercial businesses, including the Olympia Auto Mall, Olympia Regional Airport, and the Olympia Shopping Center.
Demographics
As of the 2000 census, there were 46,478 people, 18,976 households, and 10,845 families residing in the city. The population density was 1,769.3 people per square mile. There were 19,890 housing units at an average density of 754.3 per square mile.
The racial makeup of the city was 81.2% White, 5.2% African American, 0.9% Native American, 4.2% Asian, 0.2% Pacific Islander, 4.3% from other races, and 4.0% from two or more races. Hispanic or Latino of any race were 8.2% of the population.
The median income for a household in the city was $41,945, and the median income for a family was $51,919. Males had a median income of $40,890 versus $30,945 for females. The per capita income for the city was $22,945. About 8.2% of families and 11.7% of the population were below the poverty line, including 15.2% of those under age 18 and 6.7% of those age 65 or over.
Common Questions
What is the Total Population of Olympia?
Total Population of Olympia is 55,151.
What is the Total Male Population of Olympia?
Total Male Population of Olympia is 27,195.
What is the Total Female Population of Olympia?
Total Female Population of Olympia is 27,956.
What is the Ratio of Males per 100 Females in Olympia?
There are 97.28 Males per 100 Females in Olympia.
What is the Ratio of Females per 100 Males in Olympia?
There are 102.80 Females per 100 Males in Olympia.
What is the Median Population Age in Olympia?
Median Population Age in Olympia is 38.7 Years.
What is the Average Family Size in Olympia
Average Family Size in Olympia is 2.9 People.
What is the Average Household Size in Olympia
Average Household Size in Olympia is 2.2 People.
What is Per Capita Income in Olympia?
Per Capita income in Olympia is $41,904.
What is the Median Family Income in Olympia?
Median Family Income in Olympia is $95,617.
What is the Median Household income in Olympia?
Median Household Income in Olympia is $73,851.
What is Income or Wage Gap in Olympia?
Income or Wage Gap in Olympia is 18.2%.
Women in Olympia earn 81.8 cents for every dollar earned by a man.
What is Family Income Deficit in Olympia?
Family Income Deficit in Olympia is $12,582.
Families that are below poverty line in Olympia earn $12,582 less on average than the poverty threshold level.
What is Inequality or Gini Index in Olympia?
Inequality or Gini Index in Olympia is 0.44.
How Large is the Labor Force in Olympia?
There are 28,671 People in the Labor Forcein in Olympia.
What is the Percentage of People in the Labor Force in Olympia?
61.9% of People are in the Labor Force in Olympia.
What is the Unemployment Rate in Olympia?
Unemployment Rate in Olympia is 6.9%.