Tumwater, WA
Tumwater Map
Tumwater Overview
25,617
TOTAL POPULATION
12,211
MALE POPULATION
13,406
FEMALE POPULATION
91.09
MALES / 100 FEMALES
109.79
FEMALES / 100 MALES
36.5
MEDIAN AGE
3.1
AVG FAMILY SIZE
2.5
AVG HOUSEHOLD SIZE
$41,882
PER CAPITA INCOME
$103,315
AVG FAMILY INCOME
$84,177
AVG HOUSEHOLD INCOME
19.0%
WAGE / INCOME GAP [ % ]
81.0¢/ $1
WAGE / INCOME GAP [ $ ]
0.41
INEQUALITY / GINI INDEX
13,831
LABOR FORCE [ PEOPLE ]
66.7%
PERCENT IN LABOR FORCE
5.7%
UNEMPLOYMENT RATE
Tumwater Area Codes
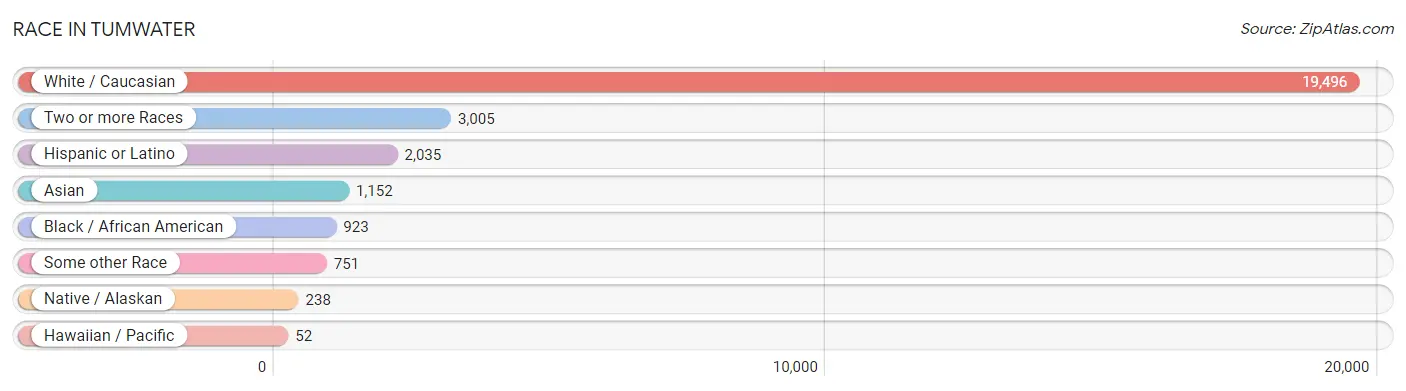
Race in Tumwater
The most populous races in Tumwater are White / Caucasian (19,496 | 76.1%), Two or more Races (3,005 | 11.7%), and Hispanic or Latino (2,035 | 7.9%).
| Race | # Population | % Population |
| Asian | 1,152 | 4.5% |
| Black / African American | 923 | 3.6% |
| Hawaiian / Pacific | 52 | 0.2% |
| Hispanic or Latino | 2,035 | 7.9% |
| Native / Alaskan | 238 | 0.9% |
| White / Caucasian | 19,496 | 76.1% |
| Two or more Races | 3,005 | 11.7% |
| Some other Race | 751 | 2.9% |
| Total | 25,617 | 100.0% |
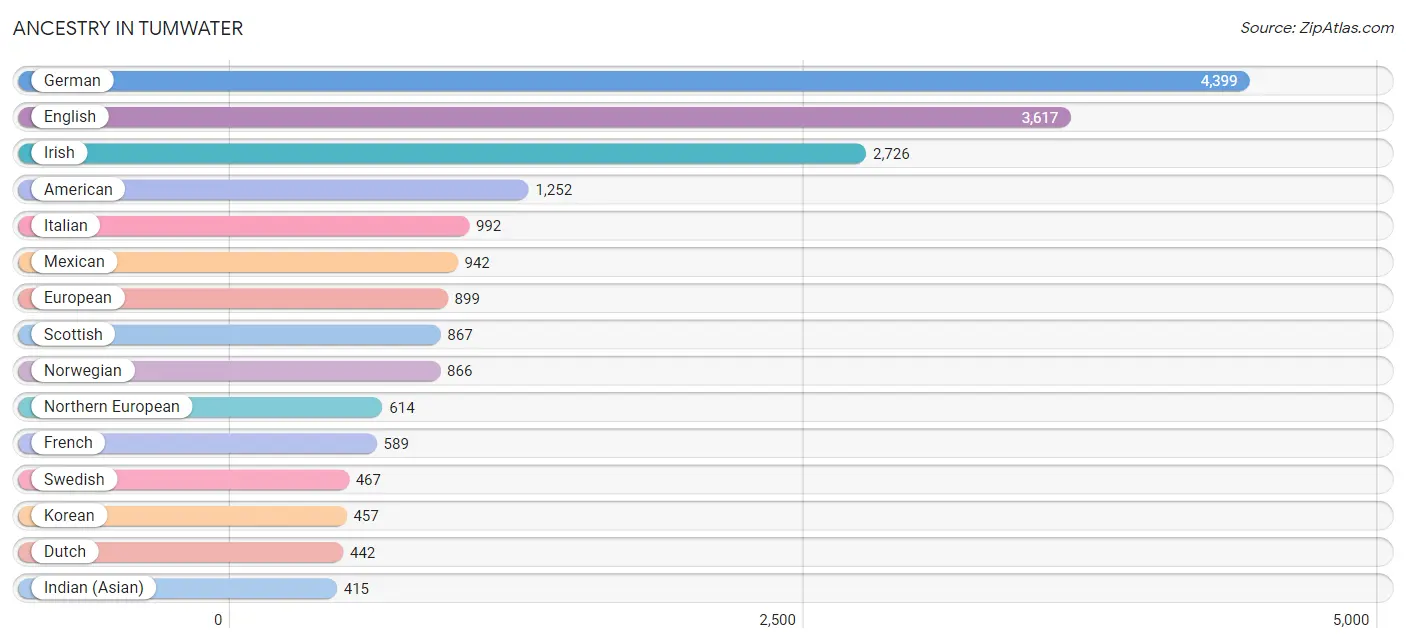
Ancestry in Tumwater
The most populous ancestries reported in Tumwater are German (4,399 | 17.2%), English (3,617 | 14.1%), Irish (2,726 | 10.6%), American (1,252 | 4.9%), and Italian (992 | 3.9%), together accounting for 50.7% of all Tumwater residents.
| Ancestry | # Population | % Population |
| Afghan | 7 | 0.0% |
| African | 116 | 0.4% |
| Aleut | 47 | 0.2% |
| American | 1,252 | 4.9% |
| Arab | 117 | 0.5% |
| Armenian | 27 | 0.1% |
| Australian | 23 | 0.1% |
| Austrian | 87 | 0.3% |
| Basque | 14 | 0.1% |
| Belgian | 52 | 0.2% |
| Bhutanese | 345 | 1.3% |
| Blackfeet | 71 | 0.3% |
| Brazilian | 28 | 0.1% |
| British | 240 | 0.9% |
| Burmese | 370 | 1.4% |
| Canadian | 56 | 0.2% |
| Central American | 220 | 0.9% |
| Central American Indian | 10 | 0.0% |
| Cherokee | 160 | 0.6% |
| Chickasaw | 7 | 0.0% |
| Chilean | 46 | 0.2% |
| Chippewa | 1 | 0.0% |
| Choctaw | 45 | 0.2% |
| Colombian | 131 | 0.5% |
| Comanche | 41 | 0.2% |
| Cree | 7 | 0.0% |
| Creek | 37 | 0.1% |
| Croatian | 26 | 0.1% |
| Cuban | 88 | 0.3% |
| Czech | 147 | 0.6% |
| Danish | 214 | 0.8% |
| Dominican | 12 | 0.1% |
| Dutch | 442 | 1.7% |
| Eastern European | 69 | 0.3% |
| English | 3,617 | 14.1% |
| Ethiopian | 41 | 0.2% |
| European | 899 | 3.5% |
| Filipino | 75 | 0.3% |
| Finnish | 320 | 1.3% |
| French | 589 | 2.3% |
| French Canadian | 179 | 0.7% |
| German | 4,399 | 17.2% |
| Greek | 49 | 0.2% |
| Guamanian / Chamorro | 8 | 0.0% |
| Guatemalan | 77 | 0.3% |
| Haitian | 175 | 0.7% |
| Hungarian | 42 | 0.2% |
| Icelander | 18 | 0.1% |
| Indian (Asian) | 415 | 1.6% |
| Inupiat | 76 | 0.3% |
| Iranian | 10 | 0.0% |
| Iraqi | 24 | 0.1% |
| Irish | 2,726 | 10.6% |
| Italian | 992 | 3.9% |
| Jamaican | 20 | 0.1% |
| Japanese | 76 | 0.3% |
| Korean | 457 | 1.8% |
| Lebanese | 80 | 0.3% |
| Lithuanian | 16 | 0.1% |
| Mexican | 942 | 3.7% |
| Mongolian | 75 | 0.3% |
| Moroccan | 4 | 0.0% |
| Native Hawaiian | 131 | 0.5% |
| Navajo | 92 | 0.4% |
| Nigerian | 43 | 0.2% |
| Northern European | 614 | 2.4% |
| Norwegian | 866 | 3.4% |
| Pakistani | 95 | 0.4% |
| Panamanian | 51 | 0.2% |
| Polish | 347 | 1.3% |
| Portuguese | 41 | 0.2% |
| Puerto Rican | 205 | 0.8% |
| Puget Sound Salish | 39 | 0.2% |
| Romanian | 44 | 0.2% |
| Russian | 86 | 0.3% |
| Salvadoran | 92 | 0.4% |
| Scandinavian | 354 | 1.4% |
| Scotch-Irish | 258 | 1.0% |
| Scottish | 867 | 3.4% |
| Sioux | 9 | 0.0% |
| Slovak | 13 | 0.1% |
| Slovene | 24 | 0.1% |
| South American | 265 | 1.0% |
| Spaniard | 129 | 0.5% |
| Spanish | 79 | 0.3% |
| Sri Lankan | 350 | 1.4% |
| Subsaharan African | 200 | 0.8% |
| Swedish | 467 | 1.8% |
| Swiss | 13 | 0.1% |
| Syrian | 9 | 0.0% |
| Thai | 126 | 0.5% |
| Ukrainian | 32 | 0.1% |
| Venezuelan | 88 | 0.3% |
| Welsh | 285 | 1.1% | View All 94 Rows |
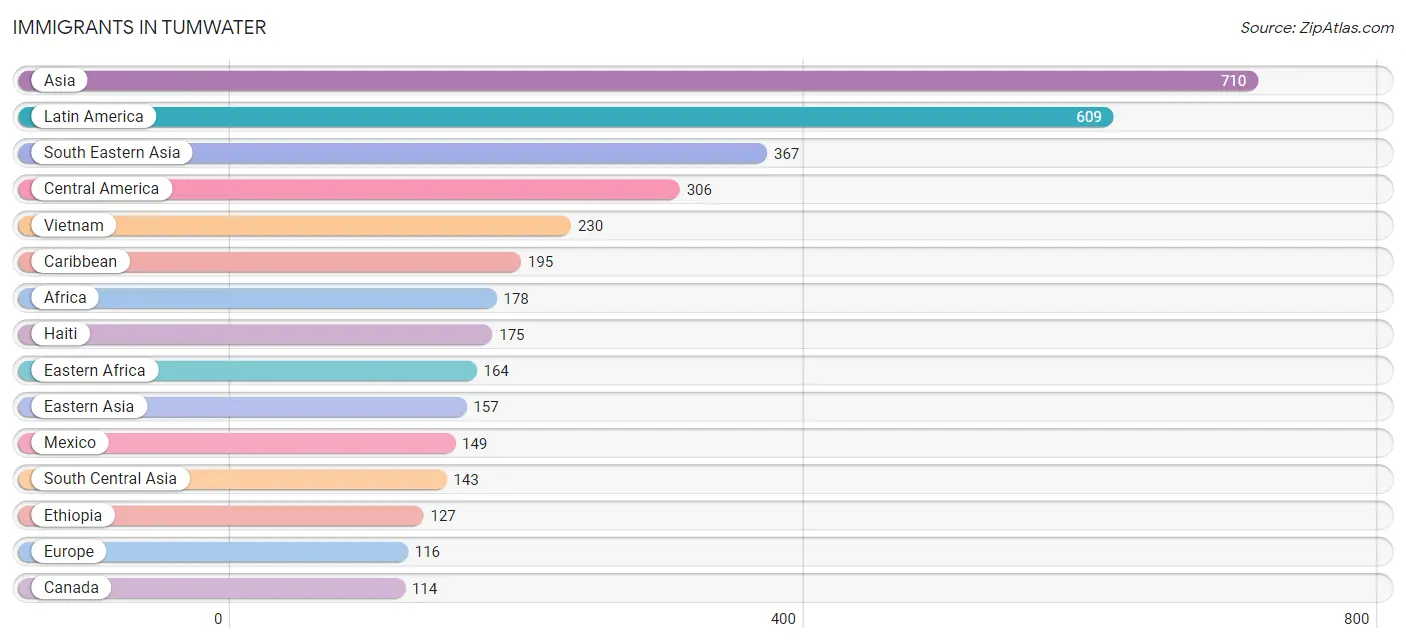
Immigrants in Tumwater
The most numerous immigrant groups reported in Tumwater came from Asia (710 | 2.8%), Latin America (609 | 2.4%), South Eastern Asia (367 | 1.4%), Central America (306 | 1.2%), and Vietnam (230 | 0.9%), together accounting for 8.7% of all Tumwater residents.
| Immigration Origin | # Population | % Population |
| Afghanistan | 7 | 0.0% |
| Africa | 178 | 0.7% |
| Asia | 710 | 2.8% |
| Canada | 114 | 0.4% |
| Caribbean | 195 | 0.8% |
| Central America | 306 | 1.2% |
| China | 68 | 0.3% |
| Colombia | 6 | 0.0% |
| Eastern Africa | 164 | 0.6% |
| Eastern Asia | 157 | 0.6% |
| Eastern Europe | 31 | 0.1% |
| El Salvador | 54 | 0.2% |
| Ethiopia | 127 | 0.5% |
| Europe | 116 | 0.4% |
| France | 10 | 0.0% |
| Germany | 37 | 0.1% |
| Guatemala | 52 | 0.2% |
| Guyana | 8 | 0.0% |
| Haiti | 175 | 0.7% |
| India | 51 | 0.2% |
| Iraq | 34 | 0.1% |
| Israel | 9 | 0.0% |
| Jamaica | 20 | 0.1% |
| Japan | 10 | 0.0% |
| Korea | 79 | 0.3% |
| Latin America | 609 | 2.4% |
| Malaysia | 43 | 0.2% |
| Mexico | 149 | 0.6% |
| Nepal | 62 | 0.2% |
| Nigeria | 14 | 0.1% |
| Northern Europe | 38 | 0.2% |
| Pakistan | 23 | 0.1% |
| Panama | 51 | 0.2% |
| Peru | 7 | 0.0% |
| Philippines | 44 | 0.2% |
| Poland | 15 | 0.1% |
| Romania | 16 | 0.1% |
| Somalia | 37 | 0.1% |
| South America | 108 | 0.4% |
| South Central Asia | 143 | 0.6% |
| South Eastern Asia | 367 | 1.4% |
| Thailand | 50 | 0.2% |
| Venezuela | 87 | 0.3% |
| Vietnam | 230 | 0.9% |
| Western Africa | 14 | 0.1% |
| Western Asia | 43 | 0.2% |
| Western Europe | 47 | 0.2% | View All 47 Rows |
Sex and Age in Tumwater
Sex and Age in Tumwater
The most populous age groups in Tumwater are 35 to 39 Years (1,245 | 10.2%) for men and 25 to 29 Years (1,430 | 10.7%) for women.
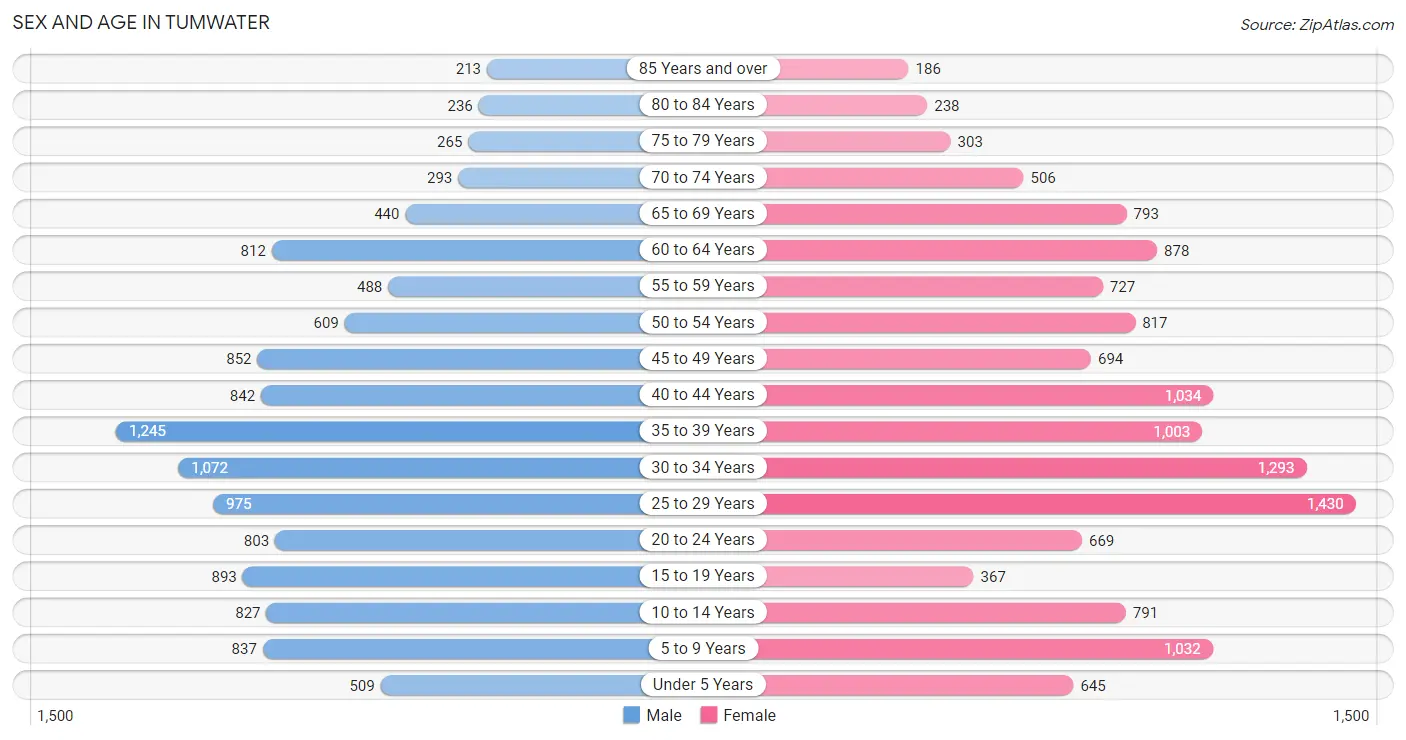
| Age Bracket | Male | Female |
| Under 5 Years | 509 (4.2%) | 645 (4.8%) |
| 5 to 9 Years | 837 (6.9%) | 1,032 (7.7%) |
| 10 to 14 Years | 827 (6.8%) | 791 (5.9%) |
| 15 to 19 Years | 893 (7.3%) | 367 (2.7%) |
| 20 to 24 Years | 803 (6.6%) | 669 (5.0%) |
| 25 to 29 Years | 975 (8.0%) | 1,430 (10.7%) |
| 30 to 34 Years | 1,072 (8.8%) | 1,293 (9.6%) |
| 35 to 39 Years | 1,245 (10.2%) | 1,003 (7.5%) |
| 40 to 44 Years | 842 (6.9%) | 1,034 (7.7%) |
| 45 to 49 Years | 852 (7.0%) | 694 (5.2%) |
| 50 to 54 Years | 609 (5.0%) | 817 (6.1%) |
| 55 to 59 Years | 488 (4.0%) | 727 (5.4%) |
| 60 to 64 Years | 812 (6.7%) | 878 (6.6%) |
| 65 to 69 Years | 440 (3.6%) | 793 (5.9%) |
| 70 to 74 Years | 293 (2.4%) | 506 (3.8%) |
| 75 to 79 Years | 265 (2.2%) | 303 (2.3%) |
| 80 to 84 Years | 236 (1.9%) | 238 (1.8%) |
| 85 Years and over | 213 (1.7%) | 186 (1.4%) |
| Total | 12,211 (100.0%) | 13,406 (100.0%) |
Families and Households in Tumwater
Median Family Size in Tumwater
The median family size in Tumwater is 3.06 persons per family, with married-couple families (4,507 | 71.7%) accounting for the largest median family size of 3.14 persons per family. On the other hand, single male/father families (508 | 8.1%) represent the smallest median family size with 2.49 persons per family.
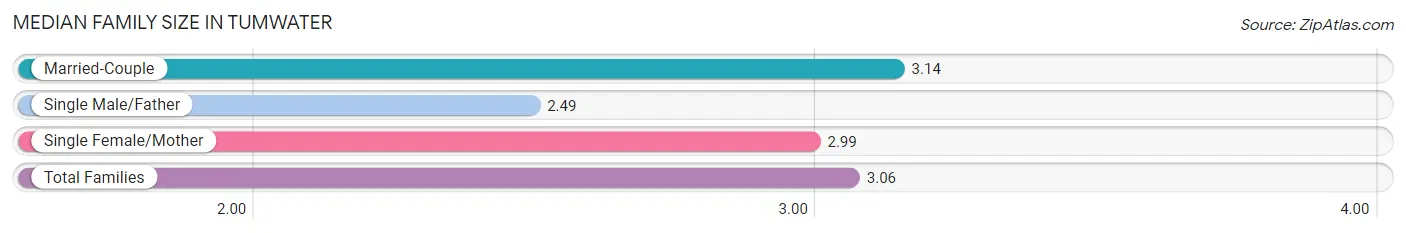
| Family Type | # Families | Family Size |
| Married-Couple | 4,507 (71.7%) | 3.14 |
| Single Male/Father | 508 (8.1%) | 2.49 |
| Single Female/Mother | 1,268 (20.2%) | 2.99 |
| Total Families | 6,283 (100.0%) | 3.06 |
Median Household Size in Tumwater
The median household size in Tumwater is 2.51 persons per household, with single female/mother households (1,268 | 12.7%) accounting for the largest median household size of 3.23 persons per household. non-family households (3,684 | 37.0%) represent the smallest median household size with 1.38 persons per household.
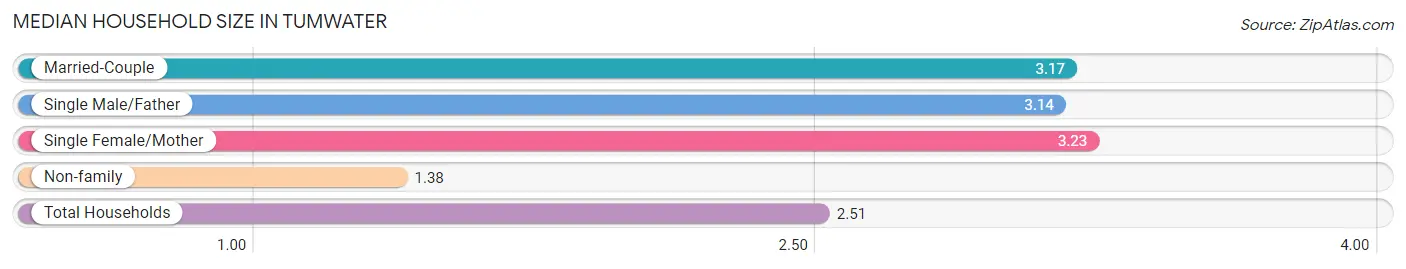
| Household Type | # Households | Household Size |
| Married-Couple | 4,507 (45.2%) | 3.17 |
| Single Male/Father | 508 (5.1%) | 3.14 |
| Single Female/Mother | 1,268 (12.7%) | 3.23 |
| Non-family | 3,684 (37.0%) | 1.38 |
| Total Households | 9,967 (100.0%) | 2.51 |
Household Size by Marriage Status in Tumwater
Out of a total of 9,967 households in Tumwater, 6,283 (63.0%) are family households, while 3,684 (37.0%) are nonfamily households. The most numerous type of family households are 2-person households, comprising 2,486, and the most common type of nonfamily households are 1-person households, comprising 2,659.
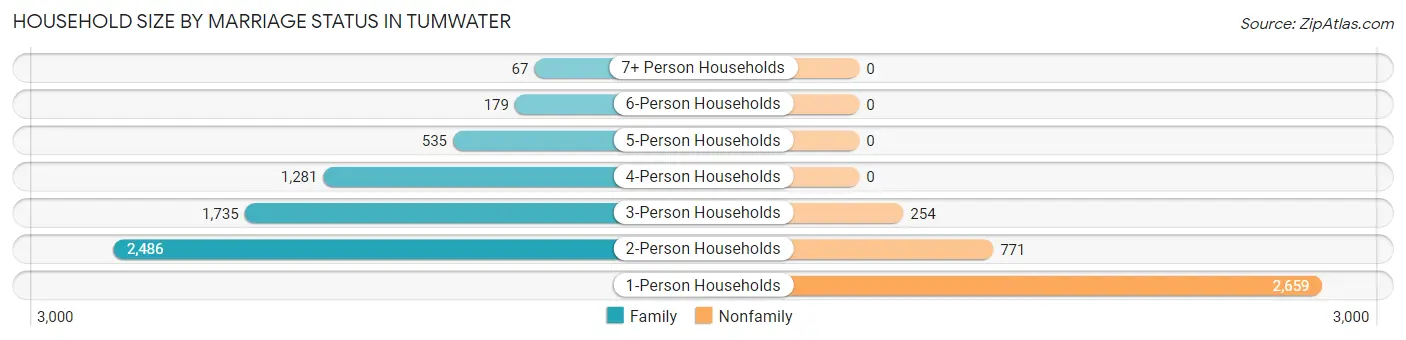
| Household Size | Family Households | Nonfamily Households |
| 1-Person Households | - | 2,659 (26.7%) |
| 2-Person Households | 2,486 (24.9%) | 771 (7.7%) |
| 3-Person Households | 1,735 (17.4%) | 254 (2.5%) |
| 4-Person Households | 1,281 (12.9%) | 0 (0.0%) |
| 5-Person Households | 535 (5.4%) | 0 (0.0%) |
| 6-Person Households | 179 (1.8%) | 0 (0.0%) |
| 7+ Person Households | 67 (0.7%) | 0 (0.0%) |
| Total | 6,283 (63.0%) | 3,684 (37.0%) |
Female Fertility in Tumwater
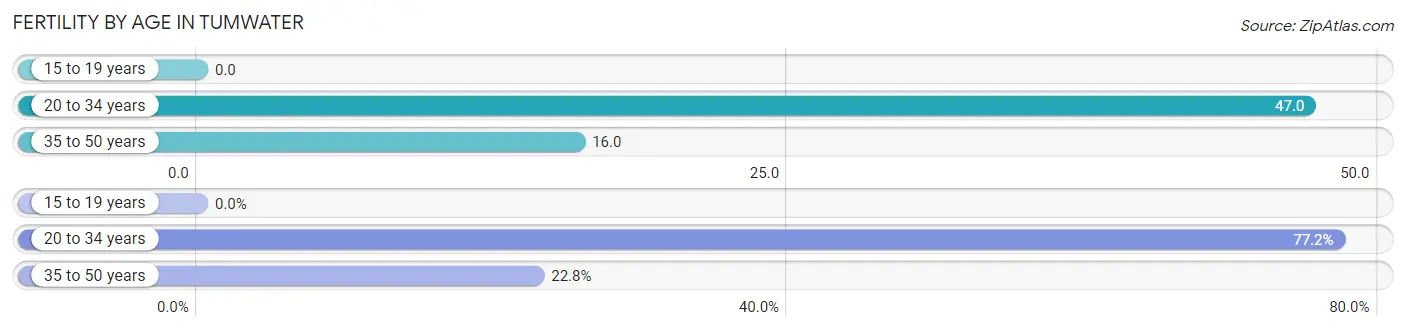
Fertility by Age in Tumwater
Average fertility rate in Tumwater is 31.0 births per 1,000 women. Women in the age bracket of 20 to 34 years have the highest fertility rate with 47.0 births per 1,000 women. Women in the age bracket of 20 to 34 years acount for 77.2% of all women with births.
| Age Bracket | Women with Births | Births / 1,000 Women |
| 15 to 19 years | 0 (0.0%) | 0.0 |
| 20 to 34 years | 159 (77.2%) | 47.0 |
| 35 to 50 years | 47 (22.8%) | 16.0 |
| Total | 206 (100.0%) | 31.0 |
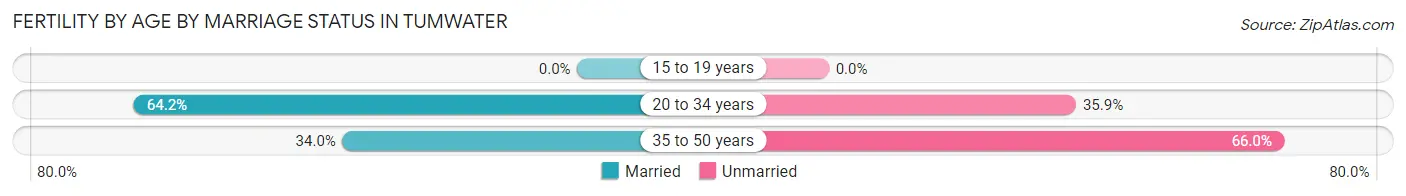
Fertility by Age by Marriage Status in Tumwater
57.3% of women with births (206) in Tumwater are married. The highest percentage of unmarried women with births falls into 35 to 50 years age bracket with 66.0% of them unmarried at the time of birth, while the lowest percentage of unmarried women with births belong to 20 to 34 years age bracket with 35.9% of them unmarried.
| Age Bracket | Married | Unmarried |
| 15 to 19 years | 0 (0.0%) | 0 (0.0%) |
| 20 to 34 years | 102 (64.1%) | 57 (35.8%) |
| 35 to 50 years | 16 (34.0%) | 31 (66.0%) |
| Total | 118 (57.3%) | 88 (42.7%) |
Fertility by Education in Tumwater
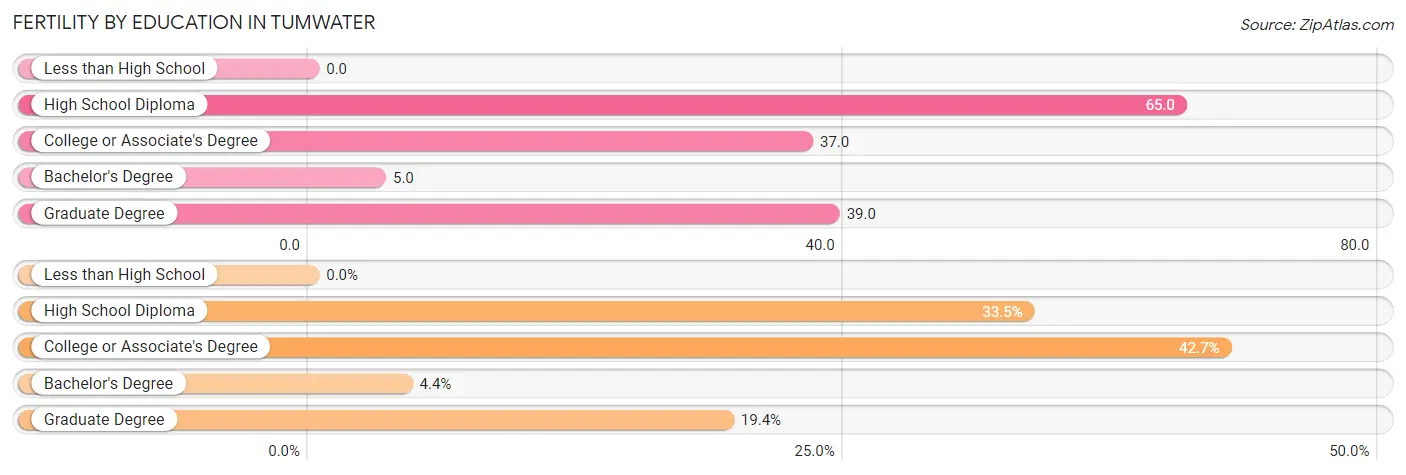
| Educational Attainment | Women with Births | Births / 1,000 Women |
| Less than High School | 0 (0.0%) | 0.0 |
| High School Diploma | 69 (33.5%) | 65.0 |
| College or Associate's Degree | 88 (42.7%) | 37.0 |
| Bachelor's Degree | 9 (4.4%) | 5.0 |
| Graduate Degree | 40 (19.4%) | 39.0 |
| Total | 206 (100.0%) | 31.0 |
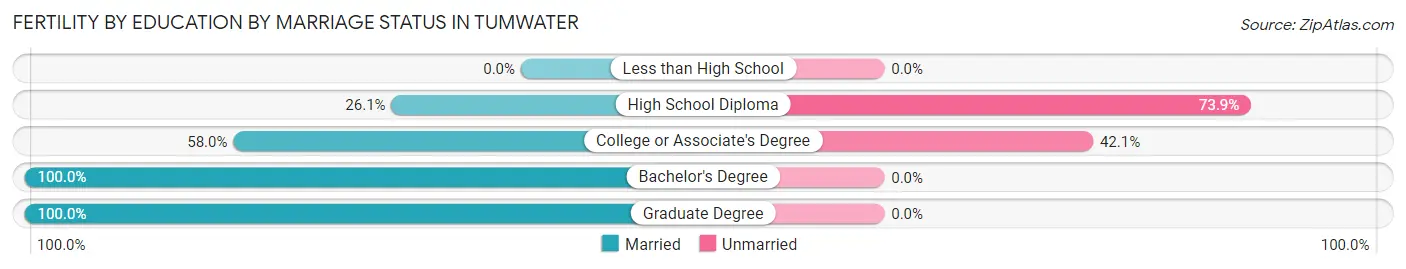
Fertility by Education by Marriage Status in Tumwater
42.7% of women with births in Tumwater are unmarried. Women with the educational attainment of bachelor's degree are most likely to be married with 100.0% of them married at childbirth, while women with the educational attainment of high school diploma are least likely to be married with 73.9% of them unmarried at childbirth.
| Educational Attainment | Married | Unmarried |
| Less than High School | 0 (0.0%) | 0 (0.0%) |
| High School Diploma | 18 (26.1%) | 51 (73.9%) |
| College or Associate's Degree | 51 (58.0%) | 37 (42.0%) |
| Bachelor's Degree | 9 (100.0%) | 0 (0.0%) |
| Graduate Degree | 40 (100.0%) | 0 (0.0%) |
| Total | 118 (57.3%) | 88 (42.7%) |
Income in Tumwater
Income Overview in Tumwater
Per Capita Income in Tumwater is $41,882, while median incomes of families and households are $103,315 and $84,177 respectively.
| Characteristic | Number | Measure |
| Per Capita Income | 25,617 | $41,882 |
| Median Family Income | 6,283 | $103,315 |
| Mean Family Income | 6,283 | $119,367 |
| Median Household Income | 9,967 | $84,177 |
| Mean Household Income | 9,967 | $104,877 |
| Income Deficit | 6,283 | $0 |
| Wage / Income Gap (%) | 25,617 | 19.01% |
| Wage / Income Gap ($) | 25,617 | 80.99¢ per $1 |
| Gini / Inequality Index | 25,617 | 0.41 |
Earnings by Sex in Tumwater
Average Earnings in Tumwater are $50,179, $55,913 for men and $45,282 for women, a difference of 19.0%.
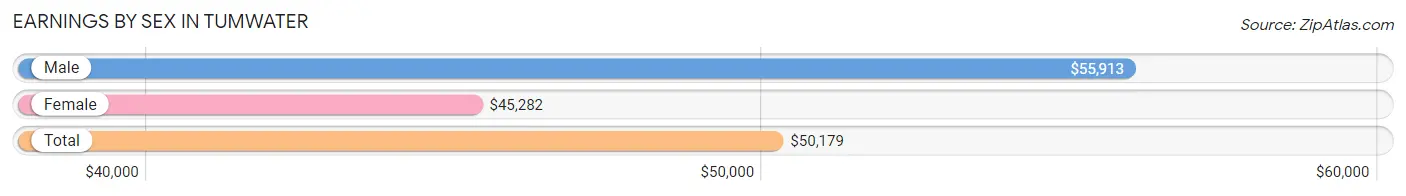
| Sex | Number | Average Earnings |
| Male | 7,198 (49.9%) | $55,913 |
| Female | 7,218 (50.1%) | $45,282 |
| Total | 14,416 (100.0%) | $50,179 |
Earnings by Sex by Income Bracket in Tumwater
The most common earnings brackets in Tumwater are $100,000+ for men (1,322 | 18.4%) and $75,000 to $99,999 for women (991 | 13.7%).
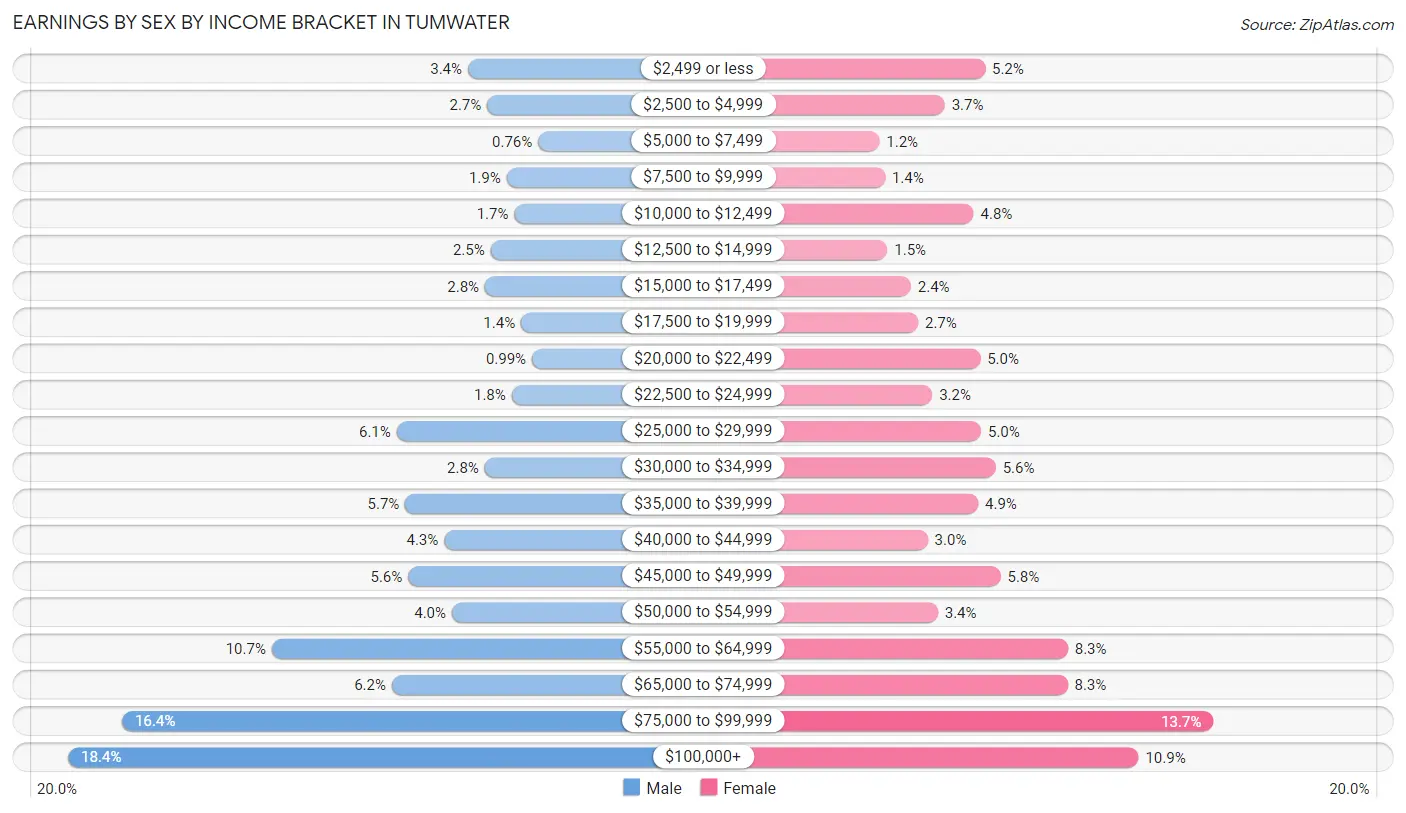
| Income | Male | Female |
| $2,499 or less | 244 (3.4%) | 374 (5.2%) |
| $2,500 to $4,999 | 192 (2.7%) | 265 (3.7%) |
| $5,000 to $7,499 | 55 (0.8%) | 88 (1.2%) |
| $7,500 to $9,999 | 140 (1.9%) | 103 (1.4%) |
| $10,000 to $12,499 | 119 (1.7%) | 343 (4.8%) |
| $12,500 to $14,999 | 183 (2.5%) | 110 (1.5%) |
| $15,000 to $17,499 | 198 (2.8%) | 173 (2.4%) |
| $17,500 to $19,999 | 101 (1.4%) | 193 (2.7%) |
| $20,000 to $22,499 | 71 (1.0%) | 361 (5.0%) |
| $22,500 to $24,999 | 126 (1.8%) | 231 (3.2%) |
| $25,000 to $29,999 | 436 (6.1%) | 363 (5.0%) |
| $30,000 to $34,999 | 199 (2.8%) | 403 (5.6%) |
| $35,000 to $39,999 | 413 (5.7%) | 355 (4.9%) |
| $40,000 to $44,999 | 308 (4.3%) | 219 (3.0%) |
| $45,000 to $49,999 | 405 (5.6%) | 416 (5.8%) |
| $50,000 to $54,999 | 287 (4.0%) | 246 (3.4%) |
| $55,000 to $64,999 | 773 (10.7%) | 598 (8.3%) |
| $65,000 to $74,999 | 449 (6.2%) | 597 (8.3%) |
| $75,000 to $99,999 | 1,177 (16.4%) | 991 (13.7%) |
| $100,000+ | 1,322 (18.4%) | 789 (10.9%) |
| Total | 7,198 (100.0%) | 7,218 (100.0%) |
Earnings by Sex by Educational Attainment in Tumwater
Average earnings in Tumwater are $59,808 for men and $48,573 for women, a difference of 18.8%. Men with an educational attainment of graduate degree enjoy the highest average annual earnings of $83,929, while those with high school diploma education earn the least with $38,250. Women with an educational attainment of graduate degree earn the most with the average annual earnings of $81,360, while those with less than high school education have the smallest earnings of $15,878.
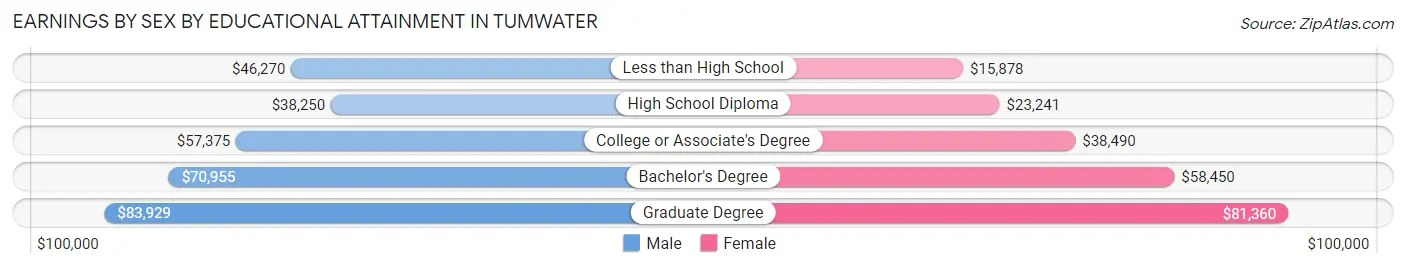
| Educational Attainment | Male Income | Female Income |
| Less than High School | $46,270 | $15,878 |
| High School Diploma | $38,250 | $23,241 |
| College or Associate's Degree | $57,375 | $38,490 |
| Bachelor's Degree | $70,955 | $58,450 |
| Graduate Degree | $83,929 | $81,360 |
| Total | $59,808 | $48,573 |
Family Income in Tumwater
Family Income Brackets in Tumwater
According to the Tumwater family income data, there are 1,627 families falling into the $100,000 to $149,999 income range, which is the most common income bracket and makes up 25.9% of all families. Conversely, the $10,000 to $14,999 income bracket is the least frequent group with only 107 families (1.7%) belonging to this category.
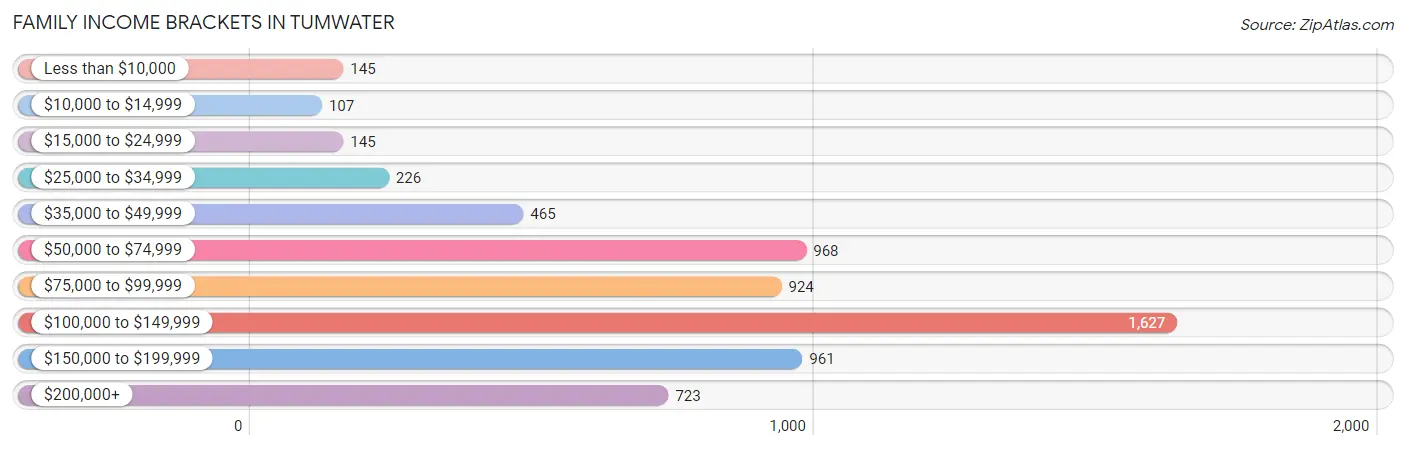
| Income Bracket | # Families | % Families |
| Less than $10,000 | 145 | 2.3% |
| $10,000 to $14,999 | 107 | 1.7% |
| $15,000 to $24,999 | 145 | 2.3% |
| $25,000 to $34,999 | 226 | 3.6% |
| $35,000 to $49,999 | 465 | 7.4% |
| $50,000 to $74,999 | 968 | 15.4% |
| $75,000 to $99,999 | 924 | 14.7% |
| $100,000 to $149,999 | 1,627 | 25.9% |
| $150,000 to $199,999 | 961 | 15.3% |
| $200,000+ | 723 | 11.5% |
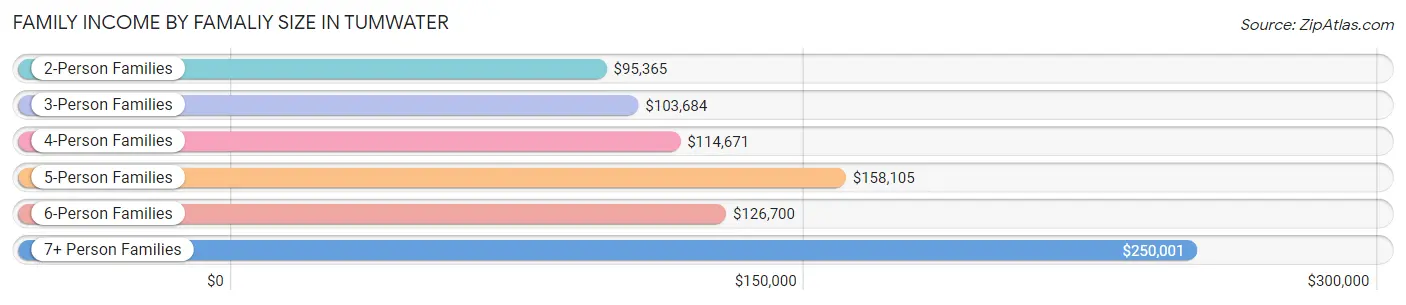
Family Income by Famaliy Size in Tumwater
7+ person families (40 | 0.6%) account for the highest median family income in Tumwater with $250,001 per family, while 2-person families (2,753 | 43.8%) have the highest median income of $47,682 per family member.
| Income Bracket | # Families | Median Income |
| 2-Person Families | 2,753 (43.8%) | $95,365 |
| 3-Person Families | 1,804 (28.7%) | $103,684 |
| 4-Person Families | 1,057 (16.8%) | $114,671 |
| 5-Person Families | 443 (7.0%) | $158,105 |
| 6-Person Families | 186 (3.0%) | $126,700 |
| 7+ Person Families | 40 (0.6%) | $250,001 |
| Total | 6,283 (100.0%) | $103,315 |
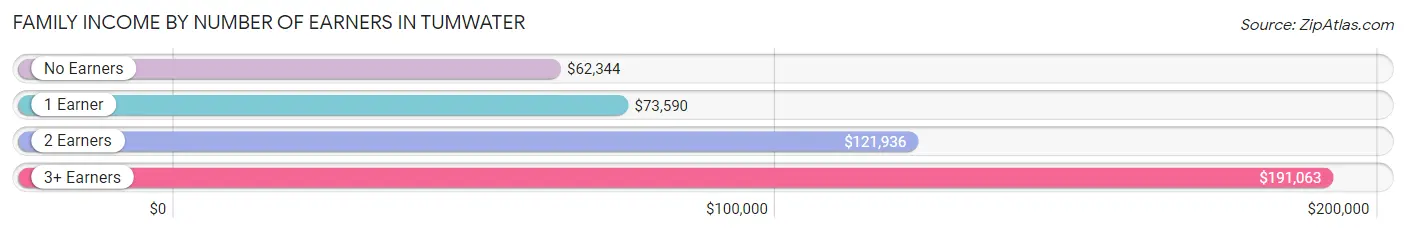
Family Income by Number of Earners in Tumwater
The median family income in Tumwater is $103,315, with families comprising 3+ earners (581) having the highest median family income of $191,063, while families with no earners (738) have the lowest median family income of $62,344, accounting for 9.2% and 11.7% of families, respectively.
| Number of Earners | # Families | Median Income |
| No Earners | 738 (11.7%) | $62,344 |
| 1 Earner | 2,001 (31.9%) | $73,590 |
| 2 Earners | 2,963 (47.2%) | $121,936 |
| 3+ Earners | 581 (9.2%) | $191,063 |
| Total | 6,283 (100.0%) | $103,315 |
Household Income in Tumwater
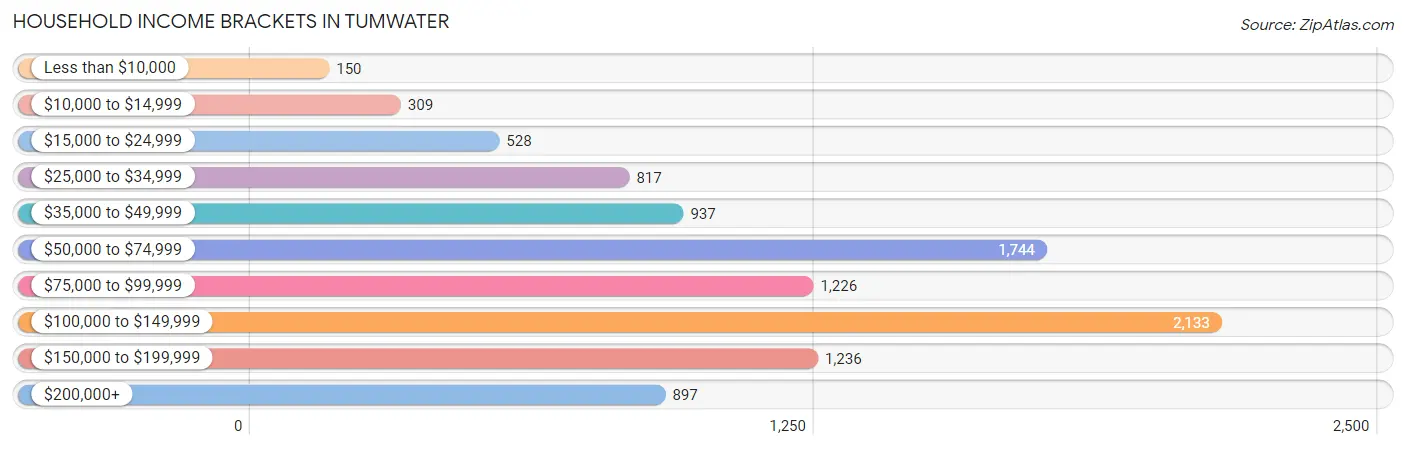
Household Income Brackets in Tumwater
With 2,133 households falling in the category, the $100,000 to $149,999 income range is the most frequent in Tumwater, accounting for 21.4% of all households. In contrast, only 150 households (1.5%) fall into the less than $10,000 income bracket, making it the least populous group.
| Income Bracket | # Households | % Households |
| Less than $10,000 | 150 | 1.5% |
| $10,000 to $14,999 | 309 | 3.1% |
| $15,000 to $24,999 | 528 | 5.3% |
| $25,000 to $34,999 | 817 | 8.2% |
| $35,000 to $49,999 | 937 | 9.4% |
| $50,000 to $74,999 | 1,744 | 17.5% |
| $75,000 to $99,999 | 1,226 | 12.3% |
| $100,000 to $149,999 | 2,133 | 21.4% |
| $150,000 to $199,999 | 1,236 | 12.4% |
| $200,000+ | 897 | 9.0% |
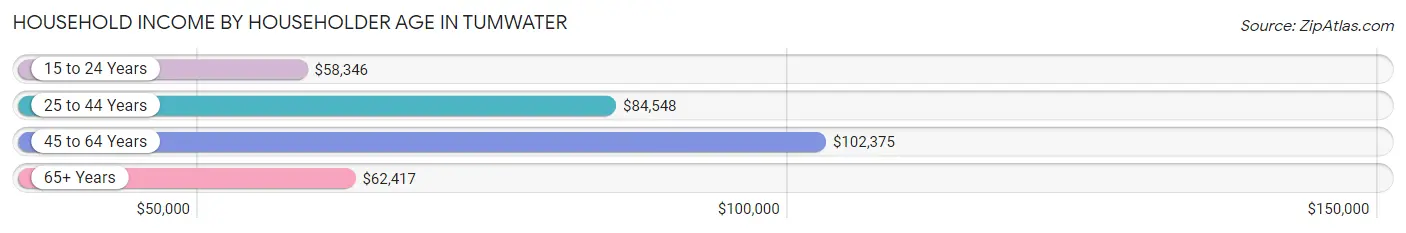
Household Income by Householder Age in Tumwater
The median household income in Tumwater is $84,177, with the highest median household income of $102,375 found in the 45 to 64 years age bracket for the primary householder. A total of 3,572 households (35.8%) fall into this category. Meanwhile, the 15 to 24 years age bracket for the primary householder has the lowest median household income of $58,346, with 289 households (2.9%) in this group.
| Income Bracket | # Households | Median Income |
| 15 to 24 Years | 289 (2.9%) | $58,346 |
| 25 to 44 Years | 4,042 (40.6%) | $84,548 |
| 45 to 64 Years | 3,572 (35.8%) | $102,375 |
| 65+ Years | 2,064 (20.7%) | $62,417 |
| Total | 9,967 (100.0%) | $84,177 |
Poverty in Tumwater
Income Below Poverty by Sex and Age in Tumwater
With 6.5% poverty level for males and 9.7% for females among the residents of Tumwater, 5 year old males and 25 to 34 year old females are the most vulnerable to poverty, with 61 males (28.1%) and 489 females (18.2%) in their respective age groups living below the poverty level.
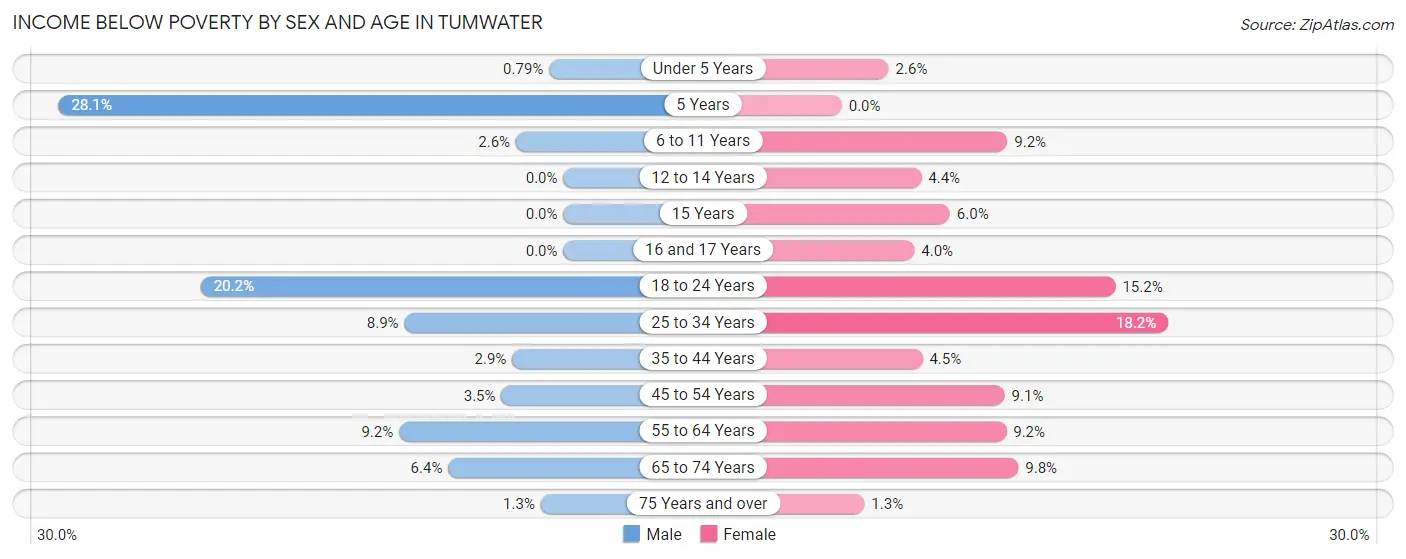
| Age Bracket | Male | Female |
| Under 5 Years | 4 (0.8%) | 16 (2.6%) |
| 5 Years | 61 (28.1%) | 0 (0.0%) |
| 6 to 11 Years | 21 (2.6%) | 119 (9.2%) |
| 12 to 14 Years | 0 (0.0%) | 18 (4.4%) |
| 15 Years | 0 (0.0%) | 5 (6.0%) |
| 16 and 17 Years | 0 (0.0%) | 4 (4.0%) |
| 18 to 24 Years | 230 (20.2%) | 130 (15.2%) |
| 25 to 34 Years | 177 (8.8%) | 489 (18.2%) |
| 35 to 44 Years | 55 (2.9%) | 91 (4.5%) |
| 45 to 54 Years | 49 (3.5%) | 137 (9.1%) |
| 55 to 64 Years | 117 (9.1%) | 147 (9.2%) |
| 65 to 74 Years | 47 (6.4%) | 127 (9.8%) |
| 75 Years and over | 9 (1.3%) | 9 (1.3%) |
| Total | 770 (6.5%) | 1,292 (9.7%) |
Income Above Poverty by Sex and Age in Tumwater
According to the poverty statistics in Tumwater, males aged 12 to 14 years and females aged 5 years are the age groups that are most secure financially, with 100.0% of males and 100.0% of females in these age groups living above the poverty line.
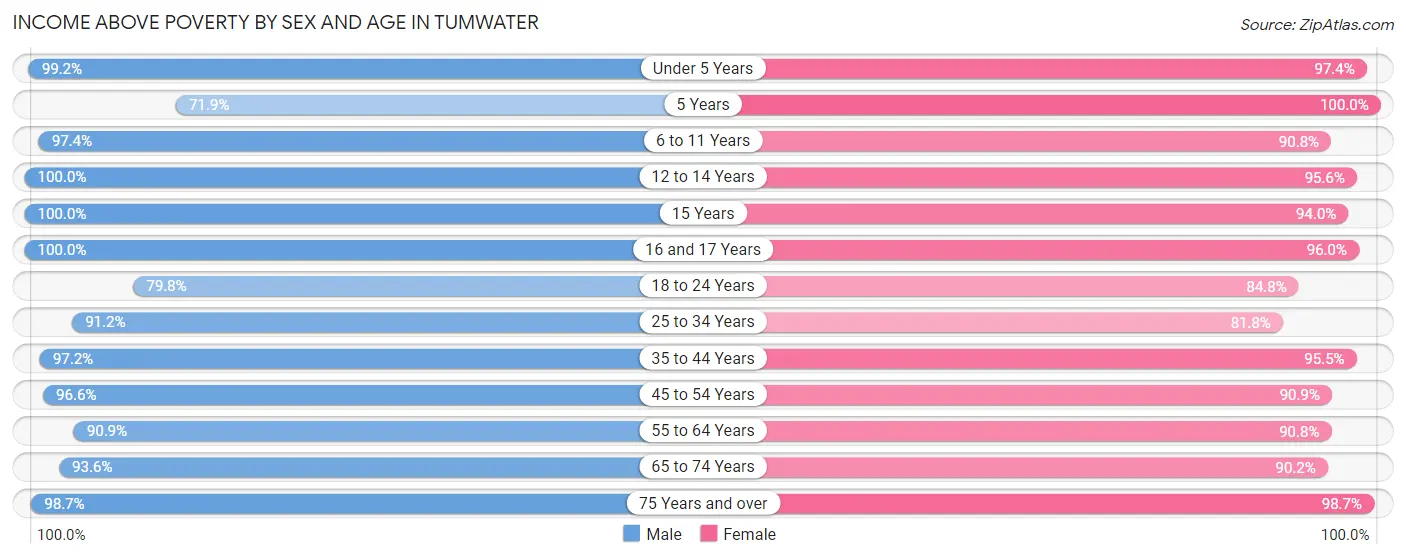
| Age Bracket | Male | Female |
| Under 5 Years | 505 (99.2%) | 596 (97.4%) |
| 5 Years | 156 (71.9%) | 126 (100.0%) |
| 6 to 11 Years | 773 (97.4%) | 1,172 (90.8%) |
| 12 to 14 Years | 653 (100.0%) | 388 (95.6%) |
| 15 Years | 157 (100.0%) | 78 (94.0%) |
| 16 and 17 Years | 364 (100.0%) | 95 (96.0%) |
| 18 to 24 Years | 909 (79.8%) | 723 (84.8%) |
| 25 to 34 Years | 1,824 (91.1%) | 2,202 (81.8%) |
| 35 to 44 Years | 1,872 (97.2%) | 1,936 (95.5%) |
| 45 to 54 Years | 1,371 (96.6%) | 1,374 (90.9%) |
| 55 to 64 Years | 1,161 (90.8%) | 1,458 (90.8%) |
| 65 to 74 Years | 686 (93.6%) | 1,165 (90.2%) |
| 75 Years and over | 705 (98.7%) | 704 (98.7%) |
| Total | 11,136 (93.5%) | 12,017 (90.3%) |
Income Below Poverty Among Married-Couple Families in Tumwater
The poverty statistics for married-couple families in Tumwater show that 1.3% or 60 of the total 4,507 families live below the poverty line. Families with 5 or more children have the highest poverty rate of 15.4%, comprising of 4 families. On the other hand, families with 3 or 4 children have the lowest poverty rate of 0.0%, which includes 0 families.
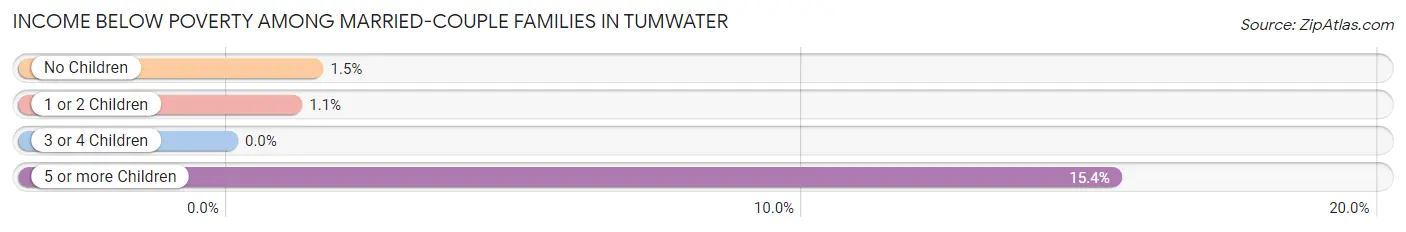
| Children | Above Poverty | Below Poverty |
| No Children | 2,517 (98.5%) | 38 (1.5%) |
| 1 or 2 Children | 1,594 (98.9%) | 18 (1.1%) |
| 3 or 4 Children | 314 (100.0%) | 0 (0.0%) |
| 5 or more Children | 22 (84.6%) | 4 (15.4%) |
| Total | 4,447 (98.7%) | 60 (1.3%) |
Income Below Poverty Among Single-Parent Households in Tumwater
According to the poverty data in Tumwater, 7.9% or 40 single-father households and 17.0% or 216 single-mother households are living below the poverty line. Among single-father households, those with no children have the highest poverty rate, with 27 households (14.4%) experiencing poverty. Likewise, among single-mother households, those with 1 or 2 children have the highest poverty rate, with 135 households (19.9%) falling below the poverty line.
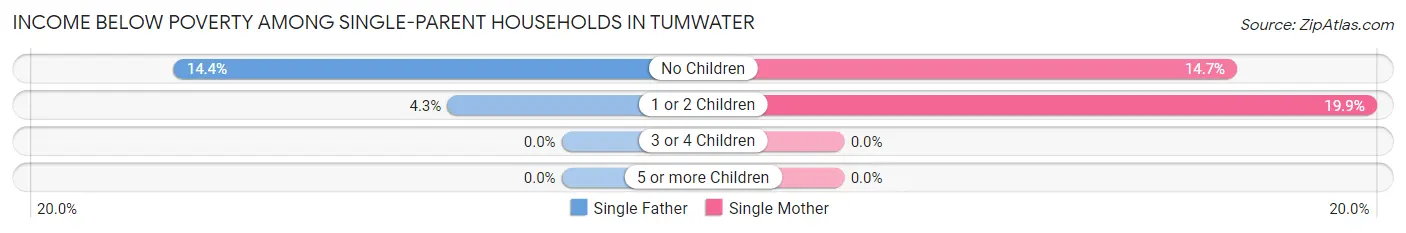
| Children | Single Father | Single Mother |
| No Children | 27 (14.4%) | 81 (14.6%) |
| 1 or 2 Children | 13 (4.3%) | 135 (19.9%) |
| 3 or 4 Children | 0 (0.0%) | 0 (0.0%) |
| 5 or more Children | 0 (0.0%) | 0 (0.0%) |
| Total | 40 (7.9%) | 216 (17.0%) |
Income Below Poverty Among Married-Couple vs Single-Parent Households in Tumwater
The poverty data for Tumwater shows that 60 of the married-couple family households (1.3%) and 256 of the single-parent households (14.4%) are living below the poverty level. Within the married-couple family households, those with 5 or more children have the highest poverty rate, with 4 households (15.4%) falling below the poverty line. Among the single-parent households, those with 1 or 2 children have the highest poverty rate, with 148 household (15.0%) living below poverty.
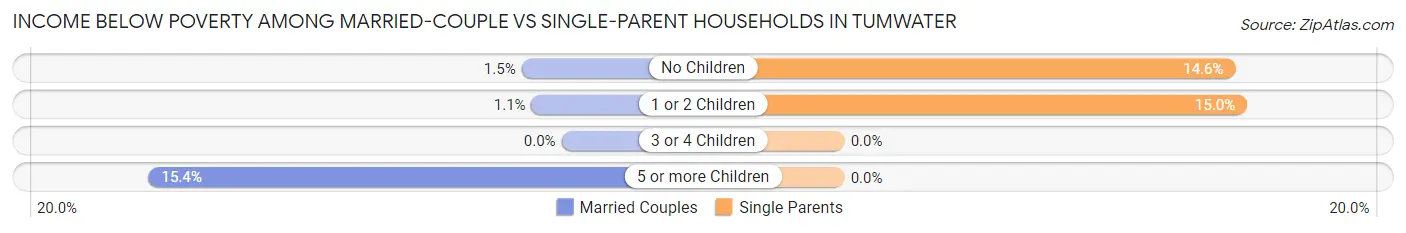
| Children | Married-Couple Families | Single-Parent Households |
| No Children | 38 (1.5%) | 108 (14.6%) |
| 1 or 2 Children | 18 (1.1%) | 148 (15.0%) |
| 3 or 4 Children | 0 (0.0%) | 0 (0.0%) |
| 5 or more Children | 4 (15.4%) | 0 (0.0%) |
| Total | 60 (1.3%) | 256 (14.4%) |
Employment Characteristics in Tumwater
Employment by Class of Employer in Tumwater
Among the 12,895 employed individuals in Tumwater, private company employees (5,971 | 46.3%), state government employees (3,202 | 24.8%), and local government employees (1,193 | 9.2%) make up the most common classes of employment.
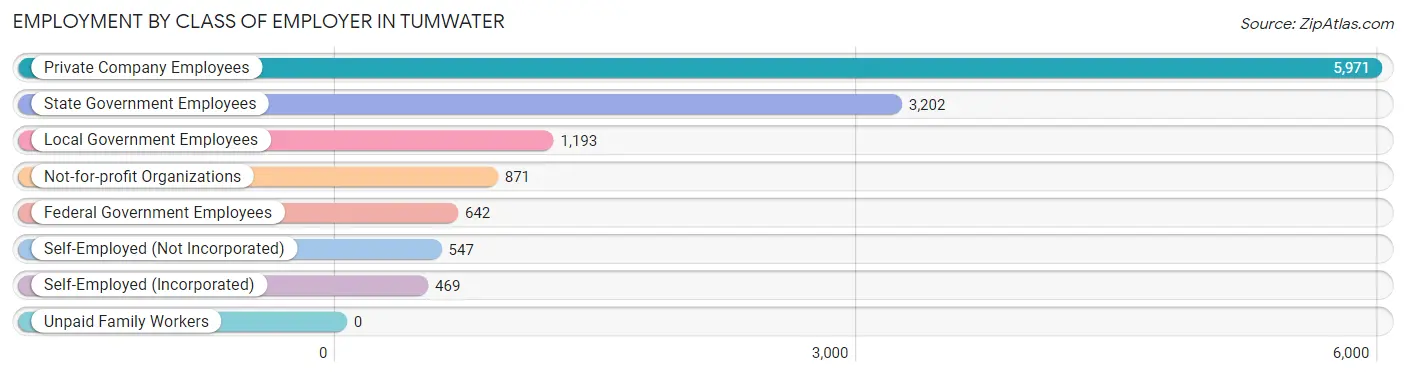
| Employer Class | # Employees | % Employees |
| Private Company Employees | 5,971 | 46.3% |
| Self-Employed (Incorporated) | 469 | 3.6% |
| Self-Employed (Not Incorporated) | 547 | 4.2% |
| Not-for-profit Organizations | 871 | 6.8% |
| Local Government Employees | 1,193 | 9.2% |
| State Government Employees | 3,202 | 24.8% |
| Federal Government Employees | 642 | 5.0% |
| Unpaid Family Workers | 0 | 0.0% |
| Total | 12,895 | 100.0% |
Employment Status by Age in Tumwater
According to the labor force statistics for Tumwater, out of the total population over 16 years of age (20,736), 66.7% or 13,831 individuals are in the labor force, with 5.7% or 788 of them unemployed. The age group with the highest labor force participation rate is 45 to 54 years, with 85.0% or 2,526 individuals in the labor force. Within the labor force, the 16 to 19 years age range has the highest percentage of unemployed individuals, with 14.6% or 52 of them being unemployed.
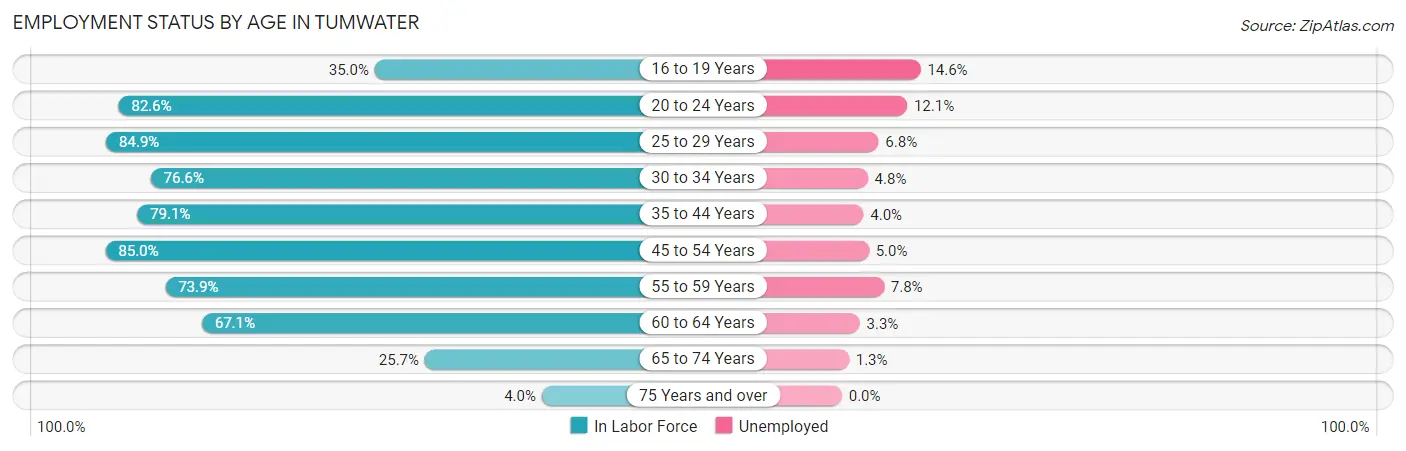
| Age Bracket | In Labor Force | Unemployed |
| 16 to 19 Years | 357 (35.0%) | 52 (14.6%) |
| 20 to 24 Years | 1,216 (82.6%) | 147 (12.1%) |
| 25 to 29 Years | 2,042 (84.9%) | 139 (6.8%) |
| 30 to 34 Years | 1,812 (76.6%) | 87 (4.8%) |
| 35 to 44 Years | 3,262 (79.1%) | 130 (4.0%) |
| 45 to 54 Years | 2,526 (85.0%) | 126 (5.0%) |
| 55 to 59 Years | 898 (73.9%) | 70 (7.8%) |
| 60 to 64 Years | 1,134 (67.1%) | 37 (3.3%) |
| 65 to 74 Years | 522 (25.7%) | 7 (1.3%) |
| 75 Years and over | 58 (4.0%) | 0 (0.0%) |
| Total | 13,831 (66.7%) | 788 (5.7%) |
Employment Status by Educational Attainment in Tumwater
According to labor force statistics for Tumwater, 79.1% of individuals (11,684) out of the total population between 25 and 64 years of age (14,771) are in the labor force, with 5.0% or 584 of them being unemployed. The group with the highest labor force participation rate are those with the educational attainment of bachelor's degree or higher, with 88.1% or 5,364 individuals in the labor force. Within the labor force, individuals with less than high school education have the highest percentage of unemployment, with 9.7% or 35 of them being unemployed.
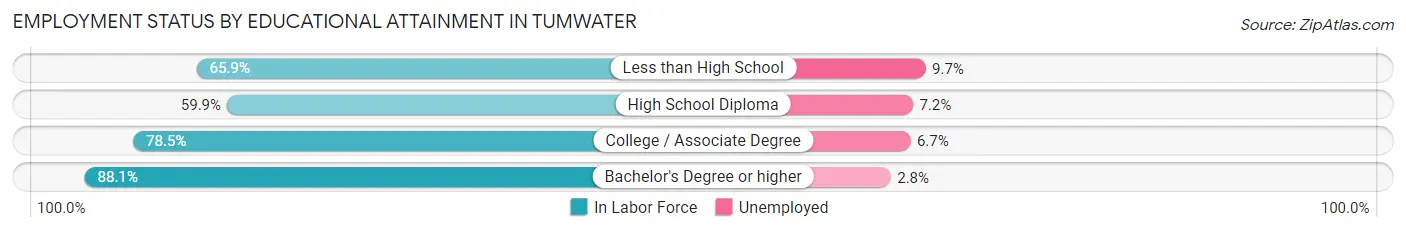
| Educational Attainment | In Labor Force | Unemployed |
| Less than High School | 359 (65.9%) | 53 (9.7%) |
| High School Diploma | 1,397 (59.9%) | 168 (7.2%) |
| College / Associate Degree | 4,558 (78.5%) | 389 (6.7%) |
| Bachelor's Degree or higher | 5,364 (88.1%) | 170 (2.8%) |
| Total | 11,684 (79.1%) | 739 (5.0%) |
Employment Occupations by Sex in Tumwater
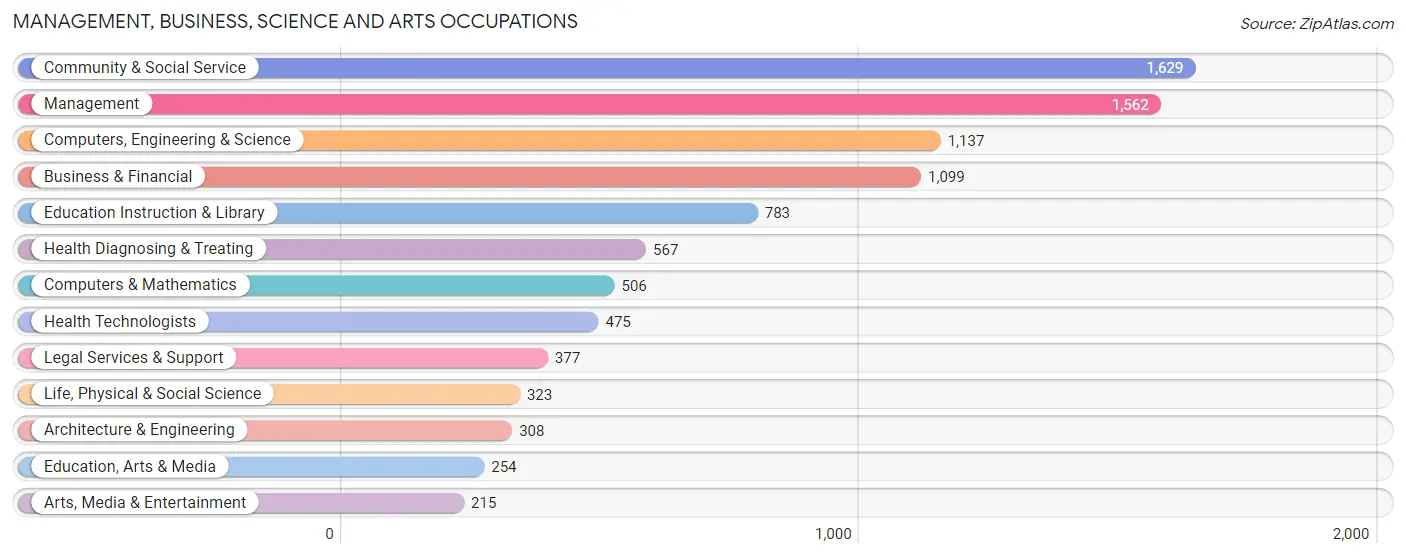
Management, Business, Science and Arts Occupations
The most common Management, Business, Science and Arts occupations in Tumwater are Community & Social Service (1,629 | 12.8%), Management (1,562 | 12.3%), Computers, Engineering & Science (1,137 | 8.9%), Business & Financial (1,099 | 8.6%), and Education Instruction & Library (783 | 6.1%).
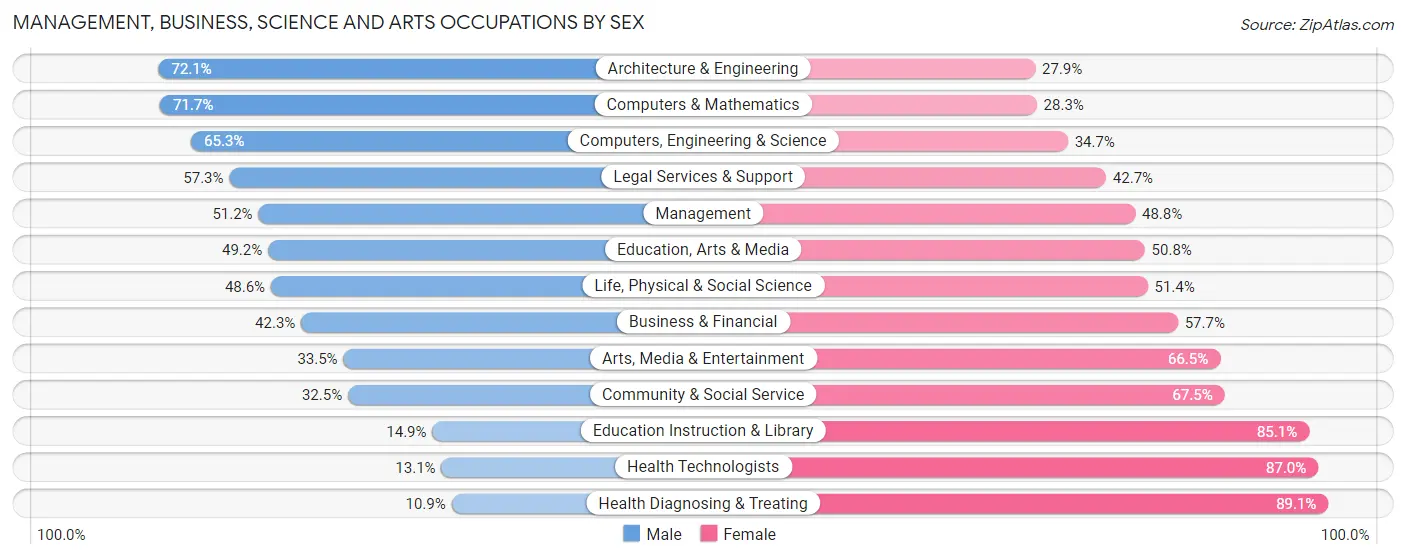
Management, Business, Science and Arts Occupations by Sex
Within the Management, Business, Science and Arts occupations in Tumwater, the most male-oriented occupations are Architecture & Engineering (72.1%), Computers & Mathematics (71.7%), and Computers, Engineering & Science (65.3%), while the most female-oriented occupations are Health Diagnosing & Treating (89.1%), Health Technologists (87.0%), and Education Instruction & Library (85.1%).
| Occupation | Male | Female |
| Management | 800 (51.2%) | 762 (48.8%) |
| Business & Financial | 465 (42.3%) | 634 (57.7%) |
| Computers, Engineering & Science | 742 (65.3%) | 395 (34.7%) |
| Computers & Mathematics | 363 (71.7%) | 143 (28.3%) |
| Architecture & Engineering | 222 (72.1%) | 86 (27.9%) |
| Life, Physical & Social Science | 157 (48.6%) | 166 (51.4%) |
| Community & Social Service | 530 (32.5%) | 1,099 (67.5%) |
| Education, Arts & Media | 125 (49.2%) | 129 (50.8%) |
| Legal Services & Support | 216 (57.3%) | 161 (42.7%) |
| Education Instruction & Library | 117 (14.9%) | 666 (85.1%) |
| Arts, Media & Entertainment | 72 (33.5%) | 143 (66.5%) |
| Health Diagnosing & Treating | 62 (10.9%) | 505 (89.1%) |
| Health Technologists | 62 (13.1%) | 413 (87.0%) |
| Total (Category) | 2,599 (43.4%) | 3,395 (56.6%) |
| Total (Overall) | 6,260 (49.1%) | 6,483 (50.9%) |
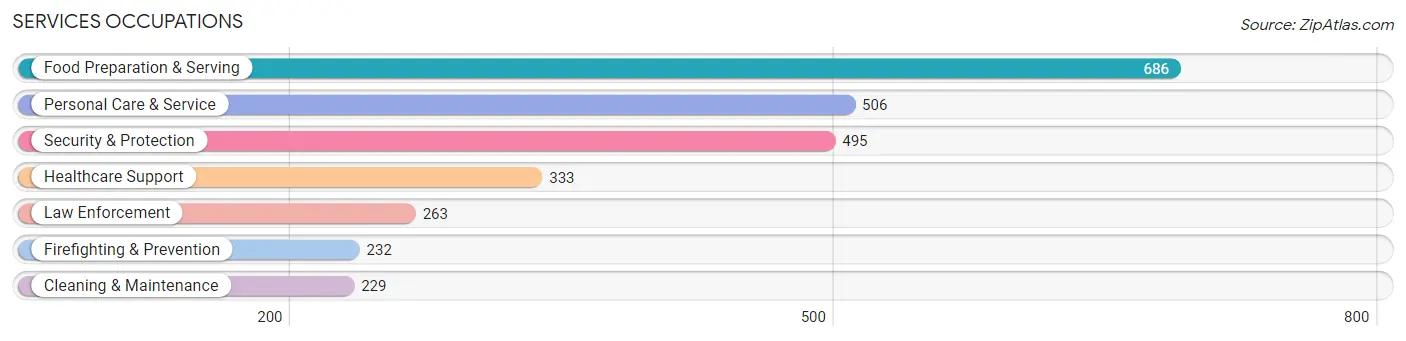
Services Occupations
The most common Services occupations in Tumwater are Food Preparation & Serving (686 | 5.4%), Personal Care & Service (506 | 4.0%), Security & Protection (495 | 3.9%), Healthcare Support (333 | 2.6%), and Law Enforcement (263 | 2.1%).
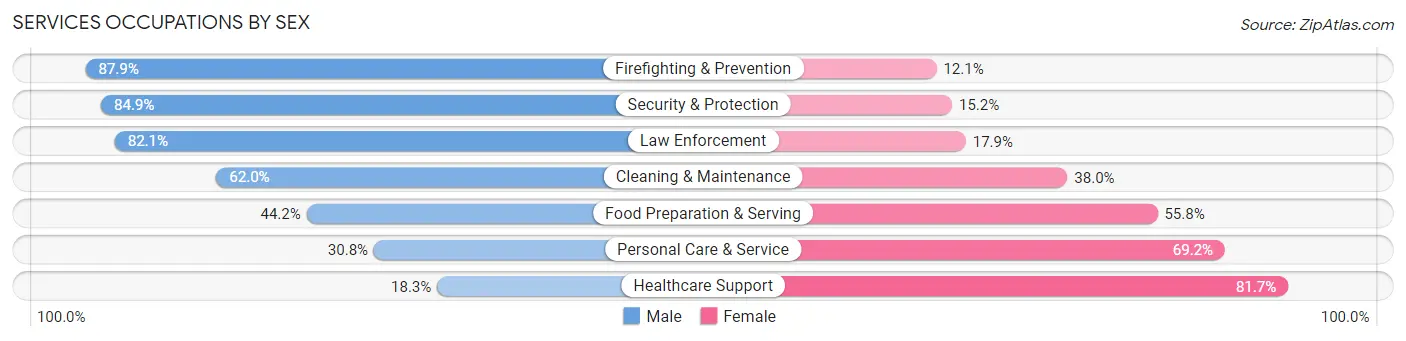
Services Occupations by Sex
Within the Services occupations in Tumwater, the most male-oriented occupations are Firefighting & Prevention (87.9%), Security & Protection (84.9%), and Law Enforcement (82.1%), while the most female-oriented occupations are Healthcare Support (81.7%), Personal Care & Service (69.2%), and Food Preparation & Serving (55.8%).
| Occupation | Male | Female |
| Healthcare Support | 61 (18.3%) | 272 (81.7%) |
| Security & Protection | 420 (84.9%) | 75 (15.1%) |
| Firefighting & Prevention | 204 (87.9%) | 28 (12.1%) |
| Law Enforcement | 216 (82.1%) | 47 (17.9%) |
| Food Preparation & Serving | 303 (44.2%) | 383 (55.8%) |
| Cleaning & Maintenance | 142 (62.0%) | 87 (38.0%) |
| Personal Care & Service | 156 (30.8%) | 350 (69.2%) |
| Total (Category) | 1,082 (48.1%) | 1,167 (51.9%) |
| Total (Overall) | 6,260 (49.1%) | 6,483 (50.9%) |
Sales and Office Occupations
The most common Sales and Office occupations in Tumwater are Office & Administration (1,592 | 12.5%), and Sales & Related (1,253 | 9.8%).

Sales and Office Occupations by Sex
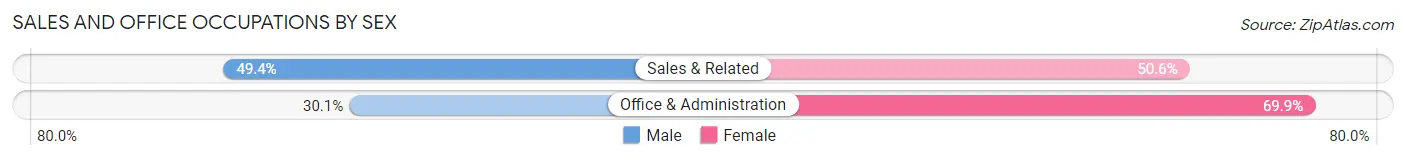
| Occupation | Male | Female |
| Sales & Related | 619 (49.4%) | 634 (50.6%) |
| Office & Administration | 479 (30.1%) | 1,113 (69.9%) |
| Total (Category) | 1,098 (38.6%) | 1,747 (61.4%) |
| Total (Overall) | 6,260 (49.1%) | 6,483 (50.9%) |
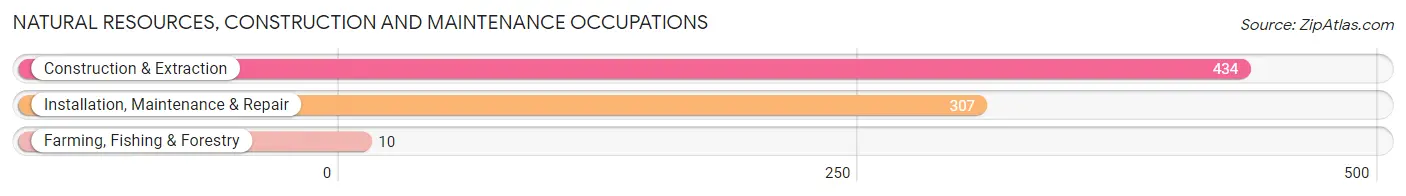
Natural Resources, Construction and Maintenance Occupations
The most common Natural Resources, Construction and Maintenance occupations in Tumwater are Construction & Extraction (434 | 3.4%), Installation, Maintenance & Repair (307 | 2.4%), and Farming, Fishing & Forestry (10 | 0.1%).
Natural Resources, Construction and Maintenance Occupations by Sex
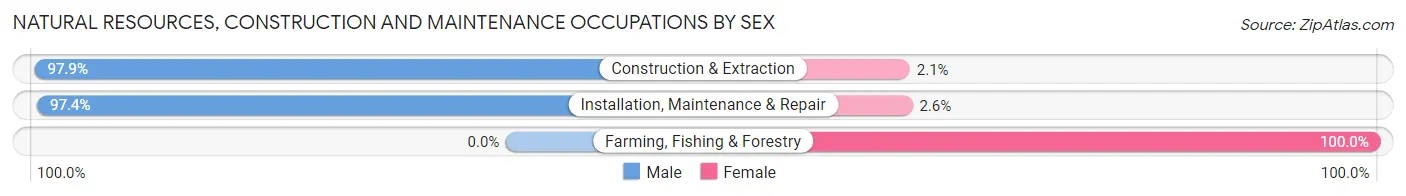
| Occupation | Male | Female |
| Farming, Fishing & Forestry | 0 (0.0%) | 10 (100.0%) |
| Construction & Extraction | 425 (97.9%) | 9 (2.1%) |
| Installation, Maintenance & Repair | 299 (97.4%) | 8 (2.6%) |
| Total (Category) | 724 (96.4%) | 27 (3.6%) |
| Total (Overall) | 6,260 (49.1%) | 6,483 (50.9%) |
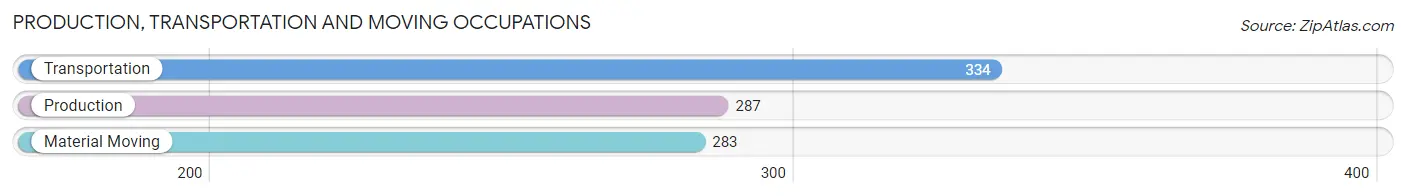
Production, Transportation and Moving Occupations
The most common Production, Transportation and Moving occupations in Tumwater are Transportation (334 | 2.6%), Production (287 | 2.2%), and Material Moving (283 | 2.2%).
Production, Transportation and Moving Occupations by Sex
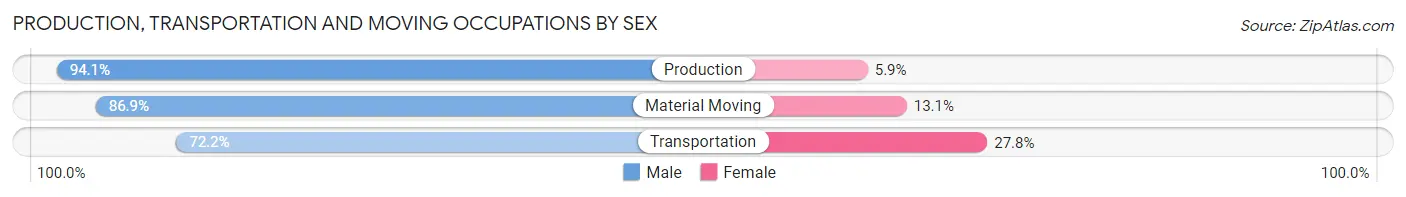
| Occupation | Male | Female |
| Production | 270 (94.1%) | 17 (5.9%) |
| Transportation | 241 (72.2%) | 93 (27.8%) |
| Material Moving | 246 (86.9%) | 37 (13.1%) |
| Total (Category) | 757 (83.7%) | 147 (16.3%) |
| Total (Overall) | 6,260 (49.1%) | 6,483 (50.9%) |
Employment Industries by Sex in Tumwater
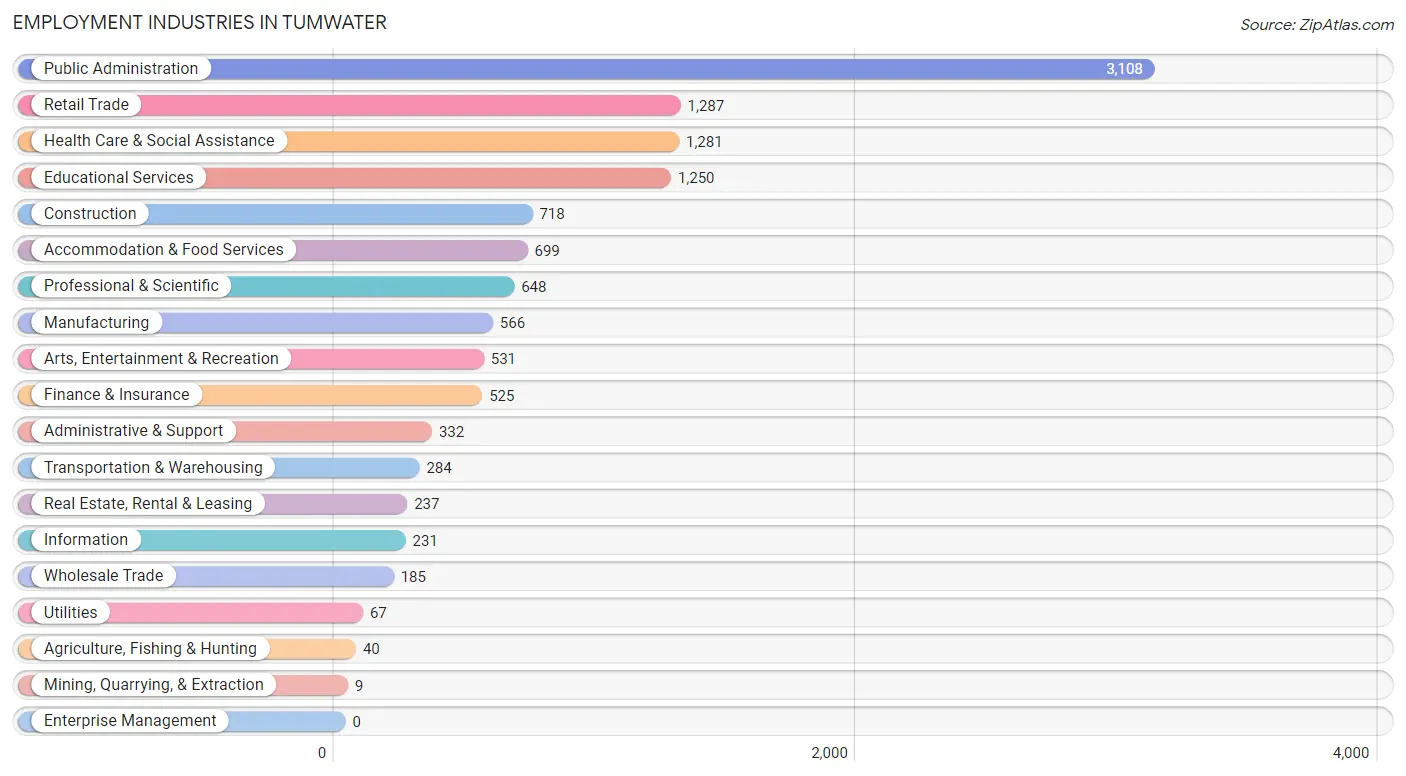
Employment Industries in Tumwater
The major employment industries in Tumwater include Public Administration (3,108 | 24.4%), Retail Trade (1,287 | 10.1%), Health Care & Social Assistance (1,281 | 10.1%), Educational Services (1,250 | 9.8%), and Construction (718 | 5.6%).
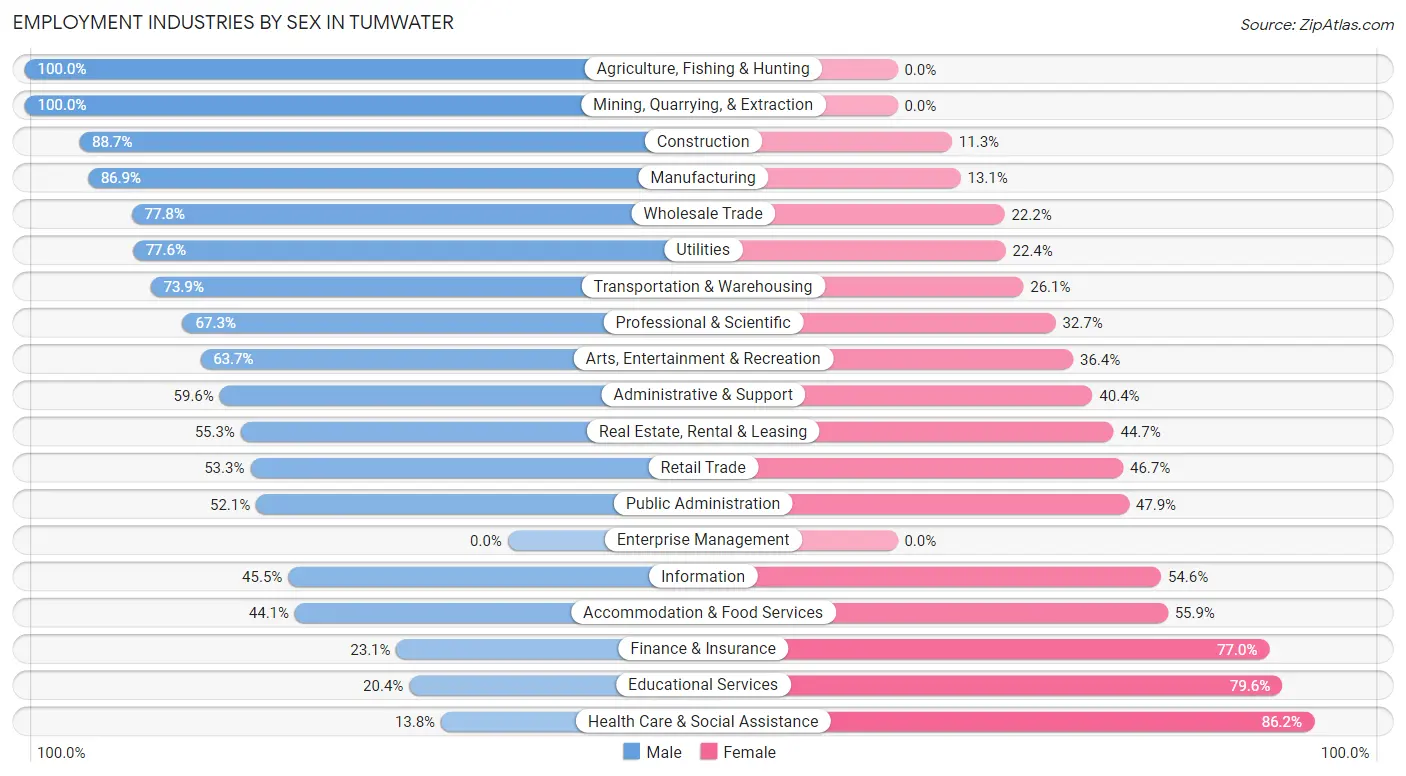
Employment Industries by Sex in Tumwater
The Tumwater industries that see more men than women are Agriculture, Fishing & Hunting (100.0%), Mining, Quarrying, & Extraction (100.0%), and Construction (88.7%), whereas the industries that tend to have a higher number of women are Health Care & Social Assistance (86.2%), Educational Services (79.6%), and Finance & Insurance (76.9%).
| Industry | Male | Female |
| Agriculture, Fishing & Hunting | 40 (100.0%) | 0 (0.0%) |
| Mining, Quarrying, & Extraction | 9 (100.0%) | 0 (0.0%) |
| Construction | 637 (88.7%) | 81 (11.3%) |
| Manufacturing | 492 (86.9%) | 74 (13.1%) |
| Wholesale Trade | 144 (77.8%) | 41 (22.2%) |
| Retail Trade | 686 (53.3%) | 601 (46.7%) |
| Transportation & Warehousing | 210 (73.9%) | 74 (26.1%) |
| Utilities | 52 (77.6%) | 15 (22.4%) |
| Information | 105 (45.5%) | 126 (54.5%) |
| Finance & Insurance | 121 (23.1%) | 404 (76.9%) |
| Real Estate, Rental & Leasing | 131 (55.3%) | 106 (44.7%) |
| Professional & Scientific | 436 (67.3%) | 212 (32.7%) |
| Enterprise Management | 0 (0.0%) | 0 (0.0%) |
| Administrative & Support | 198 (59.6%) | 134 (40.4%) |
| Educational Services | 255 (20.4%) | 995 (79.6%) |
| Health Care & Social Assistance | 177 (13.8%) | 1,104 (86.2%) |
| Arts, Entertainment & Recreation | 338 (63.6%) | 193 (36.3%) |
| Accommodation & Food Services | 308 (44.1%) | 391 (55.9%) |
| Public Administration | 1,619 (52.1%) | 1,489 (47.9%) |
| Total | 6,260 (49.1%) | 6,483 (50.9%) |
Education in Tumwater
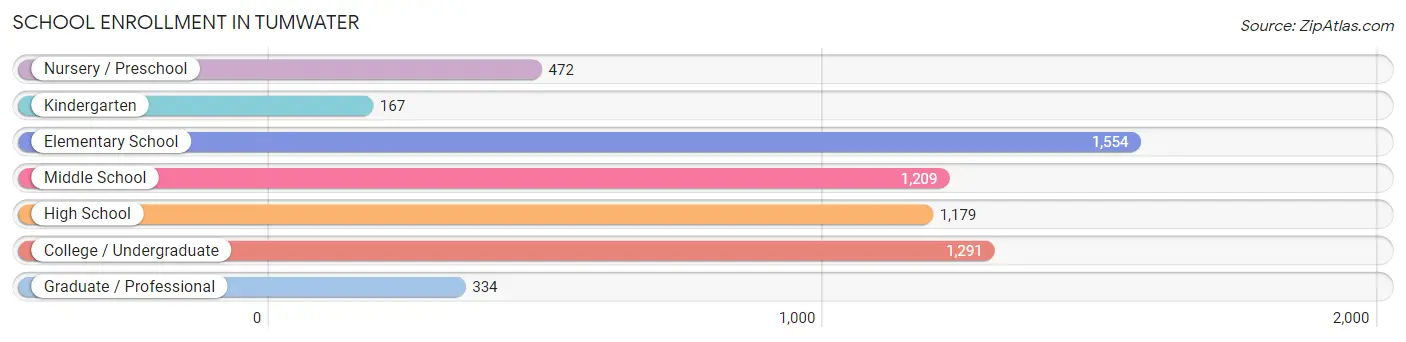
School Enrollment in Tumwater
The most common levels of schooling among the 6,206 students in Tumwater are elementary school (1,554 | 25.0%), college / undergraduate (1,291 | 20.8%), and middle school (1,209 | 19.5%).
| School Level | # Students | % Students |
| Nursery / Preschool | 472 | 7.6% |
| Kindergarten | 167 | 2.7% |
| Elementary School | 1,554 | 25.0% |
| Middle School | 1,209 | 19.5% |
| High School | 1,179 | 19.0% |
| College / Undergraduate | 1,291 | 20.8% |
| Graduate / Professional | 334 | 5.4% |
| Total | 6,206 | 100.0% |
School Enrollment by Age by Funding Source in Tumwater
Out of a total of 6,206 students who are enrolled in schools in Tumwater, 918 (14.8%) attend a private institution, while the remaining 5,288 (85.2%) are enrolled in public schools. The age group of 3 to 4 year olds has the highest likelihood of being enrolled in private schools, with 225 (69.7% in the age bracket) enrolled. Conversely, the age group of 18 to 19 year olds has the lowest likelihood of being enrolled in a private school, with 411 (97.9% in the age bracket) attending a public institution.
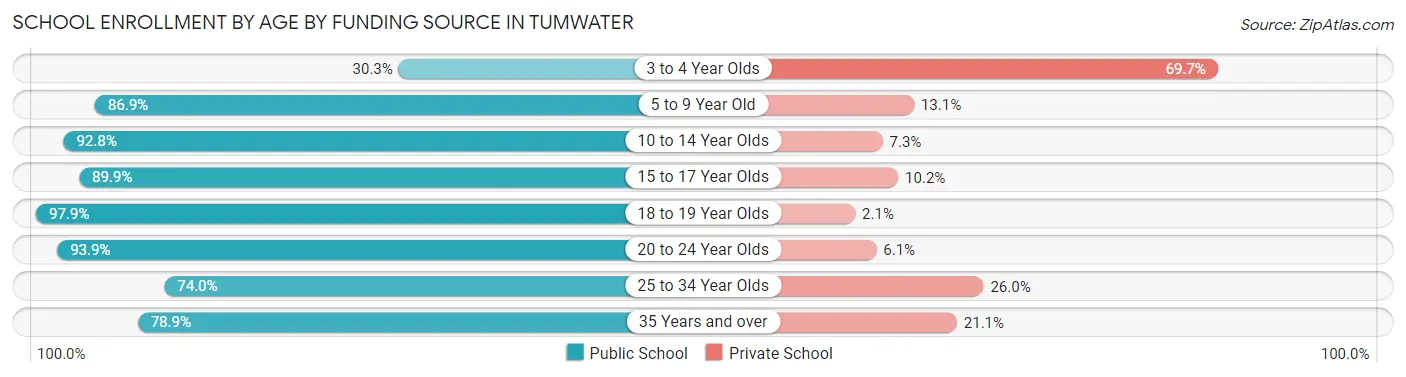
| Age Bracket | Public School | Private School |
| 3 to 4 Year Olds | 98 (30.3%) | 225 (69.7%) |
| 5 to 9 Year Old | 1,546 (86.9%) | 233 (13.1%) |
| 10 to 14 Year Olds | 1,496 (92.7%) | 117 (7.2%) |
| 15 to 17 Year Olds | 584 (89.8%) | 66 (10.2%) |
| 18 to 19 Year Olds | 411 (97.9%) | 9 (2.1%) |
| 20 to 24 Year Olds | 355 (93.9%) | 23 (6.1%) |
| 25 to 34 Year Olds | 375 (74.0%) | 132 (26.0%) |
| 35 Years and over | 423 (78.9%) | 113 (21.1%) |
| Total | 5,288 (85.2%) | 918 (14.8%) |
Educational Attainment by Field of Study in Tumwater
Social sciences (1,176 | 14.3%), business (1,151 | 14.0%), science & technology (893 | 10.8%), education (651 | 7.9%), and psychology (581 | 7.0%) are the most common fields of study among 8,242 individuals in Tumwater who have obtained a bachelor's degree or higher.
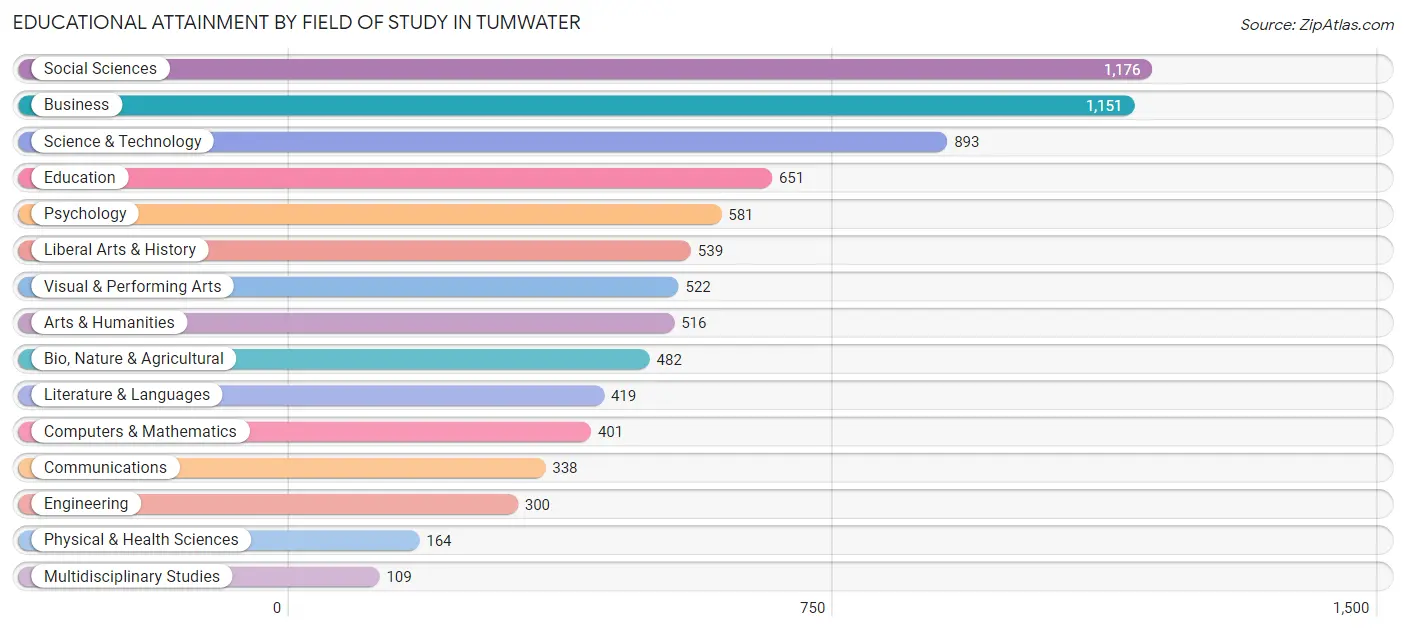
| Field of Study | # Graduates | % Graduates |
| Computers & Mathematics | 401 | 4.9% |
| Bio, Nature & Agricultural | 482 | 5.9% |
| Physical & Health Sciences | 164 | 2.0% |
| Psychology | 581 | 7.0% |
| Social Sciences | 1,176 | 14.3% |
| Engineering | 300 | 3.6% |
| Multidisciplinary Studies | 109 | 1.3% |
| Science & Technology | 893 | 10.8% |
| Business | 1,151 | 14.0% |
| Education | 651 | 7.9% |
| Literature & Languages | 419 | 5.1% |
| Liberal Arts & History | 539 | 6.5% |
| Visual & Performing Arts | 522 | 6.3% |
| Communications | 338 | 4.1% |
| Arts & Humanities | 516 | 6.3% |
| Total | 8,242 | 100.0% |
Transportation & Commute in Tumwater
Vehicle Availability by Sex in Tumwater
The most prevalent vehicle ownership categories in Tumwater are males with 2 vehicles (3,343, accounting for 51.9%) and females with 2 vehicles (2,777, making up 51.9%).
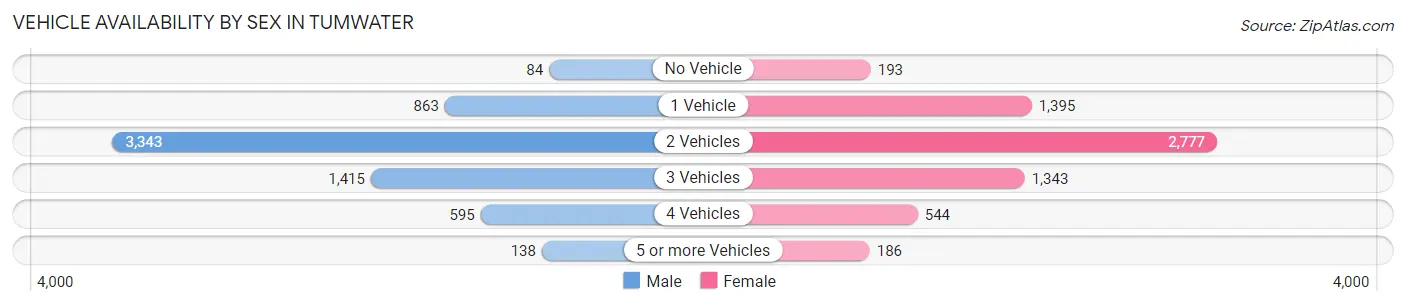
| Vehicles Available | Male | Female |
| No Vehicle | 84 (1.3%) | 193 (3.0%) |
| 1 Vehicle | 863 (13.4%) | 1,395 (21.7%) |
| 2 Vehicles | 3,343 (51.9%) | 2,777 (43.1%) |
| 3 Vehicles | 1,415 (22.0%) | 1,343 (20.9%) |
| 4 Vehicles | 595 (9.2%) | 544 (8.5%) |
| 5 or more Vehicles | 138 (2.1%) | 186 (2.9%) |
| Total | 6,438 (100.0%) | 6,438 (100.0%) |
Commute Time in Tumwater
The most frequently occuring commute durations in Tumwater are 10 to 14 minutes (2,554 commuters, 24.1%), 15 to 19 minutes (2,261 commuters, 21.3%), and 5 to 9 minutes (1,615 commuters, 15.2%).
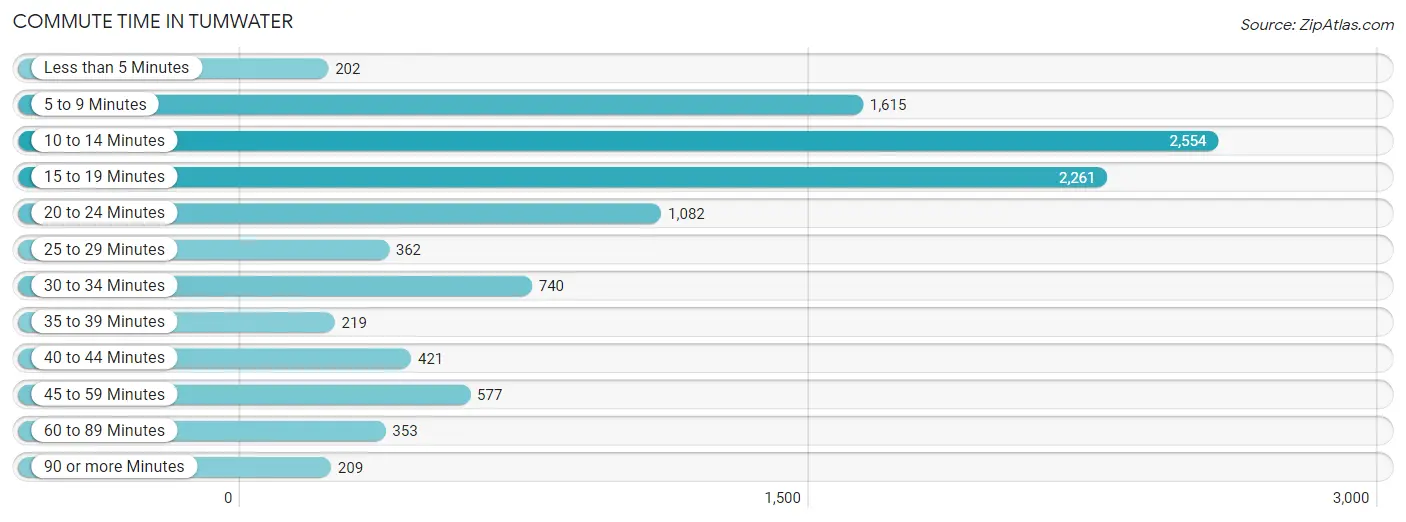
| Commute Time | # Commuters | % Commuters |
| Less than 5 Minutes | 202 | 1.9% |
| 5 to 9 Minutes | 1,615 | 15.2% |
| 10 to 14 Minutes | 2,554 | 24.1% |
| 15 to 19 Minutes | 2,261 | 21.3% |
| 20 to 24 Minutes | 1,082 | 10.2% |
| 25 to 29 Minutes | 362 | 3.4% |
| 30 to 34 Minutes | 740 | 7.0% |
| 35 to 39 Minutes | 219 | 2.1% |
| 40 to 44 Minutes | 421 | 4.0% |
| 45 to 59 Minutes | 577 | 5.4% |
| 60 to 89 Minutes | 353 | 3.3% |
| 90 or more Minutes | 209 | 2.0% |
Commute Time by Sex in Tumwater
The most common commute times in Tumwater are 10 to 14 minutes (1,120 commuters, 20.7%) for males and 10 to 14 minutes (1,434 commuters, 27.7%) for females.
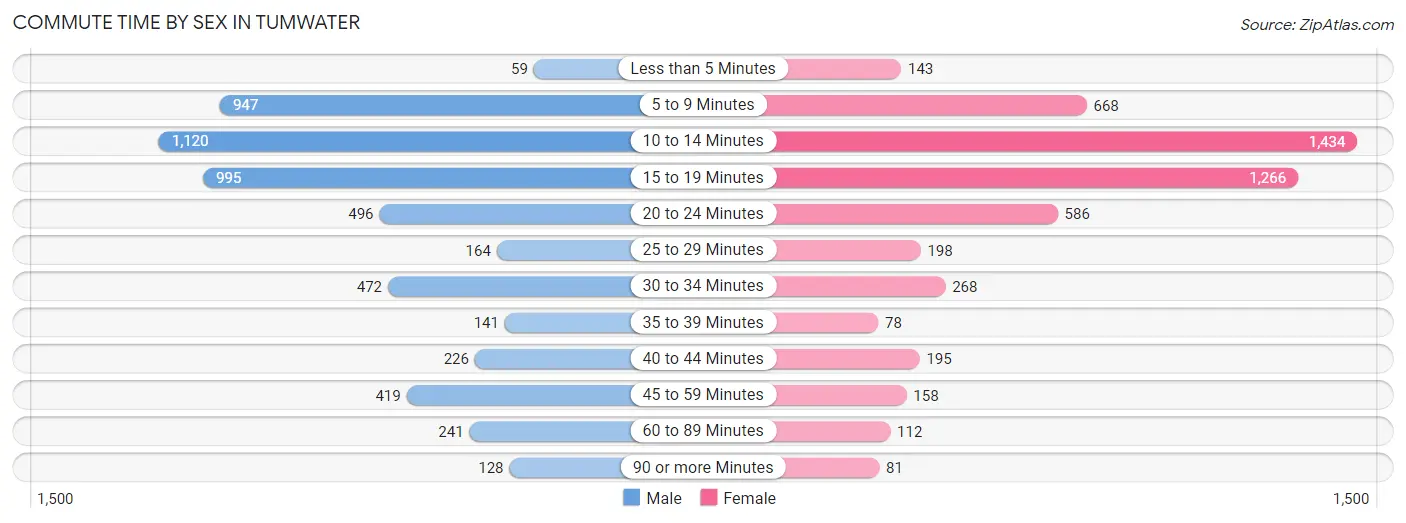
| Commute Time | Male | Female |
| Less than 5 Minutes | 59 (1.1%) | 143 (2.8%) |
| 5 to 9 Minutes | 947 (17.5%) | 668 (12.9%) |
| 10 to 14 Minutes | 1,120 (20.7%) | 1,434 (27.7%) |
| 15 to 19 Minutes | 995 (18.4%) | 1,266 (24.4%) |
| 20 to 24 Minutes | 496 (9.2%) | 586 (11.3%) |
| 25 to 29 Minutes | 164 (3.0%) | 198 (3.8%) |
| 30 to 34 Minutes | 472 (8.7%) | 268 (5.2%) |
| 35 to 39 Minutes | 141 (2.6%) | 78 (1.5%) |
| 40 to 44 Minutes | 226 (4.2%) | 195 (3.8%) |
| 45 to 59 Minutes | 419 (7.7%) | 158 (3.0%) |
| 60 to 89 Minutes | 241 (4.5%) | 112 (2.2%) |
| 90 or more Minutes | 128 (2.4%) | 81 (1.6%) |
Time of Departure to Work by Sex in Tumwater
The most frequent times of departure to work in Tumwater are 7:00 AM to 7:29 AM (808, 14.9%) for males and 7:00 AM to 7:29 AM (862, 16.6%) for females.
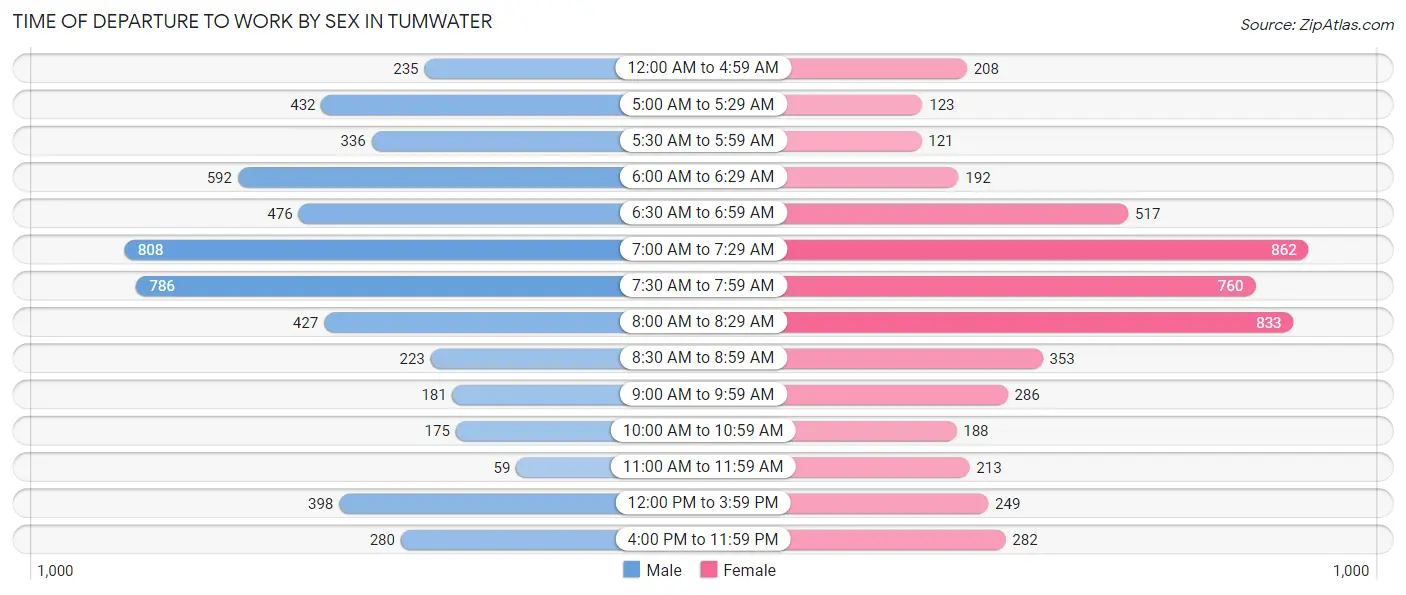
| Time of Departure | Male | Female |
| 12:00 AM to 4:59 AM | 235 (4.3%) | 208 (4.0%) |
| 5:00 AM to 5:29 AM | 432 (8.0%) | 123 (2.4%) |
| 5:30 AM to 5:59 AM | 336 (6.2%) | 121 (2.3%) |
| 6:00 AM to 6:29 AM | 592 (11.0%) | 192 (3.7%) |
| 6:30 AM to 6:59 AM | 476 (8.8%) | 517 (10.0%) |
| 7:00 AM to 7:29 AM | 808 (14.9%) | 862 (16.6%) |
| 7:30 AM to 7:59 AM | 786 (14.5%) | 760 (14.6%) |
| 8:00 AM to 8:29 AM | 427 (7.9%) | 833 (16.1%) |
| 8:30 AM to 8:59 AM | 223 (4.1%) | 353 (6.8%) |
| 9:00 AM to 9:59 AM | 181 (3.4%) | 286 (5.5%) |
| 10:00 AM to 10:59 AM | 175 (3.2%) | 188 (3.6%) |
| 11:00 AM to 11:59 AM | 59 (1.1%) | 213 (4.1%) |
| 12:00 PM to 3:59 PM | 398 (7.4%) | 249 (4.8%) |
| 4:00 PM to 11:59 PM | 280 (5.2%) | 282 (5.4%) |
| Total | 5,408 (100.0%) | 5,187 (100.0%) |
Housing Occupancy in Tumwater
Occupancy by Ownership in Tumwater
Of the total 9,967 dwellings in Tumwater, owner-occupied units account for 5,923 (59.4%), while renter-occupied units make up 4,044 (40.6%).
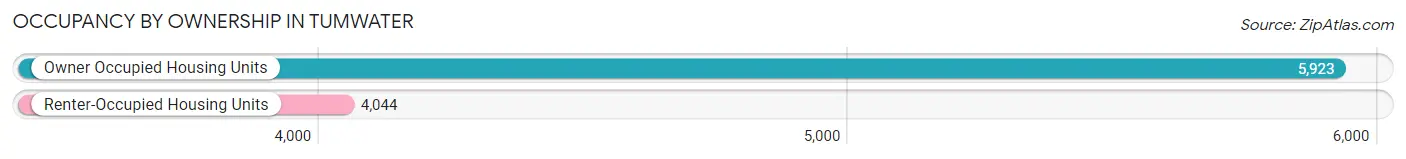
| Occupancy | # Housing Units | % Housing Units |
| Owner Occupied Housing Units | 5,923 | 59.4% |
| Renter-Occupied Housing Units | 4,044 | 40.6% |
| Total Occupied Housing Units | 9,967 | 100.0% |
Occupancy by Household Size in Tumwater
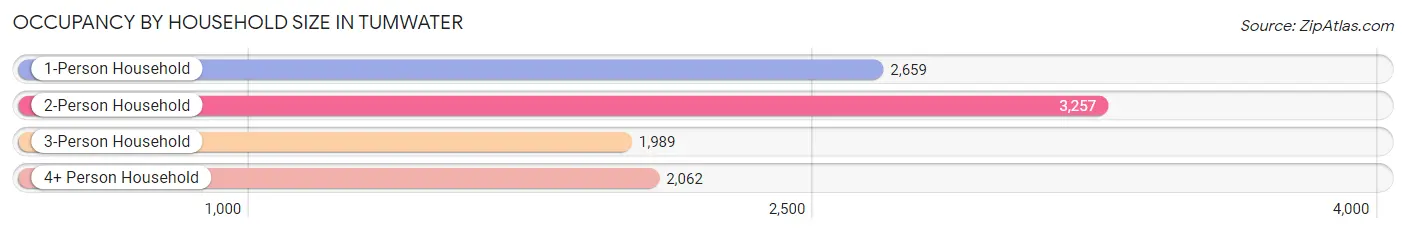
| Household Size | # Housing Units | % Housing Units |
| 1-Person Household | 2,659 | 26.7% |
| 2-Person Household | 3,257 | 32.7% |
| 3-Person Household | 1,989 | 20.0% |
| 4+ Person Household | 2,062 | 20.7% |
| Total Housing Units | 9,967 | 100.0% |
Occupancy by Ownership by Household Size in Tumwater
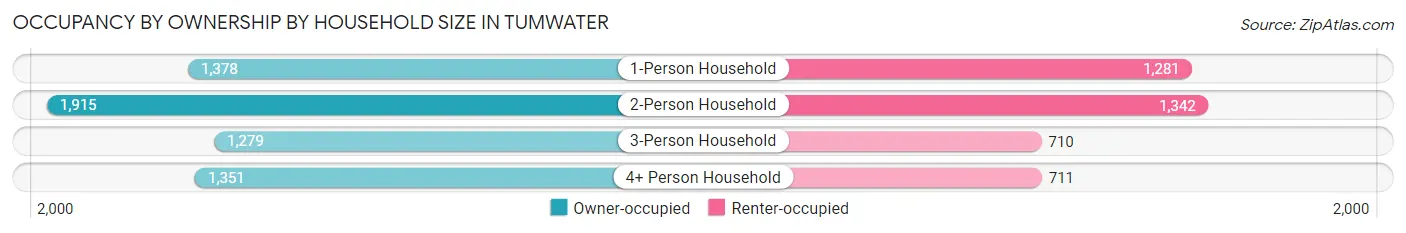
| Household Size | Owner-occupied | Renter-occupied |
| 1-Person Household | 1,378 (51.8%) | 1,281 (48.2%) |
| 2-Person Household | 1,915 (58.8%) | 1,342 (41.2%) |
| 3-Person Household | 1,279 (64.3%) | 710 (35.7%) |
| 4+ Person Household | 1,351 (65.5%) | 711 (34.5%) |
| Total Housing Units | 5,923 (59.4%) | 4,044 (40.6%) |
Occupancy by Educational Attainment in Tumwater
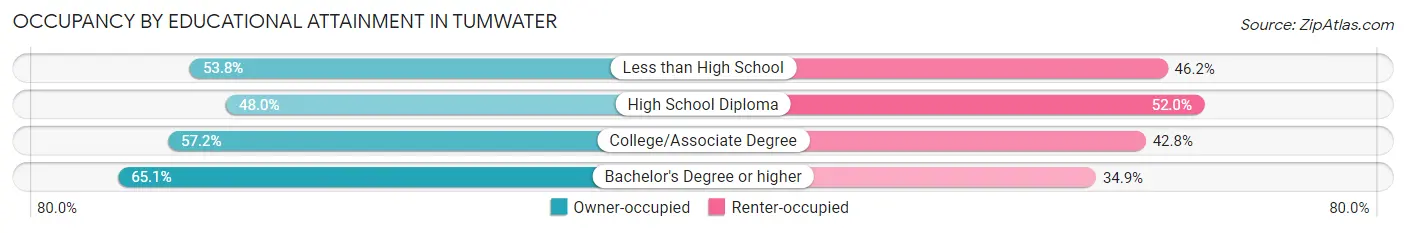
| Household Size | Owner-occupied | Renter-occupied |
| Less than High School | 171 (53.8%) | 147 (46.2%) |
| High School Diploma | 587 (48.0%) | 635 (52.0%) |
| College/Associate Degree | 2,351 (57.2%) | 1,756 (42.8%) |
| Bachelor's Degree or higher | 2,814 (65.1%) | 1,506 (34.9%) |
Occupancy by Age of Householder in Tumwater
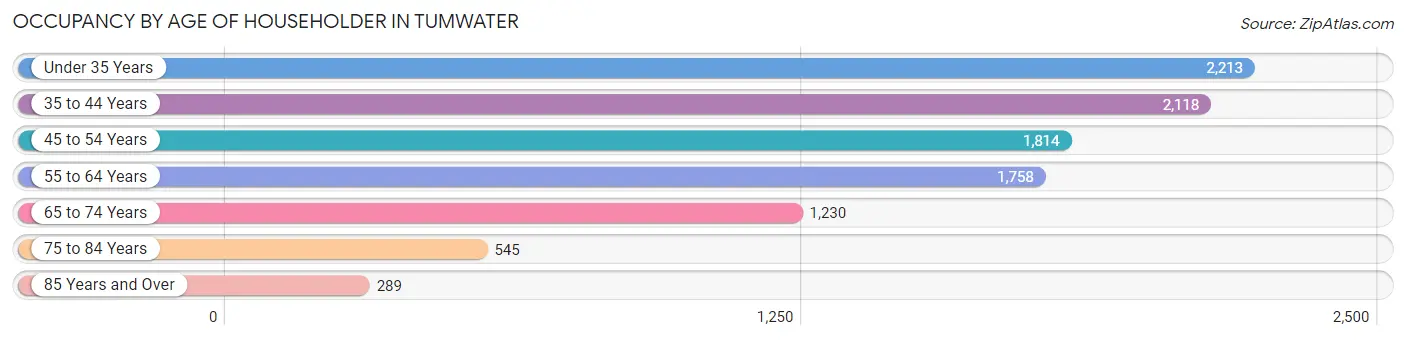
| Age Bracket | # Households | % Households |
| Under 35 Years | 2,213 | 22.2% |
| 35 to 44 Years | 2,118 | 21.2% |
| 45 to 54 Years | 1,814 | 18.2% |
| 55 to 64 Years | 1,758 | 17.6% |
| 65 to 74 Years | 1,230 | 12.3% |
| 75 to 84 Years | 545 | 5.5% |
| 85 Years and Over | 289 | 2.9% |
| Total | 9,967 | 100.0% |
Housing Finances in Tumwater
Median Income by Occupancy in Tumwater
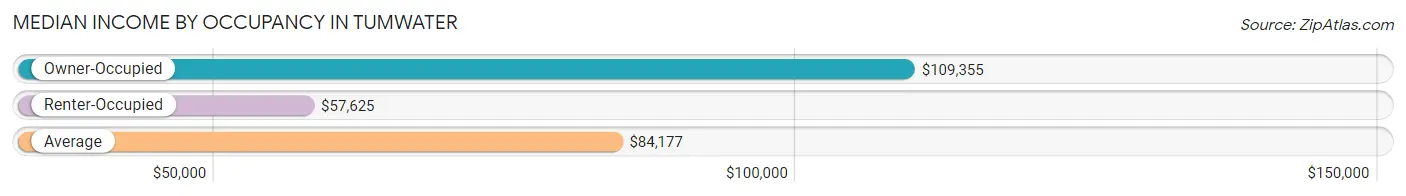
| Occupancy Type | # Households | Median Income |
| Owner-Occupied | 5,923 (59.4%) | $109,355 |
| Renter-Occupied | 4,044 (40.6%) | $57,625 |
| Average | 9,967 (100.0%) | $84,177 |
Occupancy by Householder Income Bracket in Tumwater
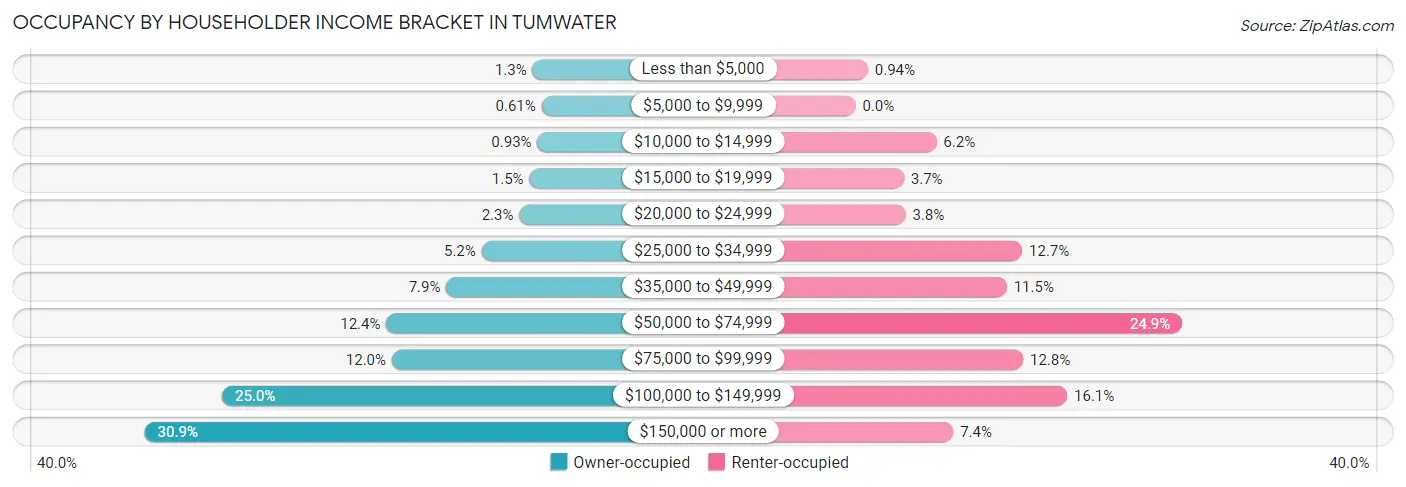
| Income Bracket | Owner-occupied | Renter-occupied |
| Less than $5,000 | 77 (1.3%) | 38 (0.9%) |
| $5,000 to $9,999 | 36 (0.6%) | 0 (0.0%) |
| $10,000 to $14,999 | 55 (0.9%) | 249 (6.2%) |
| $15,000 to $19,999 | 91 (1.5%) | 149 (3.7%) |
| $20,000 to $24,999 | 137 (2.3%) | 154 (3.8%) |
| $25,000 to $34,999 | 307 (5.2%) | 513 (12.7%) |
| $35,000 to $49,999 | 466 (7.9%) | 466 (11.5%) |
| $50,000 to $74,999 | 737 (12.4%) | 1,006 (24.9%) |
| $75,000 to $99,999 | 712 (12.0%) | 516 (12.8%) |
| $100,000 to $149,999 | 1,478 (24.9%) | 652 (16.1%) |
| $150,000 or more | 1,827 (30.8%) | 301 (7.4%) |
| Total | 5,923 (100.0%) | 4,044 (100.0%) |
Monthly Housing Cost Tiers in Tumwater
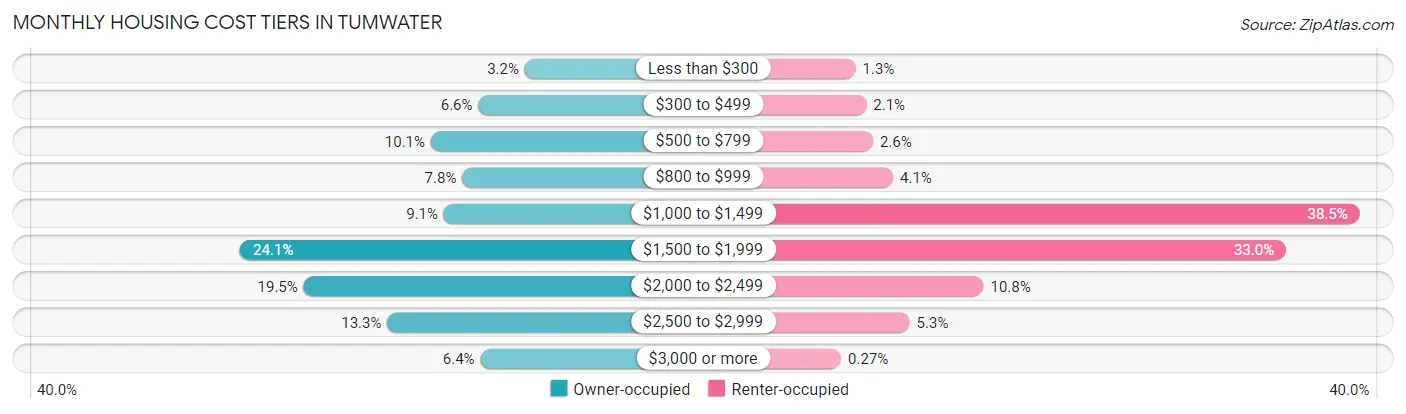
| Monthly Cost | Owner-occupied | Renter-occupied |
| Less than $300 | 187 (3.2%) | 54 (1.3%) |
| $300 to $499 | 390 (6.6%) | 86 (2.1%) |
| $500 to $799 | 597 (10.1%) | 106 (2.6%) |
| $800 to $999 | 460 (7.8%) | 166 (4.1%) |
| $1,000 to $1,499 | 540 (9.1%) | 1,555 (38.5%) |
| $1,500 to $1,999 | 1,429 (24.1%) | 1,336 (33.0%) |
| $2,000 to $2,499 | 1,152 (19.5%) | 435 (10.8%) |
| $2,500 to $2,999 | 787 (13.3%) | 215 (5.3%) |
| $3,000 or more | 381 (6.4%) | 11 (0.3%) |
| Total | 5,923 (100.0%) | 4,044 (100.0%) |
Physical Housing Characteristics in Tumwater
Housing Structures in Tumwater
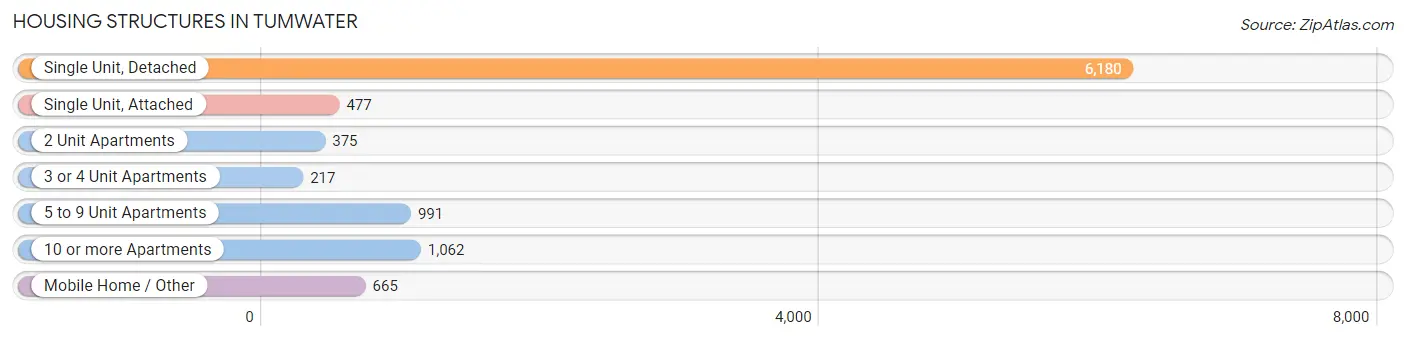
| Structure Type | # Housing Units | % Housing Units |
| Single Unit, Detached | 6,180 | 62.0% |
| Single Unit, Attached | 477 | 4.8% |
| 2 Unit Apartments | 375 | 3.8% |
| 3 or 4 Unit Apartments | 217 | 2.2% |
| 5 to 9 Unit Apartments | 991 | 9.9% |
| 10 or more Apartments | 1,062 | 10.7% |
| Mobile Home / Other | 665 | 6.7% |
| Total | 9,967 | 100.0% |
Housing Structures by Occupancy in Tumwater
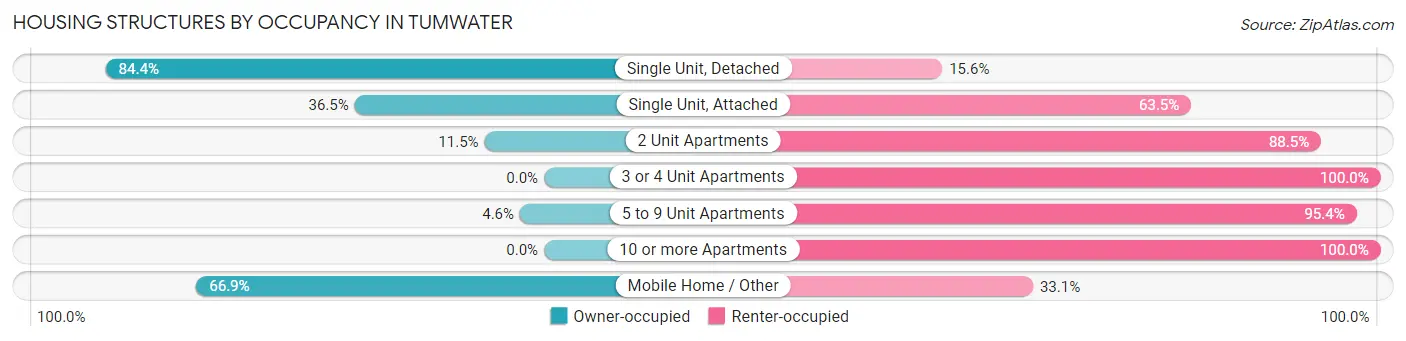
| Structure Type | Owner-occupied | Renter-occupied |
| Single Unit, Detached | 5,215 (84.4%) | 965 (15.6%) |
| Single Unit, Attached | 174 (36.5%) | 303 (63.5%) |
| 2 Unit Apartments | 43 (11.5%) | 332 (88.5%) |
| 3 or 4 Unit Apartments | 0 (0.0%) | 217 (100.0%) |
| 5 to 9 Unit Apartments | 46 (4.6%) | 945 (95.4%) |
| 10 or more Apartments | 0 (0.0%) | 1,062 (100.0%) |
| Mobile Home / Other | 445 (66.9%) | 220 (33.1%) |
| Total | 5,923 (59.4%) | 4,044 (40.6%) |
Housing Structures by Number of Rooms in Tumwater
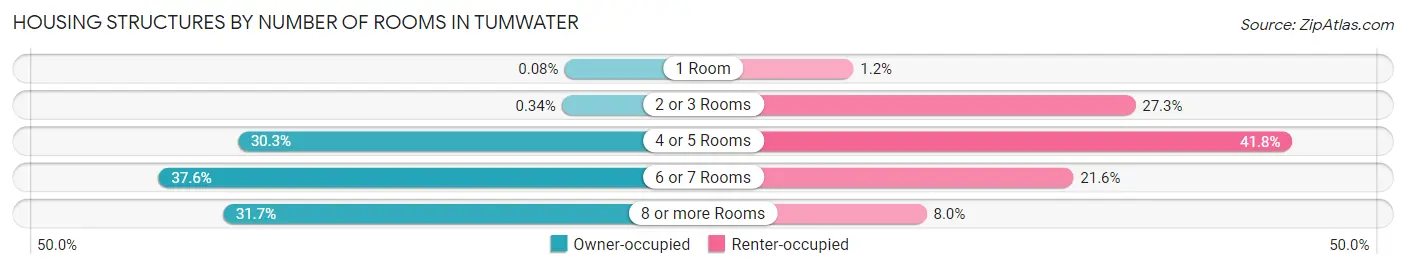
| Number of Rooms | Owner-occupied | Renter-occupied |
| 1 Room | 5 (0.1%) | 50 (1.2%) |
| 2 or 3 Rooms | 20 (0.3%) | 1,105 (27.3%) |
| 4 or 5 Rooms | 1,794 (30.3%) | 1,692 (41.8%) |
| 6 or 7 Rooms | 2,228 (37.6%) | 873 (21.6%) |
| 8 or more Rooms | 1,876 (31.7%) | 324 (8.0%) |
| Total | 5,923 (100.0%) | 4,044 (100.0%) |
Housing Structure by Heating Type in Tumwater
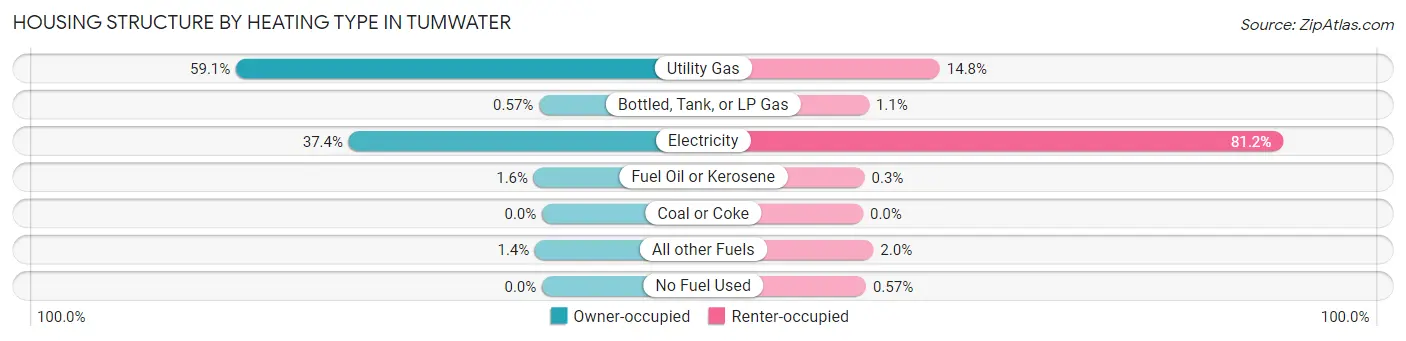
| Heating Type | Owner-occupied | Renter-occupied |
| Utility Gas | 3,502 (59.1%) | 600 (14.8%) |
| Bottled, Tank, or LP Gas | 34 (0.6%) | 46 (1.1%) |
| Electricity | 2,213 (37.4%) | 3,282 (81.2%) |
| Fuel Oil or Kerosene | 94 (1.6%) | 12 (0.3%) |
| Coal or Coke | 0 (0.0%) | 0 (0.0%) |
| All other Fuels | 80 (1.3%) | 81 (2.0%) |
| No Fuel Used | 0 (0.0%) | 23 (0.6%) |
| Total | 5,923 (100.0%) | 4,044 (100.0%) |
Household Vehicle Usage in Tumwater
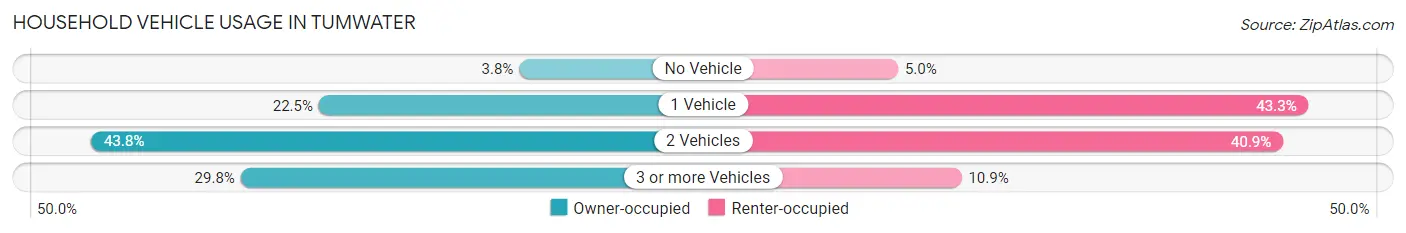
| Vehicles per Household | Owner-occupied | Renter-occupied |
| No Vehicle | 227 (3.8%) | 200 (5.0%) |
| 1 Vehicle | 1,335 (22.5%) | 1,750 (43.3%) |
| 2 Vehicles | 2,594 (43.8%) | 1,654 (40.9%) |
| 3 or more Vehicles | 1,767 (29.8%) | 440 (10.9%) |
| Total | 5,923 (100.0%) | 4,044 (100.0%) |
Real Estate & Mortgages in Tumwater
Real Estate and Mortgage Overview in Tumwater
| Characteristic | Without Mortgage | With Mortgage |
| Housing Units | 1,750 | 4,173 |
| Median Property Value | $339,900 | $437,600 |
| Median Household Income | $64,942 | $1,654 |
| Monthly Housing Costs | $706 | $381 |
| Real Estate Taxes | $3,412 | $31 |
Property Value by Mortgage Status in Tumwater
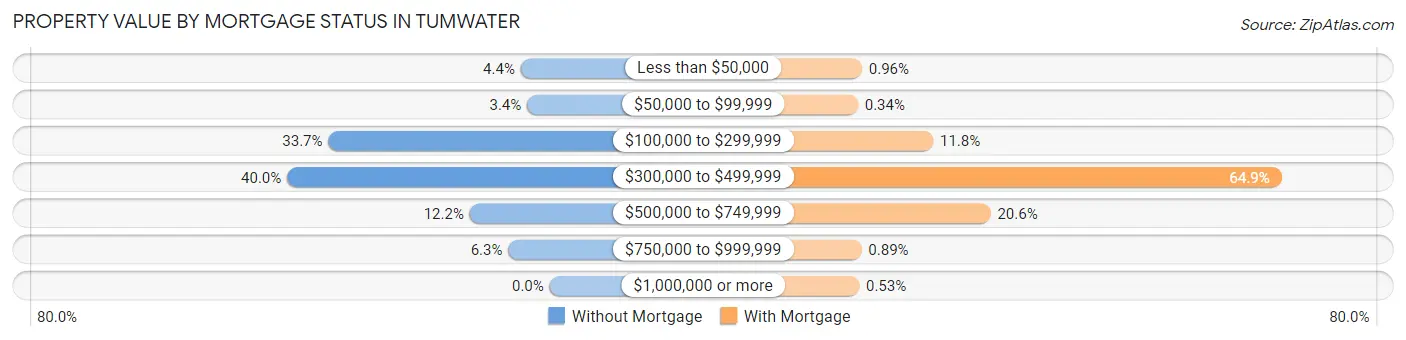
| Property Value | Without Mortgage | With Mortgage |
| Less than $50,000 | 77 (4.4%) | 40 (1.0%) |
| $50,000 to $99,999 | 60 (3.4%) | 14 (0.3%) |
| $100,000 to $299,999 | 590 (33.7%) | 493 (11.8%) |
| $300,000 to $499,999 | 700 (40.0%) | 2,709 (64.9%) |
| $500,000 to $749,999 | 213 (12.2%) | 858 (20.6%) |
| $750,000 to $999,999 | 110 (6.3%) | 37 (0.9%) |
| $1,000,000 or more | 0 (0.0%) | 22 (0.5%) |
| Total | 1,750 (100.0%) | 4,173 (100.0%) |
Household Income by Mortgage Status in Tumwater
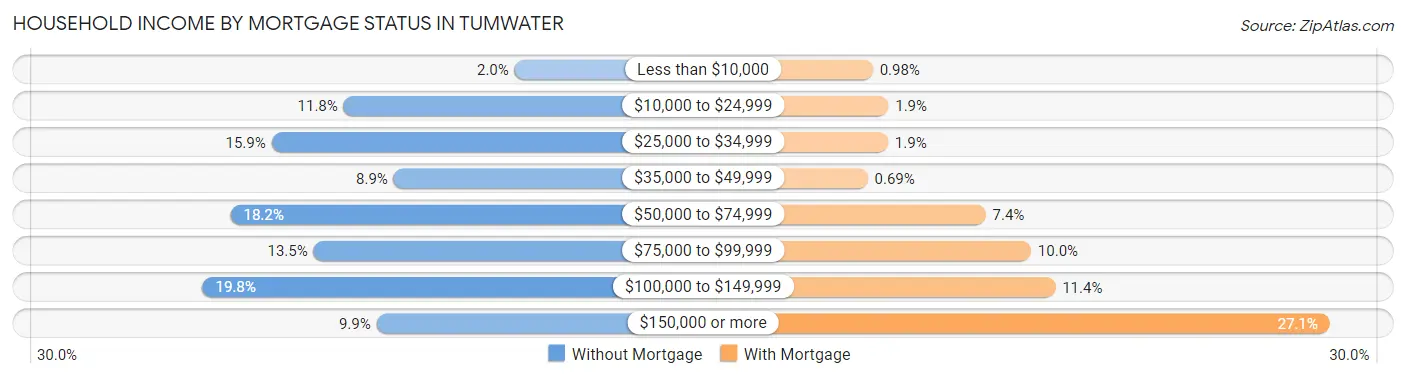
| Household Income | Without Mortgage | With Mortgage |
| Less than $10,000 | 35 (2.0%) | 41 (1.0%) |
| $10,000 to $24,999 | 206 (11.8%) | 78 (1.9%) |
| $25,000 to $34,999 | 278 (15.9%) | 77 (1.8%) |
| $35,000 to $49,999 | 156 (8.9%) | 29 (0.7%) |
| $50,000 to $74,999 | 319 (18.2%) | 310 (7.4%) |
| $75,000 to $99,999 | 236 (13.5%) | 418 (10.0%) |
| $100,000 to $149,999 | 347 (19.8%) | 476 (11.4%) |
| $150,000 or more | 173 (9.9%) | 1,131 (27.1%) |
| Total | 1,750 (100.0%) | 4,173 (100.0%) |
Property Value to Household Income Ratio in Tumwater
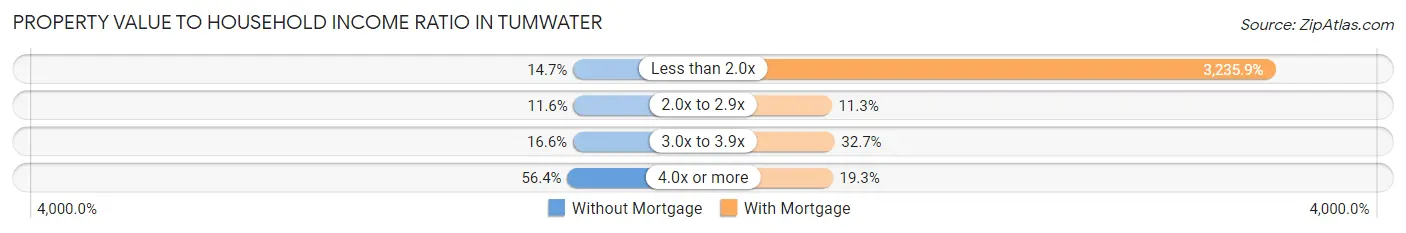
| Value-to-Income Ratio | Without Mortgage | With Mortgage |
| Less than 2.0x | 257 (14.7%) | 135,032 (3,235.8%) |
| 2.0x to 2.9x | 203 (11.6%) | 472 (11.3%) |
| 3.0x to 3.9x | 290 (16.6%) | 1,366 (32.7%) |
| 4.0x or more | 987 (56.4%) | 804 (19.3%) |
| Total | 1,750 (100.0%) | 4,173 (100.0%) |
Real Estate Taxes by Mortgage Status in Tumwater
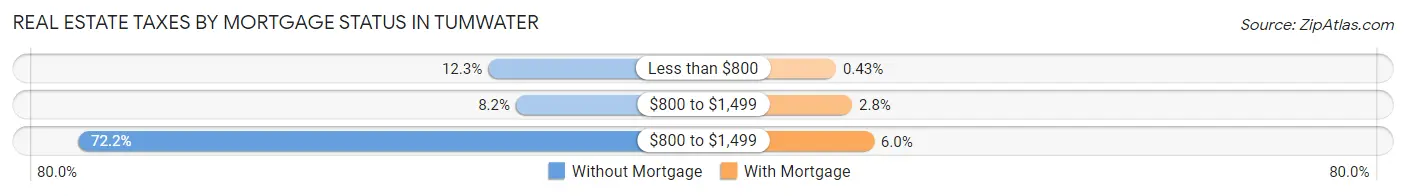
| Property Taxes | Without Mortgage | With Mortgage |
| Less than $800 | 215 (12.3%) | 18 (0.4%) |
| $800 to $1,499 | 144 (8.2%) | 116 (2.8%) |
| $800 to $1,499 | 1,263 (72.2%) | 249 (6.0%) |
| Total | 1,750 (100.0%) | 4,173 (100.0%) |
Health & Disability in Tumwater
Health Insurance Coverage by Age in Tumwater
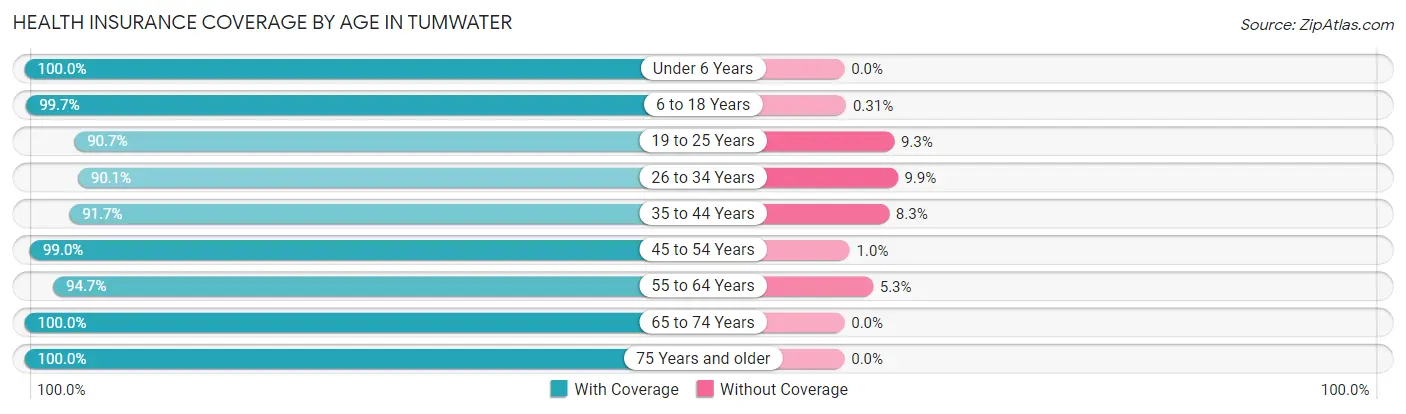
| Age Bracket | With Coverage | Without Coverage |
| Under 6 Years | 1,497 (100.0%) | 0 (0.0%) |
| 6 to 18 Years | 4,143 (99.7%) | 13 (0.3%) |
| 19 to 25 Years | 1,853 (90.7%) | 189 (9.3%) |
| 26 to 34 Years | 3,712 (90.1%) | 409 (9.9%) |
| 35 to 44 Years | 3,559 (91.7%) | 323 (8.3%) |
| 45 to 54 Years | 2,875 (99.0%) | 29 (1.0%) |
| 55 to 64 Years | 2,730 (94.7%) | 153 (5.3%) |
| 65 to 74 Years | 2,025 (100.0%) | 0 (0.0%) |
| 75 Years and older | 1,427 (100.0%) | 0 (0.0%) |
| Total | 23,821 (95.5%) | 1,116 (4.5%) |
Health Insurance Coverage by Citizenship Status in Tumwater

| Citizenship Status | With Coverage | Without Coverage |
| Native Born | 1,497 (100.0%) | 0 (0.0%) |
| Foreign Born, Citizen | 4,143 (99.7%) | 13 (0.3%) |
| Foreign Born, not a Citizen | 1,853 (90.7%) | 189 (9.3%) |
Health Insurance Coverage by Household Income in Tumwater
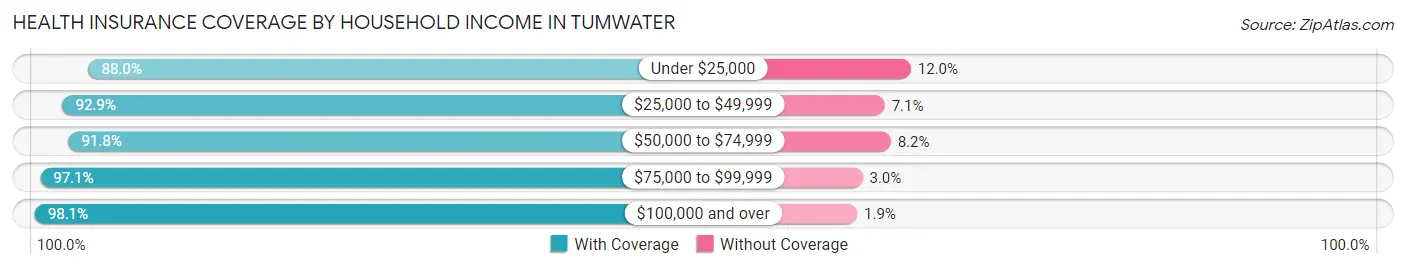
| Household Income | With Coverage | Without Coverage |
| Under $25,000 | 1,379 (88.0%) | 188 (12.0%) |
| $25,000 to $49,999 | 3,240 (92.9%) | 248 (7.1%) |
| $50,000 to $74,999 | 3,646 (91.8%) | 327 (8.2%) |
| $75,000 to $99,999 | 2,831 (97.1%) | 86 (2.9%) |
| $100,000 and over | 12,546 (98.1%) | 247 (1.9%) |
Public vs Private Health Insurance Coverage by Age in Tumwater
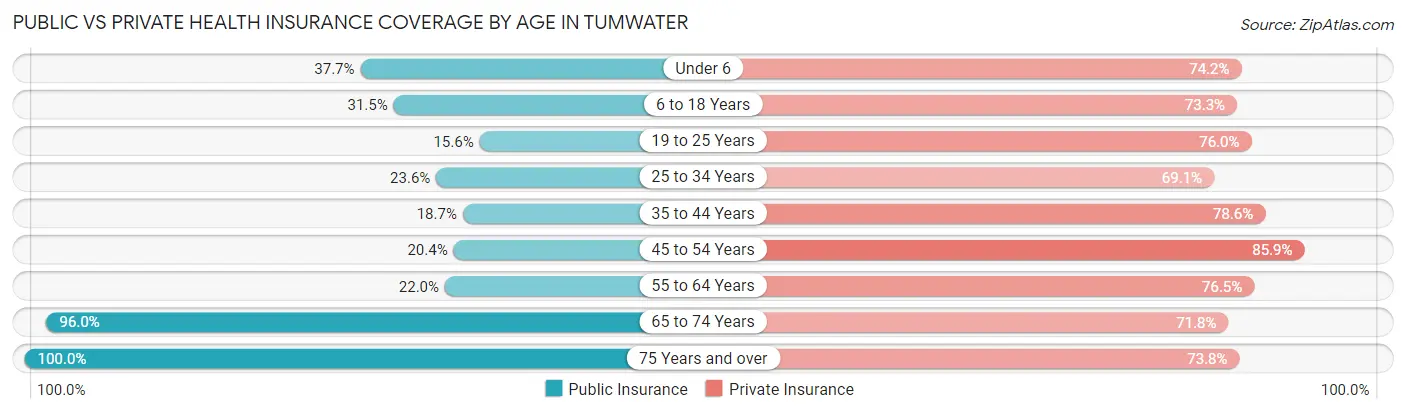
| Age Bracket | Public Insurance | Private Insurance |
| Under 6 | 564 (37.7%) | 1,110 (74.2%) |
| 6 to 18 Years | 1,310 (31.5%) | 3,048 (73.3%) |
| 19 to 25 Years | 318 (15.6%) | 1,552 (76.0%) |
| 25 to 34 Years | 973 (23.6%) | 2,846 (69.1%) |
| 35 to 44 Years | 725 (18.7%) | 3,050 (78.6%) |
| 45 to 54 Years | 592 (20.4%) | 2,493 (85.9%) |
| 55 to 64 Years | 634 (22.0%) | 2,206 (76.5%) |
| 65 to 74 Years | 1,943 (96.0%) | 1,453 (71.8%) |
| 75 Years and over | 1,427 (100.0%) | 1,053 (73.8%) |
| Total | 8,486 (34.0%) | 18,811 (75.4%) |
Disability Status by Sex by Age in Tumwater
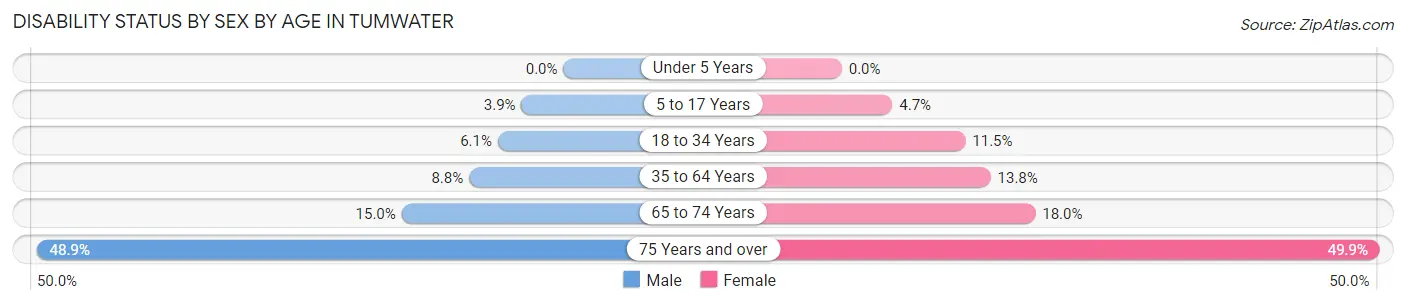
| Age Bracket | Male | Female |
| Under 5 Years | 0 (0.0%) | 0 (0.0%) |
| 5 to 17 Years | 85 (3.9%) | 94 (4.7%) |
| 18 to 34 Years | 180 (6.1%) | 403 (11.5%) |
| 35 to 64 Years | 398 (8.7%) | 707 (13.8%) |
| 65 to 74 Years | 110 (15.0%) | 232 (18.0%) |
| 75 Years and over | 349 (48.9%) | 356 (49.9%) |
Disability Class by Sex by Age in Tumwater
Disability Class: Hearing Difficulty
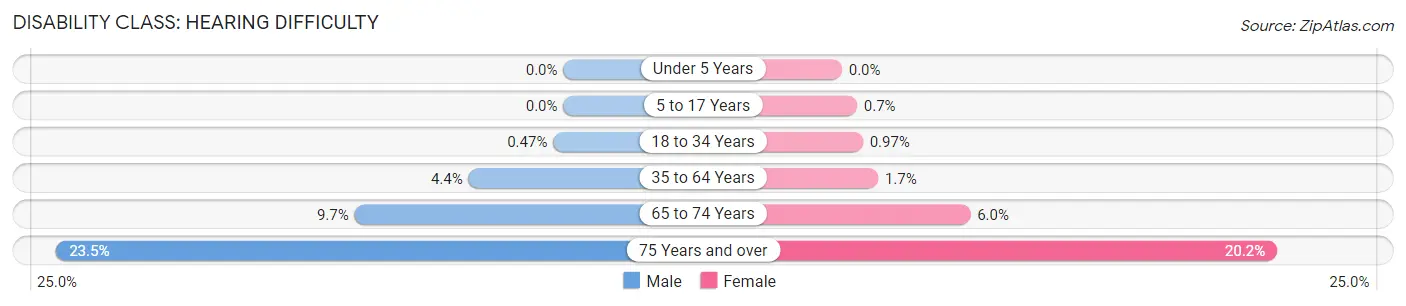
| Age Bracket | Male | Female |
| Under 5 Years | 0 (0.0%) | 0 (0.0%) |
| 5 to 17 Years | 0 (0.0%) | 14 (0.7%) |
| 18 to 34 Years | 14 (0.5%) | 34 (1.0%) |
| 35 to 64 Years | 200 (4.4%) | 86 (1.7%) |
| 65 to 74 Years | 71 (9.7%) | 77 (6.0%) |
| 75 Years and over | 168 (23.5%) | 144 (20.2%) |
Disability Class: Vision Difficulty
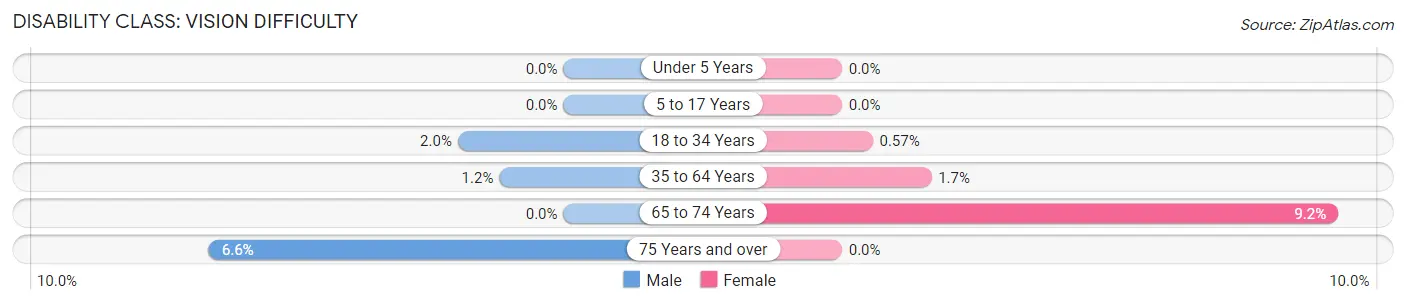
| Age Bracket | Male | Female |
| Under 5 Years | 0 (0.0%) | 0 (0.0%) |
| 5 to 17 Years | 0 (0.0%) | 0 (0.0%) |
| 18 to 34 Years | 58 (2.0%) | 20 (0.6%) |
| 35 to 64 Years | 54 (1.2%) | 85 (1.7%) |
| 65 to 74 Years | 0 (0.0%) | 119 (9.2%) |
| 75 Years and over | 47 (6.6%) | 0 (0.0%) |
Disability Class: Cognitive Difficulty
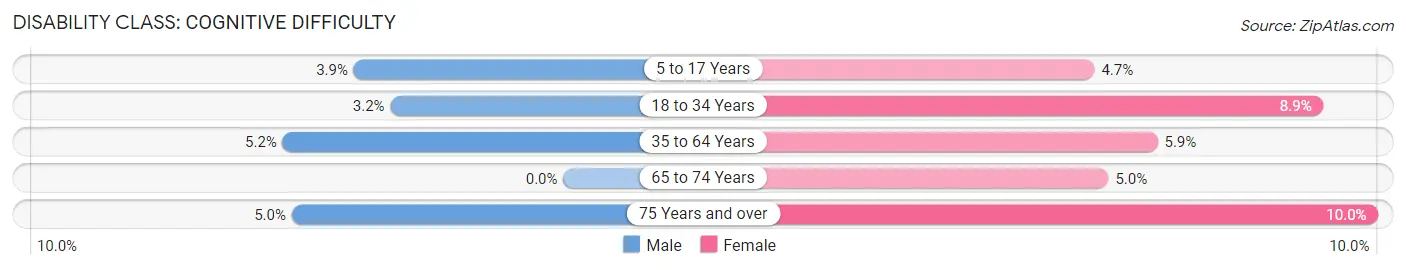
| Age Bracket | Male | Female |
| 5 to 17 Years | 85 (3.9%) | 94 (4.7%) |
| 18 to 34 Years | 95 (3.2%) | 314 (8.9%) |
| 35 to 64 Years | 237 (5.2%) | 300 (5.9%) |
| 65 to 74 Years | 0 (0.0%) | 64 (5.0%) |
| 75 Years and over | 36 (5.0%) | 71 (10.0%) |
Disability Class: Ambulatory Difficulty
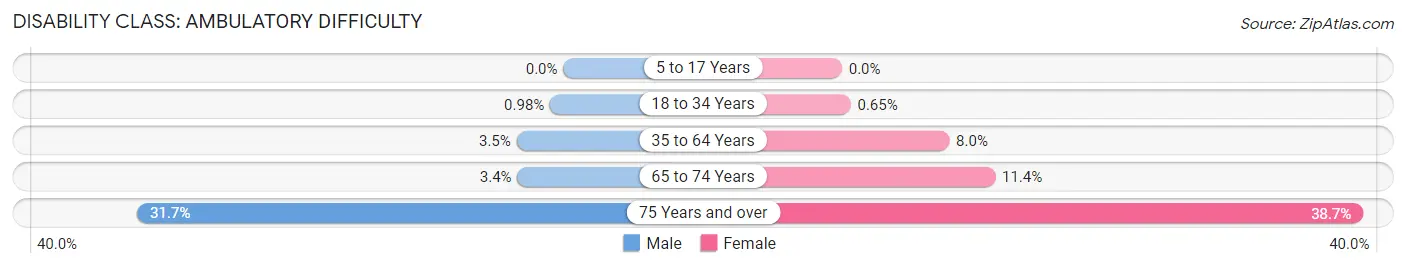
| Age Bracket | Male | Female |
| 5 to 17 Years | 0 (0.0%) | 0 (0.0%) |
| 18 to 34 Years | 29 (1.0%) | 23 (0.6%) |
| 35 to 64 Years | 158 (3.5%) | 408 (8.0%) |
| 65 to 74 Years | 25 (3.4%) | 147 (11.4%) |
| 75 Years and over | 226 (31.7%) | 276 (38.7%) |
Disability Class: Self-Care Difficulty
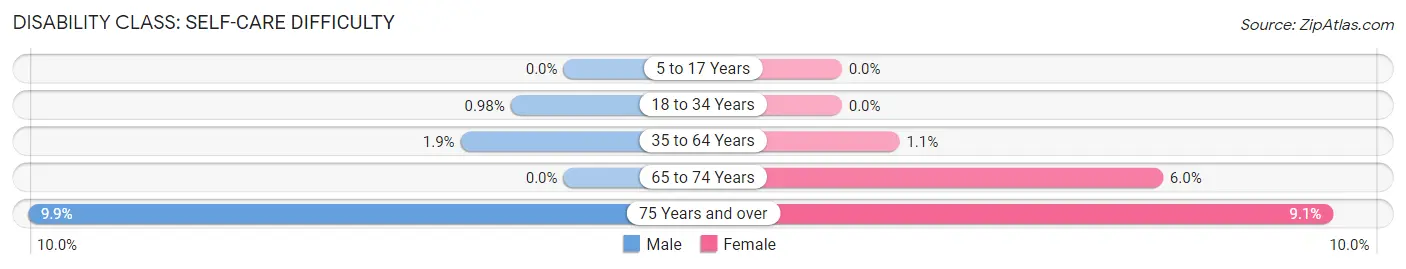
| Age Bracket | Male | Female |
| 5 to 17 Years | 0 (0.0%) | 0 (0.0%) |
| 18 to 34 Years | 29 (1.0%) | 0 (0.0%) |
| 35 to 64 Years | 87 (1.9%) | 55 (1.1%) |
| 65 to 74 Years | 0 (0.0%) | 77 (6.0%) |
| 75 Years and over | 71 (9.9%) | 65 (9.1%) |
Technology Access in Tumwater
Computing Device Access in Tumwater
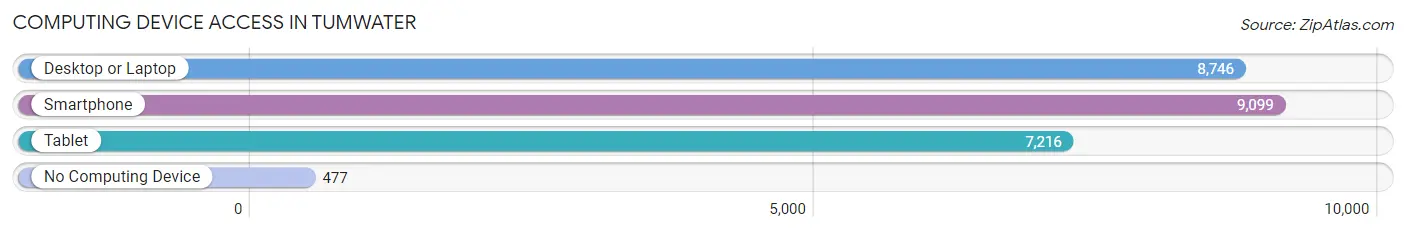
| Device Type | # Households | % Households |
| Desktop or Laptop | 8,746 | 87.7% |
| Smartphone | 9,099 | 91.3% |
| Tablet | 7,216 | 72.4% |
| No Computing Device | 477 | 4.8% |
| Total | 9,967 | 100.0% |
Internet Access in Tumwater
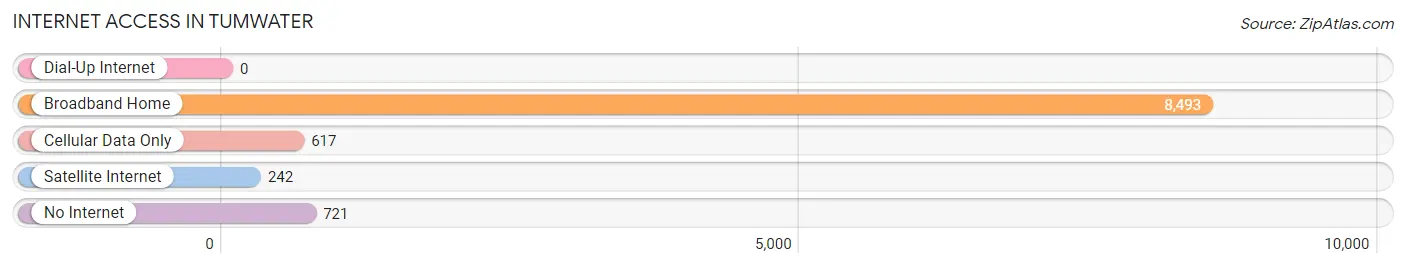
| Internet Type | # Households | % Households |
| Dial-Up Internet | 0 | 0.0% |
| Broadband Home | 8,493 | 85.2% |
| Cellular Data Only | 617 | 6.2% |
| Satellite Internet | 242 | 2.4% |
| No Internet | 721 | 7.2% |
| Total | 9,967 | 100.0% |
Tumwater Summary
Tumwater is a city located in Thurston County, Washington, United States. It is situated at the southern end of Puget Sound on the Deschutes River estuary, and is the county seat of Thurston County. The population was 17,371 at the 2010 census.
History
The area that is now Tumwater was originally inhabited by the Nisqually and Squaxin Island tribes. The first European settlers arrived in the area in the early 1800s, and the town was officially founded in 1845. The town was named after the nearby Tumwater Falls, which were named by explorer George Vancouver in 1792.
The town grew rapidly in the late 1800s, and by the early 1900s it had become a major logging center. The town was incorporated in 1875, and the first mayor was elected in 1876.
In the early 1900s, the town was home to several large lumber mills, and the economy was largely based on the timber industry. The town was also home to several canneries, which processed salmon and other fish from the nearby rivers.
In the 1950s, the timber industry began to decline, and the town began to diversify its economy. The town is now home to several large companies, including the Olympia Brewing Company, which was founded in 1896.
Geography
Tumwater is located at 47°0′25″N 122°54′17″W (47.0069, -122.9047). According to the United States Census Bureau, the city has a total area of 11.2 square miles (29.0 km2), of which, 10.9 square miles (28.2 km2) is land and 0.3 square miles (0.8 km2) is water.
The city is located at the southern end of Puget Sound, and is bordered by the Deschutes River estuary to the west. The city is located in the foothills of the Cascade Mountains, and is surrounded by forests and lakes.
Economy
Tumwater’s economy is largely based on the timber industry, with several large lumber mills located in the city. The city is also home to several large companies, including the Olympia Brewing Company, which was founded in 1896.
The city is also home to several government agencies, including the Washington State Department of Corrections, the Washington State Department of Social and Health Services, and the Washington State Department of Transportation.
Demographics
As of the 2010 census, there were 17,371 people, 6,945 households, and 4,541 families residing in the city. The population density was 1,588.3 people per square mile (613.7/km2). There were 7,541 housing units at an average density of 690.3 per square mile (266.7/km2). The racial makeup of the city was 81.2% White, 5.2% African American, 1.2% Native American, 5.2% Asian, 0.4% Pacific Islander, 3.2% from other races, and 4.0% from two or more races. Hispanic or Latino of any race were 8.2% of the population.
There were 6,945 households, out of which 30.2% had children under the age of 18 living with them, 46.2% were married couples living together, 12.3% had a female householder with no husband present, and 36.7% were non-families. 29.7% of all households were made up of individuals, and 10.2% had someone living alone who was 65 years of age or older. The average household size was 2.45 and the average family size was 3.03.
In the city, the population was spread out, with 24.7% under the age of 18, 8.7% from 18 to 24, 29.2% from 25 to 44, 24.2% from 45 to 64, and 13.2% who were 65 years of age or older. The median age was 37 years. For every 100 females, there were 95.2 males. For every 100 females age 18 and over, there were 92.3 males.
The median income for a household in the city was $45,945, and the median income for a family was $54,945. Males had a median income of $41,945 versus $30,945 for females. The per capita income for the city was $22,945. About 6.7% of families and 9.2% of the population were below the poverty line, including 11.2% of those under age 18 and 8.2% of those age 65 or over.
Common Questions
What is the Total Population of Tumwater?
Total Population of Tumwater is 25,617.
What is the Total Male Population of Tumwater?
Total Male Population of Tumwater is 12,211.
What is the Total Female Population of Tumwater?
Total Female Population of Tumwater is 13,406.
What is the Ratio of Males per 100 Females in Tumwater?
There are 91.09 Males per 100 Females in Tumwater.
What is the Ratio of Females per 100 Males in Tumwater?
There are 109.79 Females per 100 Males in Tumwater.
What is the Median Population Age in Tumwater?
Median Population Age in Tumwater is 36.5 Years.
What is the Average Family Size in Tumwater
Average Family Size in Tumwater is 3.1 People.
What is the Average Household Size in Tumwater
Average Household Size in Tumwater is 2.5 People.
What is Per Capita Income in Tumwater?
Per Capita income in Tumwater is $41,882.
What is the Median Family Income in Tumwater?
Median Family Income in Tumwater is $103,315.
What is the Median Household income in Tumwater?
Median Household Income in Tumwater is $84,177.
What is Income or Wage Gap in Tumwater?
Income or Wage Gap in Tumwater is 19.0%.
Women in Tumwater earn 81.0 cents for every dollar earned by a man.
What is Inequality or Gini Index in Tumwater?
Inequality or Gini Index in Tumwater is 0.41.
How Large is the Labor Force in Tumwater?
There are 13,831 People in the Labor Forcein in Tumwater.
What is the Percentage of People in the Labor Force in Tumwater?
66.7% of People are in the Labor Force in Tumwater.
What is the Unemployment Rate in Tumwater?
Unemployment Rate in Tumwater is 5.7%.