Manchester, WA
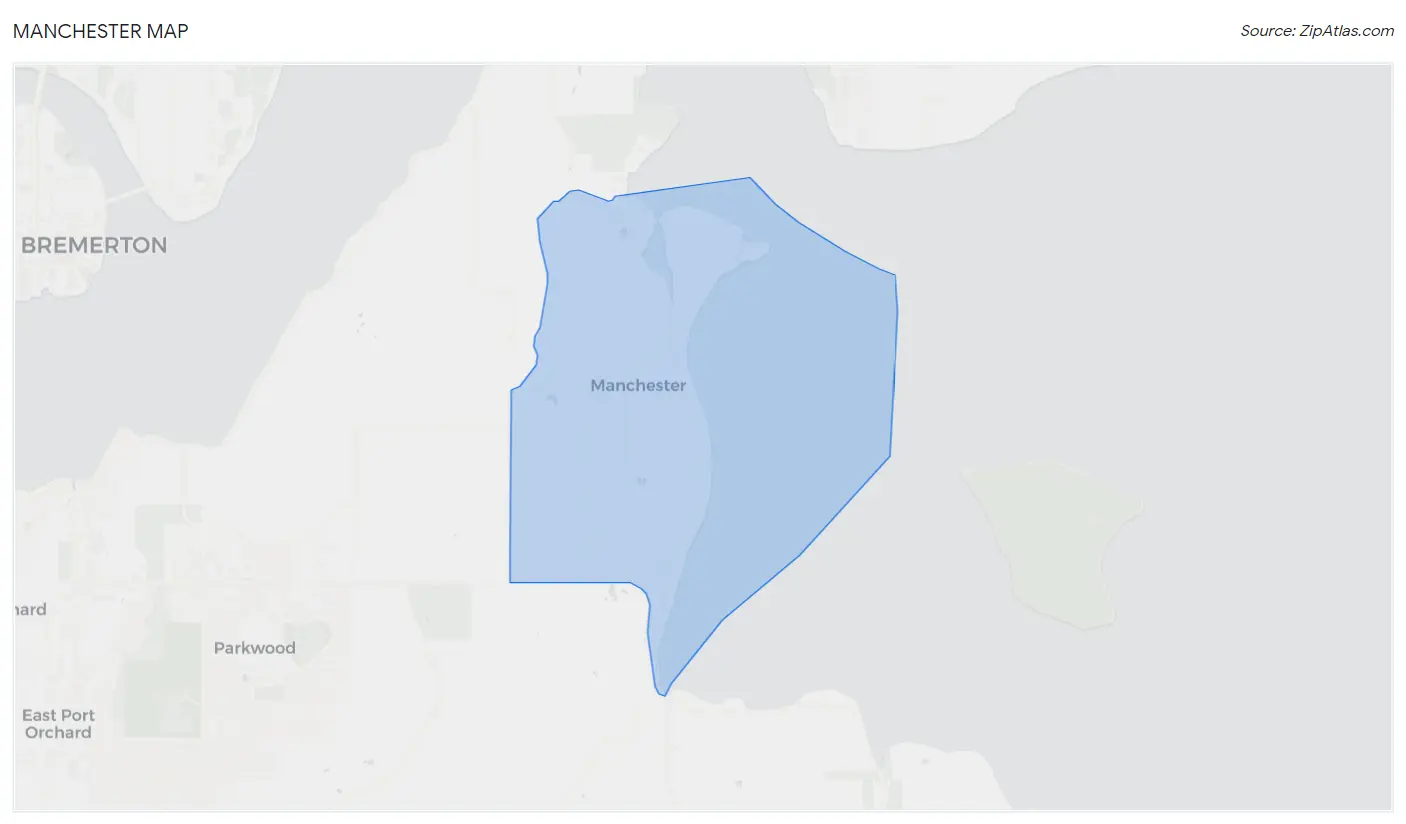
Manchester Map
Manchester Overview
6,033
TOTAL POPULATION
3,094
MALE POPULATION
2,939
FEMALE POPULATION
105.27
MALES / 100 FEMALES
94.99
FEMALES / 100 MALES
39.4
MEDIAN AGE
3.0
AVG FAMILY SIZE
2.8
AVG HOUSEHOLD SIZE
$41,685
PER CAPITA INCOME
$99,286
AVG FAMILY INCOME
$99,933
AVG HOUSEHOLD INCOME
33.1%
WAGE / INCOME GAP [ % ]
66.9¢/ $1
WAGE / INCOME GAP [ $ ]
0.37
INEQUALITY / GINI INDEX
3,001
LABOR FORCE [ PEOPLE ]
63.2%
PERCENT IN LABOR FORCE
1.7%
UNEMPLOYMENT RATE
Manchester Zip Codes
Race in Manchester
The most populous races in Manchester are White / Caucasian (4,905 | 81.3%), Hispanic or Latino (588 | 9.8%), and Two or more Races (389 | 6.5%).
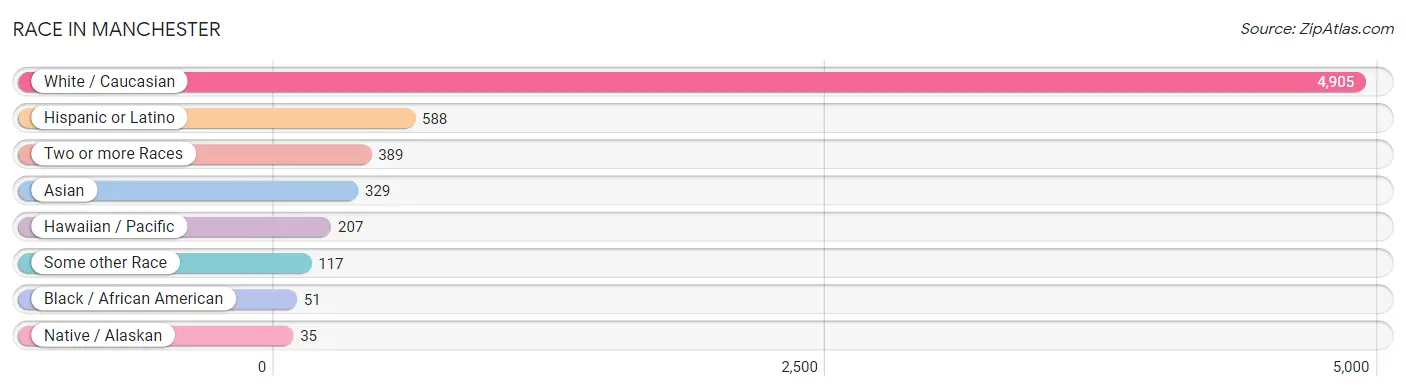
| Race | # Population | % Population |
| Asian | 329 | 5.4% |
| Black / African American | 51 | 0.9% |
| Hawaiian / Pacific | 207 | 3.4% |
| Hispanic or Latino | 588 | 9.8% |
| Native / Alaskan | 35 | 0.6% |
| White / Caucasian | 4,905 | 81.3% |
| Two or more Races | 389 | 6.5% |
| Some other Race | 117 | 1.9% |
| Total | 6,033 | 100.0% |
Ancestry in Manchester
The most populous ancestries reported in Manchester are German (1,309 | 21.7%), Irish (758 | 12.6%), English (717 | 11.9%), Mexican (541 | 9.0%), and American (324 | 5.4%), together accounting for 60.5% of all Manchester residents.
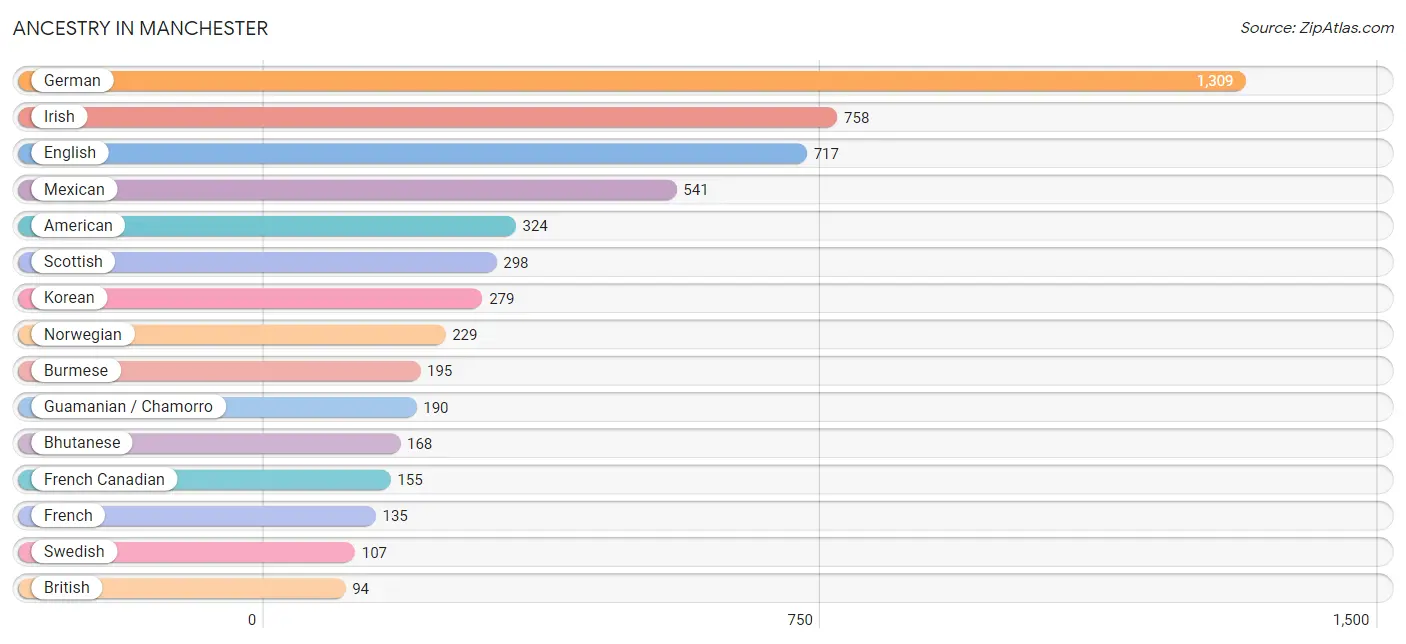
| Ancestry | # Population | % Population |
| African | 20 | 0.3% |
| American | 324 | 5.4% |
| Arab | 84 | 1.4% |
| Bhutanese | 168 | 2.8% |
| British | 94 | 1.6% |
| Burmese | 195 | 3.2% |
| Central American | 11 | 0.2% |
| Choctaw | 35 | 0.6% |
| Czech | 49 | 0.8% |
| Danish | 58 | 1.0% |
| Dutch | 42 | 0.7% |
| Eastern European | 20 | 0.3% |
| English | 717 | 11.9% |
| European | 92 | 1.5% |
| Finnish | 9 | 0.2% |
| French | 135 | 2.2% |
| French Canadian | 155 | 2.6% |
| German | 1,309 | 21.7% |
| Greek | 24 | 0.4% |
| Guamanian / Chamorro | 190 | 3.2% |
| Hungarian | 24 | 0.4% |
| Indian (Asian) | 64 | 1.1% |
| Indonesian | 13 | 0.2% |
| Irish | 758 | 12.6% |
| Italian | 48 | 0.8% |
| Korean | 279 | 4.6% |
| Mexican | 541 | 9.0% |
| Native Hawaiian | 17 | 0.3% |
| Northern European | 24 | 0.4% |
| Norwegian | 229 | 3.8% |
| Peruvian | 6 | 0.1% |
| Polish | 64 | 1.1% |
| Puerto Rican | 15 | 0.3% |
| Russian | 17 | 0.3% |
| Salvadoran | 11 | 0.2% |
| Samoan | 46 | 0.8% |
| Scandinavian | 67 | 1.1% |
| Scotch-Irish | 35 | 0.6% |
| Scottish | 298 | 4.9% |
| South American | 6 | 0.1% |
| Spanish | 15 | 0.3% |
| Subsaharan African | 20 | 0.3% |
| Swedish | 107 | 1.8% |
| Swiss | 11 | 0.2% |
| Ukrainian | 30 | 0.5% |
| Welsh | 91 | 1.5% | View All 46 Rows |
Immigrants in Manchester
The most numerous immigrant groups reported in Manchester came from Asia (111 | 1.8%), Israel (84 | 1.4%), Western Asia (84 | 1.4%), Eastern Asia (27 | 0.4%), and Europe (20 | 0.3%), together accounting for 5.4% of all Manchester residents.
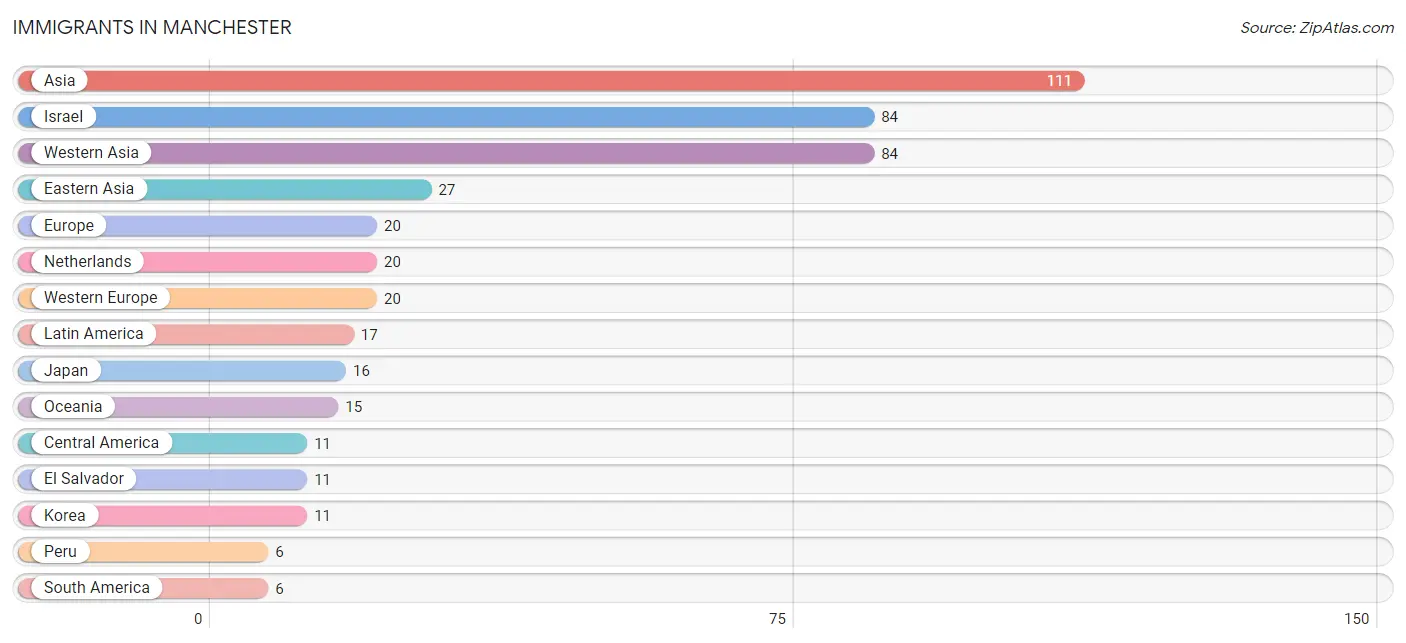
| Immigration Origin | # Population | % Population |
| Asia | 111 | 1.8% |
| Central America | 11 | 0.2% |
| Eastern Asia | 27 | 0.4% |
| El Salvador | 11 | 0.2% |
| Europe | 20 | 0.3% |
| Israel | 84 | 1.4% |
| Japan | 16 | 0.3% |
| Korea | 11 | 0.2% |
| Latin America | 17 | 0.3% |
| Netherlands | 20 | 0.3% |
| Oceania | 15 | 0.3% |
| Peru | 6 | 0.1% |
| South America | 6 | 0.1% |
| Western Asia | 84 | 1.4% |
| Western Europe | 20 | 0.3% | View All 15 Rows |
Sex and Age in Manchester
Sex and Age in Manchester
The most populous age groups in Manchester are 60 to 64 Years (341 | 11.0%) for men and 35 to 39 Years (359 | 12.2%) for women.
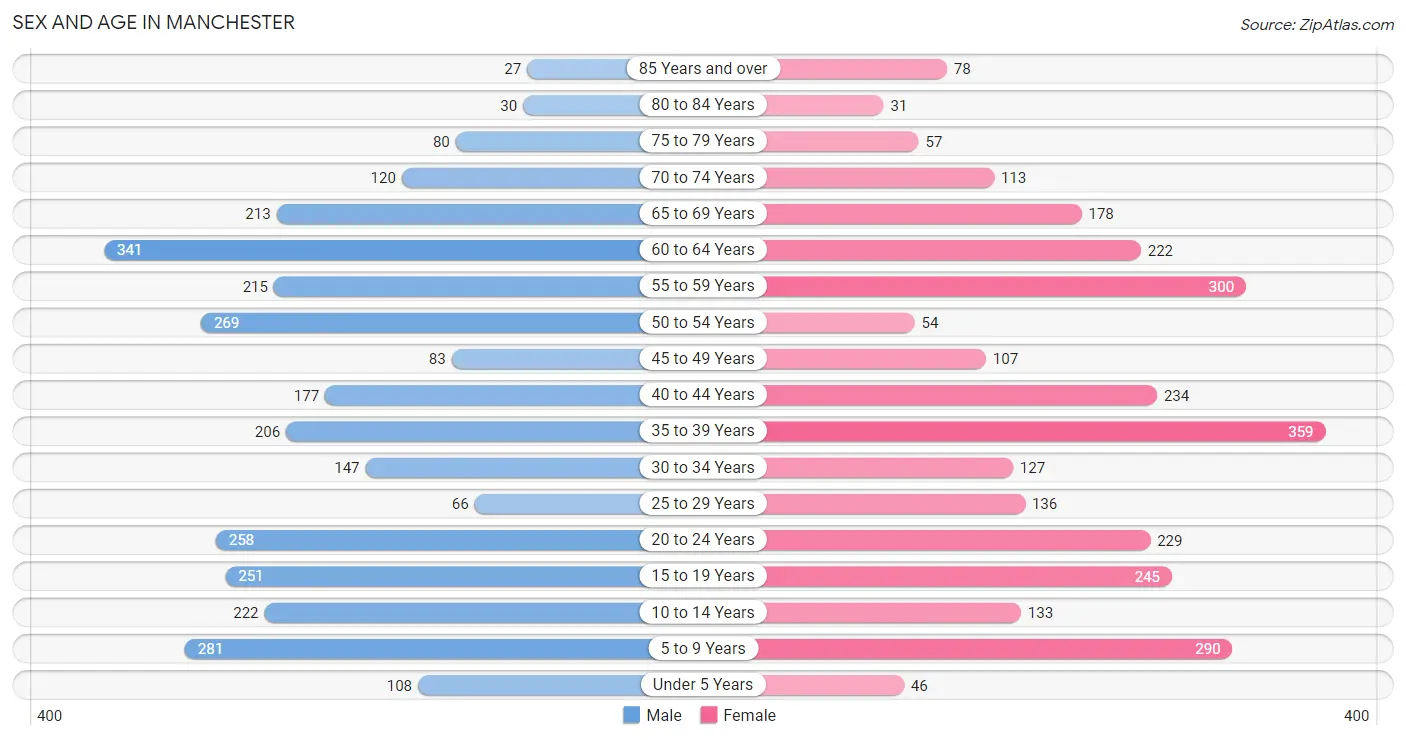
| Age Bracket | Male | Female |
| Under 5 Years | 108 (3.5%) | 46 (1.6%) |
| 5 to 9 Years | 281 (9.1%) | 290 (9.9%) |
| 10 to 14 Years | 222 (7.2%) | 133 (4.5%) |
| 15 to 19 Years | 251 (8.1%) | 245 (8.3%) |
| 20 to 24 Years | 258 (8.3%) | 229 (7.8%) |
| 25 to 29 Years | 66 (2.1%) | 136 (4.6%) |
| 30 to 34 Years | 147 (4.8%) | 127 (4.3%) |
| 35 to 39 Years | 206 (6.7%) | 359 (12.2%) |
| 40 to 44 Years | 177 (5.7%) | 234 (8.0%) |
| 45 to 49 Years | 83 (2.7%) | 107 (3.6%) |
| 50 to 54 Years | 269 (8.7%) | 54 (1.8%) |
| 55 to 59 Years | 215 (7.0%) | 300 (10.2%) |
| 60 to 64 Years | 341 (11.0%) | 222 (7.5%) |
| 65 to 69 Years | 213 (6.9%) | 178 (6.1%) |
| 70 to 74 Years | 120 (3.9%) | 113 (3.8%) |
| 75 to 79 Years | 80 (2.6%) | 57 (1.9%) |
| 80 to 84 Years | 30 (1.0%) | 31 (1.1%) |
| 85 Years and over | 27 (0.9%) | 78 (2.6%) |
| Total | 3,094 (100.0%) | 2,939 (100.0%) |
Families and Households in Manchester
Median Family Size in Manchester
The median family size in Manchester is 3.01 persons per family, with single female/mother families (280 | 16.7%) accounting for the largest median family size of 3.31 persons per family. On the other hand, married-couple families (1,212 | 72.2%) represent the smallest median family size with 2.92 persons per family.
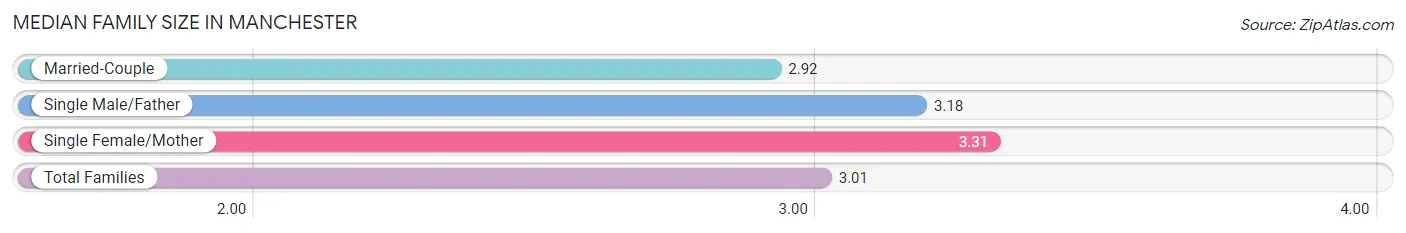
| Family Type | # Families | Family Size |
| Married-Couple | 1,212 (72.2%) | 2.92 |
| Single Male/Father | 186 (11.1%) | 3.18 |
| Single Female/Mother | 280 (16.7%) | 3.31 |
| Total Families | 1,678 (100.0%) | 3.01 |
Median Household Size in Manchester
The median household size in Manchester is 2.81 persons per household, with single male/father households (186 | 8.6%) accounting for the largest median household size of 3.87 persons per household. non-family households (472 | 22.0%) represent the smallest median household size with 1.48 persons per household.
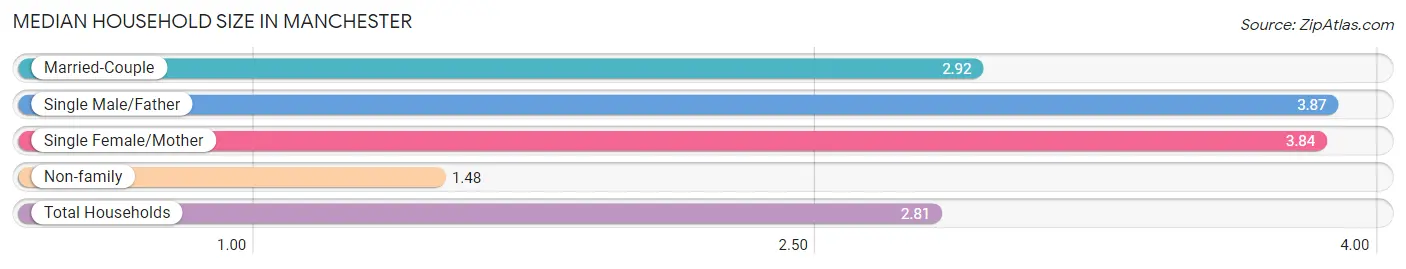
| Household Type | # Households | Household Size |
| Married-Couple | 1,212 (56.4%) | 2.92 |
| Single Male/Father | 186 (8.6%) | 3.87 |
| Single Female/Mother | 280 (13.0%) | 3.84 |
| Non-family | 472 (22.0%) | 1.48 |
| Total Households | 2,150 (100.0%) | 2.81 |
Household Size by Marriage Status in Manchester
Out of a total of 2,150 households in Manchester, 1,678 (78.0%) are family households, while 472 (22.0%) are nonfamily households. The most numerous type of family households are 2-person households, comprising 800, and the most common type of nonfamily households are 1-person households, comprising 304.
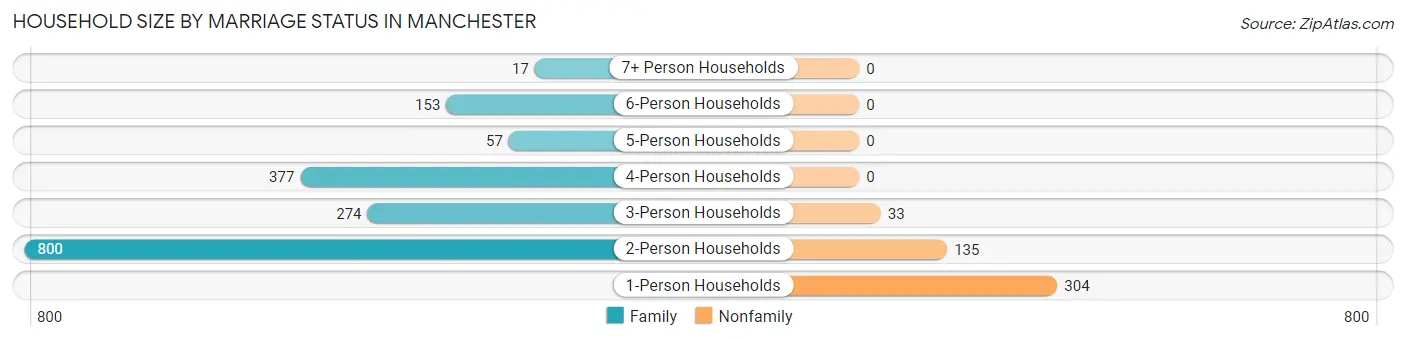
| Household Size | Family Households | Nonfamily Households |
| 1-Person Households | - | 304 (14.1%) |
| 2-Person Households | 800 (37.2%) | 135 (6.3%) |
| 3-Person Households | 274 (12.7%) | 33 (1.5%) |
| 4-Person Households | 377 (17.5%) | 0 (0.0%) |
| 5-Person Households | 57 (2.6%) | 0 (0.0%) |
| 6-Person Households | 153 (7.1%) | 0 (0.0%) |
| 7+ Person Households | 17 (0.8%) | 0 (0.0%) |
| Total | 1,678 (78.0%) | 472 (22.0%) |
Female Fertility in Manchester
Fertility by Age in Manchester
Average fertility rate in Manchester is 22.0 births per 1,000 women. Women in the age bracket of 20 to 34 years have the highest fertility rate with 65.0 births per 1,000 women. Women in the age bracket of 20 to 34 years acount for 100.0% of all women with births.
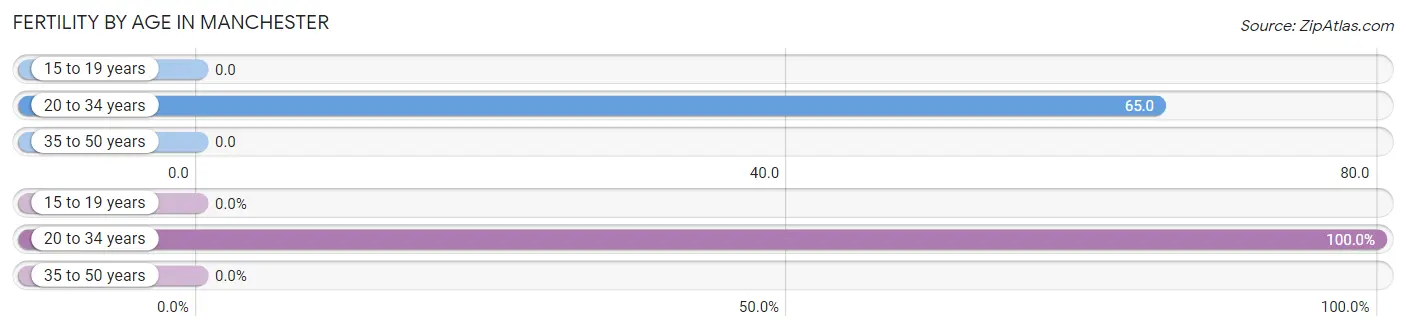
| Age Bracket | Women with Births | Births / 1,000 Women |
| 15 to 19 years | 0 (0.0%) | 0.0 |
| 20 to 34 years | 32 (100.0%) | 65.0 |
| 35 to 50 years | 0 (0.0%) | 0.0 |
| Total | 32 (100.0%) | 22.0 |
Fertility by Age by Marriage Status in Manchester
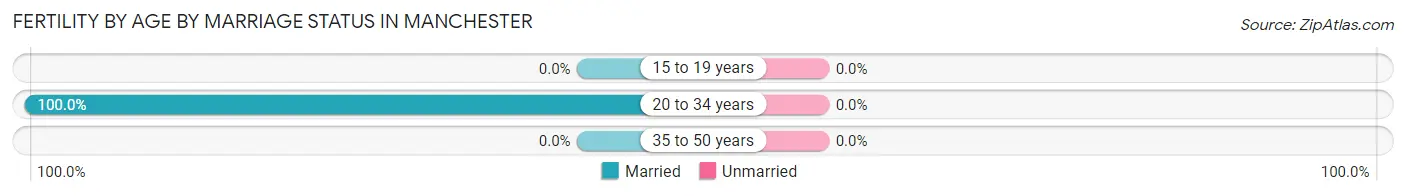
| Age Bracket | Married | Unmarried |
| 15 to 19 years | 0 (0.0%) | 0 (0.0%) |
| 20 to 34 years | 32 (100.0%) | 0 (0.0%) |
| 35 to 50 years | 0 (0.0%) | 0 (0.0%) |
| Total | 32 (100.0%) | 0 (0.0%) |
Fertility by Education in Manchester
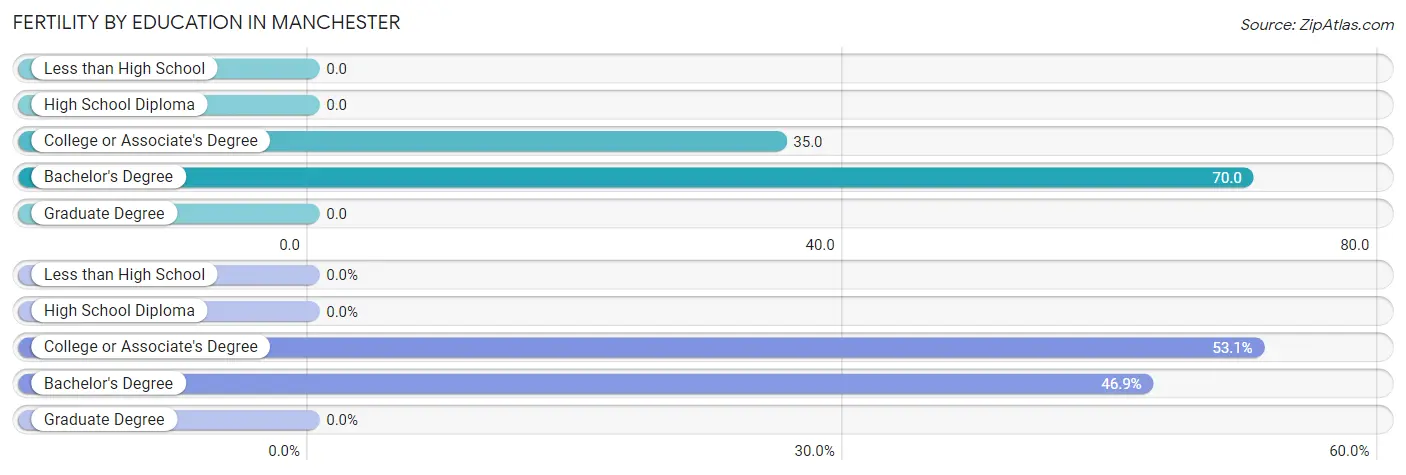
| Educational Attainment | Women with Births | Births / 1,000 Women |
| Less than High School | 0 (0.0%) | 0.0 |
| High School Diploma | 0 (0.0%) | 0.0 |
| College or Associate's Degree | 17 (53.1%) | 35.0 |
| Bachelor's Degree | 15 (46.9%) | 70.0 |
| Graduate Degree | 0 (0.0%) | 0.0 |
| Total | 32 (100.0%) | 22.0 |
Fertility by Education by Marriage Status in Manchester
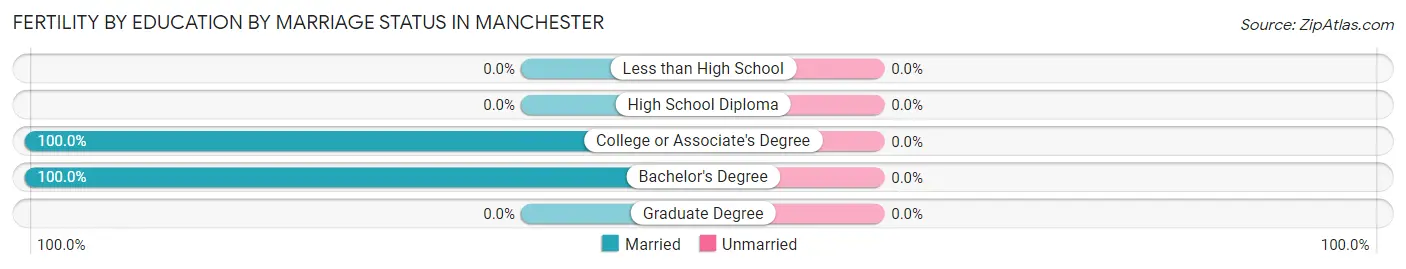
| Educational Attainment | Married | Unmarried |
| Less than High School | 0 (0.0%) | 0 (0.0%) |
| High School Diploma | 0 (0.0%) | 0 (0.0%) |
| College or Associate's Degree | 17 (100.0%) | 0 (0.0%) |
| Bachelor's Degree | 15 (100.0%) | 0 (0.0%) |
| Graduate Degree | 0 (0.0%) | 0 (0.0%) |
| Total | 32 (100.0%) | 0 (0.0%) |
Income in Manchester
Income Overview in Manchester
Per Capita Income in Manchester is $41,685, while median incomes of families and households are $99,286 and $99,933 respectively.
| Characteristic | Number | Measure |
| Per Capita Income | 6,033 | $41,685 |
| Median Family Income | 1,678 | $99,286 |
| Mean Family Income | 1,678 | $113,144 |
| Median Household Income | 2,150 | $99,933 |
| Mean Household Income | 2,150 | $114,065 |
| Income Deficit | 1,678 | $0 |
| Wage / Income Gap (%) | 6,033 | 33.05% |
| Wage / Income Gap ($) | 6,033 | 66.95¢ per $1 |
| Gini / Inequality Index | 6,033 | 0.37 |
Earnings by Sex in Manchester
Average Earnings in Manchester are $41,541, $56,797 for men and $38,025 for women, a difference of 33.1%.
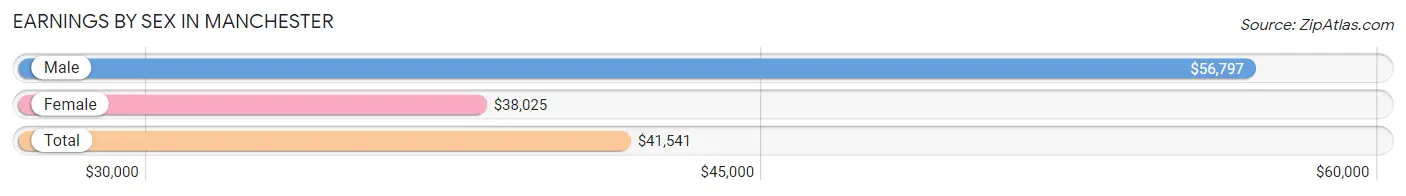
| Sex | Number | Average Earnings |
| Male | 1,674 (54.0%) | $56,797 |
| Female | 1,427 (46.0%) | $38,025 |
| Total | 3,101 (100.0%) | $41,541 |
Earnings by Sex by Income Bracket in Manchester
The most common earnings brackets in Manchester are $100,000+ for men (494 | 29.5%) and $100,000+ for women (198 | 13.9%).
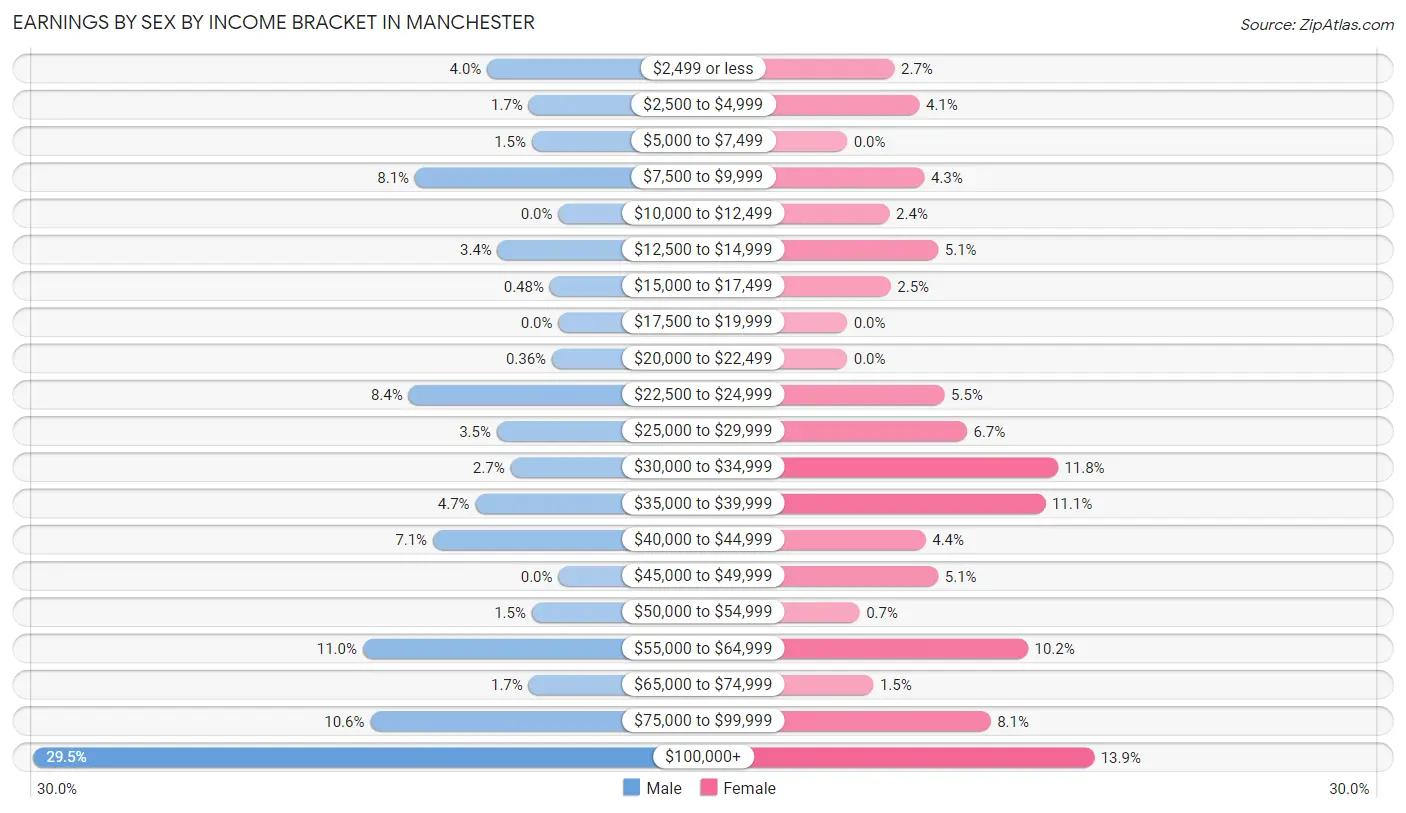
| Income | Male | Female |
| $2,499 or less | 67 (4.0%) | 38 (2.7%) |
| $2,500 to $4,999 | 28 (1.7%) | 58 (4.1%) |
| $5,000 to $7,499 | 25 (1.5%) | 0 (0.0%) |
| $7,500 to $9,999 | 135 (8.1%) | 62 (4.3%) |
| $10,000 to $12,499 | 0 (0.0%) | 34 (2.4%) |
| $12,500 to $14,999 | 57 (3.4%) | 73 (5.1%) |
| $15,000 to $17,499 | 8 (0.5%) | 35 (2.5%) |
| $17,500 to $19,999 | 0 (0.0%) | 0 (0.0%) |
| $20,000 to $22,499 | 6 (0.4%) | 0 (0.0%) |
| $22,500 to $24,999 | 141 (8.4%) | 78 (5.5%) |
| $25,000 to $29,999 | 58 (3.5%) | 96 (6.7%) |
| $30,000 to $34,999 | 45 (2.7%) | 169 (11.8%) |
| $35,000 to $39,999 | 78 (4.7%) | 159 (11.1%) |
| $40,000 to $44,999 | 118 (7.0%) | 63 (4.4%) |
| $45,000 to $49,999 | 0 (0.0%) | 73 (5.1%) |
| $50,000 to $54,999 | 25 (1.5%) | 10 (0.7%) |
| $55,000 to $64,999 | 184 (11.0%) | 145 (10.2%) |
| $65,000 to $74,999 | 28 (1.7%) | 21 (1.5%) |
| $75,000 to $99,999 | 177 (10.6%) | 115 (8.1%) |
| $100,000+ | 494 (29.5%) | 198 (13.9%) |
| Total | 1,674 (100.0%) | 1,427 (100.0%) |
Earnings by Sex by Educational Attainment in Manchester
Average earnings in Manchester are $59,975 for men and $39,554 for women, a difference of 34.1%. Men with an educational attainment of graduate degree enjoy the highest average annual earnings of $107,132, while those with high school diploma education earn the least with $58,750. Women with an educational attainment of college or associate's degree earn the most with the average annual earnings of $42,135, while those with high school diploma education have the smallest earnings of $34,766.
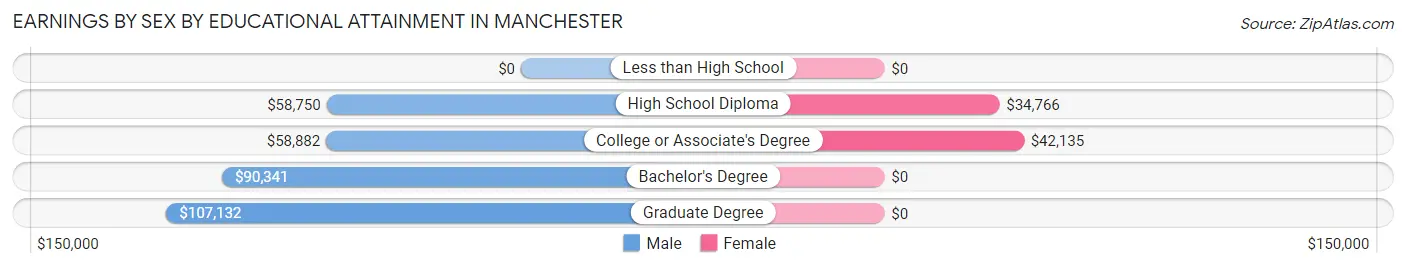
| Educational Attainment | Male Income | Female Income |
| Less than High School | - | - |
| High School Diploma | $58,750 | $34,766 |
| College or Associate's Degree | $58,882 | $42,135 |
| Bachelor's Degree | $90,341 | $0 |
| Graduate Degree | $107,132 | $0 |
| Total | $59,975 | $39,554 |
Family Income in Manchester
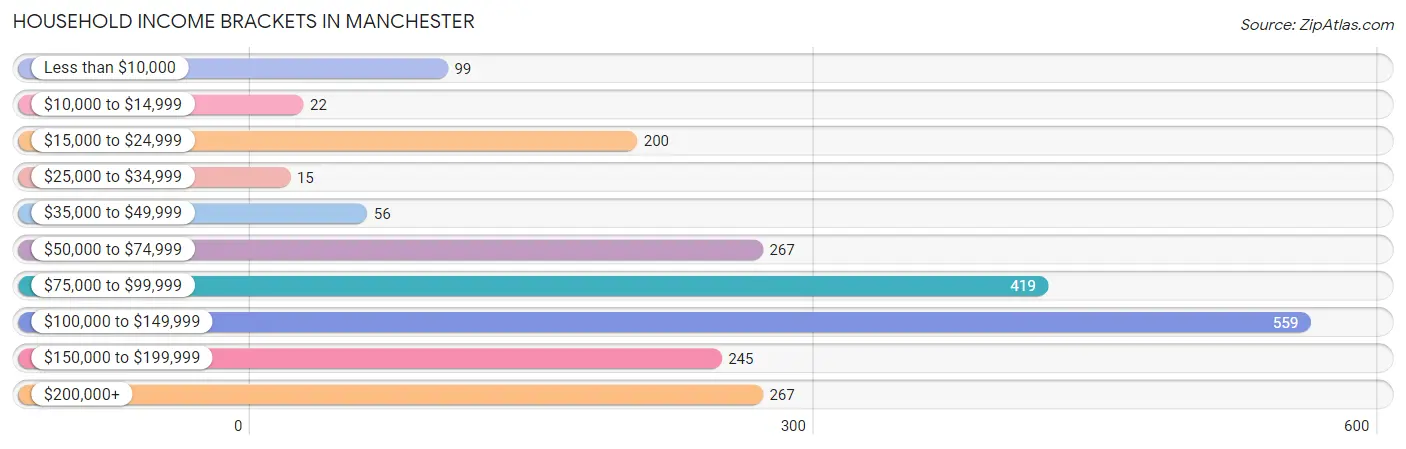
Family Income Brackets in Manchester
According to the Manchester family income data, there are 342 families falling into the $100,000 to $149,999 income range, which is the most common income bracket and makes up 20.4% of all families. Conversely, the less than $10,000 income bracket is the least frequent group with only 13 families (0.8%) belonging to this category.
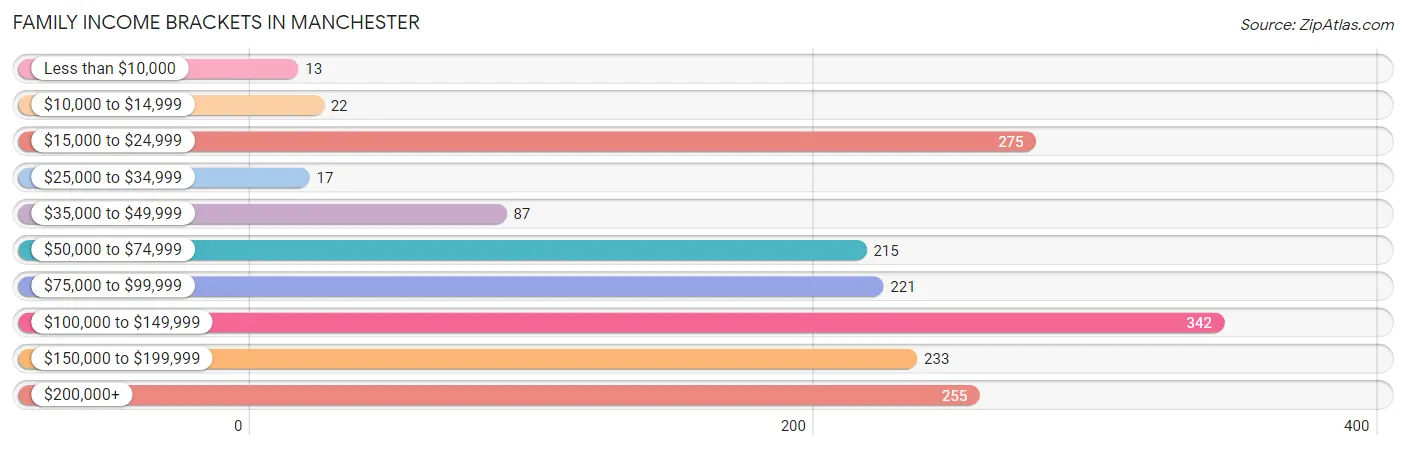
| Income Bracket | # Families | % Families |
| Less than $10,000 | 13 | 0.8% |
| $10,000 to $14,999 | 22 | 1.3% |
| $15,000 to $24,999 | 275 | 16.4% |
| $25,000 to $34,999 | 17 | 1.0% |
| $35,000 to $49,999 | 87 | 5.2% |
| $50,000 to $74,999 | 215 | 12.8% |
| $75,000 to $99,999 | 221 | 13.2% |
| $100,000 to $149,999 | 342 | 20.4% |
| $150,000 to $199,999 | 233 | 13.9% |
| $200,000+ | 255 | 15.2% |
Family Income by Famaliy Size in Manchester
6-person families (67 | 4.0%) account for the highest median family income in Manchester with $190,563 per family, while 2-person families (839 | 50.0%) have the highest median income of $49,442 per family member.
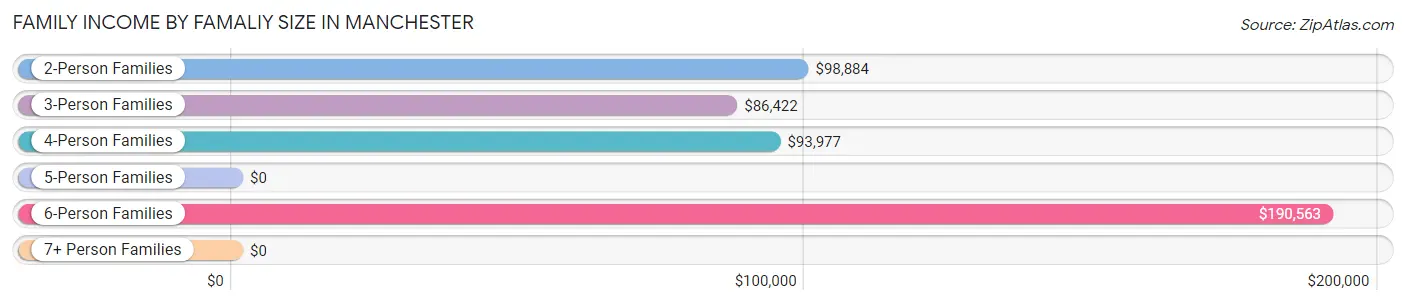
| Income Bracket | # Families | Median Income |
| 2-Person Families | 839 (50.0%) | $98,884 |
| 3-Person Families | 331 (19.7%) | $86,422 |
| 4-Person Families | 313 (18.6%) | $93,977 |
| 5-Person Families | 111 (6.6%) | $0 |
| 6-Person Families | 67 (4.0%) | $190,563 |
| 7+ Person Families | 17 (1.0%) | $0 |
| Total | 1,678 (100.0%) | $99,286 |
Family Income by Number of Earners in Manchester
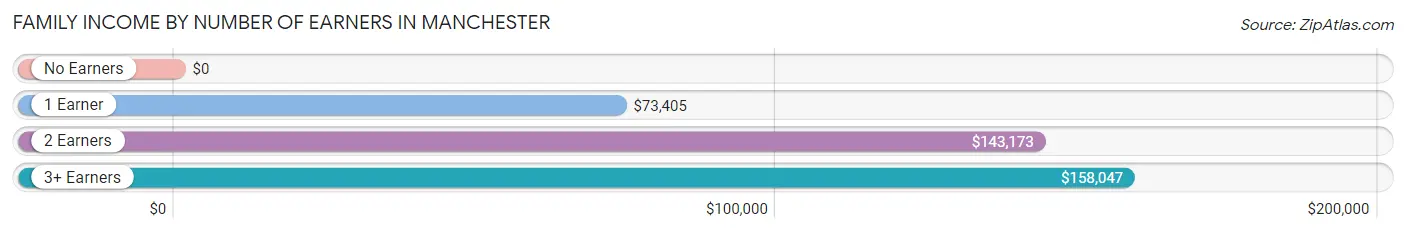
| Number of Earners | # Families | Median Income |
| No Earners | 260 (15.5%) | $0 |
| 1 Earner | 702 (41.8%) | $73,405 |
| 2 Earners | 629 (37.5%) | $143,173 |
| 3+ Earners | 87 (5.2%) | $158,047 |
| Total | 1,678 (100.0%) | $99,286 |
Household Income in Manchester
Household Income Brackets in Manchester
With 559 households falling in the category, the $100,000 to $149,999 income range is the most frequent in Manchester, accounting for 26.0% of all households. In contrast, only 15 households (0.7%) fall into the $25,000 to $34,999 income bracket, making it the least populous group.
| Income Bracket | # Households | % Households |
| Less than $10,000 | 99 | 4.6% |
| $10,000 to $14,999 | 22 | 1.0% |
| $15,000 to $24,999 | 200 | 9.3% |
| $25,000 to $34,999 | 15 | 0.7% |
| $35,000 to $49,999 | 56 | 2.6% |
| $50,000 to $74,999 | 267 | 12.4% |
| $75,000 to $99,999 | 419 | 19.5% |
| $100,000 to $149,999 | 559 | 26.0% |
| $150,000 to $199,999 | 245 | 11.4% |
| $200,000+ | 267 | 12.4% |
Household Income by Householder Age in Manchester
The median household income in Manchester is $99,933, with the highest median household income of $112,212 found in the 45 to 64 years age bracket for the primary householder. A total of 852 households (39.6%) fall into this category. Meanwhile, the 15 to 24 years age bracket for the primary householder has the lowest median household income of $59,280, with 123 households (5.7%) in this group.
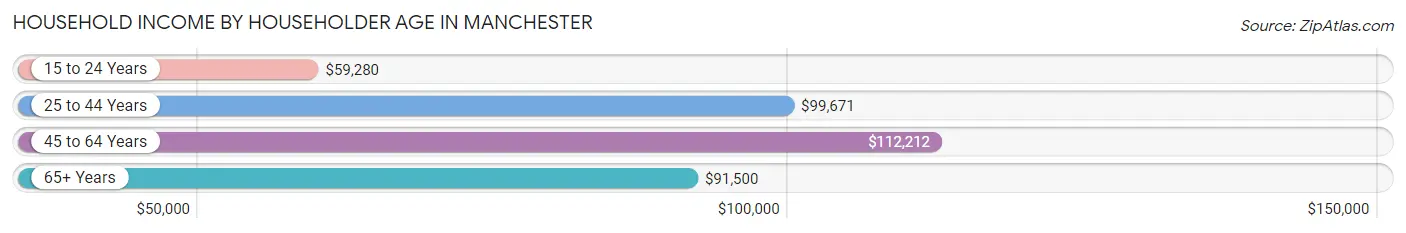
| Income Bracket | # Households | Median Income |
| 15 to 24 Years | 123 (5.7%) | $59,280 |
| 25 to 44 Years | 667 (31.0%) | $99,671 |
| 45 to 64 Years | 852 (39.6%) | $112,212 |
| 65+ Years | 508 (23.6%) | $91,500 |
| Total | 2,150 (100.0%) | $99,933 |
Poverty in Manchester
Income Below Poverty by Sex and Age in Manchester
With 18.8% poverty level for males and 20.3% for females among the residents of Manchester, 15 year old males and 12 to 14 year old females are the most vulnerable to poverty, with 48 males (71.6%) and 67 females (81.7%) in their respective age groups living below the poverty level.
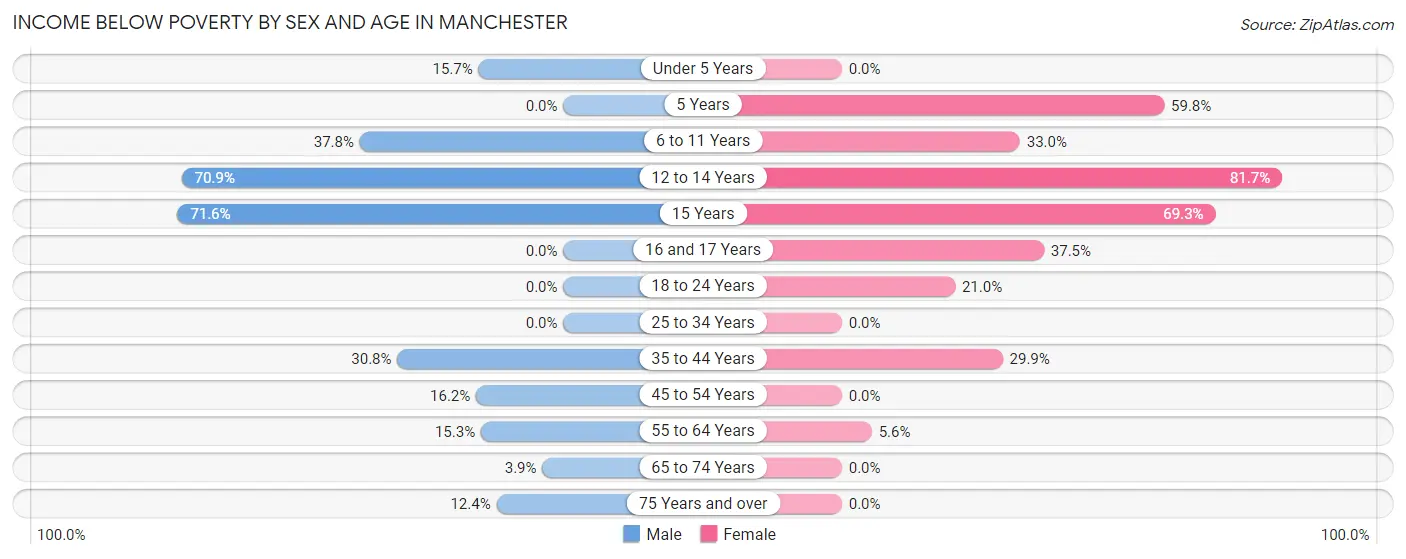
| Age Bracket | Male | Female |
| Under 5 Years | 17 (15.7%) | 0 (0.0%) |
| 5 Years | 0 (0.0%) | 70 (59.8%) |
| 6 to 11 Years | 102 (37.8%) | 74 (33.0%) |
| 12 to 14 Years | 124 (70.9%) | 67 (81.7%) |
| 15 Years | 48 (71.6%) | 95 (69.3%) |
| 16 and 17 Years | 0 (0.0%) | 30 (37.5%) |
| 18 to 24 Years | 0 (0.0%) | 54 (21.0%) |
| 25 to 34 Years | 0 (0.0%) | 0 (0.0%) |
| 35 to 44 Years | 118 (30.8%) | 177 (29.8%) |
| 45 to 54 Years | 57 (16.2%) | 0 (0.0%) |
| 55 to 64 Years | 85 (15.3%) | 29 (5.6%) |
| 65 to 74 Years | 13 (3.9%) | 0 (0.0%) |
| 75 Years and over | 17 (12.4%) | 0 (0.0%) |
| Total | 581 (18.8%) | 596 (20.3%) |
Income Above Poverty by Sex and Age in Manchester
According to the poverty statistics in Manchester, males aged 5 years and females aged under 5 years are the age groups that are most secure financially, with 100.0% of males and 100.0% of females in these age groups living above the poverty line.
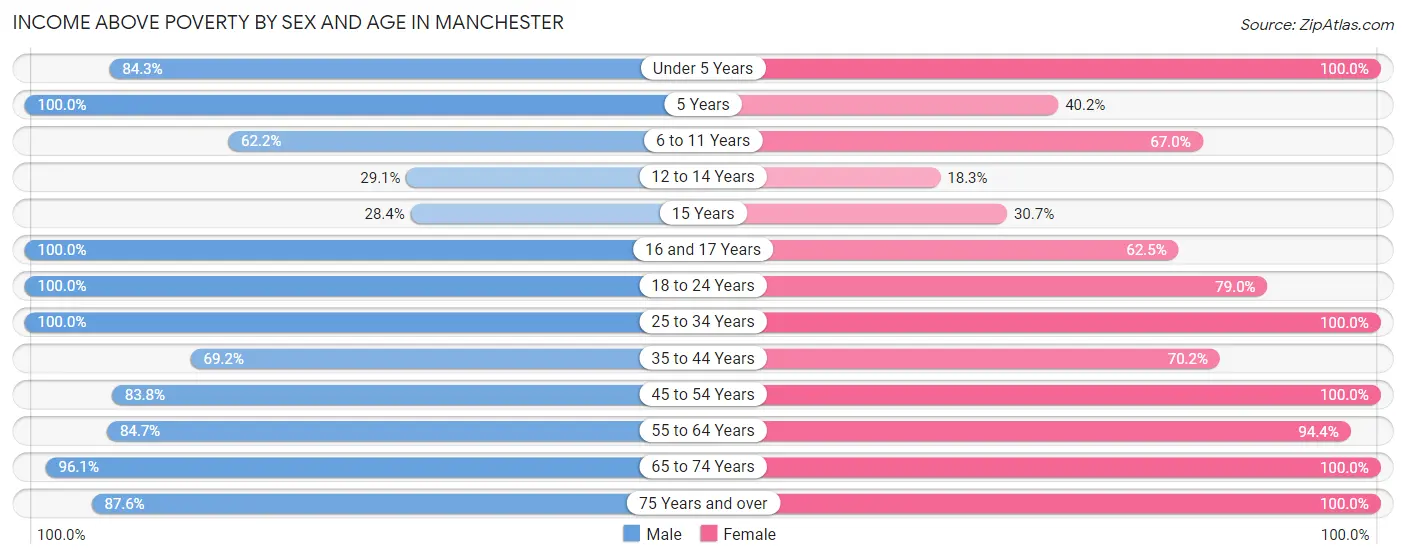
| Age Bracket | Male | Female |
| Under 5 Years | 91 (84.3%) | 46 (100.0%) |
| 5 Years | 58 (100.0%) | 47 (40.2%) |
| 6 to 11 Years | 168 (62.2%) | 150 (67.0%) |
| 12 to 14 Years | 51 (29.1%) | 15 (18.3%) |
| 15 Years | 19 (28.4%) | 42 (30.7%) |
| 16 and 17 Years | 107 (100.0%) | 50 (62.5%) |
| 18 to 24 Years | 335 (100.0%) | 203 (79.0%) |
| 25 to 34 Years | 213 (100.0%) | 263 (100.0%) |
| 35 to 44 Years | 265 (69.2%) | 416 (70.2%) |
| 45 to 54 Years | 295 (83.8%) | 161 (100.0%) |
| 55 to 64 Years | 471 (84.7%) | 493 (94.4%) |
| 65 to 74 Years | 320 (96.1%) | 291 (100.0%) |
| 75 Years and over | 120 (87.6%) | 166 (100.0%) |
| Total | 2,513 (81.2%) | 2,343 (79.7%) |
Income Below Poverty Among Married-Couple Families in Manchester
The poverty statistics for married-couple families in Manchester show that 9.3% or 113 of the total 1,212 families live below the poverty line. Families with 1 or 2 children have the highest poverty rate of 23.7%, comprising of 85 families. On the other hand, families with no children have the lowest poverty rate of 1.7%, which includes 13 families.
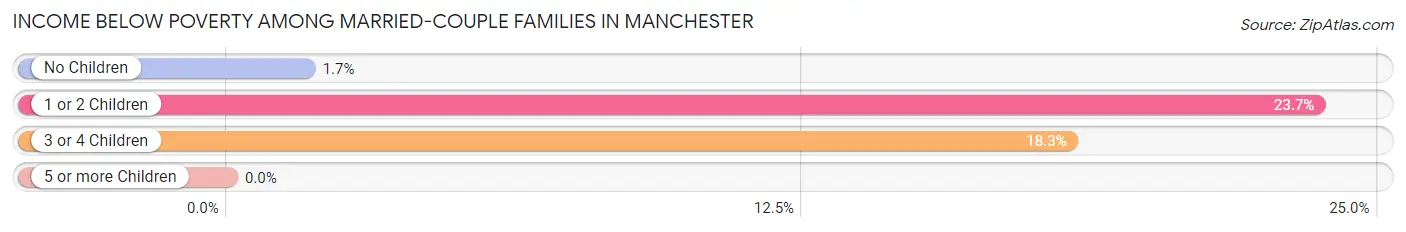
| Children | Above Poverty | Below Poverty |
| No Children | 758 (98.3%) | 13 (1.7%) |
| 1 or 2 Children | 274 (76.3%) | 85 (23.7%) |
| 3 or 4 Children | 67 (81.7%) | 15 (18.3%) |
| 5 or more Children | 0 (0.0%) | 0 (0.0%) |
| Total | 1,099 (90.7%) | 113 (9.3%) |
Income Below Poverty Among Single-Parent Households in Manchester
According to the poverty data in Manchester, 37.1% or 69 single-father households and 39.6% or 111 single-mother households are living below the poverty line. Among single-father households, those with 1 or 2 children have the highest poverty rate, with 69 households (51.9%) experiencing poverty. Likewise, among single-mother households, those with 3 or 4 children have the highest poverty rate, with 61 households (100.0%) falling below the poverty line.
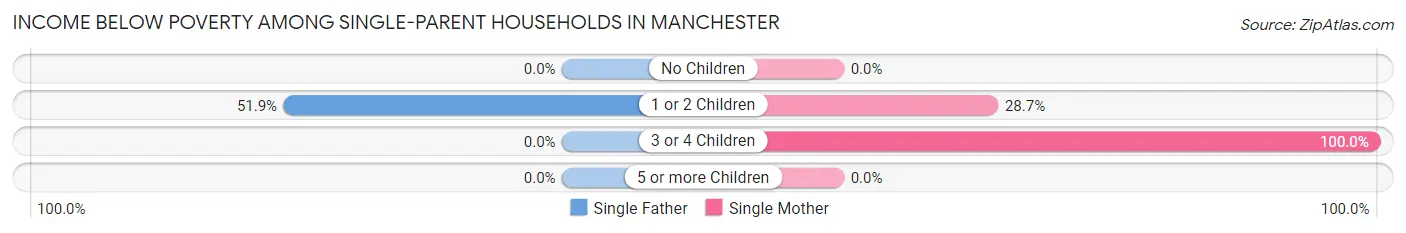
| Children | Single Father | Single Mother |
| No Children | 0 (0.0%) | 0 (0.0%) |
| 1 or 2 Children | 69 (51.9%) | 50 (28.7%) |
| 3 or 4 Children | 0 (0.0%) | 61 (100.0%) |
| 5 or more Children | 0 (0.0%) | 0 (0.0%) |
| Total | 69 (37.1%) | 111 (39.6%) |
Income Below Poverty Among Married-Couple vs Single-Parent Households in Manchester
The poverty data for Manchester shows that 113 of the married-couple family households (9.3%) and 180 of the single-parent households (38.6%) are living below the poverty level. Within the married-couple family households, those with 1 or 2 children have the highest poverty rate, with 85 households (23.7%) falling below the poverty line. Among the single-parent households, those with 3 or 4 children have the highest poverty rate, with 61 household (100.0%) living below poverty.
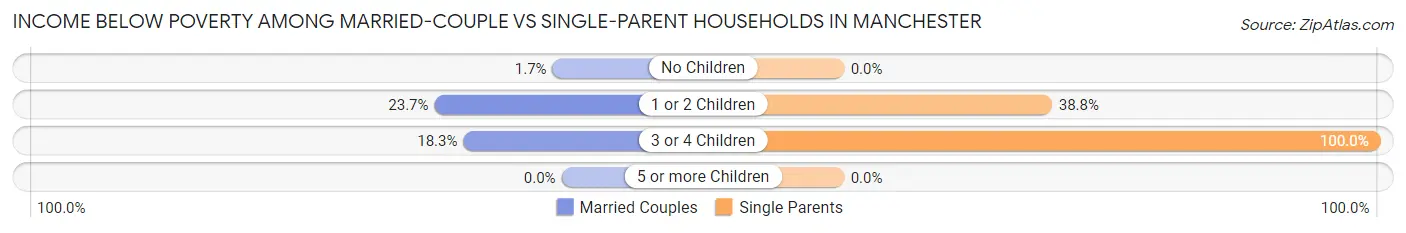
| Children | Married-Couple Families | Single-Parent Households |
| No Children | 13 (1.7%) | 0 (0.0%) |
| 1 or 2 Children | 85 (23.7%) | 119 (38.8%) |
| 3 or 4 Children | 15 (18.3%) | 61 (100.0%) |
| 5 or more Children | 0 (0.0%) | 0 (0.0%) |
| Total | 113 (9.3%) | 180 (38.6%) |
Employment Characteristics in Manchester
Employment by Class of Employer in Manchester
Among the 2,873 employed individuals in Manchester, private company employees (1,745 | 60.7%), federal government employees (409 | 14.2%), and local government employees (252 | 8.8%) make up the most common classes of employment.
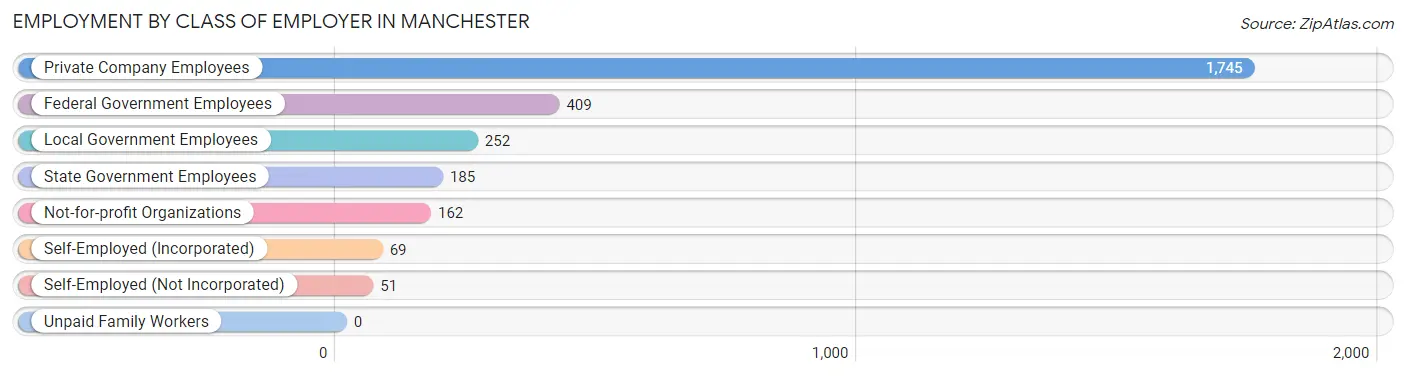
| Employer Class | # Employees | % Employees |
| Private Company Employees | 1,745 | 60.7% |
| Self-Employed (Incorporated) | 69 | 2.4% |
| Self-Employed (Not Incorporated) | 51 | 1.8% |
| Not-for-profit Organizations | 162 | 5.6% |
| Local Government Employees | 252 | 8.8% |
| State Government Employees | 185 | 6.4% |
| Federal Government Employees | 409 | 14.2% |
| Unpaid Family Workers | 0 | 0.0% |
| Total | 2,873 | 100.0% |
Employment Status by Age in Manchester
According to the labor force statistics for Manchester, out of the total population over 16 years of age (4,749), 63.2% or 3,001 individuals are in the labor force, with 1.7% or 51 of them unemployed. The age group with the highest labor force participation rate is 30 to 34 years, with 96.4% or 264 individuals in the labor force. Within the labor force, the 60 to 64 years age range has the highest percentage of unemployed individuals, with 7.3% or 28 of them being unemployed.
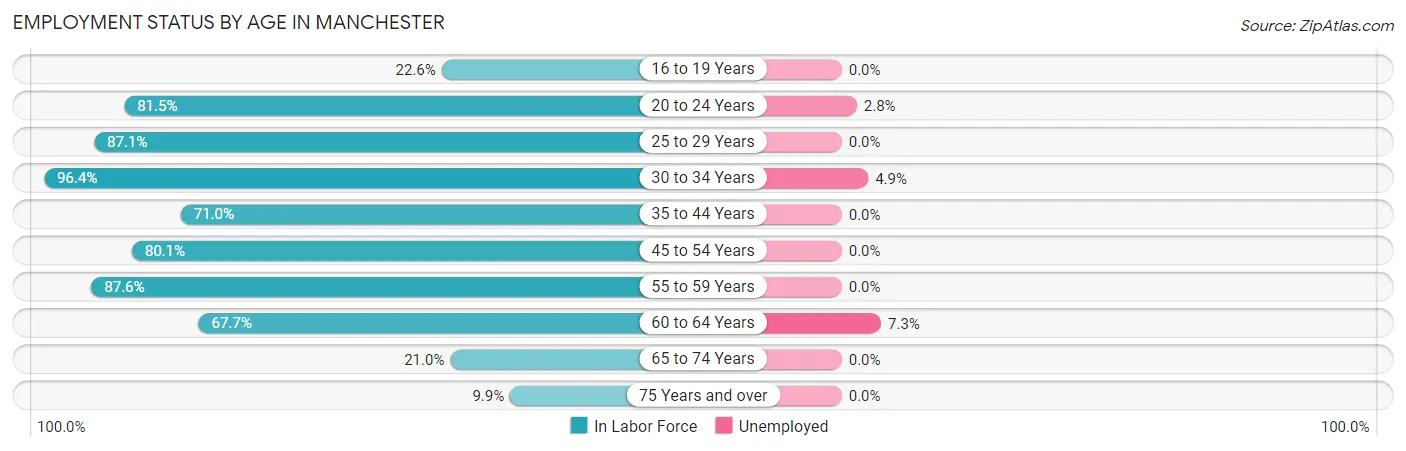
| Age Bracket | In Labor Force | Unemployed |
| 16 to 19 Years | 66 (22.6%) | 0 (0.0%) |
| 20 to 24 Years | 397 (81.5%) | 11 (2.8%) |
| 25 to 29 Years | 176 (87.1%) | 0 (0.0%) |
| 30 to 34 Years | 264 (96.4%) | 13 (4.9%) |
| 35 to 44 Years | 693 (71.0%) | 0 (0.0%) |
| 45 to 54 Years | 411 (80.1%) | 0 (0.0%) |
| 55 to 59 Years | 451 (87.6%) | 0 (0.0%) |
| 60 to 64 Years | 381 (67.7%) | 28 (7.3%) |
| 65 to 74 Years | 131 (21.0%) | 0 (0.0%) |
| 75 Years and over | 30 (9.9%) | 0 (0.0%) |
| Total | 3,001 (63.2%) | 51 (1.7%) |
Employment Status by Educational Attainment in Manchester
According to labor force statistics for Manchester, 78.1% of individuals (2,377) out of the total population between 25 and 64 years of age (3,043) are in the labor force, with 1.7% or 40 of them being unemployed. The group with the highest labor force participation rate are those with the educational attainment of bachelor's degree or higher, with 88.4% or 754 individuals in the labor force. Within the labor force, individuals with high school diploma education have the highest percentage of unemployment, with 2.6% or 12 of them being unemployed.
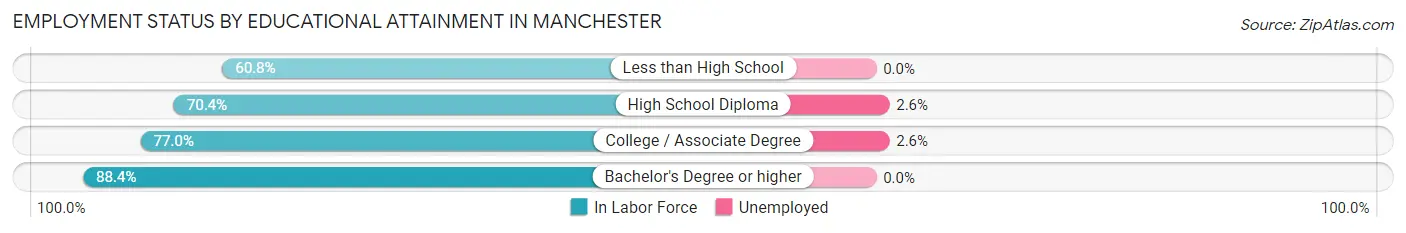
| Educational Attainment | In Labor Force | Unemployed |
| Less than High School | 73 (60.8%) | 0 (0.0%) |
| High School Diploma | 475 (70.4%) | 18 (2.6%) |
| College / Associate Degree | 1,074 (77.0%) | 36 (2.6%) |
| Bachelor's Degree or higher | 754 (88.4%) | 0 (0.0%) |
| Total | 2,377 (78.1%) | 52 (1.7%) |
Employment Occupations by Sex in Manchester
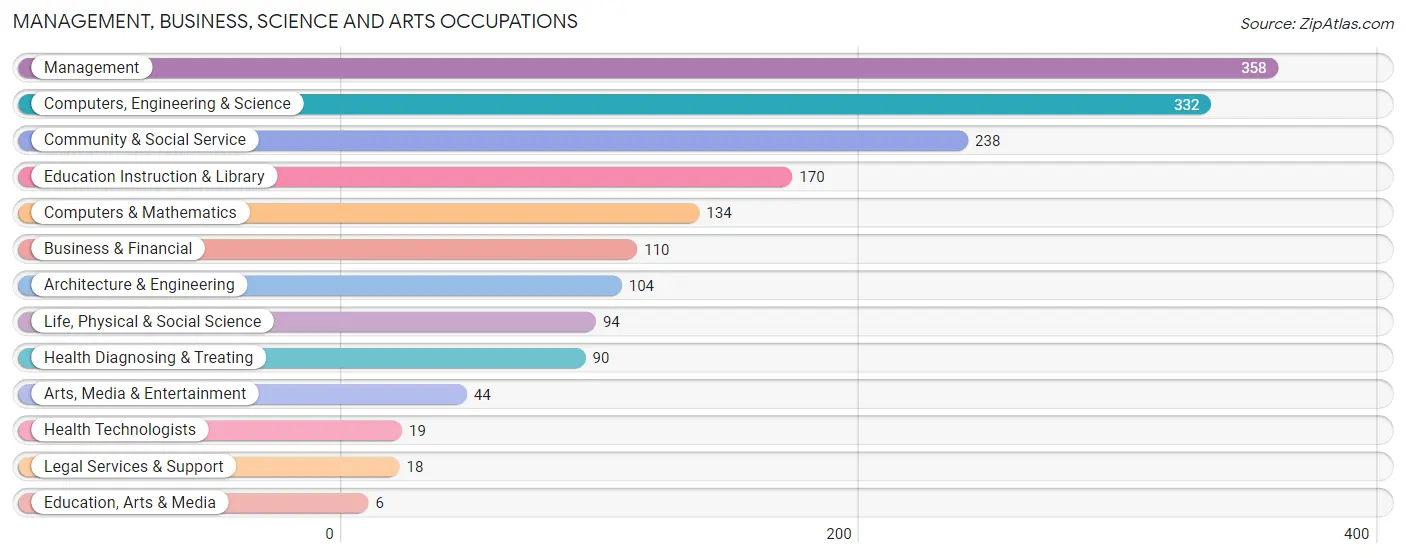
Management, Business, Science and Arts Occupations
The most common Management, Business, Science and Arts occupations in Manchester are Management (358 | 12.3%), Computers, Engineering & Science (332 | 11.4%), Community & Social Service (238 | 8.2%), Education Instruction & Library (170 | 5.8%), and Computers & Mathematics (134 | 4.6%).
Management, Business, Science and Arts Occupations by Sex
Within the Management, Business, Science and Arts occupations in Manchester, the most male-oriented occupations are Business & Financial (100.0%), Computers & Mathematics (74.6%), and Life, Physical & Social Science (69.2%), while the most female-oriented occupations are Education, Arts & Media (100.0%), Legal Services & Support (100.0%), and Arts, Media & Entertainment (100.0%).
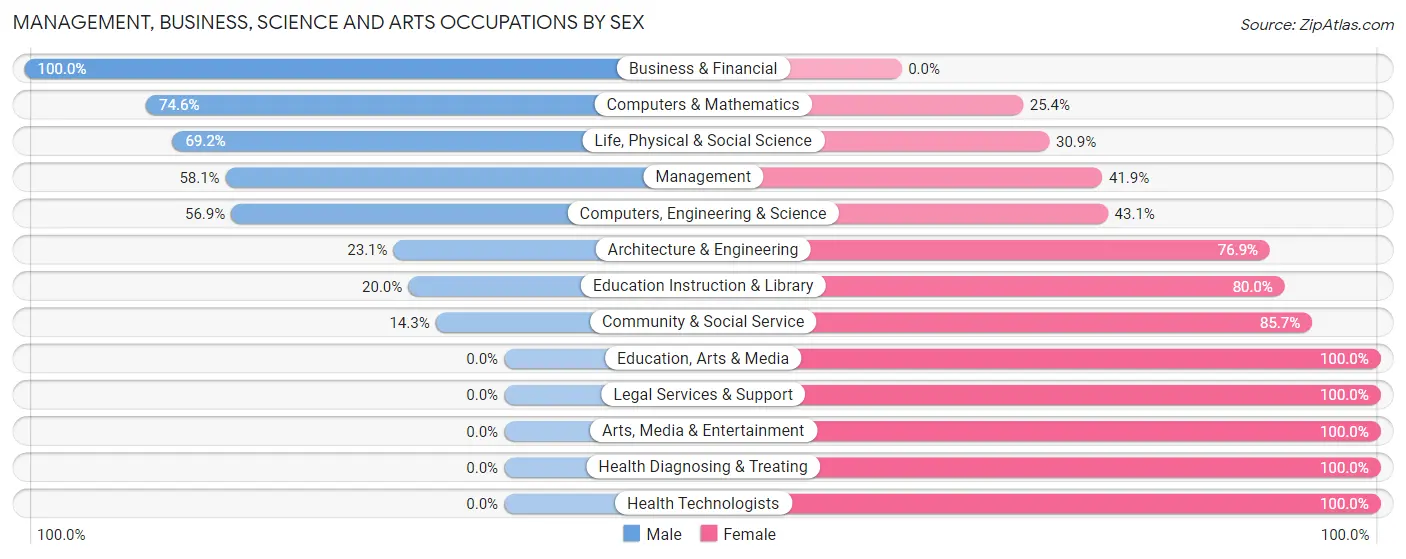
| Occupation | Male | Female |
| Management | 208 (58.1%) | 150 (41.9%) |
| Business & Financial | 110 (100.0%) | 0 (0.0%) |
| Computers, Engineering & Science | 189 (56.9%) | 143 (43.1%) |
| Computers & Mathematics | 100 (74.6%) | 34 (25.4%) |
| Architecture & Engineering | 24 (23.1%) | 80 (76.9%) |
| Life, Physical & Social Science | 65 (69.2%) | 29 (30.8%) |
| Community & Social Service | 34 (14.3%) | 204 (85.7%) |
| Education, Arts & Media | 0 (0.0%) | 6 (100.0%) |
| Legal Services & Support | 0 (0.0%) | 18 (100.0%) |
| Education Instruction & Library | 34 (20.0%) | 136 (80.0%) |
| Arts, Media & Entertainment | 0 (0.0%) | 44 (100.0%) |
| Health Diagnosing & Treating | 0 (0.0%) | 90 (100.0%) |
| Health Technologists | 0 (0.0%) | 19 (100.0%) |
| Total (Category) | 541 (48.0%) | 587 (52.0%) |
| Total (Overall) | 1,552 (53.3%) | 1,359 (46.7%) |
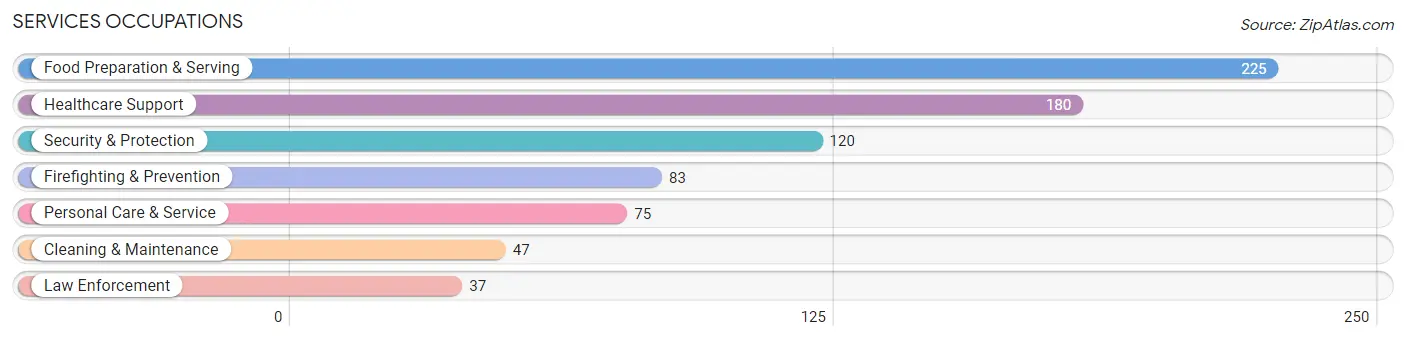
Services Occupations
The most common Services occupations in Manchester are Food Preparation & Serving (225 | 7.7%), Healthcare Support (180 | 6.2%), Security & Protection (120 | 4.1%), Firefighting & Prevention (83 | 2.9%), and Personal Care & Service (75 | 2.6%).
Services Occupations by Sex
Within the Services occupations in Manchester, the most male-oriented occupations are Cleaning & Maintenance (100.0%), Firefighting & Prevention (63.9%), and Security & Protection (44.2%), while the most female-oriented occupations are Healthcare Support (100.0%), Law Enforcement (100.0%), and Personal Care & Service (78.7%).
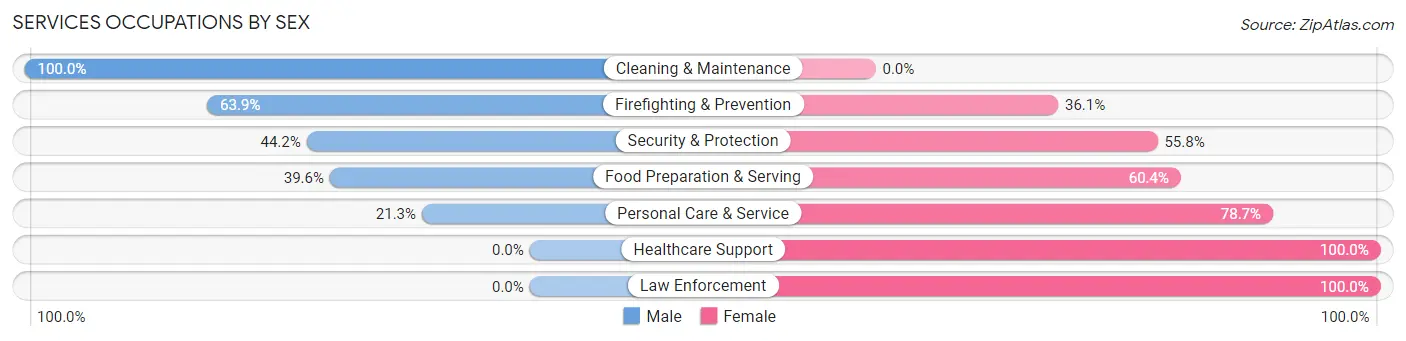
| Occupation | Male | Female |
| Healthcare Support | 0 (0.0%) | 180 (100.0%) |
| Security & Protection | 53 (44.2%) | 67 (55.8%) |
| Firefighting & Prevention | 53 (63.9%) | 30 (36.1%) |
| Law Enforcement | 0 (0.0%) | 37 (100.0%) |
| Food Preparation & Serving | 89 (39.6%) | 136 (60.4%) |
| Cleaning & Maintenance | 47 (100.0%) | 0 (0.0%) |
| Personal Care & Service | 16 (21.3%) | 59 (78.7%) |
| Total (Category) | 205 (31.7%) | 442 (68.3%) |
| Total (Overall) | 1,552 (53.3%) | 1,359 (46.7%) |
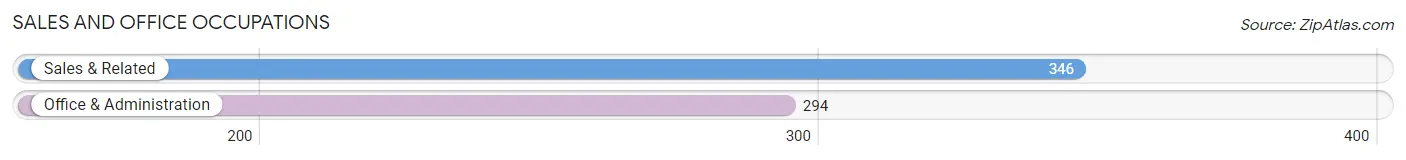
Sales and Office Occupations
The most common Sales and Office occupations in Manchester are Sales & Related (346 | 11.9%), and Office & Administration (294 | 10.1%).
Sales and Office Occupations by Sex
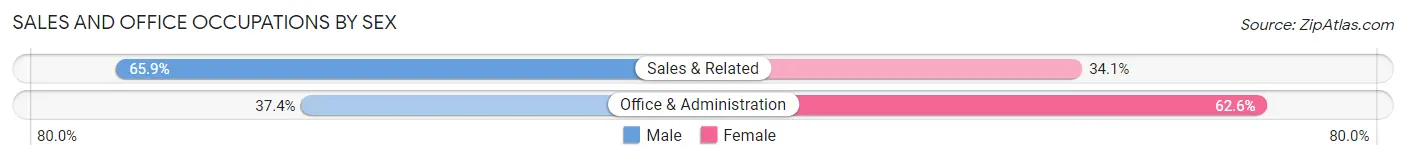
| Occupation | Male | Female |
| Sales & Related | 228 (65.9%) | 118 (34.1%) |
| Office & Administration | 110 (37.4%) | 184 (62.6%) |
| Total (Category) | 338 (52.8%) | 302 (47.2%) |
| Total (Overall) | 1,552 (53.3%) | 1,359 (46.7%) |
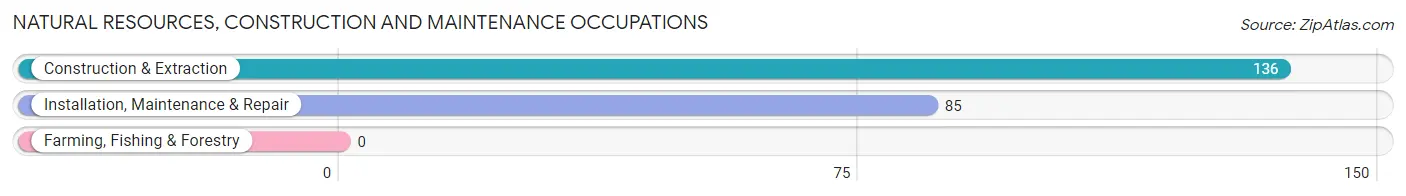
Natural Resources, Construction and Maintenance Occupations
The most common Natural Resources, Construction and Maintenance occupations in Manchester are Construction & Extraction (136 | 4.7%), and Installation, Maintenance & Repair (85 | 2.9%).
Natural Resources, Construction and Maintenance Occupations by Sex
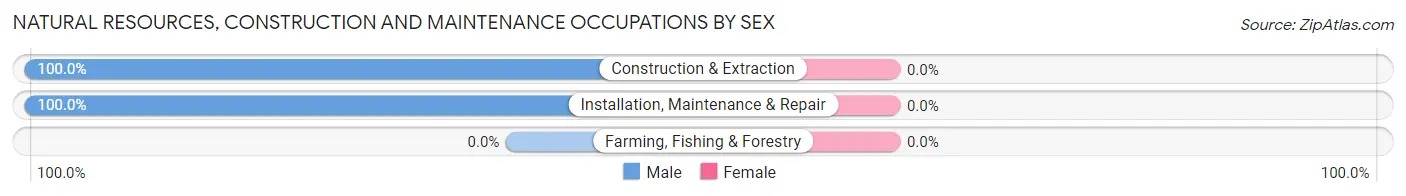
| Occupation | Male | Female |
| Farming, Fishing & Forestry | 0 (0.0%) | 0 (0.0%) |
| Construction & Extraction | 136 (100.0%) | 0 (0.0%) |
| Installation, Maintenance & Repair | 85 (100.0%) | 0 (0.0%) |
| Total (Category) | 221 (100.0%) | 0 (0.0%) |
| Total (Overall) | 1,552 (53.3%) | 1,359 (46.7%) |
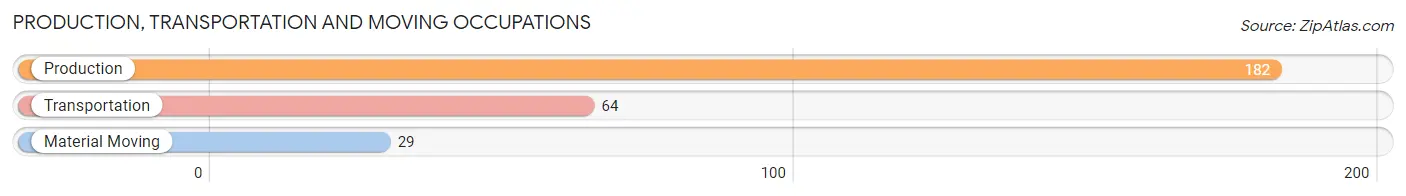
Production, Transportation and Moving Occupations
The most common Production, Transportation and Moving occupations in Manchester are Production (182 | 6.2%), Transportation (64 | 2.2%), and Material Moving (29 | 1.0%).
Production, Transportation and Moving Occupations by Sex
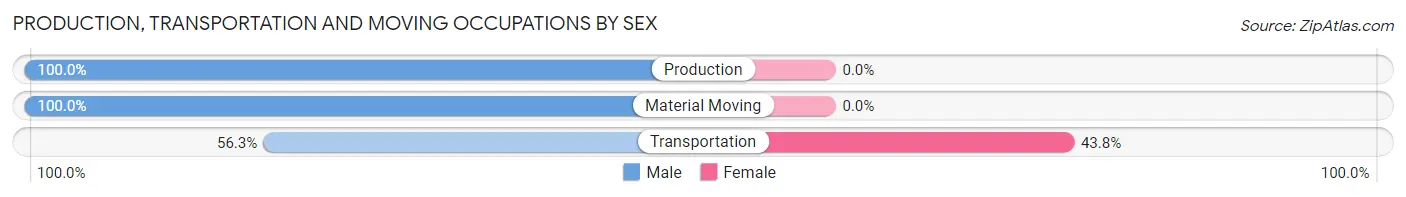
| Occupation | Male | Female |
| Production | 182 (100.0%) | 0 (0.0%) |
| Transportation | 36 (56.2%) | 28 (43.8%) |
| Material Moving | 29 (100.0%) | 0 (0.0%) |
| Total (Category) | 247 (89.8%) | 28 (10.2%) |
| Total (Overall) | 1,552 (53.3%) | 1,359 (46.7%) |
Employment Industries by Sex in Manchester
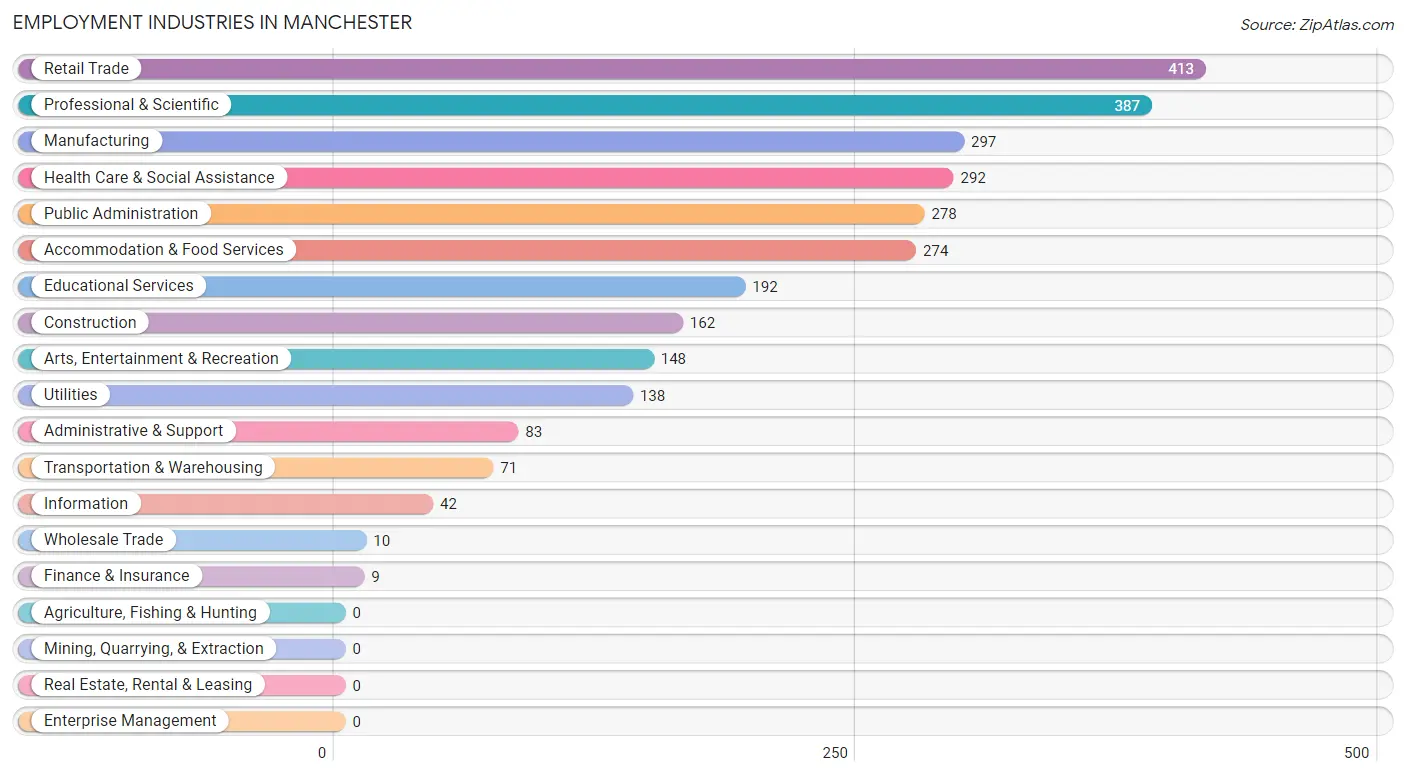
Employment Industries in Manchester
The major employment industries in Manchester include Retail Trade (413 | 14.2%), Professional & Scientific (387 | 13.3%), Manufacturing (297 | 10.2%), Health Care & Social Assistance (292 | 10.0%), and Public Administration (278 | 9.6%).
Employment Industries by Sex in Manchester
The Manchester industries that see more men than women are Construction (100.0%), Finance & Insurance (100.0%), and Administrative & Support (100.0%), whereas the industries that tend to have a higher number of women are Wholesale Trade (100.0%), Health Care & Social Assistance (84.3%), and Utilities (76.8%).
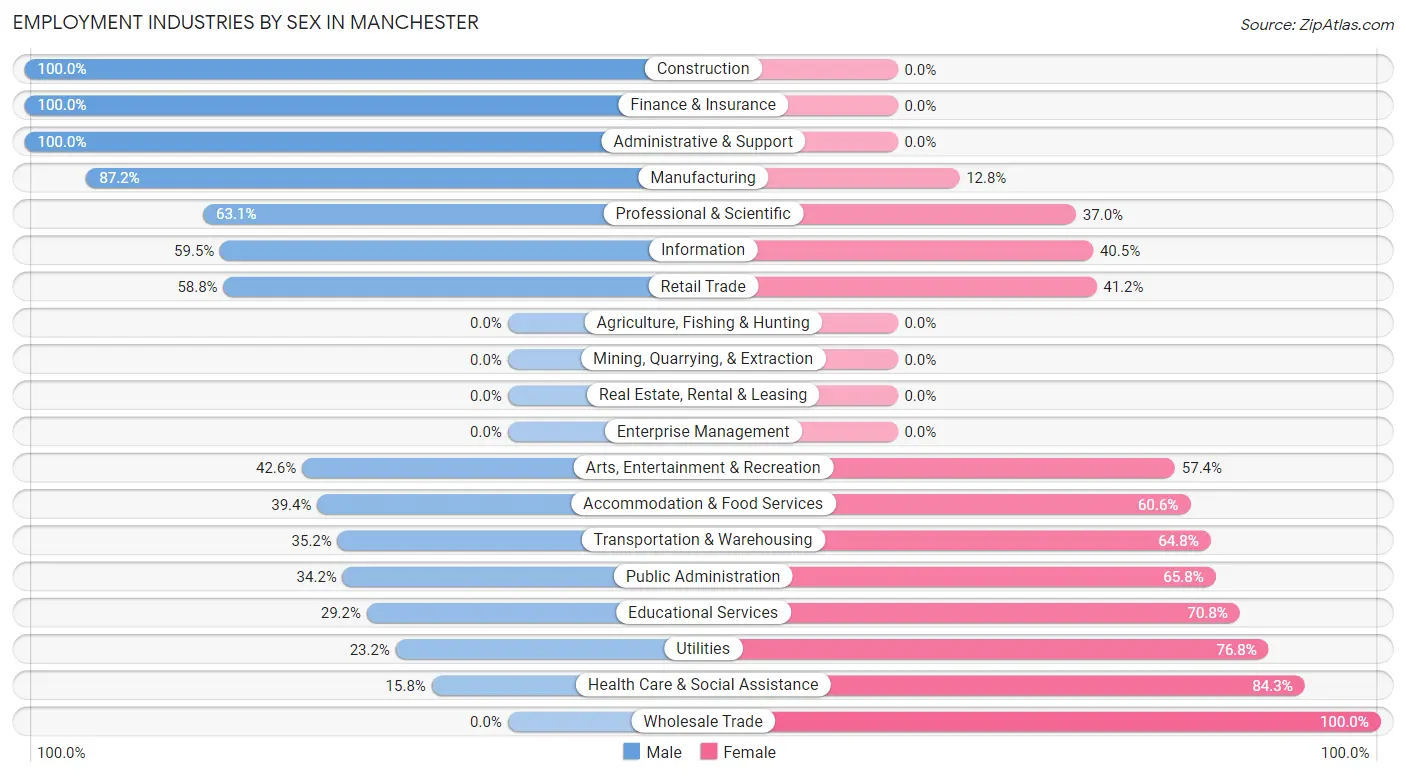
| Industry | Male | Female |
| Agriculture, Fishing & Hunting | 0 (0.0%) | 0 (0.0%) |
| Mining, Quarrying, & Extraction | 0 (0.0%) | 0 (0.0%) |
| Construction | 162 (100.0%) | 0 (0.0%) |
| Manufacturing | 259 (87.2%) | 38 (12.8%) |
| Wholesale Trade | 0 (0.0%) | 10 (100.0%) |
| Retail Trade | 243 (58.8%) | 170 (41.2%) |
| Transportation & Warehousing | 25 (35.2%) | 46 (64.8%) |
| Utilities | 32 (23.2%) | 106 (76.8%) |
| Information | 25 (59.5%) | 17 (40.5%) |
| Finance & Insurance | 9 (100.0%) | 0 (0.0%) |
| Real Estate, Rental & Leasing | 0 (0.0%) | 0 (0.0%) |
| Professional & Scientific | 244 (63.0%) | 143 (36.9%) |
| Enterprise Management | 0 (0.0%) | 0 (0.0%) |
| Administrative & Support | 83 (100.0%) | 0 (0.0%) |
| Educational Services | 56 (29.2%) | 136 (70.8%) |
| Health Care & Social Assistance | 46 (15.8%) | 246 (84.3%) |
| Arts, Entertainment & Recreation | 63 (42.6%) | 85 (57.4%) |
| Accommodation & Food Services | 108 (39.4%) | 166 (60.6%) |
| Public Administration | 95 (34.2%) | 183 (65.8%) |
| Total | 1,552 (53.3%) | 1,359 (46.7%) |
Education in Manchester
School Enrollment in Manchester
The most common levels of schooling among the 1,443 students in Manchester are high school (403 | 27.9%), elementary school (375 | 26.0%), and middle school (282 | 19.5%).
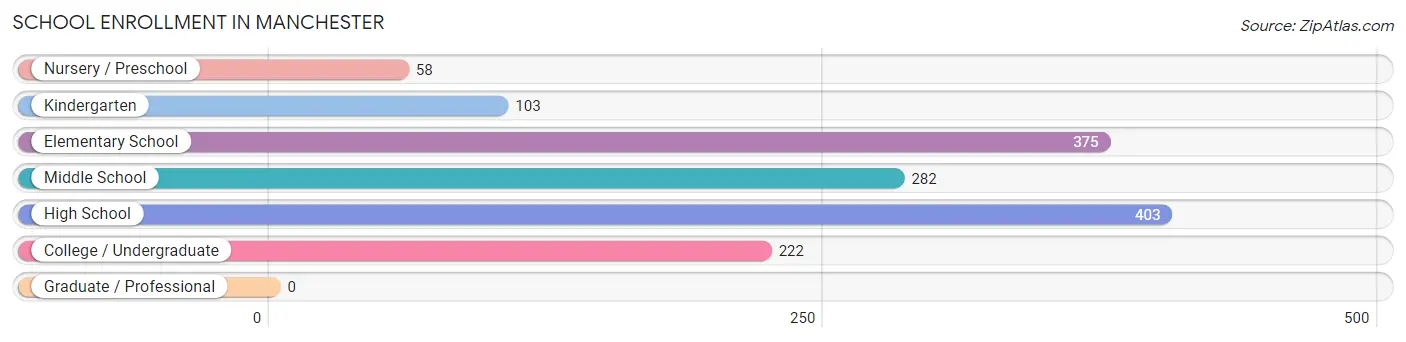
| School Level | # Students | % Students |
| Nursery / Preschool | 58 | 4.0% |
| Kindergarten | 103 | 7.1% |
| Elementary School | 375 | 26.0% |
| Middle School | 282 | 19.5% |
| High School | 403 | 27.9% |
| College / Undergraduate | 222 | 15.4% |
| Graduate / Professional | 0 | 0.0% |
| Total | 1,443 | 100.0% |
School Enrollment by Age by Funding Source in Manchester
Out of a total of 1,443 students who are enrolled in schools in Manchester, 95 (6.6%) attend a private institution, while the remaining 1,348 (93.4%) are enrolled in public schools. The age group of 18 to 19 year olds has the highest likelihood of being enrolled in private schools, with 50 (61.0% in the age bracket) enrolled. Conversely, the age group of 10 to 14 year olds has the lowest likelihood of being enrolled in a private school, with 355 (100.0% in the age bracket) attending a public institution.
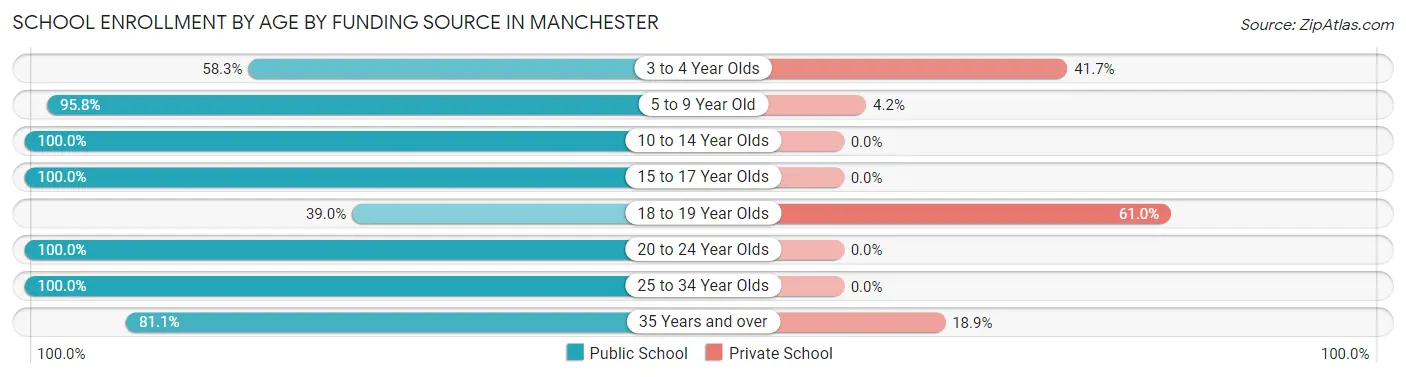
| Age Bracket | Public School | Private School |
| 3 to 4 Year Olds | 14 (58.3%) | 10 (41.7%) |
| 5 to 9 Year Old | 480 (95.8%) | 21 (4.2%) |
| 10 to 14 Year Olds | 355 (100.0%) | 0 (0.0%) |
| 15 to 17 Year Olds | 309 (100.0%) | 0 (0.0%) |
| 18 to 19 Year Olds | 32 (39.0%) | 50 (61.0%) |
| 20 to 24 Year Olds | 61 (100.0%) | 0 (0.0%) |
| 25 to 34 Year Olds | 37 (100.0%) | 0 (0.0%) |
| 35 Years and over | 60 (81.1%) | 14 (18.9%) |
| Total | 1,348 (93.4%) | 95 (6.6%) |
Educational Attainment by Field of Study in Manchester
Business (278 | 22.5%), education (129 | 10.4%), arts & humanities (127 | 10.3%), bio, nature & agricultural (105 | 8.5%), and social sciences (92 | 7.4%) are the most common fields of study among 1,236 individuals in Manchester who have obtained a bachelor's degree or higher.
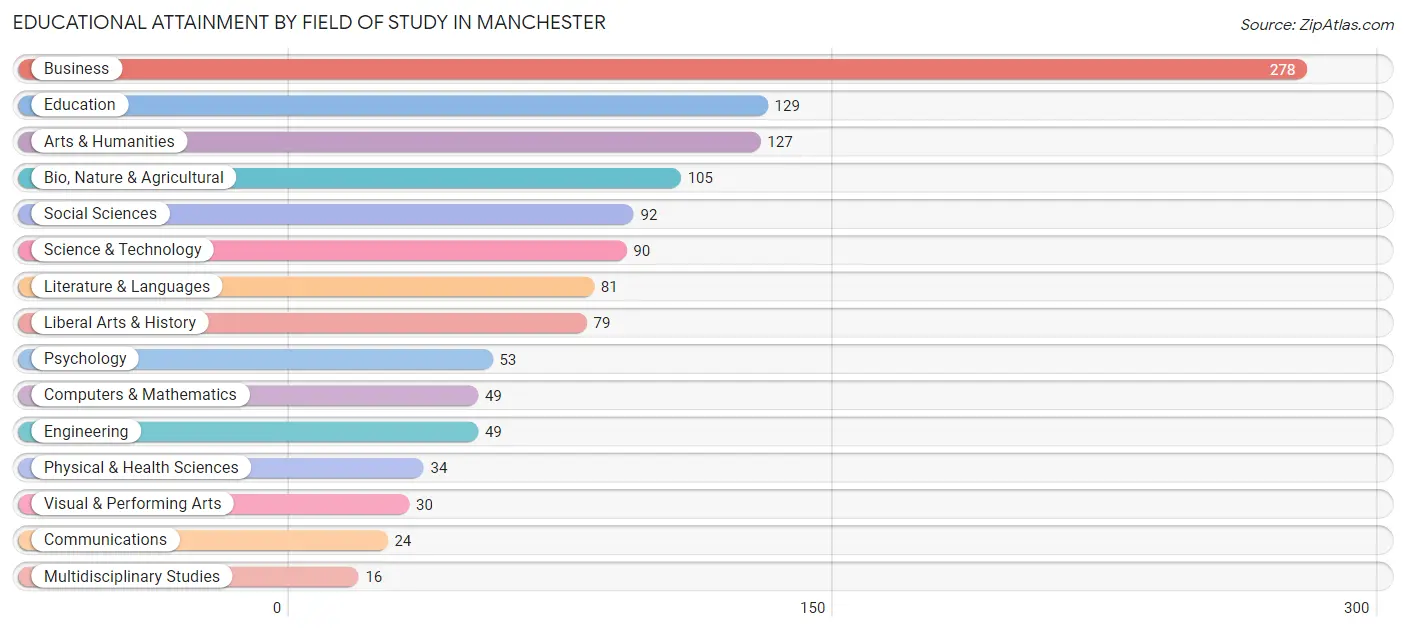
| Field of Study | # Graduates | % Graduates |
| Computers & Mathematics | 49 | 4.0% |
| Bio, Nature & Agricultural | 105 | 8.5% |
| Physical & Health Sciences | 34 | 2.8% |
| Psychology | 53 | 4.3% |
| Social Sciences | 92 | 7.4% |
| Engineering | 49 | 4.0% |
| Multidisciplinary Studies | 16 | 1.3% |
| Science & Technology | 90 | 7.3% |
| Business | 278 | 22.5% |
| Education | 129 | 10.4% |
| Literature & Languages | 81 | 6.6% |
| Liberal Arts & History | 79 | 6.4% |
| Visual & Performing Arts | 30 | 2.4% |
| Communications | 24 | 1.9% |
| Arts & Humanities | 127 | 10.3% |
| Total | 1,236 | 100.0% |
Transportation & Commute in Manchester
Vehicle Availability by Sex in Manchester
The most prevalent vehicle ownership categories in Manchester are males with 2 vehicles (694, accounting for 44.9%) and females with 2 vehicles (646, making up 52.3%).
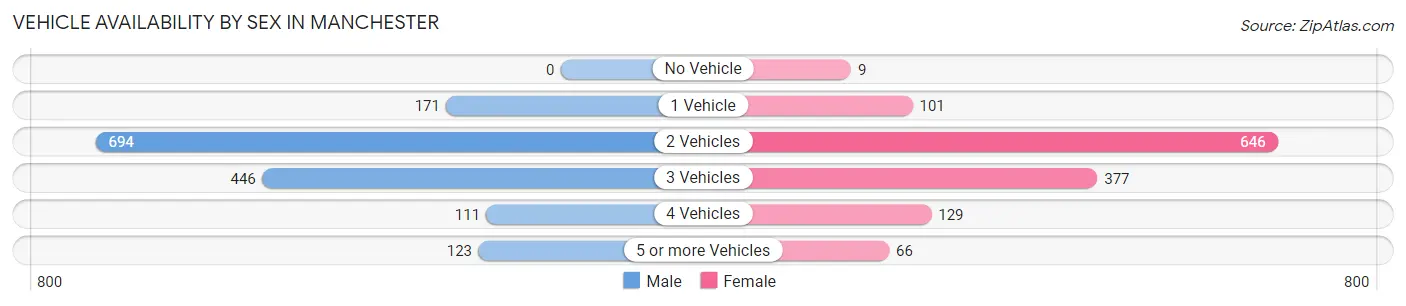
| Vehicles Available | Male | Female |
| No Vehicle | 0 (0.0%) | 9 (0.7%) |
| 1 Vehicle | 171 (11.1%) | 101 (7.6%) |
| 2 Vehicles | 694 (44.9%) | 646 (48.6%) |
| 3 Vehicles | 446 (28.9%) | 377 (28.4%) |
| 4 Vehicles | 111 (7.2%) | 129 (9.7%) |
| 5 or more Vehicles | 123 (8.0%) | 66 (5.0%) |
| Total | 1,545 (100.0%) | 1,328 (100.0%) |
Commute Time in Manchester
The most frequently occuring commute durations in Manchester are 10 to 14 minutes (488 commuters, 18.5%), 20 to 24 minutes (400 commuters, 15.1%), and 30 to 34 minutes (305 commuters, 11.5%).
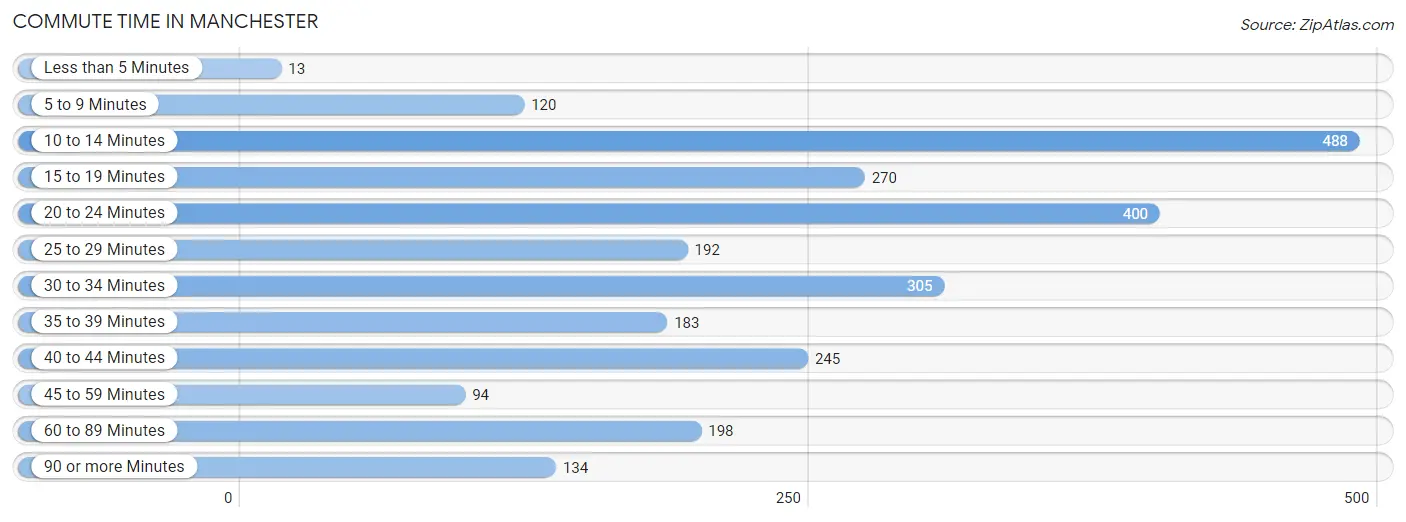
| Commute Time | # Commuters | % Commuters |
| Less than 5 Minutes | 13 | 0.5% |
| 5 to 9 Minutes | 120 | 4.5% |
| 10 to 14 Minutes | 488 | 18.5% |
| 15 to 19 Minutes | 270 | 10.2% |
| 20 to 24 Minutes | 400 | 15.1% |
| 25 to 29 Minutes | 192 | 7.3% |
| 30 to 34 Minutes | 305 | 11.5% |
| 35 to 39 Minutes | 183 | 6.9% |
| 40 to 44 Minutes | 245 | 9.3% |
| 45 to 59 Minutes | 94 | 3.6% |
| 60 to 89 Minutes | 198 | 7.5% |
| 90 or more Minutes | 134 | 5.1% |
Commute Time by Sex in Manchester
The most common commute times in Manchester are 20 to 24 minutes (232 commuters, 15.5%) for males and 10 to 14 minutes (281 commuters, 24.6%) for females.
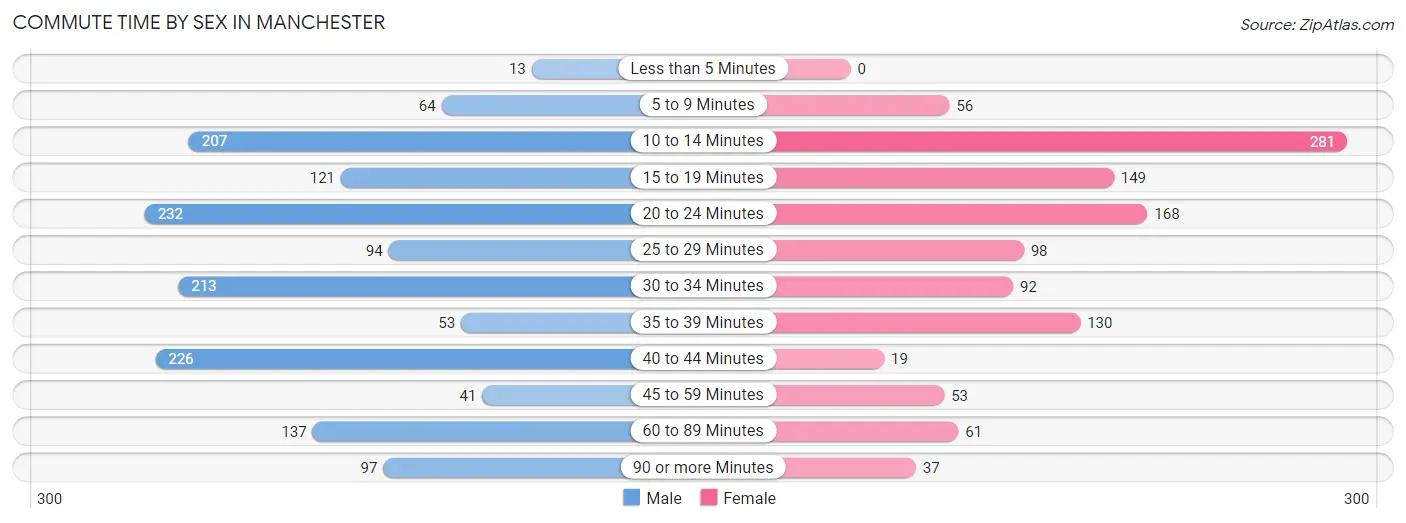
| Commute Time | Male | Female |
| Less than 5 Minutes | 13 (0.9%) | 0 (0.0%) |
| 5 to 9 Minutes | 64 (4.3%) | 56 (4.9%) |
| 10 to 14 Minutes | 207 (13.8%) | 281 (24.6%) |
| 15 to 19 Minutes | 121 (8.1%) | 149 (13.0%) |
| 20 to 24 Minutes | 232 (15.5%) | 168 (14.7%) |
| 25 to 29 Minutes | 94 (6.3%) | 98 (8.6%) |
| 30 to 34 Minutes | 213 (14.2%) | 92 (8.0%) |
| 35 to 39 Minutes | 53 (3.5%) | 130 (11.4%) |
| 40 to 44 Minutes | 226 (15.1%) | 19 (1.7%) |
| 45 to 59 Minutes | 41 (2.7%) | 53 (4.6%) |
| 60 to 89 Minutes | 137 (9.1%) | 61 (5.3%) |
| 90 or more Minutes | 97 (6.5%) | 37 (3.2%) |
Time of Departure to Work by Sex in Manchester
The most frequent times of departure to work in Manchester are 12:00 PM to 3:59 PM (231, 15.4%) for males and 7:00 AM to 7:29 AM (189, 16.5%) for females.
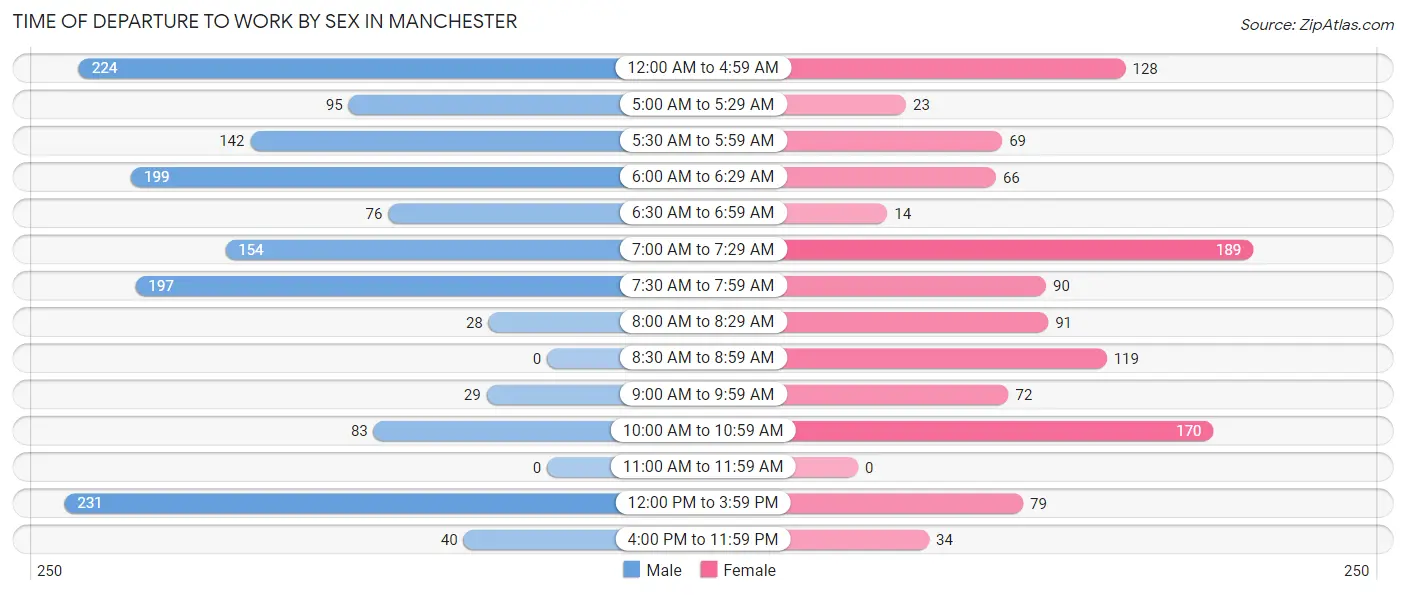
| Time of Departure | Male | Female |
| 12:00 AM to 4:59 AM | 224 (14.9%) | 128 (11.2%) |
| 5:00 AM to 5:29 AM | 95 (6.3%) | 23 (2.0%) |
| 5:30 AM to 5:59 AM | 142 (9.5%) | 69 (6.0%) |
| 6:00 AM to 6:29 AM | 199 (13.3%) | 66 (5.8%) |
| 6:30 AM to 6:59 AM | 76 (5.1%) | 14 (1.2%) |
| 7:00 AM to 7:29 AM | 154 (10.3%) | 189 (16.5%) |
| 7:30 AM to 7:59 AM | 197 (13.2%) | 90 (7.9%) |
| 8:00 AM to 8:29 AM | 28 (1.9%) | 91 (8.0%) |
| 8:30 AM to 8:59 AM | 0 (0.0%) | 119 (10.4%) |
| 9:00 AM to 9:59 AM | 29 (1.9%) | 72 (6.3%) |
| 10:00 AM to 10:59 AM | 83 (5.5%) | 170 (14.9%) |
| 11:00 AM to 11:59 AM | 0 (0.0%) | 0 (0.0%) |
| 12:00 PM to 3:59 PM | 231 (15.4%) | 79 (6.9%) |
| 4:00 PM to 11:59 PM | 40 (2.7%) | 34 (3.0%) |
| Total | 1,498 (100.0%) | 1,144 (100.0%) |
Housing Occupancy in Manchester
Occupancy by Ownership in Manchester
Of the total 2,150 dwellings in Manchester, owner-occupied units account for 1,594 (74.1%), while renter-occupied units make up 556 (25.9%).
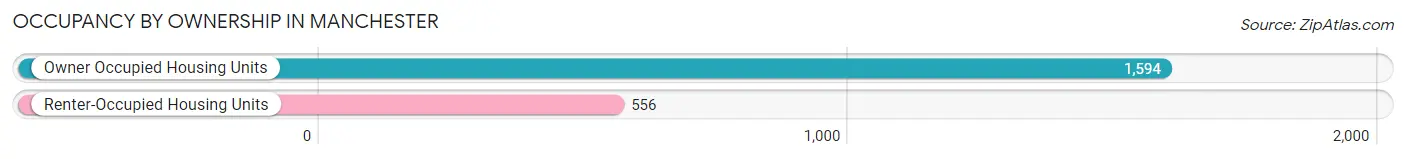
| Occupancy | # Housing Units | % Housing Units |
| Owner Occupied Housing Units | 1,594 | 74.1% |
| Renter-Occupied Housing Units | 556 | 25.9% |
| Total Occupied Housing Units | 2,150 | 100.0% |
Occupancy by Household Size in Manchester
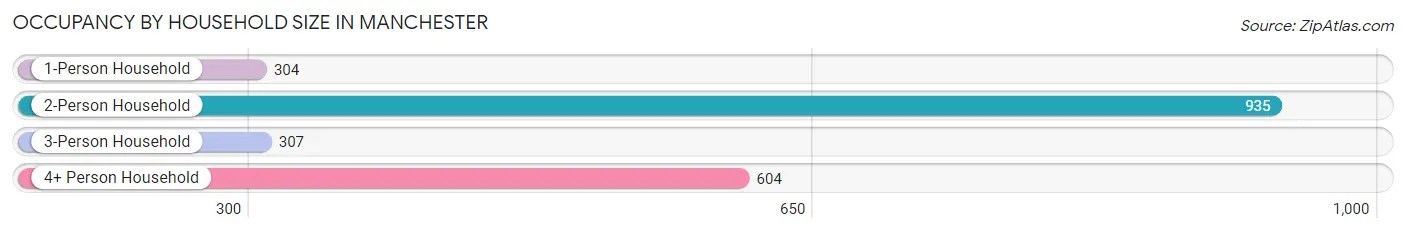
| Household Size | # Housing Units | % Housing Units |
| 1-Person Household | 304 | 14.1% |
| 2-Person Household | 935 | 43.5% |
| 3-Person Household | 307 | 14.3% |
| 4+ Person Household | 604 | 28.1% |
| Total Housing Units | 2,150 | 100.0% |
Occupancy by Ownership by Household Size in Manchester
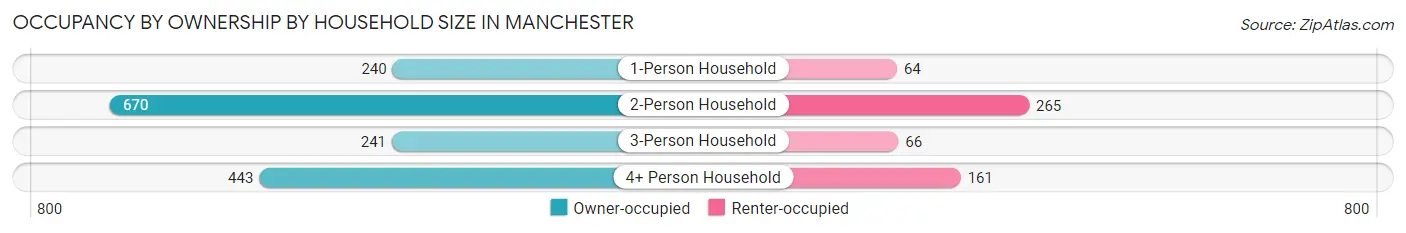
| Household Size | Owner-occupied | Renter-occupied |
| 1-Person Household | 240 (78.9%) | 64 (21.0%) |
| 2-Person Household | 670 (71.7%) | 265 (28.3%) |
| 3-Person Household | 241 (78.5%) | 66 (21.5%) |
| 4+ Person Household | 443 (73.3%) | 161 (26.7%) |
| Total Housing Units | 1,594 (74.1%) | 556 (25.9%) |
Occupancy by Educational Attainment in Manchester
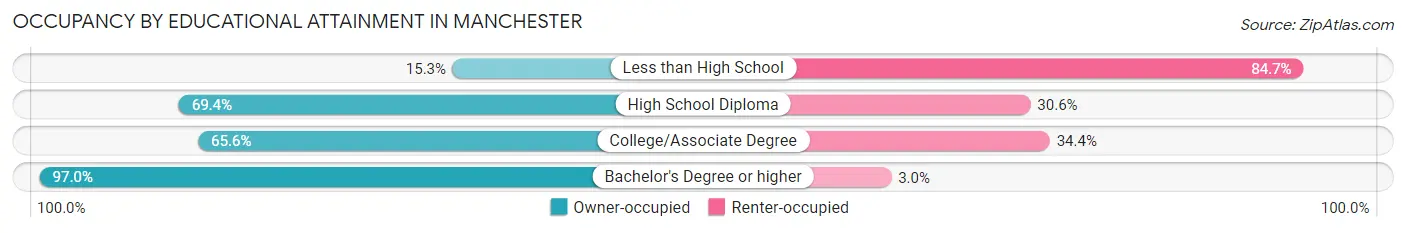
| Household Size | Owner-occupied | Renter-occupied |
| Less than High School | 13 (15.3%) | 72 (84.7%) |
| High School Diploma | 277 (69.4%) | 122 (30.6%) |
| College/Associate Degree | 652 (65.6%) | 342 (34.4%) |
| Bachelor's Degree or higher | 652 (97.0%) | 20 (3.0%) |
Occupancy by Age of Householder in Manchester
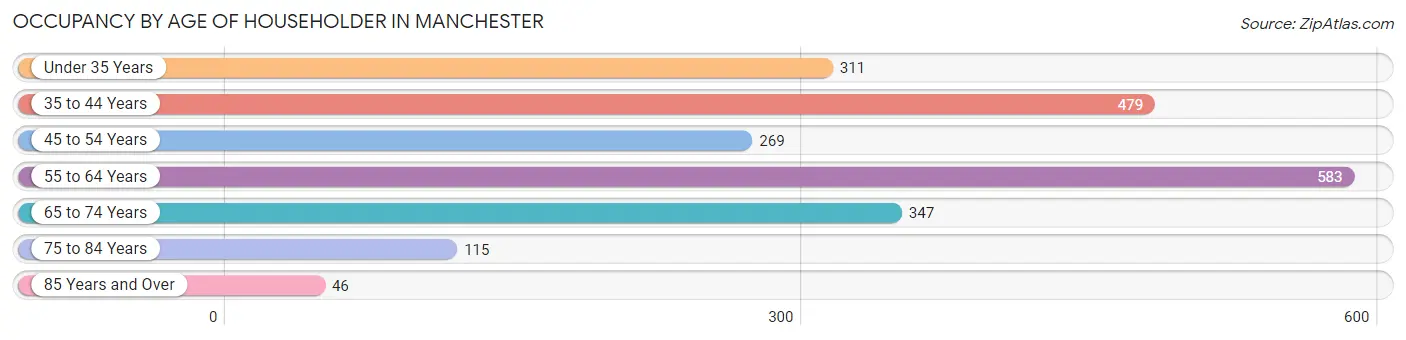
| Age Bracket | # Households | % Households |
| Under 35 Years | 311 | 14.5% |
| 35 to 44 Years | 479 | 22.3% |
| 45 to 54 Years | 269 | 12.5% |
| 55 to 64 Years | 583 | 27.1% |
| 65 to 74 Years | 347 | 16.1% |
| 75 to 84 Years | 115 | 5.3% |
| 85 Years and Over | 46 | 2.1% |
| Total | 2,150 | 100.0% |
Housing Finances in Manchester
Median Income by Occupancy in Manchester
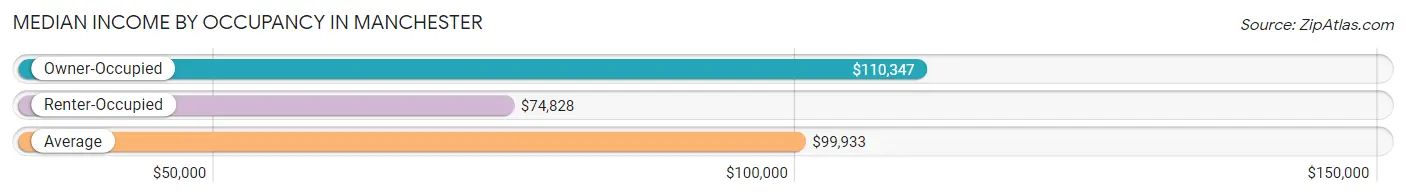
| Occupancy Type | # Households | Median Income |
| Owner-Occupied | 1,594 (74.1%) | $110,347 |
| Renter-Occupied | 556 (25.9%) | $74,828 |
| Average | 2,150 (100.0%) | $99,933 |
Occupancy by Householder Income Bracket in Manchester
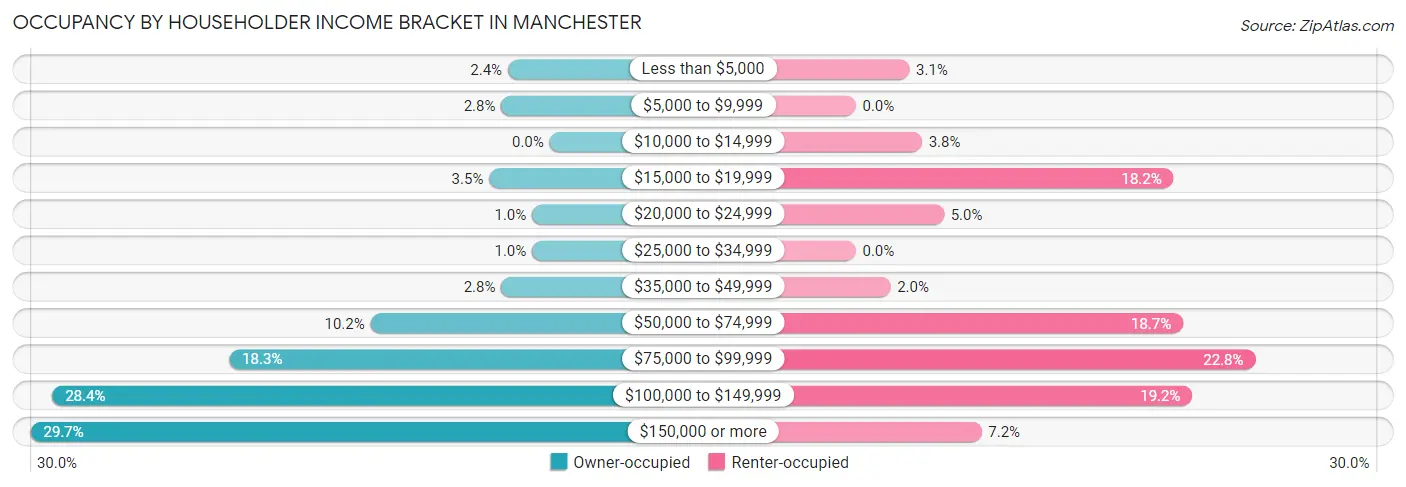
| Income Bracket | Owner-occupied | Renter-occupied |
| Less than $5,000 | 38 (2.4%) | 17 (3.1%) |
| $5,000 to $9,999 | 44 (2.8%) | 0 (0.0%) |
| $10,000 to $14,999 | 0 (0.0%) | 21 (3.8%) |
| $15,000 to $19,999 | 55 (3.5%) | 101 (18.2%) |
| $20,000 to $24,999 | 16 (1.0%) | 28 (5.0%) |
| $25,000 to $34,999 | 16 (1.0%) | 0 (0.0%) |
| $35,000 to $49,999 | 44 (2.8%) | 11 (2.0%) |
| $50,000 to $74,999 | 163 (10.2%) | 104 (18.7%) |
| $75,000 to $99,999 | 292 (18.3%) | 127 (22.8%) |
| $100,000 to $149,999 | 453 (28.4%) | 107 (19.2%) |
| $150,000 or more | 473 (29.7%) | 40 (7.2%) |
| Total | 1,594 (100.0%) | 556 (100.0%) |
Monthly Housing Cost Tiers in Manchester
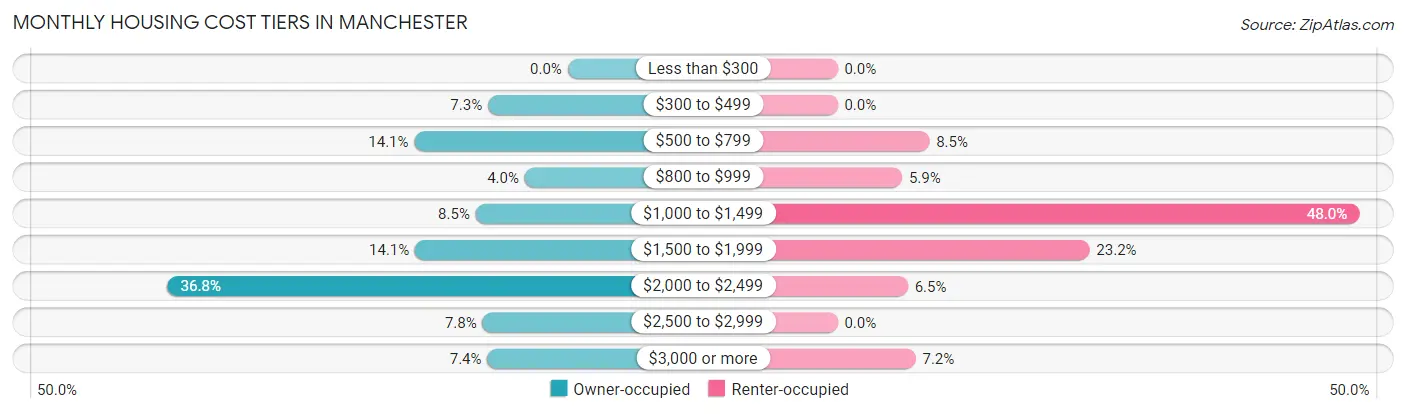
| Monthly Cost | Owner-occupied | Renter-occupied |
| Less than $300 | 0 (0.0%) | 0 (0.0%) |
| $300 to $499 | 117 (7.3%) | 0 (0.0%) |
| $500 to $799 | 225 (14.1%) | 47 (8.5%) |
| $800 to $999 | 63 (4.0%) | 33 (5.9%) |
| $1,000 to $1,499 | 135 (8.5%) | 267 (48.0%) |
| $1,500 to $1,999 | 224 (14.1%) | 129 (23.2%) |
| $2,000 to $2,499 | 587 (36.8%) | 36 (6.5%) |
| $2,500 to $2,999 | 125 (7.8%) | 0 (0.0%) |
| $3,000 or more | 118 (7.4%) | 40 (7.2%) |
| Total | 1,594 (100.0%) | 556 (100.0%) |
Physical Housing Characteristics in Manchester
Housing Structures in Manchester
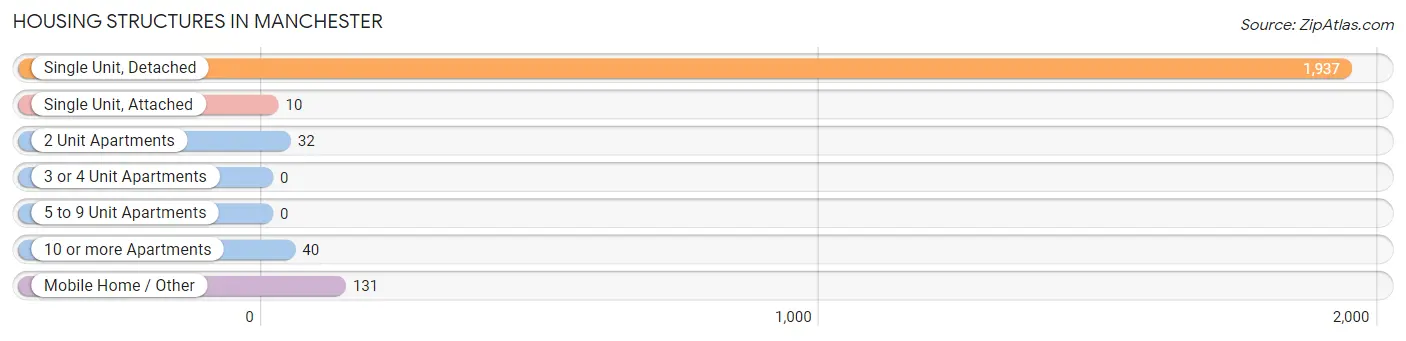
| Structure Type | # Housing Units | % Housing Units |
| Single Unit, Detached | 1,937 | 90.1% |
| Single Unit, Attached | 10 | 0.5% |
| 2 Unit Apartments | 32 | 1.5% |
| 3 or 4 Unit Apartments | 0 | 0.0% |
| 5 to 9 Unit Apartments | 0 | 0.0% |
| 10 or more Apartments | 40 | 1.9% |
| Mobile Home / Other | 131 | 6.1% |
| Total | 2,150 | 100.0% |
Housing Structures by Occupancy in Manchester
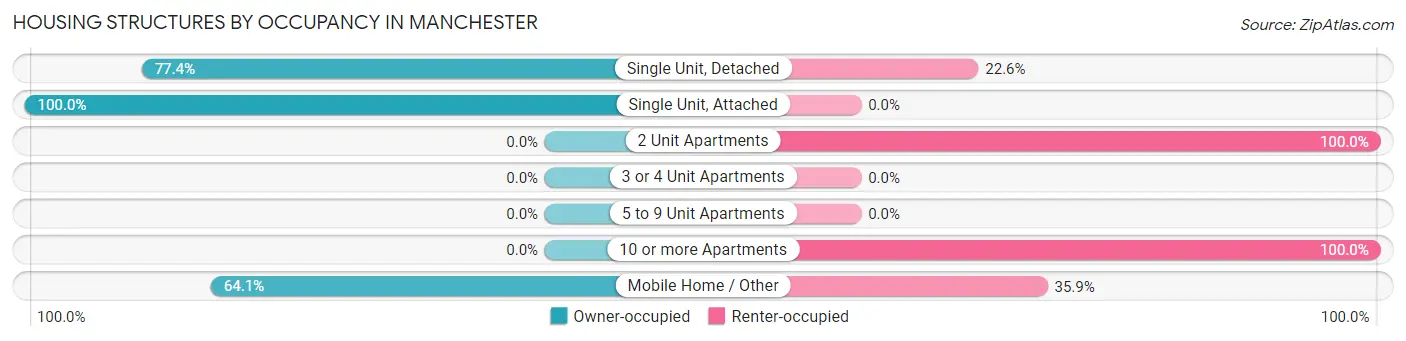
| Structure Type | Owner-occupied | Renter-occupied |
| Single Unit, Detached | 1,500 (77.4%) | 437 (22.6%) |
| Single Unit, Attached | 10 (100.0%) | 0 (0.0%) |
| 2 Unit Apartments | 0 (0.0%) | 32 (100.0%) |
| 3 or 4 Unit Apartments | 0 (0.0%) | 0 (0.0%) |
| 5 to 9 Unit Apartments | 0 (0.0%) | 0 (0.0%) |
| 10 or more Apartments | 0 (0.0%) | 40 (100.0%) |
| Mobile Home / Other | 84 (64.1%) | 47 (35.9%) |
| Total | 1,594 (74.1%) | 556 (25.9%) |
Housing Structures by Number of Rooms in Manchester
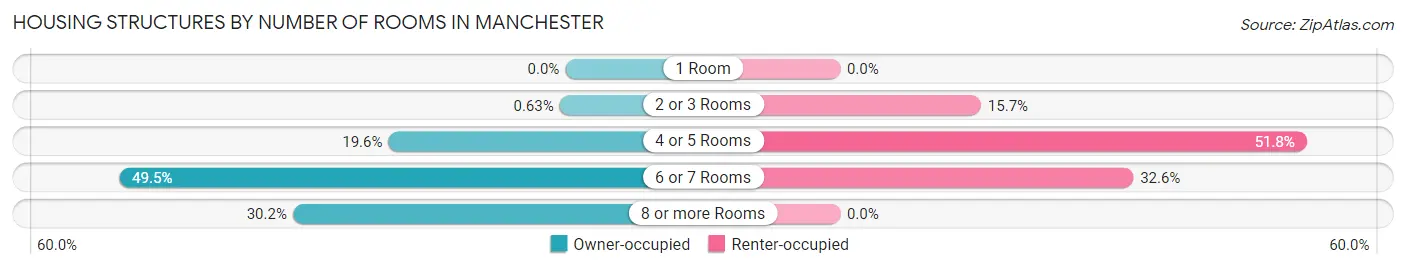
| Number of Rooms | Owner-occupied | Renter-occupied |
| 1 Room | 0 (0.0%) | 0 (0.0%) |
| 2 or 3 Rooms | 10 (0.6%) | 87 (15.7%) |
| 4 or 5 Rooms | 313 (19.6%) | 288 (51.8%) |
| 6 or 7 Rooms | 789 (49.5%) | 181 (32.6%) |
| 8 or more Rooms | 482 (30.2%) | 0 (0.0%) |
| Total | 1,594 (100.0%) | 556 (100.0%) |
Housing Structure by Heating Type in Manchester
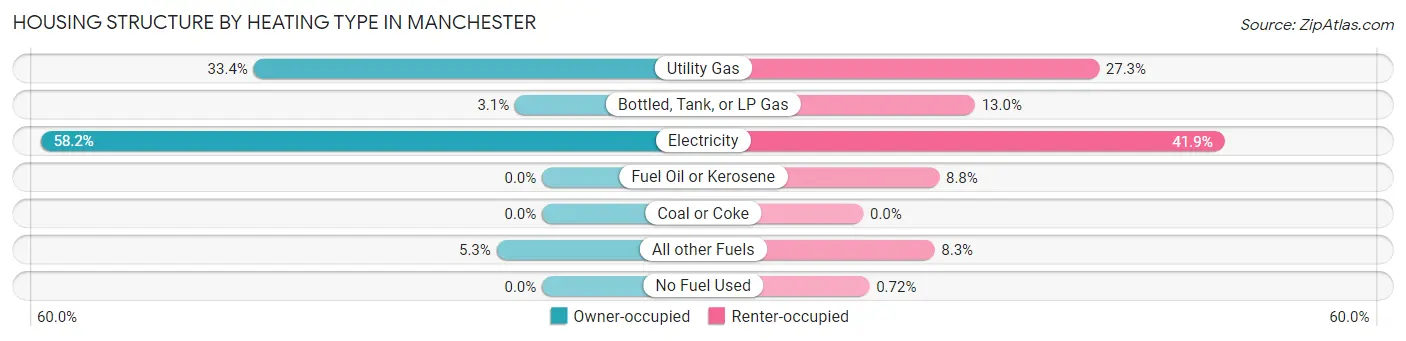
| Heating Type | Owner-occupied | Renter-occupied |
| Utility Gas | 533 (33.4%) | 152 (27.3%) |
| Bottled, Tank, or LP Gas | 50 (3.1%) | 72 (13.0%) |
| Electricity | 927 (58.2%) | 233 (41.9%) |
| Fuel Oil or Kerosene | 0 (0.0%) | 49 (8.8%) |
| Coal or Coke | 0 (0.0%) | 0 (0.0%) |
| All other Fuels | 84 (5.3%) | 46 (8.3%) |
| No Fuel Used | 0 (0.0%) | 4 (0.7%) |
| Total | 1,594 (100.0%) | 556 (100.0%) |
Household Vehicle Usage in Manchester
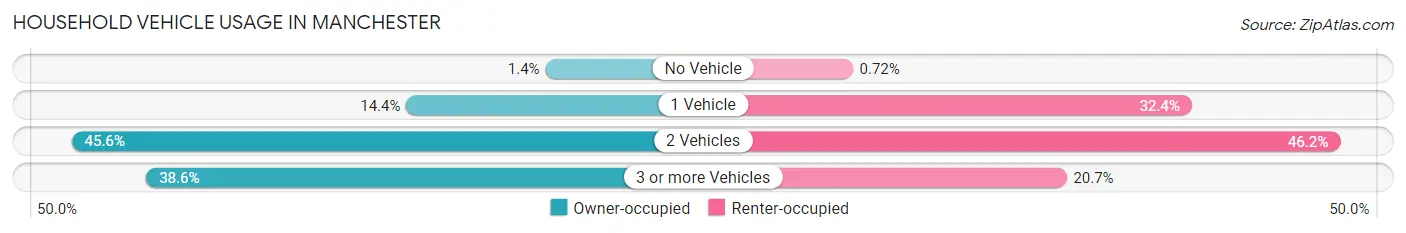
| Vehicles per Household | Owner-occupied | Renter-occupied |
| No Vehicle | 22 (1.4%) | 4 (0.7%) |
| 1 Vehicle | 229 (14.4%) | 180 (32.4%) |
| 2 Vehicles | 727 (45.6%) | 257 (46.2%) |
| 3 or more Vehicles | 616 (38.6%) | 115 (20.7%) |
| Total | 1,594 (100.0%) | 556 (100.0%) |
Real Estate & Mortgages in Manchester
Real Estate and Mortgage Overview in Manchester
| Characteristic | Without Mortgage | With Mortgage |
| Housing Units | 436 | 1,158 |
| Median Property Value | $402,700 | $440,300 |
| Median Household Income | $87,121 | $385 |
| Monthly Housing Costs | $572 | $118 |
| Real Estate Taxes | $3,416 | $0 |
Property Value by Mortgage Status in Manchester
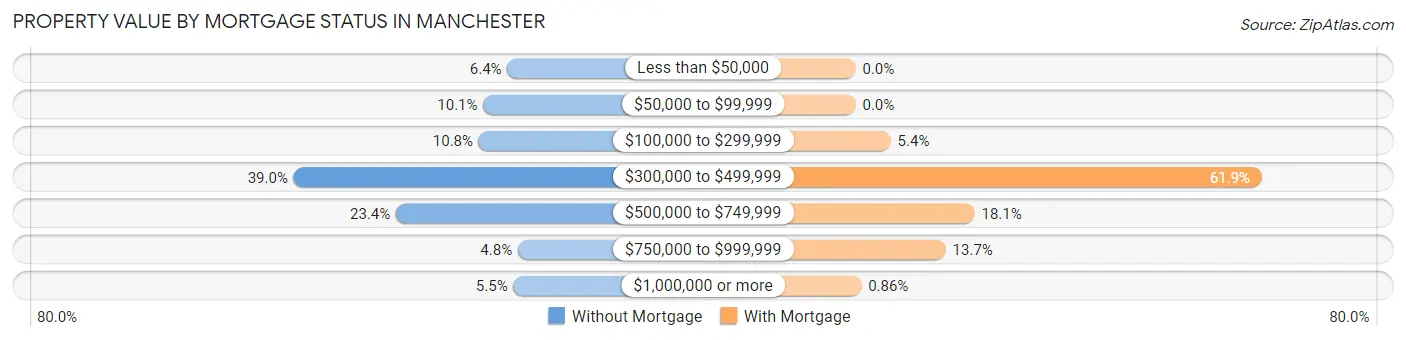
| Property Value | Without Mortgage | With Mortgage |
| Less than $50,000 | 28 (6.4%) | 0 (0.0%) |
| $50,000 to $99,999 | 44 (10.1%) | 0 (0.0%) |
| $100,000 to $299,999 | 47 (10.8%) | 62 (5.3%) |
| $300,000 to $499,999 | 170 (39.0%) | 717 (61.9%) |
| $500,000 to $749,999 | 102 (23.4%) | 210 (18.1%) |
| $750,000 to $999,999 | 21 (4.8%) | 159 (13.7%) |
| $1,000,000 or more | 24 (5.5%) | 10 (0.9%) |
| Total | 436 (100.0%) | 1,158 (100.0%) |
Household Income by Mortgage Status in Manchester
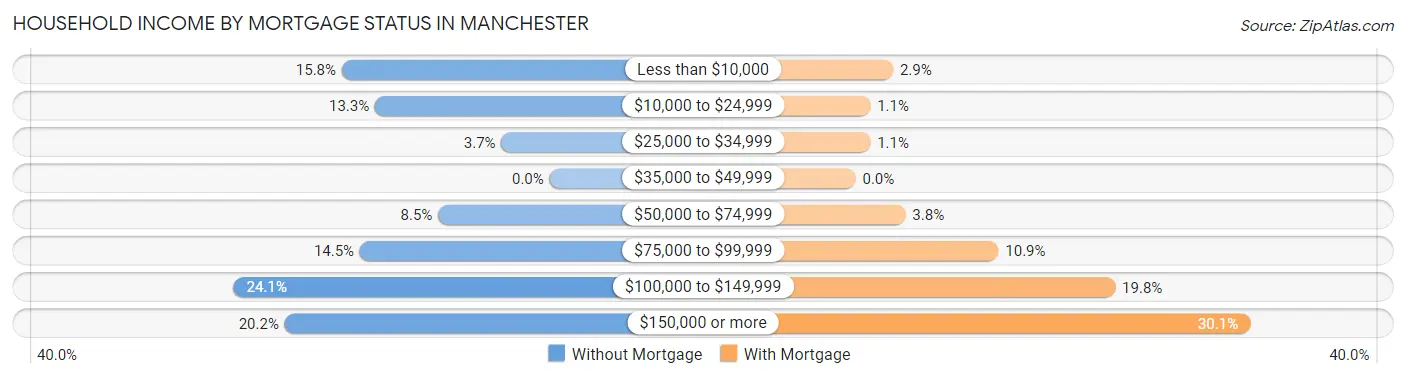
| Household Income | Without Mortgage | With Mortgage |
| Less than $10,000 | 69 (15.8%) | 33 (2.9%) |
| $10,000 to $24,999 | 58 (13.3%) | 13 (1.1%) |
| $25,000 to $34,999 | 16 (3.7%) | 13 (1.1%) |
| $35,000 to $49,999 | 0 (0.0%) | 0 (0.0%) |
| $50,000 to $74,999 | 37 (8.5%) | 44 (3.8%) |
| $75,000 to $99,999 | 63 (14.4%) | 126 (10.9%) |
| $100,000 to $149,999 | 105 (24.1%) | 229 (19.8%) |
| $150,000 or more | 88 (20.2%) | 348 (30.0%) |
| Total | 436 (100.0%) | 1,158 (100.0%) |
Property Value to Household Income Ratio in Manchester
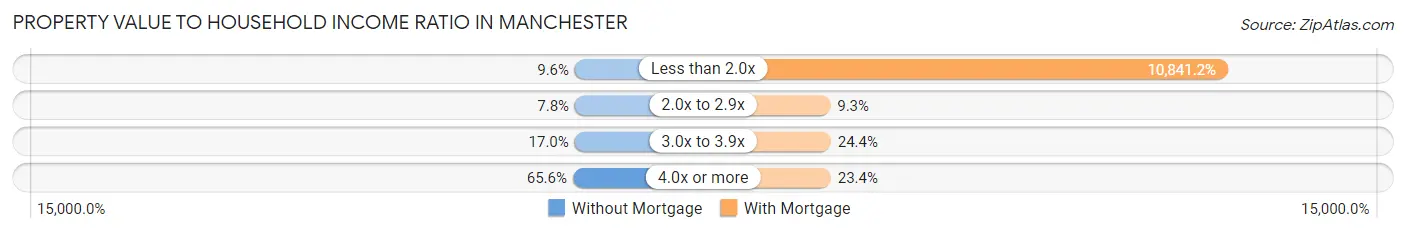
| Value-to-Income Ratio | Without Mortgage | With Mortgage |
| Less than 2.0x | 42 (9.6%) | 125,541 (10,841.2%) |
| 2.0x to 2.9x | 34 (7.8%) | 108 (9.3%) |
| 3.0x to 3.9x | 74 (17.0%) | 283 (24.4%) |
| 4.0x or more | 286 (65.6%) | 271 (23.4%) |
| Total | 436 (100.0%) | 1,158 (100.0%) |
Real Estate Taxes by Mortgage Status in Manchester
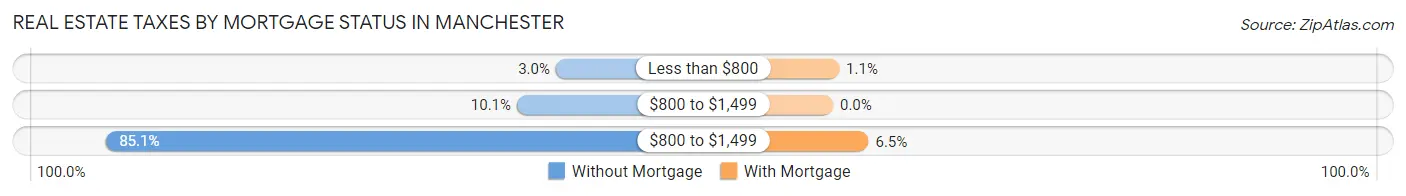
| Property Taxes | Without Mortgage | With Mortgage |
| Less than $800 | 13 (3.0%) | 13 (1.1%) |
| $800 to $1,499 | 44 (10.1%) | 0 (0.0%) |
| $800 to $1,499 | 371 (85.1%) | 75 (6.5%) |
| Total | 436 (100.0%) | 1,158 (100.0%) |
Health & Disability in Manchester
Health Insurance Coverage by Age in Manchester
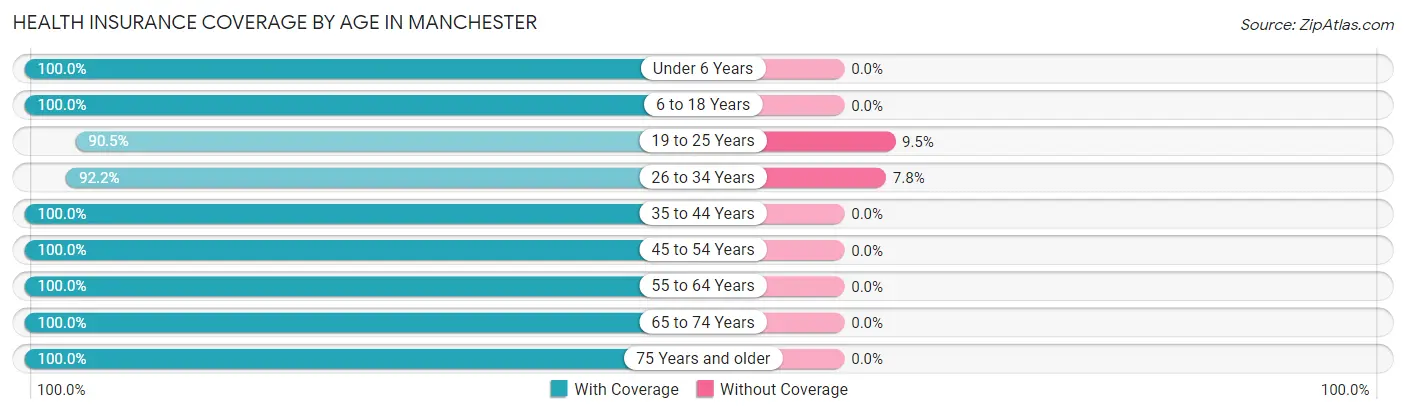
| Age Bracket | With Coverage | Without Coverage |
| Under 6 Years | 329 (100.0%) | 0 (0.0%) |
| 6 to 18 Years | 1,174 (100.0%) | 0 (0.0%) |
| 19 to 25 Years | 507 (90.5%) | 53 (9.5%) |
| 26 to 34 Years | 404 (92.2%) | 34 (7.8%) |
| 35 to 44 Years | 976 (100.0%) | 0 (0.0%) |
| 45 to 54 Years | 513 (100.0%) | 0 (0.0%) |
| 55 to 64 Years | 1,078 (100.0%) | 0 (0.0%) |
| 65 to 74 Years | 624 (100.0%) | 0 (0.0%) |
| 75 Years and older | 303 (100.0%) | 0 (0.0%) |
| Total | 5,908 (98.6%) | 87 (1.5%) |
Health Insurance Coverage by Citizenship Status in Manchester
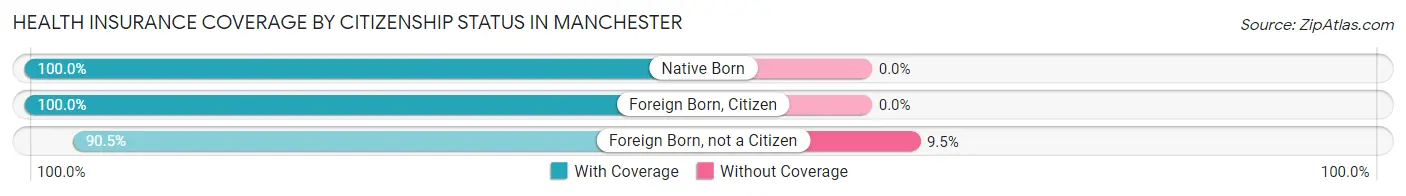
| Citizenship Status | With Coverage | Without Coverage |
| Native Born | 329 (100.0%) | 0 (0.0%) |
| Foreign Born, Citizen | 1,174 (100.0%) | 0 (0.0%) |
| Foreign Born, not a Citizen | 507 (90.5%) | 53 (9.5%) |
Health Insurance Coverage by Household Income in Manchester
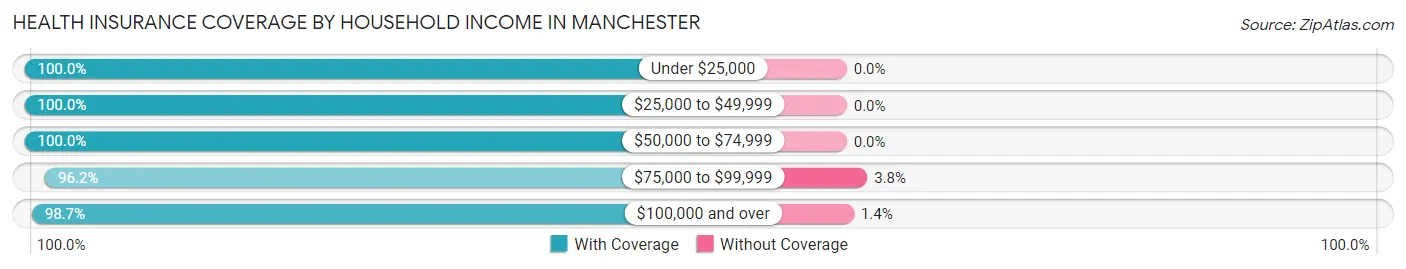
| Household Income | With Coverage | Without Coverage |
| Under $25,000 | 694 (100.0%) | 0 (0.0%) |
| $25,000 to $49,999 | 151 (100.0%) | 0 (0.0%) |
| $50,000 to $74,999 | 617 (100.0%) | 0 (0.0%) |
| $75,000 to $99,999 | 1,003 (96.2%) | 40 (3.8%) |
| $100,000 and over | 3,441 (98.7%) | 47 (1.3%) |
Public vs Private Health Insurance Coverage by Age in Manchester
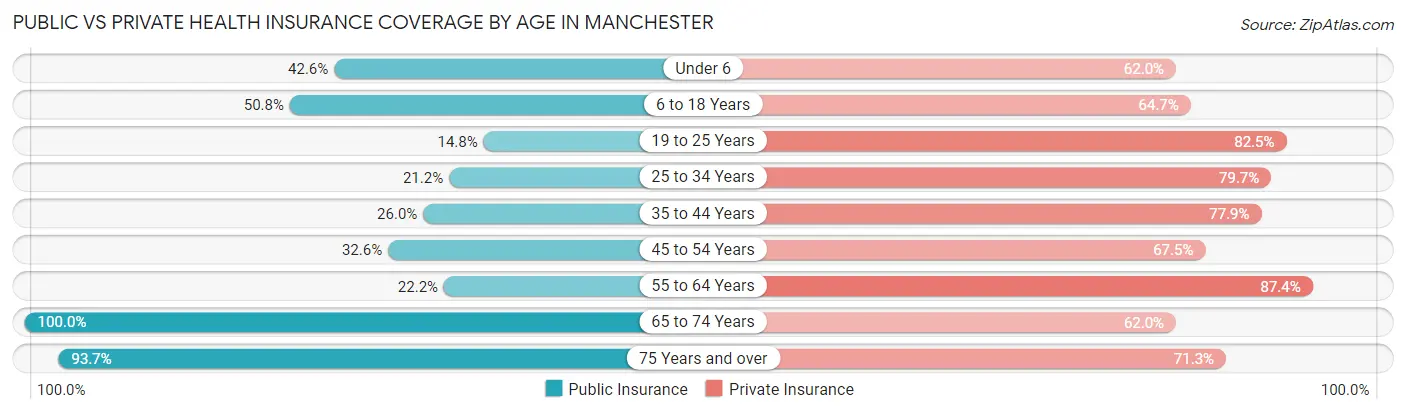
| Age Bracket | Public Insurance | Private Insurance |
| Under 6 | 140 (42.5%) | 204 (62.0%) |
| 6 to 18 Years | 596 (50.8%) | 760 (64.7%) |
| 19 to 25 Years | 83 (14.8%) | 462 (82.5%) |
| 25 to 34 Years | 93 (21.2%) | 349 (79.7%) |
| 35 to 44 Years | 254 (26.0%) | 760 (77.9%) |
| 45 to 54 Years | 167 (32.6%) | 346 (67.4%) |
| 55 to 64 Years | 239 (22.2%) | 942 (87.4%) |
| 65 to 74 Years | 624 (100.0%) | 387 (62.0%) |
| 75 Years and over | 284 (93.7%) | 216 (71.3%) |
| Total | 2,480 (41.4%) | 4,426 (73.8%) |
Disability Status by Sex by Age in Manchester
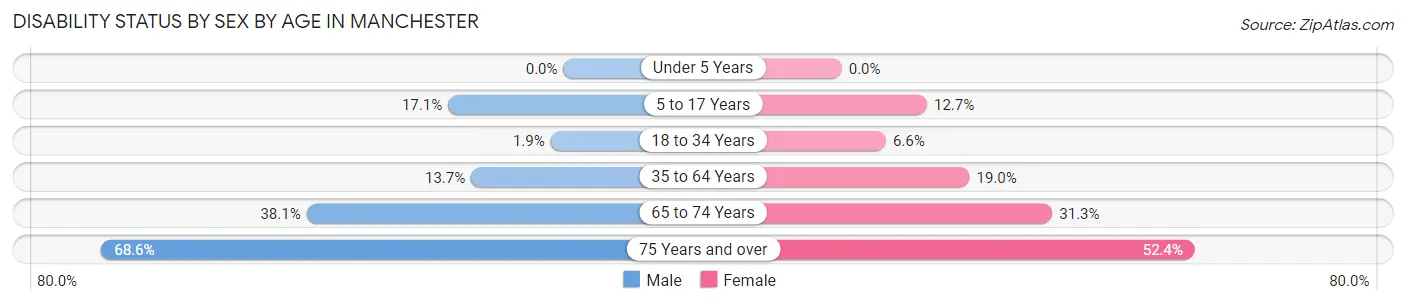
| Age Bracket | Male | Female |
| Under 5 Years | 0 (0.0%) | 0 (0.0%) |
| 5 to 17 Years | 116 (17.1%) | 81 (12.7%) |
| 18 to 34 Years | 10 (1.9%) | 33 (6.6%) |
| 35 to 64 Years | 177 (13.7%) | 242 (19.0%) |
| 65 to 74 Years | 127 (38.1%) | 91 (31.3%) |
| 75 Years and over | 94 (68.6%) | 87 (52.4%) |
Disability Class by Sex by Age in Manchester
Disability Class: Hearing Difficulty
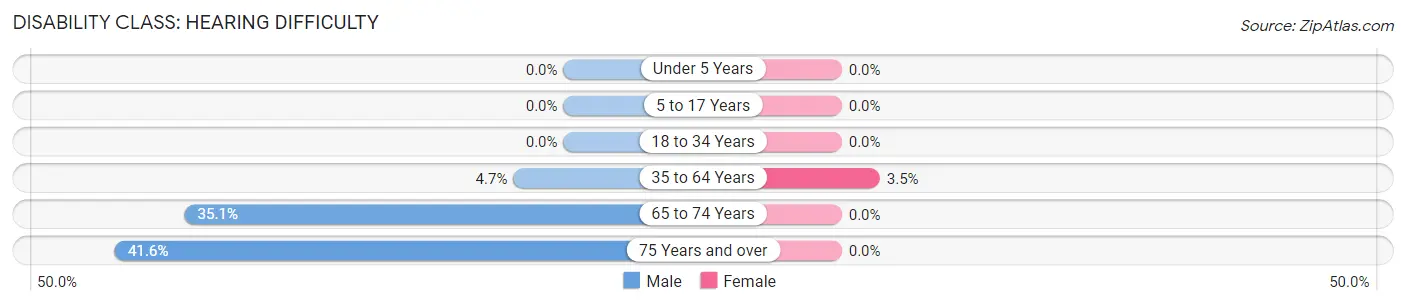
| Age Bracket | Male | Female |
| Under 5 Years | 0 (0.0%) | 0 (0.0%) |
| 5 to 17 Years | 0 (0.0%) | 0 (0.0%) |
| 18 to 34 Years | 0 (0.0%) | 0 (0.0%) |
| 35 to 64 Years | 60 (4.6%) | 45 (3.5%) |
| 65 to 74 Years | 117 (35.1%) | 0 (0.0%) |
| 75 Years and over | 57 (41.6%) | 0 (0.0%) |
Disability Class: Vision Difficulty
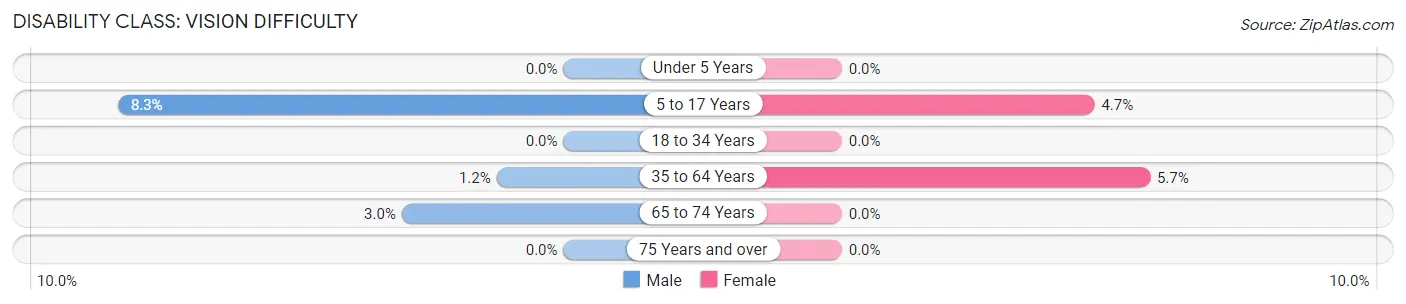
| Age Bracket | Male | Female |
| Under 5 Years | 0 (0.0%) | 0 (0.0%) |
| 5 to 17 Years | 56 (8.3%) | 30 (4.7%) |
| 18 to 34 Years | 0 (0.0%) | 0 (0.0%) |
| 35 to 64 Years | 16 (1.2%) | 73 (5.7%) |
| 65 to 74 Years | 10 (3.0%) | 0 (0.0%) |
| 75 Years and over | 0 (0.0%) | 0 (0.0%) |
Disability Class: Cognitive Difficulty
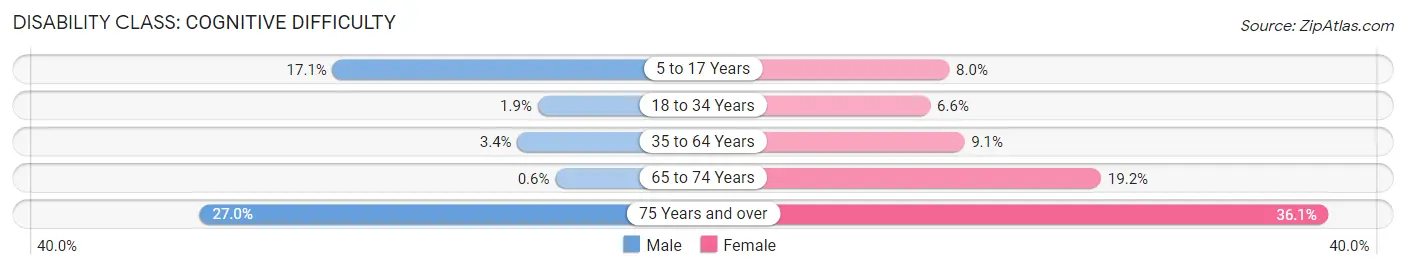
| Age Bracket | Male | Female |
| 5 to 17 Years | 116 (17.1%) | 51 (8.0%) |
| 18 to 34 Years | 10 (1.9%) | 33 (6.6%) |
| 35 to 64 Years | 44 (3.4%) | 116 (9.1%) |
| 65 to 74 Years | 2 (0.6%) | 56 (19.2%) |
| 75 Years and over | 37 (27.0%) | 60 (36.1%) |
Disability Class: Ambulatory Difficulty
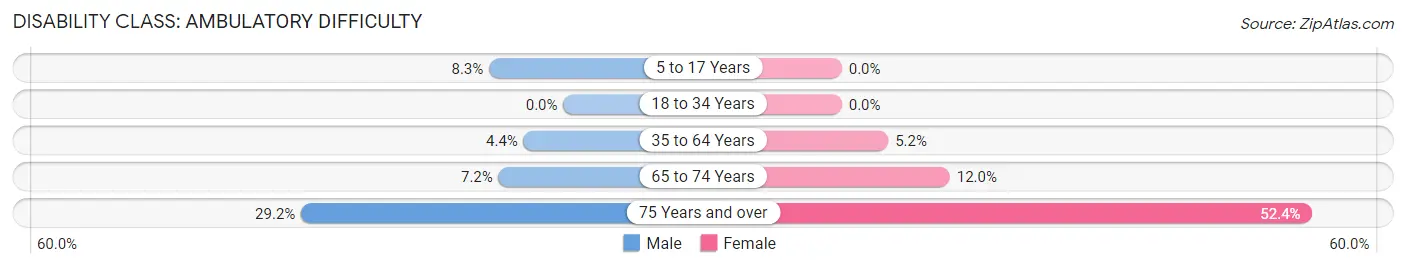
| Age Bracket | Male | Female |
| 5 to 17 Years | 56 (8.3%) | 0 (0.0%) |
| 18 to 34 Years | 0 (0.0%) | 0 (0.0%) |
| 35 to 64 Years | 57 (4.4%) | 66 (5.2%) |
| 65 to 74 Years | 24 (7.2%) | 35 (12.0%) |
| 75 Years and over | 40 (29.2%) | 87 (52.4%) |
Disability Class: Self-Care Difficulty
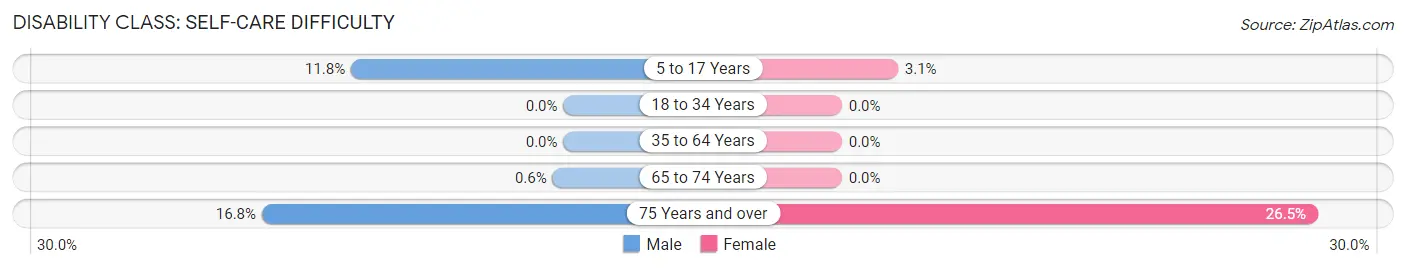
| Age Bracket | Male | Female |
| 5 to 17 Years | 80 (11.8%) | 20 (3.1%) |
| 18 to 34 Years | 0 (0.0%) | 0 (0.0%) |
| 35 to 64 Years | 0 (0.0%) | 0 (0.0%) |
| 65 to 74 Years | 2 (0.6%) | 0 (0.0%) |
| 75 Years and over | 23 (16.8%) | 44 (26.5%) |
Technology Access in Manchester
Computing Device Access in Manchester
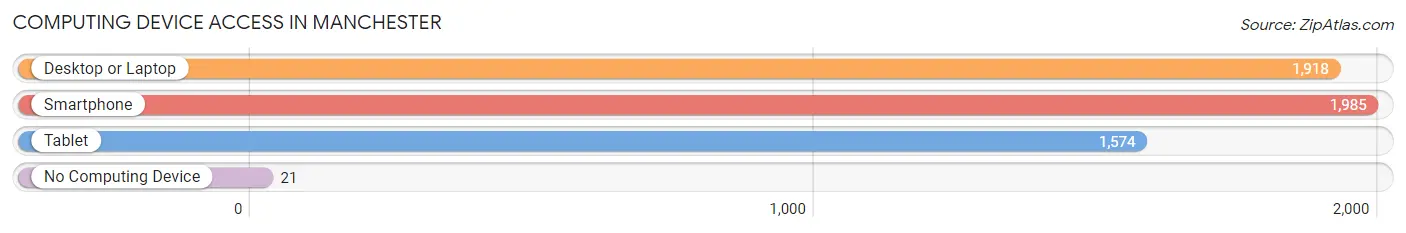
| Device Type | # Households | % Households |
| Desktop or Laptop | 1,918 | 89.2% |
| Smartphone | 1,985 | 92.3% |
| Tablet | 1,574 | 73.2% |
| No Computing Device | 21 | 1.0% |
| Total | 2,150 | 100.0% |
Internet Access in Manchester
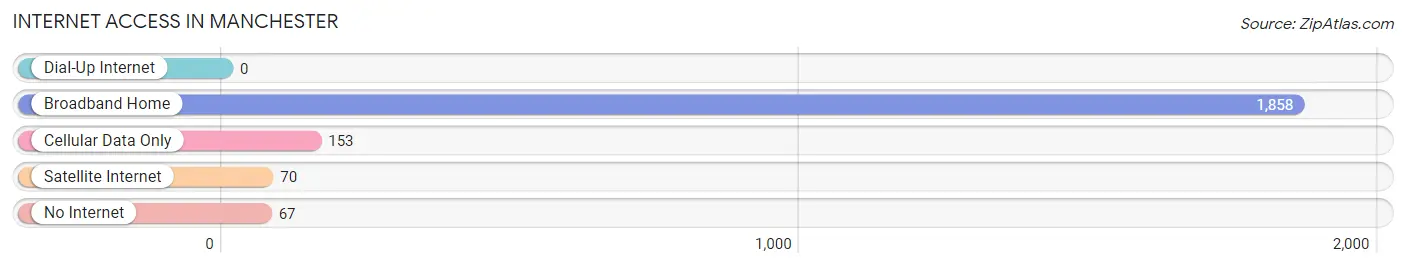
| Internet Type | # Households | % Households |
| Dial-Up Internet | 0 | 0.0% |
| Broadband Home | 1,858 | 86.4% |
| Cellular Data Only | 153 | 7.1% |
| Satellite Internet | 70 | 3.3% |
| No Internet | 67 | 3.1% |
| Total | 2,150 | 100.0% |
Manchester Summary
Manchester is a city located in the northwest of England, in the county of Greater Manchester. It is the third most populous city in the United Kingdom, with a population of 547,627 in 2019. Manchester is a major economic and cultural hub in the North West of England, and is home to two universities, the University of Manchester and Manchester Metropolitan University.
History
Manchester has a long and rich history, dating back to the Roman era. The city was founded in 79 AD by the Roman General Julius Agricola, who named it Mamucium. The name is derived from the Celtic word for ‘breast-shaped hill’, referring to the shape of the hill on which the city was built.
In the Middle Ages, Manchester was an important centre for the wool trade, and by the 16th century it had become a major market town. In the 18th century, Manchester was at the forefront of the Industrial Revolution, and it became a major centre for the cotton industry. The city was also the birthplace of the modern trade union movement, and it was here that the first trade union was formed in 1824.
In the 19th century, Manchester was transformed into a major industrial city, and it became known as ‘Cottonopolis’ due to its large number of cotton mills. The city was also the birthplace of the modern cooperative movement, and it was here that the first cooperative store was opened in 1844.
Geography
Manchester is located in the northwest of England, in the county of Greater Manchester. It is situated at the confluence of the Rivers Irwell and Mersey, and is surrounded by the Pennines to the north and east, and the Cheshire Plain to the south and west. The city is approximately 40 miles (64 km) south of Liverpool, and 50 miles (80 km) northwest of Birmingham.
The city is divided into several districts, including Ancoats, Ardwick, Beswick, Cheetham Hill, Chorlton-cum-Hardy, Didsbury, Fallowfield, Gorton, Hulme, Moss Side, Moston, Newton Heath, Old Trafford, Rusholme, Salford, and Whalley Range.
Economy
Manchester is a major economic centre in the North West of England, and is home to a number of large companies, including the BBC, ITV, and the Co-operative Group. The city is also home to two universities, the University of Manchester and Manchester Metropolitan University, which contribute significantly to the local economy.
The city is a major centre for the media, finance, and professional services industries, and is home to a number of large companies, including the BBC, ITV, and the Co-operative Group. The city is also home to a number of large retail and leisure companies, including the Trafford Centre, Selfridges, and the Arndale Centre.
Demographics
As of 2019, the population of Manchester was 547,627, making it the third most populous city in the United Kingdom. The city has a diverse population, with the largest ethnic group being White British (58.3%), followed by Asian (17.2%), Black (7.7%), and Mixed (7.2%).
The city has a large student population, with over 100,000 students enrolled at the two universities in the city. The city also has a large immigrant population, with over 20% of the population born outside of the UK.
Manchester is a major cultural centre in the North West of England, and is home to a number of museums, galleries, theatres, and music venues. The city is also home to a number of major sporting teams, including Manchester United, Manchester City, and Lancashire County Cricket Club.
Common Questions
What is the Total Population of Manchester?
Total Population of Manchester is 6,033.
What is the Total Male Population of Manchester?
Total Male Population of Manchester is 3,094.
What is the Total Female Population of Manchester?
Total Female Population of Manchester is 2,939.
What is the Ratio of Males per 100 Females in Manchester?
There are 105.27 Males per 100 Females in Manchester.
What is the Ratio of Females per 100 Males in Manchester?
There are 94.99 Females per 100 Males in Manchester.
What is the Median Population Age in Manchester?
Median Population Age in Manchester is 39.4 Years.
What is the Average Family Size in Manchester
Average Family Size in Manchester is 3.0 People.
What is the Average Household Size in Manchester
Average Household Size in Manchester is 2.8 People.
What is Per Capita Income in Manchester?
Per Capita income in Manchester is $41,685.
What is the Median Family Income in Manchester?
Median Family Income in Manchester is $99,286.
What is the Median Household income in Manchester?
Median Household Income in Manchester is $99,933.
What is Income or Wage Gap in Manchester?
Income or Wage Gap in Manchester is 33.1%.
Women in Manchester earn 66.9 cents for every dollar earned by a man.
What is Inequality or Gini Index in Manchester?
Inequality or Gini Index in Manchester is 0.37.
How Large is the Labor Force in Manchester?
There are 3,001 People in the Labor Forcein in Manchester.
What is the Percentage of People in the Labor Force in Manchester?
63.2% of People are in the Labor Force in Manchester.
What is the Unemployment Rate in Manchester?
Unemployment Rate in Manchester is 1.7%.