Kennewick, WA
Kennewick Map
Kennewick Overview
83,823
TOTAL POPULATION
41,413
MALE POPULATION
42,410
FEMALE POPULATION
97.65
MALES / 100 FEMALES
102.41
FEMALES / 100 MALES
35.2
MEDIAN AGE
3.2
AVG FAMILY SIZE
2.7
AVG HOUSEHOLD SIZE
$34,211
PER CAPITA INCOME
$84,811
AVG FAMILY INCOME
$70,429
AVG HOUSEHOLD INCOME
31.1%
WAGE / INCOME GAP [ % ]
68.9¢/ $1
WAGE / INCOME GAP [ $ ]
$9,433
FAMILY INCOME DEFICIT
0.43
INEQUALITY / GINI INDEX
39,398
LABOR FORCE [ PEOPLE ]
61.1%
PERCENT IN LABOR FORCE
4.5%
UNEMPLOYMENT RATE
Kennewick Area Codes
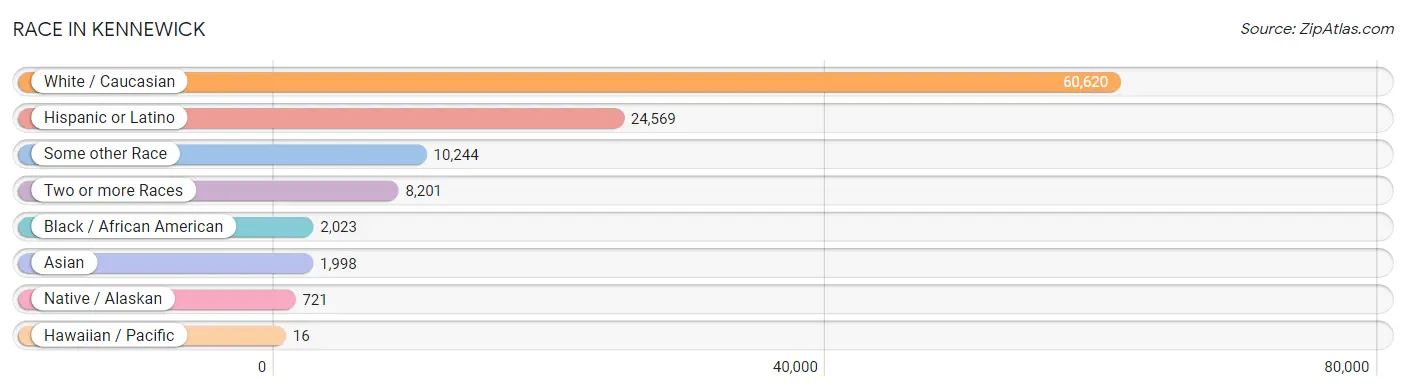
Race in Kennewick
The most populous races in Kennewick are White / Caucasian (60,620 | 72.3%), Hispanic or Latino (24,569 | 29.3%), and Some other Race (10,244 | 12.2%).
| Race | # Population | % Population |
| Asian | 1,998 | 2.4% |
| Black / African American | 2,023 | 2.4% |
| Hawaiian / Pacific | 16 | 0.0% |
| Hispanic or Latino | 24,569 | 29.3% |
| Native / Alaskan | 721 | 0.9% |
| White / Caucasian | 60,620 | 72.3% |
| Two or more Races | 8,201 | 9.8% |
| Some other Race | 10,244 | 12.2% |
| Total | 83,823 | 100.0% |
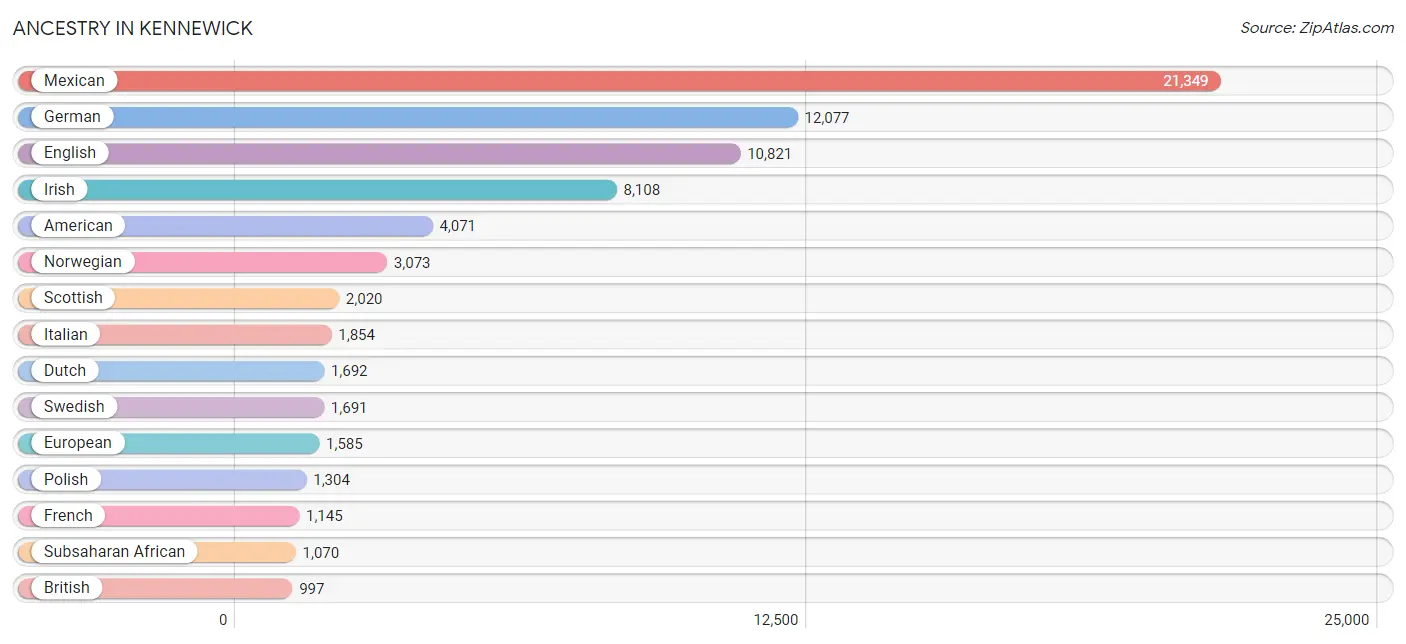
Ancestry in Kennewick
The most populous ancestries reported in Kennewick are Mexican (21,349 | 25.5%), German (12,077 | 14.4%), English (10,821 | 12.9%), Irish (8,108 | 9.7%), and American (4,071 | 4.9%), together accounting for 67.3% of all Kennewick residents.
| Ancestry | # Population | % Population |
| African | 668 | 0.8% |
| Aleut | 11 | 0.0% |
| American | 4,071 | 4.9% |
| Apache | 22 | 0.0% |
| Arab | 719 | 0.9% |
| Armenian | 170 | 0.2% |
| Australian | 119 | 0.1% |
| Austrian | 193 | 0.2% |
| Basque | 141 | 0.2% |
| Belgian | 55 | 0.1% |
| Bhutanese | 228 | 0.3% |
| Blackfeet | 193 | 0.2% |
| Brazilian | 83 | 0.1% |
| British | 997 | 1.2% |
| Burmese | 238 | 0.3% |
| Canadian | 243 | 0.3% |
| Central American | 800 | 0.9% |
| Central American Indian | 49 | 0.1% |
| Cherokee | 200 | 0.2% |
| Chickasaw | 2 | 0.0% |
| Chilean | 36 | 0.0% |
| Chippewa | 124 | 0.2% |
| Choctaw | 10 | 0.0% |
| Colombian | 268 | 0.3% |
| Colville | 87 | 0.1% |
| Cree | 15 | 0.0% |
| Creek | 13 | 0.0% |
| Croatian | 163 | 0.2% |
| Cuban | 869 | 1.0% |
| Czech | 122 | 0.2% |
| Czechoslovakian | 39 | 0.1% |
| Danish | 775 | 0.9% |
| Delaware | 13 | 0.0% |
| Dominican | 102 | 0.1% |
| Dutch | 1,692 | 2.0% |
| Dutch West Indian | 10 | 0.0% |
| Eastern European | 70 | 0.1% |
| Ecuadorian | 17 | 0.0% |
| Egyptian | 45 | 0.1% |
| English | 10,821 | 12.9% |
| Ethiopian | 154 | 0.2% |
| European | 1,585 | 1.9% |
| Finnish | 580 | 0.7% |
| French | 1,145 | 1.4% |
| French Canadian | 284 | 0.3% |
| German | 12,077 | 14.4% |
| Greek | 47 | 0.1% |
| Guatemalan | 417 | 0.5% |
| Guyanese | 45 | 0.1% |
| Honduran | 79 | 0.1% |
| Hungarian | 680 | 0.8% |
| Indian (Asian) | 540 | 0.6% |
| Indonesian | 144 | 0.2% |
| Iranian | 268 | 0.3% |
| Iraqi | 112 | 0.1% |
| Irish | 8,108 | 9.7% |
| Italian | 1,854 | 2.2% |
| Jamaican | 2 | 0.0% |
| Japanese | 91 | 0.1% |
| Korean | 676 | 0.8% |
| Latvian | 71 | 0.1% |
| Lebanese | 211 | 0.3% |
| Malaysian | 82 | 0.1% |
| Mexican | 21,349 | 25.5% |
| Mexican American Indian | 117 | 0.1% |
| Native Hawaiian | 113 | 0.1% |
| Navajo | 35 | 0.0% |
| Nicaraguan | 105 | 0.1% |
| Northern European | 269 | 0.3% |
| Norwegian | 3,073 | 3.7% |
| Pakistani | 30 | 0.0% |
| Palestinian | 69 | 0.1% |
| Pennsylvania German | 35 | 0.0% |
| Peruvian | 126 | 0.2% |
| Polish | 1,304 | 1.6% |
| Portuguese | 94 | 0.1% |
| Puerto Rican | 243 | 0.3% |
| Puget Sound Salish | 42 | 0.1% |
| Romanian | 297 | 0.4% |
| Russian | 534 | 0.6% |
| Salvadoran | 199 | 0.2% |
| Samoan | 112 | 0.1% |
| Scandinavian | 600 | 0.7% |
| Scotch-Irish | 965 | 1.1% |
| Scottish | 2,020 | 2.4% |
| Serbian | 10 | 0.0% |
| Shoshone | 6 | 0.0% |
| Sioux | 14 | 0.0% |
| Slavic | 22 | 0.0% |
| Slovak | 9 | 0.0% |
| South American | 477 | 0.6% |
| Spaniard | 251 | 0.3% |
| Spanish | 32 | 0.0% |
| Sri Lankan | 561 | 0.7% |
| Subsaharan African | 1,070 | 1.3% |
| Sudanese | 267 | 0.3% |
| Swedish | 1,691 | 2.0% |
| Swiss | 181 | 0.2% |
| Syrian | 68 | 0.1% |
| Thai | 361 | 0.4% |
| Tlingit-Haida | 138 | 0.2% |
| Tsimshian | 25 | 0.0% |
| Ukrainian | 302 | 0.4% |
| Venezuelan | 30 | 0.0% |
| Welsh | 997 | 1.2% |
| Yakama | 74 | 0.1% |
| Yugoslavian | 619 | 0.7% | View All 107 Rows |
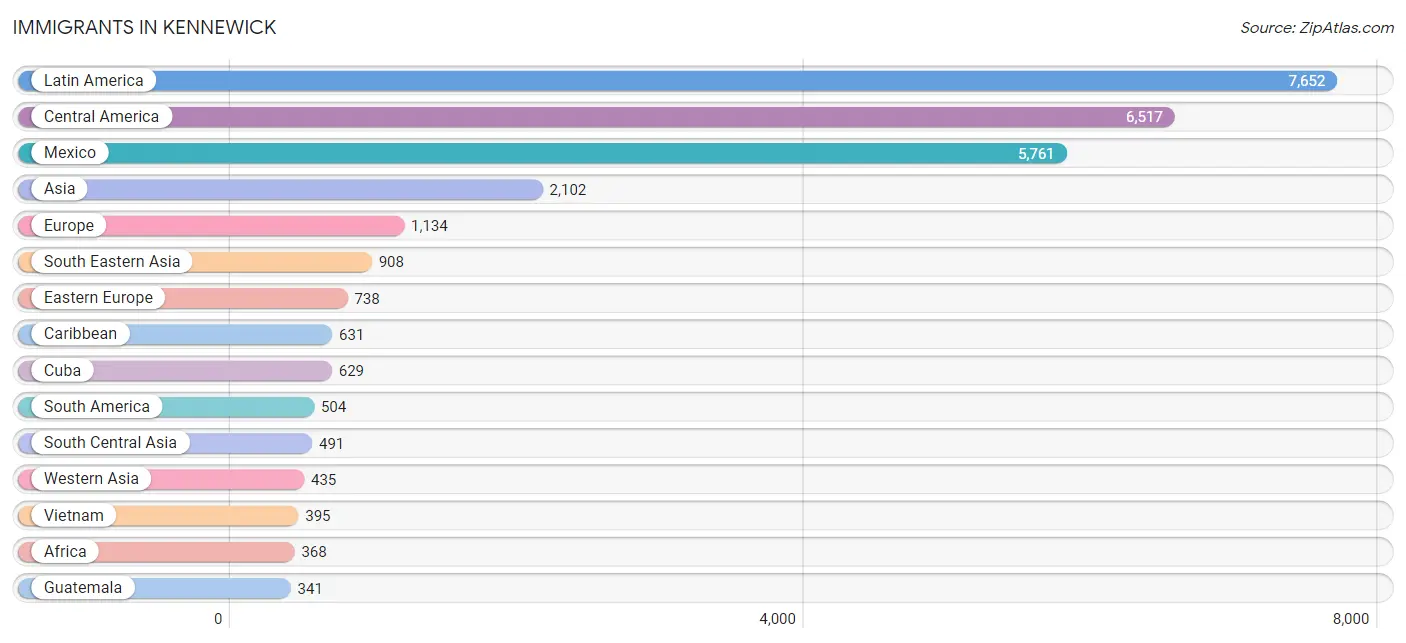
Immigrants in Kennewick
The most numerous immigrant groups reported in Kennewick came from Latin America (7,652 | 9.1%), Central America (6,517 | 7.8%), Mexico (5,761 | 6.9%), Asia (2,102 | 2.5%), and Europe (1,134 | 1.3%), together accounting for 27.6% of all Kennewick residents.
| Immigration Origin | # Population | % Population |
| Africa | 368 | 0.4% |
| Argentina | 15 | 0.0% |
| Asia | 2,102 | 2.5% |
| Australia | 43 | 0.1% |
| Belarus | 41 | 0.1% |
| Bolivia | 71 | 0.1% |
| Bosnia and Herzegovina | 329 | 0.4% |
| Brazil | 29 | 0.0% |
| Cambodia | 71 | 0.1% |
| Canada | 301 | 0.4% |
| Caribbean | 631 | 0.7% |
| Central America | 6,517 | 7.8% |
| Chile | 36 | 0.0% |
| China | 143 | 0.2% |
| Colombia | 252 | 0.3% |
| Cuba | 629 | 0.7% |
| Eastern Africa | 237 | 0.3% |
| Eastern Asia | 268 | 0.3% |
| Eastern Europe | 738 | 0.9% |
| El Salvador | 215 | 0.3% |
| England | 15 | 0.0% |
| Ethiopia | 175 | 0.2% |
| Europe | 1,134 | 1.3% |
| France | 25 | 0.0% |
| Germany | 173 | 0.2% |
| Guatemala | 341 | 0.4% |
| Guyana | 45 | 0.1% |
| Honduras | 95 | 0.1% |
| India | 88 | 0.1% |
| Iran | 159 | 0.2% |
| Iraq | 133 | 0.2% |
| Jamaica | 2 | 0.0% |
| Japan | 41 | 0.1% |
| Kazakhstan | 22 | 0.0% |
| Kenya | 28 | 0.0% |
| Korea | 84 | 0.1% |
| Kuwait | 38 | 0.1% |
| Laos | 32 | 0.0% |
| Latin America | 7,652 | 9.1% |
| Lebanon | 225 | 0.3% |
| Mexico | 5,761 | 6.9% |
| Moldova | 100 | 0.1% |
| Netherlands | 8 | 0.0% |
| Nicaragua | 105 | 0.1% |
| Northern Africa | 131 | 0.2% |
| Northern Europe | 171 | 0.2% |
| Oceania | 43 | 0.1% |
| Pakistan | 222 | 0.3% |
| Peru | 56 | 0.1% |
| Philippines | 232 | 0.3% |
| Poland | 21 | 0.0% |
| Romania | 150 | 0.2% |
| Russia | 20 | 0.0% |
| South America | 504 | 0.6% |
| South Central Asia | 491 | 0.6% |
| South Eastern Asia | 908 | 1.1% |
| Sudan | 131 | 0.2% |
| Switzerland | 19 | 0.0% |
| Syria | 28 | 0.0% |
| Thailand | 54 | 0.1% |
| Ukraine | 77 | 0.1% |
| Vietnam | 395 | 0.5% |
| Western Asia | 435 | 0.5% |
| Western Europe | 225 | 0.3% | View All 64 Rows |
Sex and Age in Kennewick
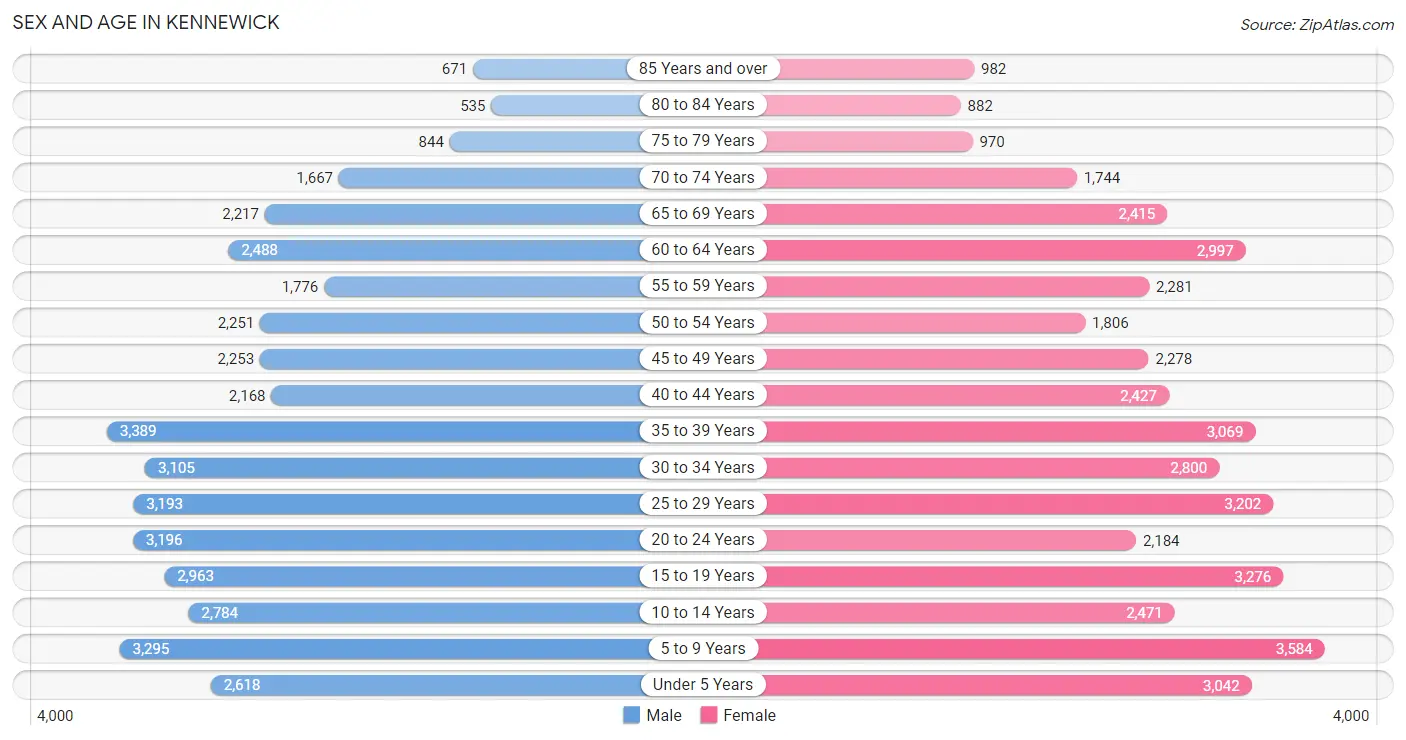
Sex and Age in Kennewick
The most populous age groups in Kennewick are 35 to 39 Years (3,389 | 8.2%) for men and 5 to 9 Years (3,584 | 8.5%) for women.
| Age Bracket | Male | Female |
| Under 5 Years | 2,618 (6.3%) | 3,042 (7.2%) |
| 5 to 9 Years | 3,295 (8.0%) | 3,584 (8.5%) |
| 10 to 14 Years | 2,784 (6.7%) | 2,471 (5.8%) |
| 15 to 19 Years | 2,963 (7.1%) | 3,276 (7.7%) |
| 20 to 24 Years | 3,196 (7.7%) | 2,184 (5.1%) |
| 25 to 29 Years | 3,193 (7.7%) | 3,202 (7.5%) |
| 30 to 34 Years | 3,105 (7.5%) | 2,800 (6.6%) |
| 35 to 39 Years | 3,389 (8.2%) | 3,069 (7.2%) |
| 40 to 44 Years | 2,168 (5.2%) | 2,427 (5.7%) |
| 45 to 49 Years | 2,253 (5.4%) | 2,278 (5.4%) |
| 50 to 54 Years | 2,251 (5.4%) | 1,806 (4.3%) |
| 55 to 59 Years | 1,776 (4.3%) | 2,281 (5.4%) |
| 60 to 64 Years | 2,488 (6.0%) | 2,997 (7.1%) |
| 65 to 69 Years | 2,217 (5.3%) | 2,415 (5.7%) |
| 70 to 74 Years | 1,667 (4.0%) | 1,744 (4.1%) |
| 75 to 79 Years | 844 (2.0%) | 970 (2.3%) |
| 80 to 84 Years | 535 (1.3%) | 882 (2.1%) |
| 85 Years and over | 671 (1.6%) | 982 (2.3%) |
| Total | 41,413 (100.0%) | 42,410 (100.0%) |
Families and Households in Kennewick
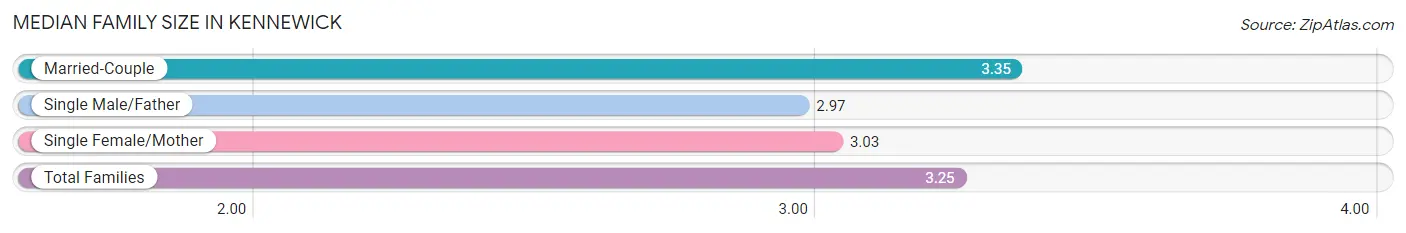
Median Family Size in Kennewick
The median family size in Kennewick is 3.25 persons per family, with married-couple families (14,737 | 70.1%) accounting for the largest median family size of 3.35 persons per family. On the other hand, single male/father families (1,806 | 8.6%) represent the smallest median family size with 2.97 persons per family.
| Family Type | # Families | Family Size |
| Married-Couple | 14,737 (70.1%) | 3.35 |
| Single Male/Father | 1,806 (8.6%) | 2.97 |
| Single Female/Mother | 4,491 (21.3%) | 3.03 |
| Total Families | 21,034 (100.0%) | 3.25 |
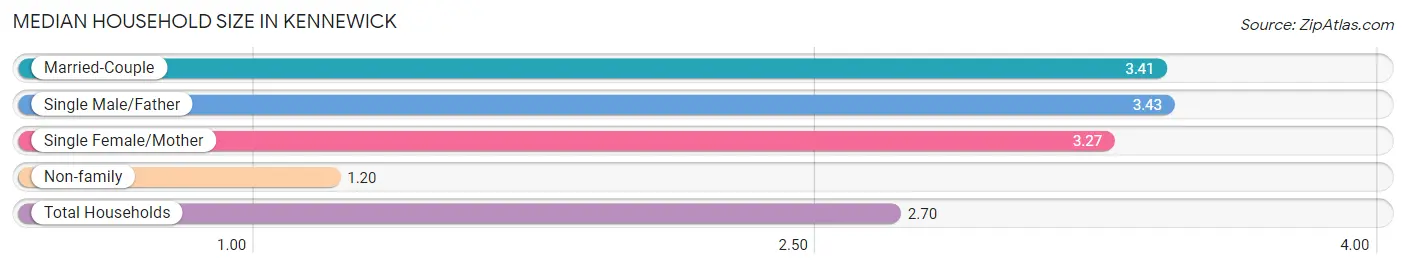
Median Household Size in Kennewick
The median household size in Kennewick is 2.70 persons per household, with single male/father households (1,806 | 5.9%) accounting for the largest median household size of 3.43 persons per household. non-family households (9,617 | 31.4%) represent the smallest median household size with 1.20 persons per household.
| Household Type | # Households | Household Size |
| Married-Couple | 14,737 (48.1%) | 3.41 |
| Single Male/Father | 1,806 (5.9%) | 3.43 |
| Single Female/Mother | 4,491 (14.6%) | 3.27 |
| Non-family | 9,617 (31.4%) | 1.20 |
| Total Households | 30,651 (100.0%) | 2.70 |
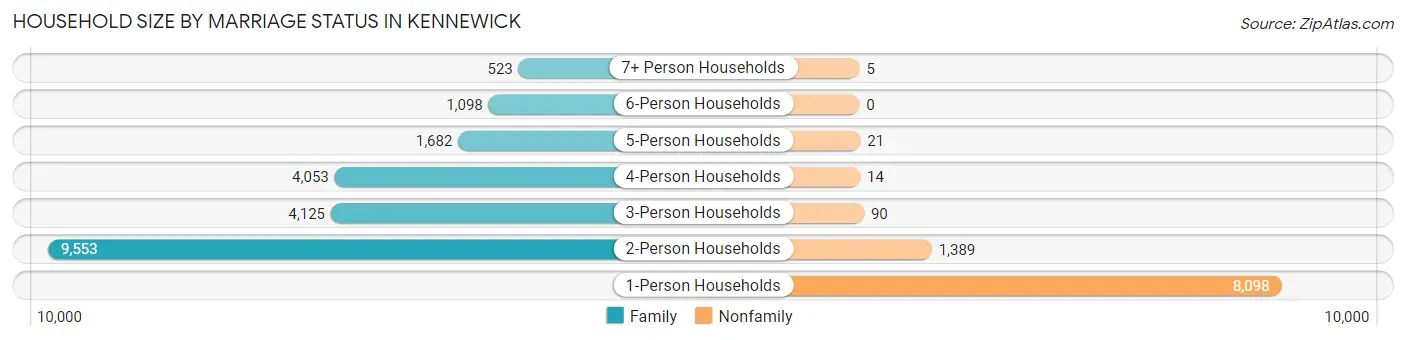
Household Size by Marriage Status in Kennewick
Out of a total of 30,651 households in Kennewick, 21,034 (68.6%) are family households, while 9,617 (31.4%) are nonfamily households. The most numerous type of family households are 2-person households, comprising 9,553, and the most common type of nonfamily households are 1-person households, comprising 8,098.
| Household Size | Family Households | Nonfamily Households |
| 1-Person Households | - | 8,098 (26.4%) |
| 2-Person Households | 9,553 (31.2%) | 1,389 (4.5%) |
| 3-Person Households | 4,125 (13.5%) | 90 (0.3%) |
| 4-Person Households | 4,053 (13.2%) | 14 (0.1%) |
| 5-Person Households | 1,682 (5.5%) | 21 (0.1%) |
| 6-Person Households | 1,098 (3.6%) | 0 (0.0%) |
| 7+ Person Households | 523 (1.7%) | 5 (0.0%) |
| Total | 21,034 (68.6%) | 9,617 (31.4%) |
Female Fertility in Kennewick
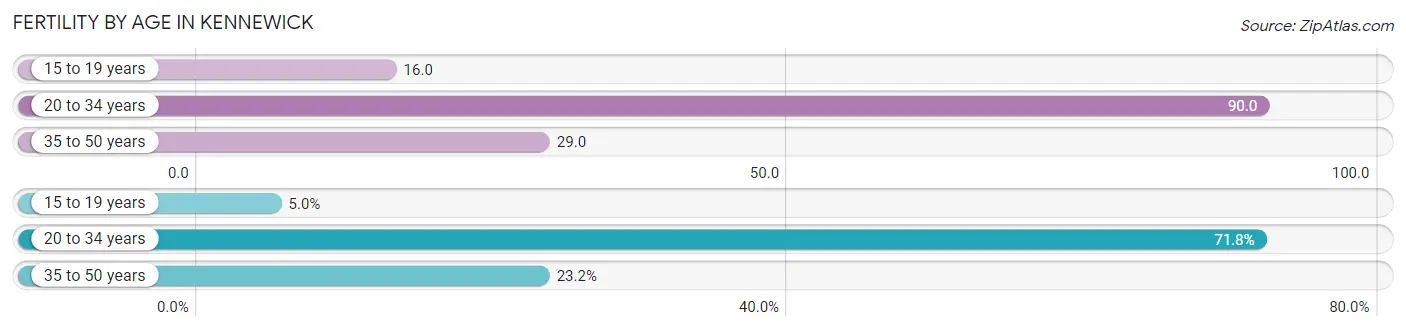
Fertility by Age in Kennewick
Average fertility rate in Kennewick is 52.0 births per 1,000 women. Women in the age bracket of 20 to 34 years have the highest fertility rate with 90.0 births per 1,000 women. Women in the age bracket of 20 to 34 years acount for 71.8% of all women with births.
| Age Bracket | Women with Births | Births / 1,000 Women |
| 15 to 19 years | 51 (5.0%) | 16.0 |
| 20 to 34 years | 734 (71.8%) | 90.0 |
| 35 to 50 years | 237 (23.2%) | 29.0 |
| Total | 1,022 (100.0%) | 52.0 |
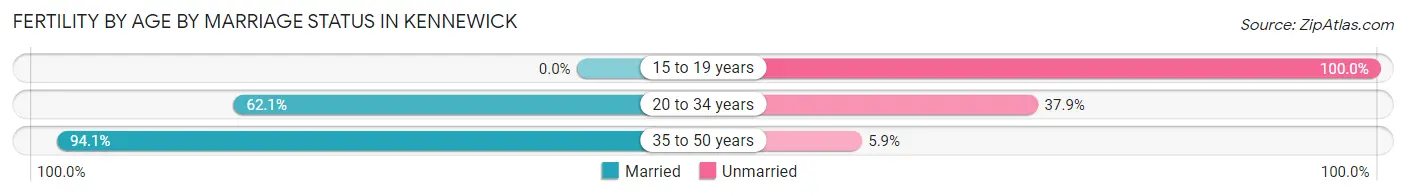
Fertility by Age by Marriage Status in Kennewick
66.4% of women with births (1,022) in Kennewick are married. The highest percentage of unmarried women with births falls into 15 to 19 years age bracket with 100.0% of them unmarried at the time of birth, while the lowest percentage of unmarried women with births belong to 35 to 50 years age bracket with 5.9% of them unmarried.
| Age Bracket | Married | Unmarried |
| 15 to 19 years | 0 (0.0%) | 51 (100.0%) |
| 20 to 34 years | 456 (62.1%) | 278 (37.9%) |
| 35 to 50 years | 223 (94.1%) | 14 (5.9%) |
| Total | 679 (66.4%) | 343 (33.6%) |
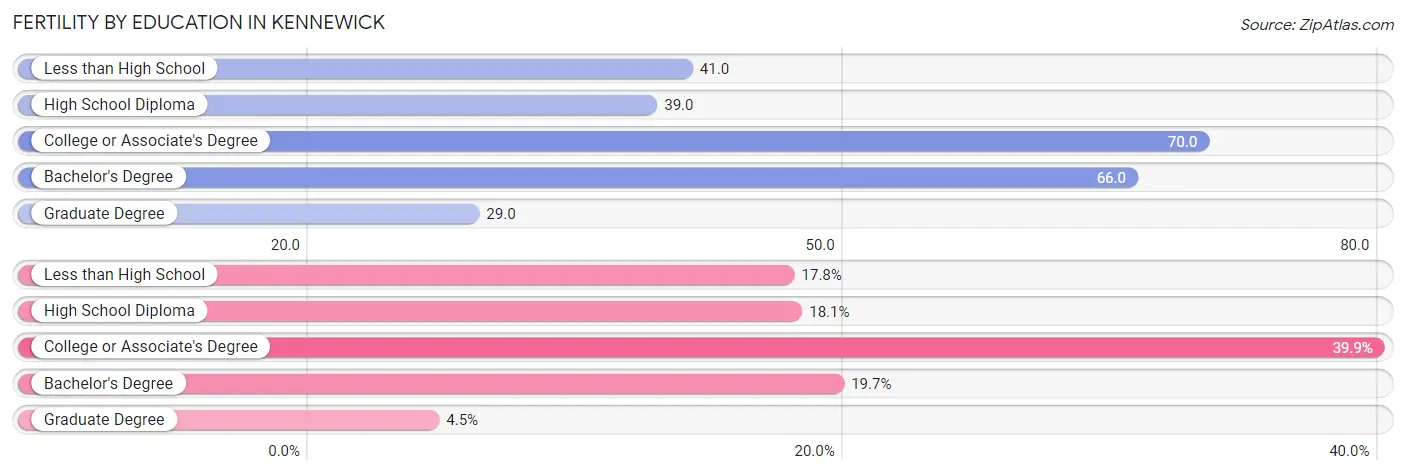
Fertility by Education in Kennewick
Average fertility rate in Kennewick is 52.0 births per 1,000 women. Women with the education attainment of college or associate's degree have the highest fertility rate of 70.0 births per 1,000 women, while women with the education attainment of graduate degree have the lowest fertility at 29.0 births per 1,000 women. Women with the education attainment of college or associate's degree represent 39.9% of all women with births.
| Educational Attainment | Women with Births | Births / 1,000 Women |
| Less than High School | 182 (17.8%) | 41.0 |
| High School Diploma | 185 (18.1%) | 39.0 |
| College or Associate's Degree | 408 (39.9%) | 70.0 |
| Bachelor's Degree | 201 (19.7%) | 66.0 |
| Graduate Degree | 46 (4.5%) | 29.0 |
| Total | 1,022 (100.0%) | 52.0 |
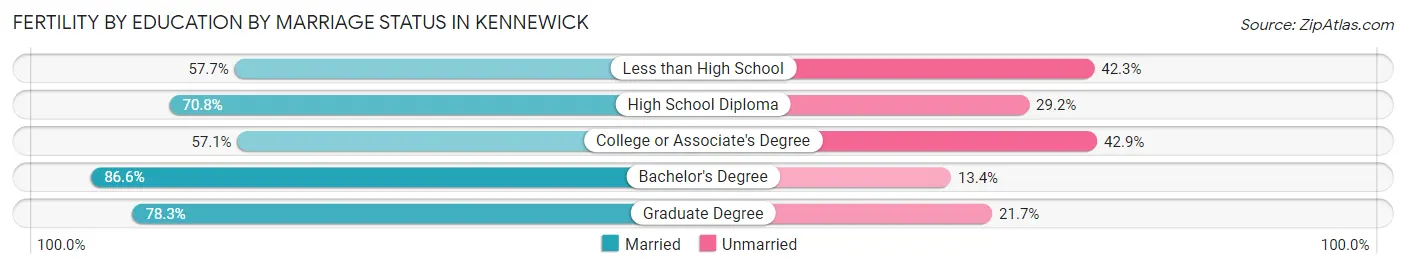
Fertility by Education by Marriage Status in Kennewick
33.6% of women with births in Kennewick are unmarried. Women with the educational attainment of bachelor's degree are most likely to be married with 86.6% of them married at childbirth, while women with the educational attainment of college or associate's degree are least likely to be married with 42.9% of them unmarried at childbirth.
| Educational Attainment | Married | Unmarried |
| Less than High School | 105 (57.7%) | 77 (42.3%) |
| High School Diploma | 131 (70.8%) | 54 (29.2%) |
| College or Associate's Degree | 233 (57.1%) | 175 (42.9%) |
| Bachelor's Degree | 174 (86.6%) | 27 (13.4%) |
| Graduate Degree | 36 (78.3%) | 10 (21.7%) |
| Total | 679 (66.4%) | 343 (33.6%) |
Income in Kennewick
Income Overview in Kennewick
Per Capita Income in Kennewick is $34,211, while median incomes of families and households are $84,811 and $70,429 respectively.
| Characteristic | Number | Measure |
| Per Capita Income | 83,823 | $34,211 |
| Median Family Income | 21,034 | $84,811 |
| Mean Family Income | 21,034 | $105,002 |
| Median Household Income | 30,651 | $70,429 |
| Mean Household Income | 30,651 | $90,836 |
| Income Deficit | 21,034 | $9,433 |
| Wage / Income Gap (%) | 83,823 | 31.09% |
| Wage / Income Gap ($) | 83,823 | 68.91¢ per $1 |
| Gini / Inequality Index | 83,823 | 0.43 |
Earnings by Sex in Kennewick
Average Earnings in Kennewick are $40,796, $48,139 for men and $33,173 for women, a difference of 31.1%.
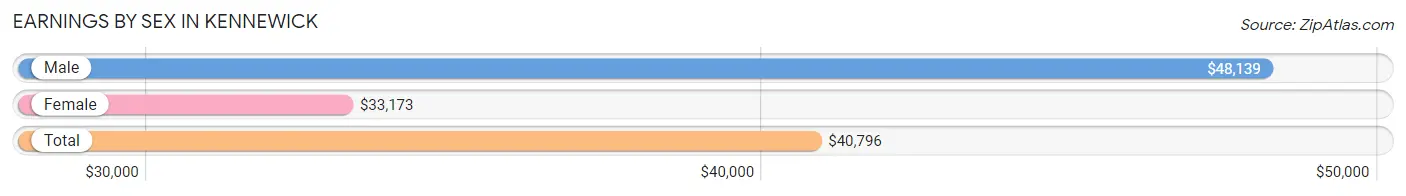
| Sex | Number | Average Earnings |
| Male | 22,689 (55.0%) | $48,139 |
| Female | 18,533 (45.0%) | $33,173 |
| Total | 41,222 (100.0%) | $40,796 |
Earnings by Sex by Income Bracket in Kennewick
The most common earnings brackets in Kennewick are $100,000+ for men (3,745 | 16.5%) and $25,000 to $29,999 for women (1,871 | 10.1%).
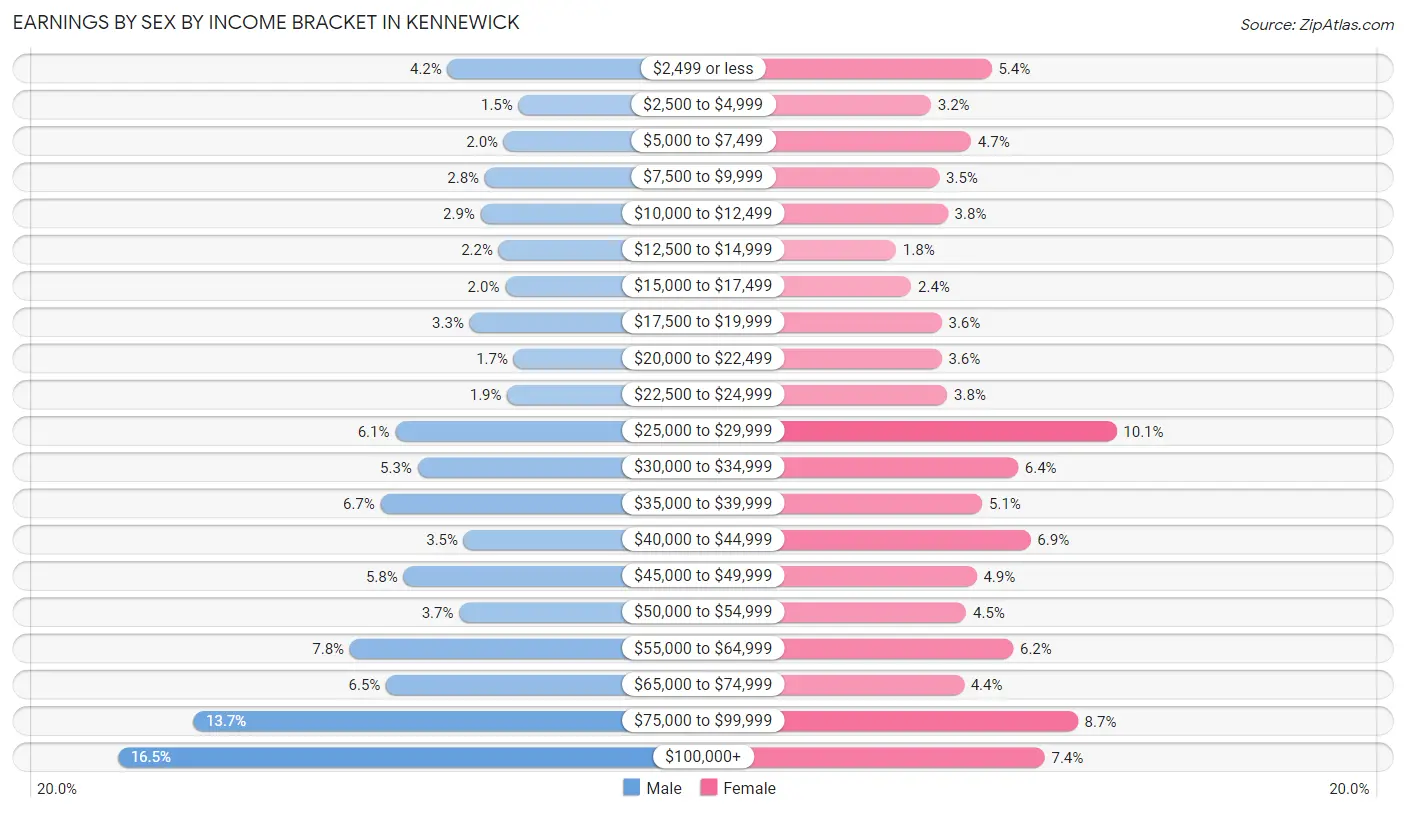
| Income | Male | Female |
| $2,499 or less | 942 (4.2%) | 1,004 (5.4%) |
| $2,500 to $4,999 | 337 (1.5%) | 583 (3.2%) |
| $5,000 to $7,499 | 462 (2.0%) | 861 (4.6%) |
| $7,500 to $9,999 | 625 (2.8%) | 641 (3.5%) |
| $10,000 to $12,499 | 661 (2.9%) | 700 (3.8%) |
| $12,500 to $14,999 | 505 (2.2%) | 341 (1.8%) |
| $15,000 to $17,499 | 451 (2.0%) | 446 (2.4%) |
| $17,500 to $19,999 | 753 (3.3%) | 657 (3.5%) |
| $20,000 to $22,499 | 378 (1.7%) | 657 (3.5%) |
| $22,500 to $24,999 | 434 (1.9%) | 696 (3.8%) |
| $25,000 to $29,999 | 1,387 (6.1%) | 1,871 (10.1%) |
| $30,000 to $34,999 | 1,195 (5.3%) | 1,188 (6.4%) |
| $35,000 to $39,999 | 1,512 (6.7%) | 940 (5.1%) |
| $40,000 to $44,999 | 803 (3.5%) | 1,275 (6.9%) |
| $45,000 to $49,999 | 1,317 (5.8%) | 901 (4.9%) |
| $50,000 to $54,999 | 841 (3.7%) | 828 (4.5%) |
| $55,000 to $64,999 | 1,771 (7.8%) | 1,155 (6.2%) |
| $65,000 to $74,999 | 1,464 (6.5%) | 811 (4.4%) |
| $75,000 to $99,999 | 3,106 (13.7%) | 1,604 (8.6%) |
| $100,000+ | 3,745 (16.5%) | 1,374 (7.4%) |
| Total | 22,689 (100.0%) | 18,533 (100.0%) |
Earnings by Sex by Educational Attainment in Kennewick
Average earnings in Kennewick are $57,078 for men and $39,951 for women, a difference of 30.0%. Men with an educational attainment of graduate degree enjoy the highest average annual earnings of $102,473, while those with less than high school education earn the least with $33,661. Women with an educational attainment of graduate degree earn the most with the average annual earnings of $76,641, while those with less than high school education have the smallest earnings of $28,321.
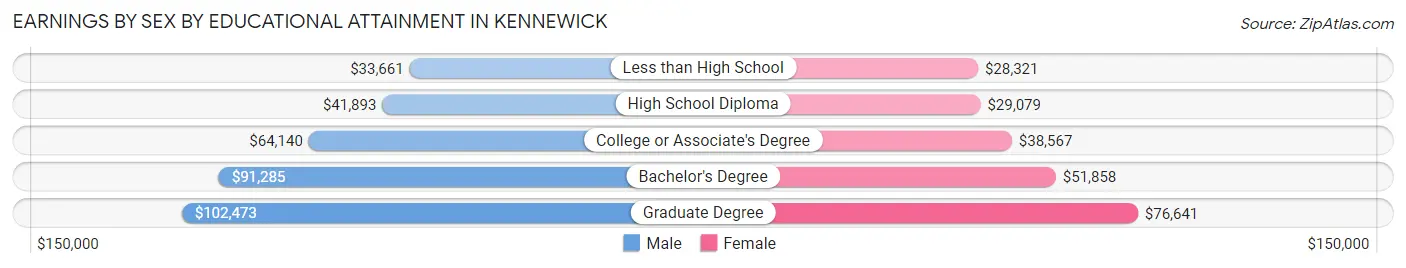
| Educational Attainment | Male Income | Female Income |
| Less than High School | $33,661 | $28,321 |
| High School Diploma | $41,893 | $29,079 |
| College or Associate's Degree | $64,140 | $38,567 |
| Bachelor's Degree | $91,285 | $51,858 |
| Graduate Degree | $102,473 | $76,641 |
| Total | $57,078 | $39,951 |
Family Income in Kennewick
Family Income Brackets in Kennewick
According to the Kennewick family income data, there are 3,660 families falling into the $100,000 to $149,999 income range, which is the most common income bracket and makes up 17.4% of all families. Conversely, the $10,000 to $14,999 income bracket is the least frequent group with only 526 families (2.5%) belonging to this category.
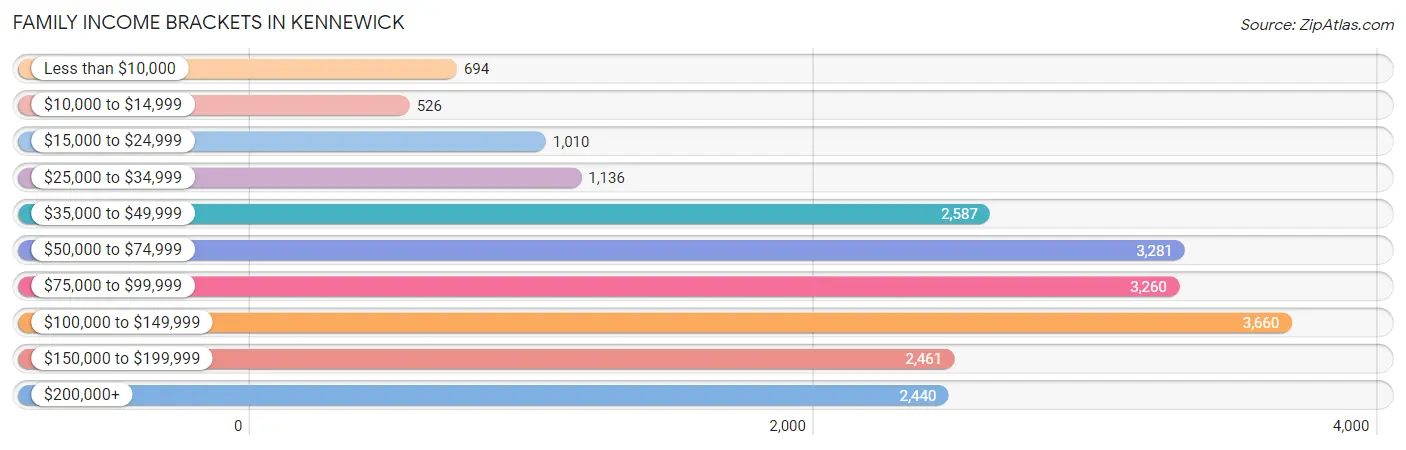
| Income Bracket | # Families | % Families |
| Less than $10,000 | 694 | 3.3% |
| $10,000 to $14,999 | 526 | 2.5% |
| $15,000 to $24,999 | 1,010 | 4.8% |
| $25,000 to $34,999 | 1,136 | 5.4% |
| $35,000 to $49,999 | 2,587 | 12.3% |
| $50,000 to $74,999 | 3,281 | 15.6% |
| $75,000 to $99,999 | 3,260 | 15.5% |
| $100,000 to $149,999 | 3,660 | 17.4% |
| $150,000 to $199,999 | 2,461 | 11.7% |
| $200,000+ | 2,440 | 11.6% |
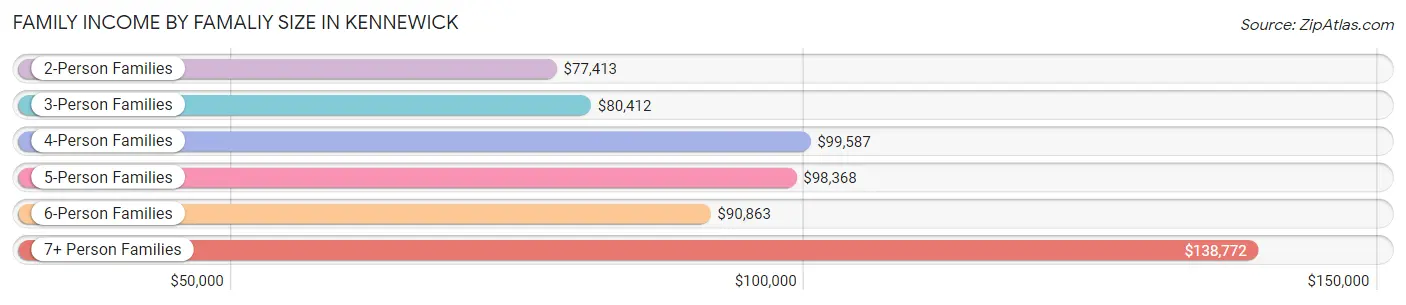
Family Income by Famaliy Size in Kennewick
7+ person families (416 | 2.0%) account for the highest median family income in Kennewick with $138,772 per family, while 2-person families (10,476 | 49.8%) have the highest median income of $38,706 per family member.
| Income Bracket | # Families | Median Income |
| 2-Person Families | 10,476 (49.8%) | $77,413 |
| 3-Person Families | 3,909 (18.6%) | $80,412 |
| 4-Person Families | 3,779 (18.0%) | $99,587 |
| 5-Person Families | 1,491 (7.1%) | $98,368 |
| 6-Person Families | 963 (4.6%) | $90,863 |
| 7+ Person Families | 416 (2.0%) | $138,772 |
| Total | 21,034 (100.0%) | $84,811 |
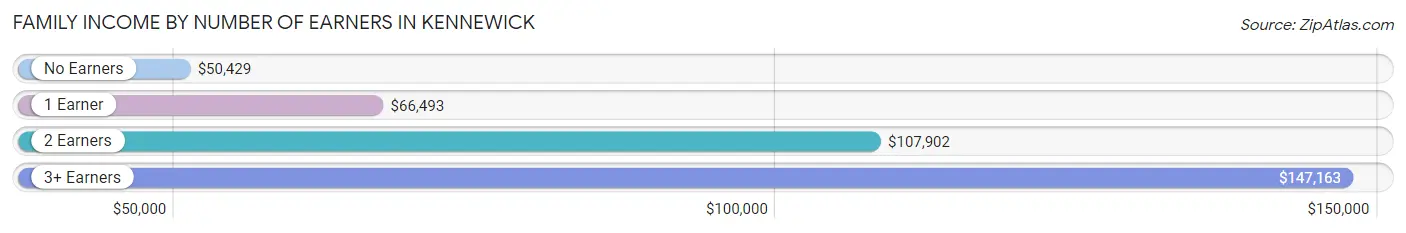
Family Income by Number of Earners in Kennewick
The median family income in Kennewick is $84,811, with families comprising 3+ earners (2,257) having the highest median family income of $147,163, while families with no earners (3,387) have the lowest median family income of $50,429, accounting for 10.7% and 16.1% of families, respectively.
| Number of Earners | # Families | Median Income |
| No Earners | 3,387 (16.1%) | $50,429 |
| 1 Earner | 7,697 (36.6%) | $66,493 |
| 2 Earners | 7,693 (36.6%) | $107,902 |
| 3+ Earners | 2,257 (10.7%) | $147,163 |
| Total | 21,034 (100.0%) | $84,811 |
Household Income in Kennewick
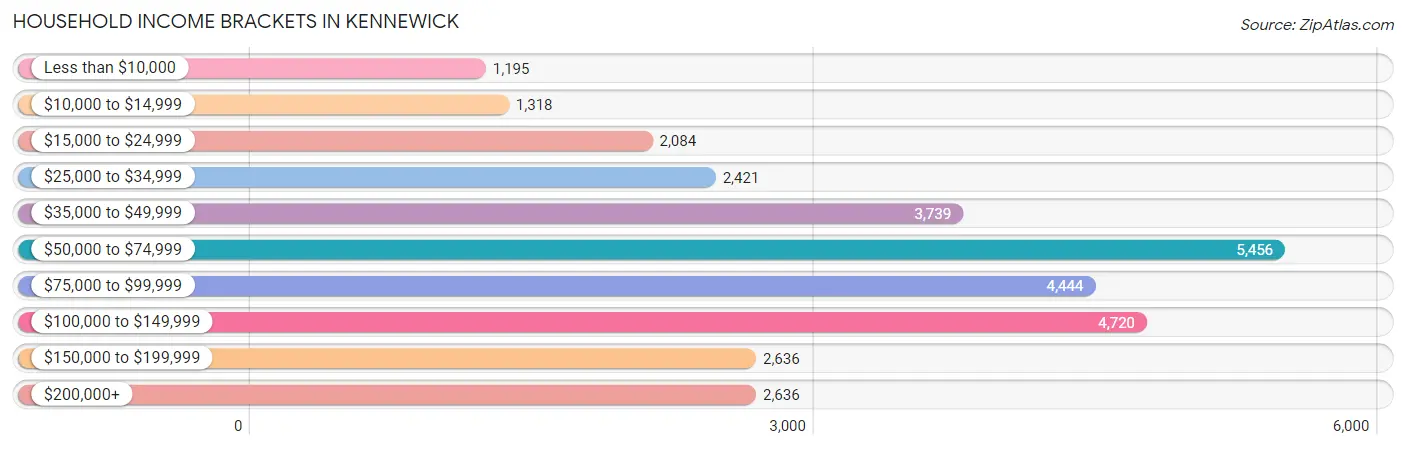
Household Income Brackets in Kennewick
With 5,456 households falling in the category, the $50,000 to $74,999 income range is the most frequent in Kennewick, accounting for 17.8% of all households. In contrast, only 1,195 households (3.9%) fall into the less than $10,000 income bracket, making it the least populous group.
| Income Bracket | # Households | % Households |
| Less than $10,000 | 1,195 | 3.9% |
| $10,000 to $14,999 | 1,318 | 4.3% |
| $15,000 to $24,999 | 2,084 | 6.8% |
| $25,000 to $34,999 | 2,421 | 7.9% |
| $35,000 to $49,999 | 3,739 | 12.2% |
| $50,000 to $74,999 | 5,456 | 17.8% |
| $75,000 to $99,999 | 4,444 | 14.5% |
| $100,000 to $149,999 | 4,720 | 15.4% |
| $150,000 to $199,999 | 2,636 | 8.6% |
| $200,000+ | 2,636 | 8.6% |
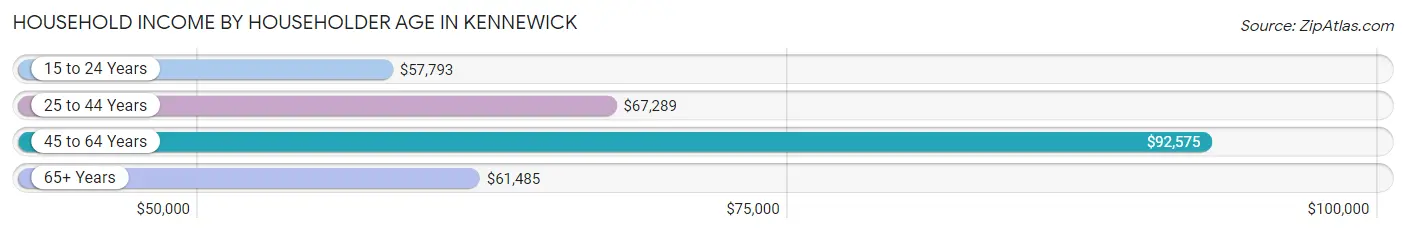
Household Income by Householder Age in Kennewick
The median household income in Kennewick is $70,429, with the highest median household income of $92,575 found in the 45 to 64 years age bracket for the primary householder. A total of 10,412 households (34.0%) fall into this category. Meanwhile, the 15 to 24 years age bracket for the primary householder has the lowest median household income of $57,793, with 1,273 households (4.2%) in this group.
| Income Bracket | # Households | Median Income |
| 15 to 24 Years | 1,273 (4.2%) | $57,793 |
| 25 to 44 Years | 11,064 (36.1%) | $67,289 |
| 45 to 64 Years | 10,412 (34.0%) | $92,575 |
| 65+ Years | 7,902 (25.8%) | $61,485 |
| Total | 30,651 (100.0%) | $70,429 |
Poverty in Kennewick
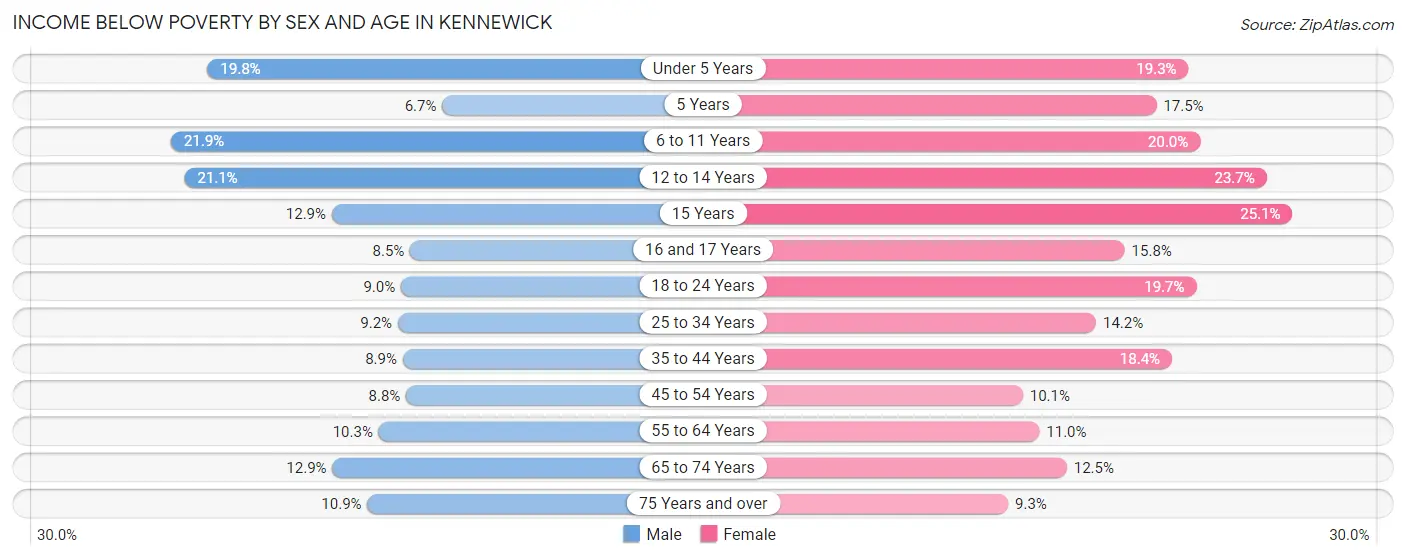
Income Below Poverty by Sex and Age in Kennewick
With 12.0% poverty level for males and 15.4% for females among the residents of Kennewick, 6 to 11 year old males and 15 year old females are the most vulnerable to poverty, with 805 males (21.8%) and 205 females (25.1%) in their respective age groups living below the poverty level.
| Age Bracket | Male | Female |
| Under 5 Years | 517 (19.8%) | 580 (19.3%) |
| 5 Years | 36 (6.7%) | 116 (17.5%) |
| 6 to 11 Years | 805 (21.8%) | 813 (20.0%) |
| 12 to 14 Years | 369 (21.1%) | 280 (23.6%) |
| 15 Years | 94 (12.9%) | 205 (25.1%) |
| 16 and 17 Years | 88 (8.5%) | 190 (15.8%) |
| 18 to 24 Years | 387 (9.0%) | 677 (19.7%) |
| 25 to 34 Years | 561 (9.2%) | 847 (14.2%) |
| 35 to 44 Years | 484 (8.9%) | 1,008 (18.4%) |
| 45 to 54 Years | 384 (8.7%) | 410 (10.1%) |
| 55 to 64 Years | 437 (10.3%) | 579 (11.0%) |
| 65 to 74 Years | 496 (12.9%) | 519 (12.5%) |
| 75 Years and over | 219 (10.9%) | 250 (9.3%) |
| Total | 4,877 (12.0%) | 6,474 (15.4%) |
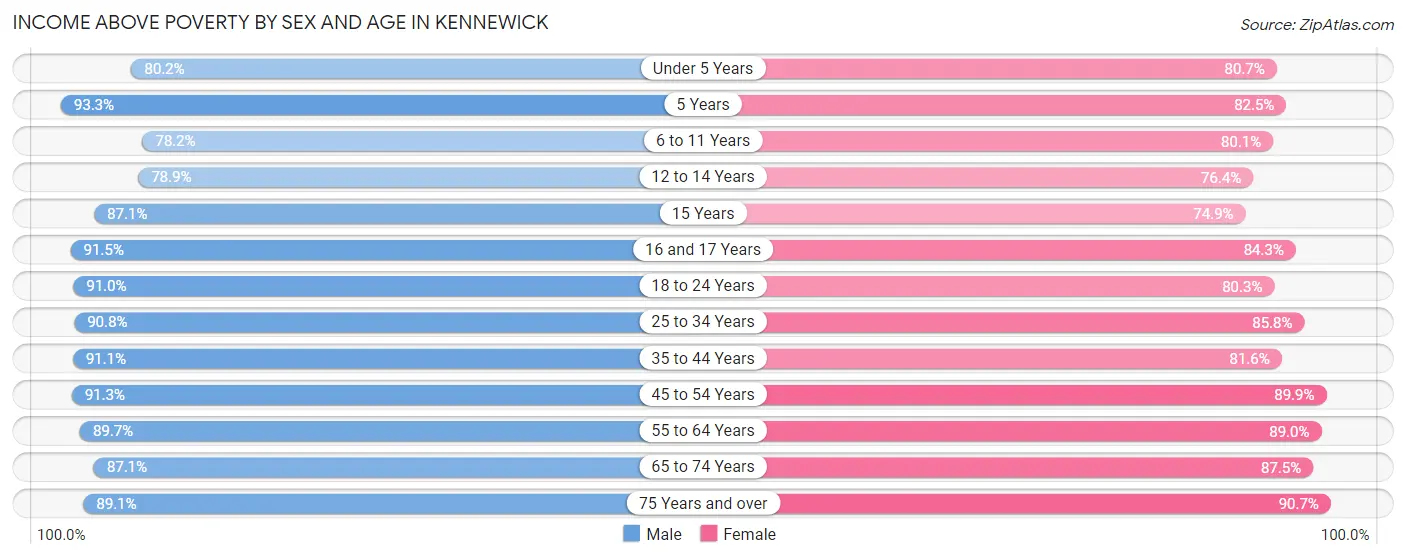
Income Above Poverty by Sex and Age in Kennewick
According to the poverty statistics in Kennewick, males aged 5 years and females aged 75 years and over are the age groups that are most secure financially, with 93.3% of males and 90.7% of females in these age groups living above the poverty line.
| Age Bracket | Male | Female |
| Under 5 Years | 2,092 (80.2%) | 2,425 (80.7%) |
| 5 Years | 498 (93.3%) | 546 (82.5%) |
| 6 to 11 Years | 2,880 (78.1%) | 3,263 (80.0%) |
| 12 to 14 Years | 1,380 (78.9%) | 904 (76.3%) |
| 15 Years | 635 (87.1%) | 612 (74.9%) |
| 16 and 17 Years | 944 (91.5%) | 1,016 (84.3%) |
| 18 to 24 Years | 3,895 (91.0%) | 2,752 (80.3%) |
| 25 to 34 Years | 5,527 (90.8%) | 5,134 (85.8%) |
| 35 to 44 Years | 4,931 (91.1%) | 4,476 (81.6%) |
| 45 to 54 Years | 4,007 (91.2%) | 3,656 (89.9%) |
| 55 to 64 Years | 3,816 (89.7%) | 4,685 (89.0%) |
| 65 to 74 Years | 3,362 (87.1%) | 3,622 (87.5%) |
| 75 Years and over | 1,789 (89.1%) | 2,449 (90.7%) |
| Total | 35,756 (88.0%) | 35,540 (84.6%) |
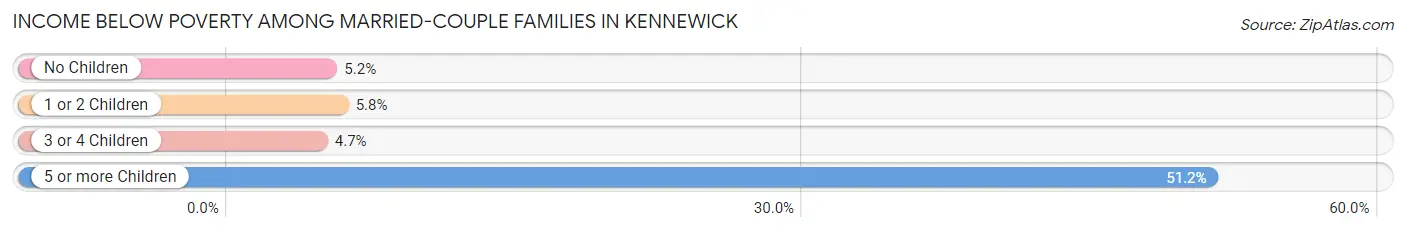
Income Below Poverty Among Married-Couple Families in Kennewick
The poverty statistics for married-couple families in Kennewick show that 5.7% or 845 of the total 14,737 families live below the poverty line. Families with 5 or more children have the highest poverty rate of 51.2%, comprising of 64 families. On the other hand, families with 3 or 4 children have the lowest poverty rate of 4.7%, which includes 54 families.
| Children | Above Poverty | Below Poverty |
| No Children | 8,155 (94.8%) | 446 (5.2%) |
| 1 or 2 Children | 4,578 (94.2%) | 281 (5.8%) |
| 3 or 4 Children | 1,098 (95.3%) | 54 (4.7%) |
| 5 or more Children | 61 (48.8%) | 64 (51.2%) |
| Total | 13,892 (94.3%) | 845 (5.7%) |
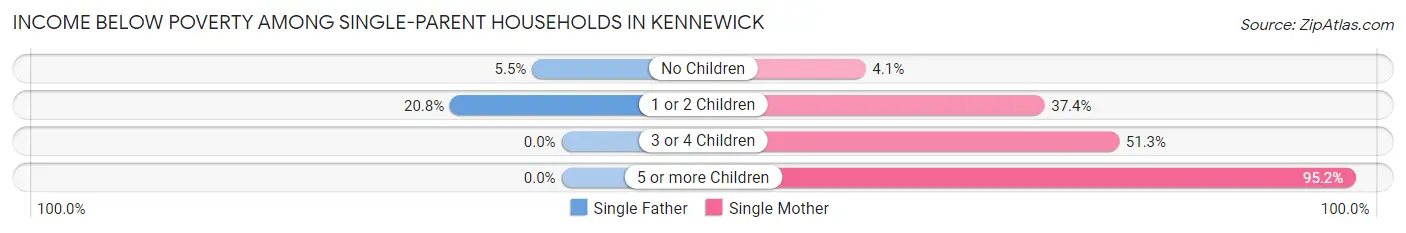
Income Below Poverty Among Single-Parent Households in Kennewick
According to the poverty data in Kennewick, 14.2% or 257 single-father households and 27.1% or 1,219 single-mother households are living below the poverty line. Among single-father households, those with 1 or 2 children have the highest poverty rate, with 224 households (20.8%) experiencing poverty. Likewise, among single-mother households, those with 5 or more children have the highest poverty rate, with 100 households (95.2%) falling below the poverty line.
| Children | Single Father | Single Mother |
| No Children | 33 (5.4%) | 70 (4.1%) |
| 1 or 2 Children | 224 (20.8%) | 845 (37.4%) |
| 3 or 4 Children | 0 (0.0%) | 204 (51.3%) |
| 5 or more Children | 0 (0.0%) | 100 (95.2%) |
| Total | 257 (14.2%) | 1,219 (27.1%) |
Income Below Poverty Among Married-Couple vs Single-Parent Households in Kennewick
The poverty data for Kennewick shows that 845 of the married-couple family households (5.7%) and 1,476 of the single-parent households (23.4%) are living below the poverty level. Within the married-couple family households, those with 5 or more children have the highest poverty rate, with 64 households (51.2%) falling below the poverty line. Among the single-parent households, those with 5 or more children have the highest poverty rate, with 100 household (76.9%) living below poverty.
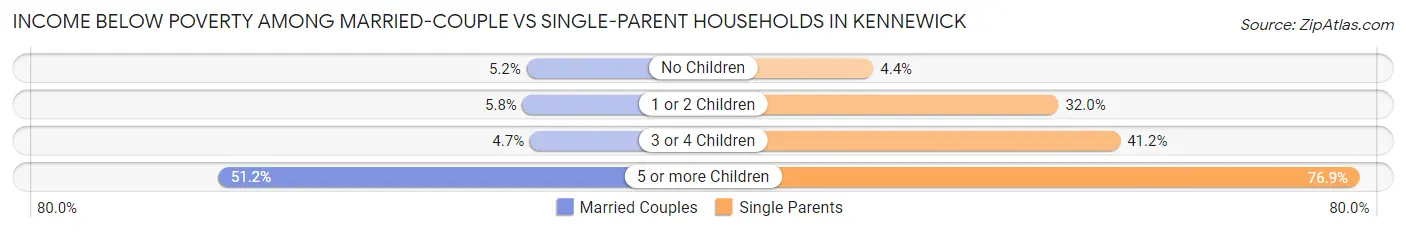
| Children | Married-Couple Families | Single-Parent Households |
| No Children | 446 (5.2%) | 103 (4.4%) |
| 1 or 2 Children | 281 (5.8%) | 1,069 (32.0%) |
| 3 or 4 Children | 54 (4.7%) | 204 (41.2%) |
| 5 or more Children | 64 (51.2%) | 100 (76.9%) |
| Total | 845 (5.7%) | 1,476 (23.4%) |
Employment Characteristics in Kennewick
Employment by Class of Employer in Kennewick
Among the 36,845 employed individuals in Kennewick, private company employees (24,869 | 67.5%), local government employees (2,787 | 7.6%), and not-for-profit organizations (2,612 | 7.1%) make up the most common classes of employment.
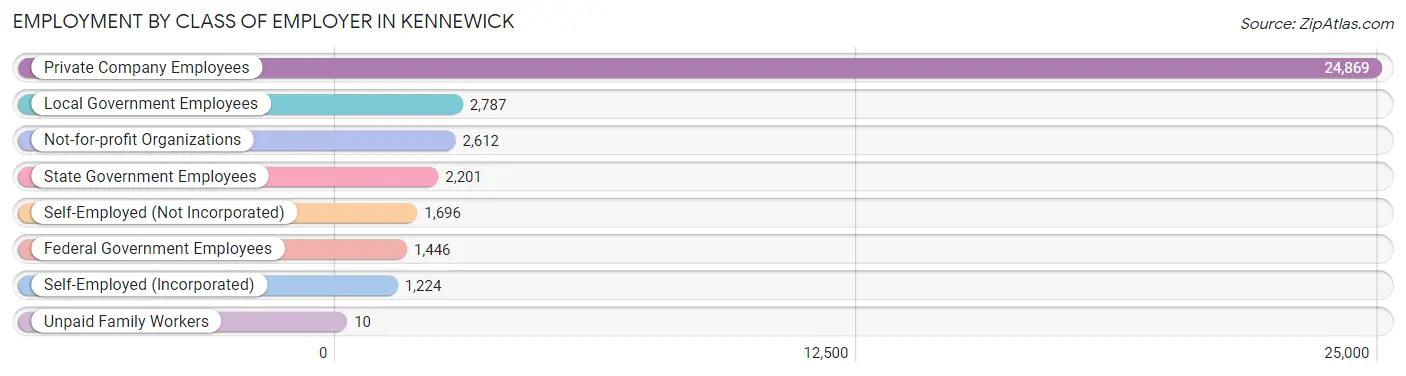
| Employer Class | # Employees | % Employees |
| Private Company Employees | 24,869 | 67.5% |
| Self-Employed (Incorporated) | 1,224 | 3.3% |
| Self-Employed (Not Incorporated) | 1,696 | 4.6% |
| Not-for-profit Organizations | 2,612 | 7.1% |
| Local Government Employees | 2,787 | 7.6% |
| State Government Employees | 2,201 | 6.0% |
| Federal Government Employees | 1,446 | 3.9% |
| Unpaid Family Workers | 10 | 0.0% |
| Total | 36,845 | 100.0% |
Employment Status by Age in Kennewick
According to the labor force statistics for Kennewick, out of the total population over 16 years of age (64,481), 61.1% or 39,398 individuals are in the labor force, with 4.5% or 1,773 of them unemployed. The age group with the highest labor force participation rate is 20 to 24 years, with 81.8% or 4,401 individuals in the labor force. Within the labor force, the 16 to 19 years age range has the highest percentage of unemployed individuals, with 8.4% or 191 of them being unemployed.
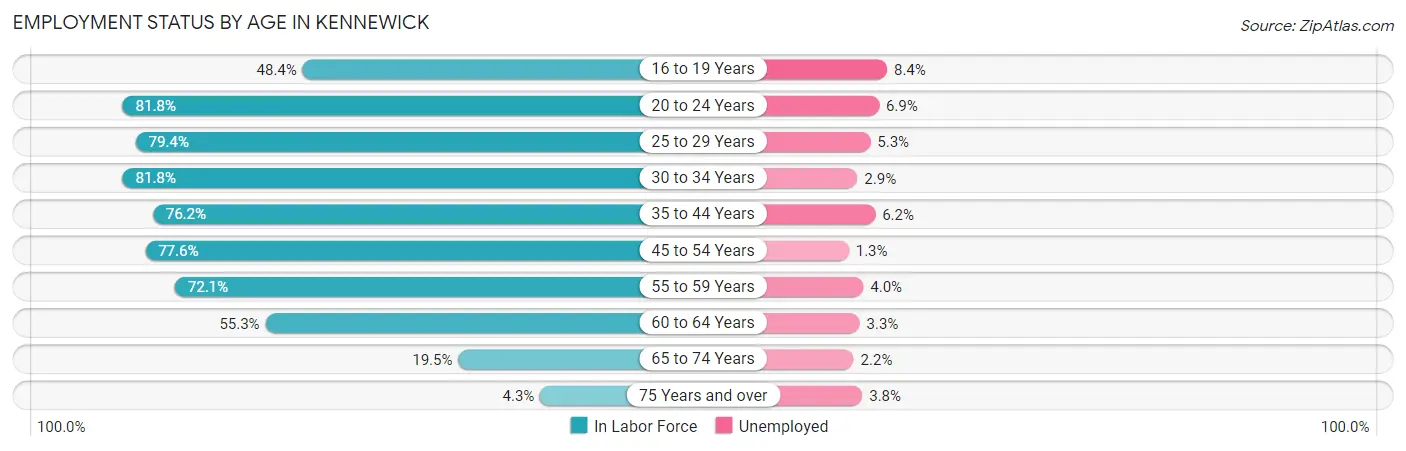
| Age Bracket | In Labor Force | Unemployed |
| 16 to 19 Years | 2,270 (48.4%) | 191 (8.4%) |
| 20 to 24 Years | 4,401 (81.8%) | 304 (6.9%) |
| 25 to 29 Years | 5,078 (79.4%) | 269 (5.3%) |
| 30 to 34 Years | 4,830 (81.8%) | 140 (2.9%) |
| 35 to 44 Years | 8,422 (76.2%) | 522 (6.2%) |
| 45 to 54 Years | 6,664 (77.6%) | 87 (1.3%) |
| 55 to 59 Years | 2,925 (72.1%) | 117 (4.0%) |
| 60 to 64 Years | 3,033 (55.3%) | 100 (3.3%) |
| 65 to 74 Years | 1,568 (19.5%) | 34 (2.2%) |
| 75 Years and over | 210 (4.3%) | 8 (3.8%) |
| Total | 39,398 (61.1%) | 1,773 (4.5%) |
Employment Status by Educational Attainment in Kennewick
According to labor force statistics for Kennewick, 74.6% of individuals (30,946) out of the total population between 25 and 64 years of age (41,483) are in the labor force, with 4.0% or 1,238 of them being unemployed. The group with the highest labor force participation rate are those with the educational attainment of bachelor's degree or higher, with 87.1% or 9,649 individuals in the labor force. Within the labor force, individuals with less than high school education have the highest percentage of unemployment, with 8.8% or 271 of them being unemployed.
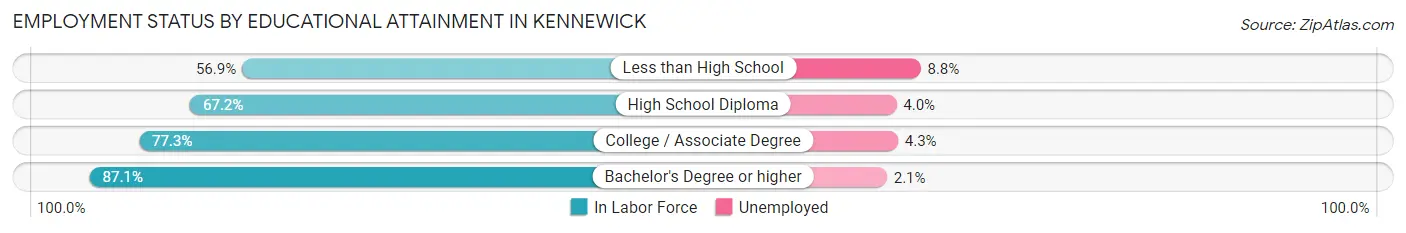
| Educational Attainment | In Labor Force | Unemployed |
| Less than High School | 3,075 (56.9%) | 476 (8.8%) |
| High School Diploma | 7,291 (67.2%) | 434 (4.0%) |
| College / Associate Degree | 10,938 (77.3%) | 608 (4.3%) |
| Bachelor's Degree or higher | 9,649 (87.1%) | 233 (2.1%) |
| Total | 30,946 (74.6%) | 1,659 (4.0%) |
Employment Occupations by Sex in Kennewick
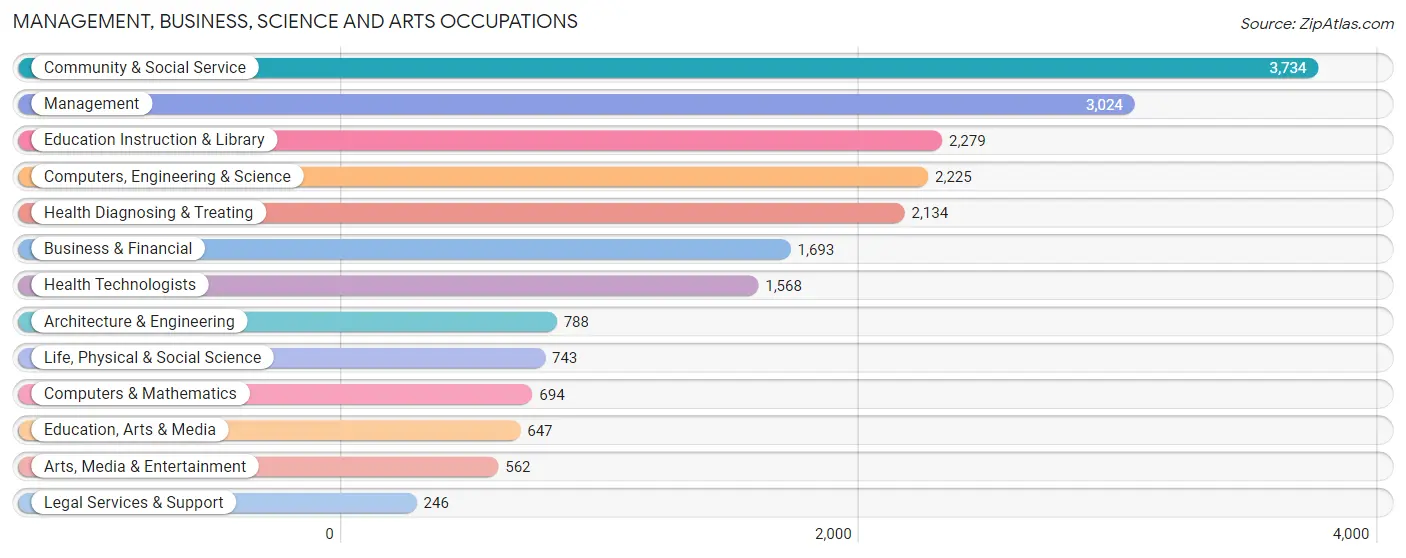
Management, Business, Science and Arts Occupations
The most common Management, Business, Science and Arts occupations in Kennewick are Community & Social Service (3,734 | 9.9%), Management (3,024 | 8.1%), Education Instruction & Library (2,279 | 6.1%), Computers, Engineering & Science (2,225 | 5.9%), and Health Diagnosing & Treating (2,134 | 5.7%).
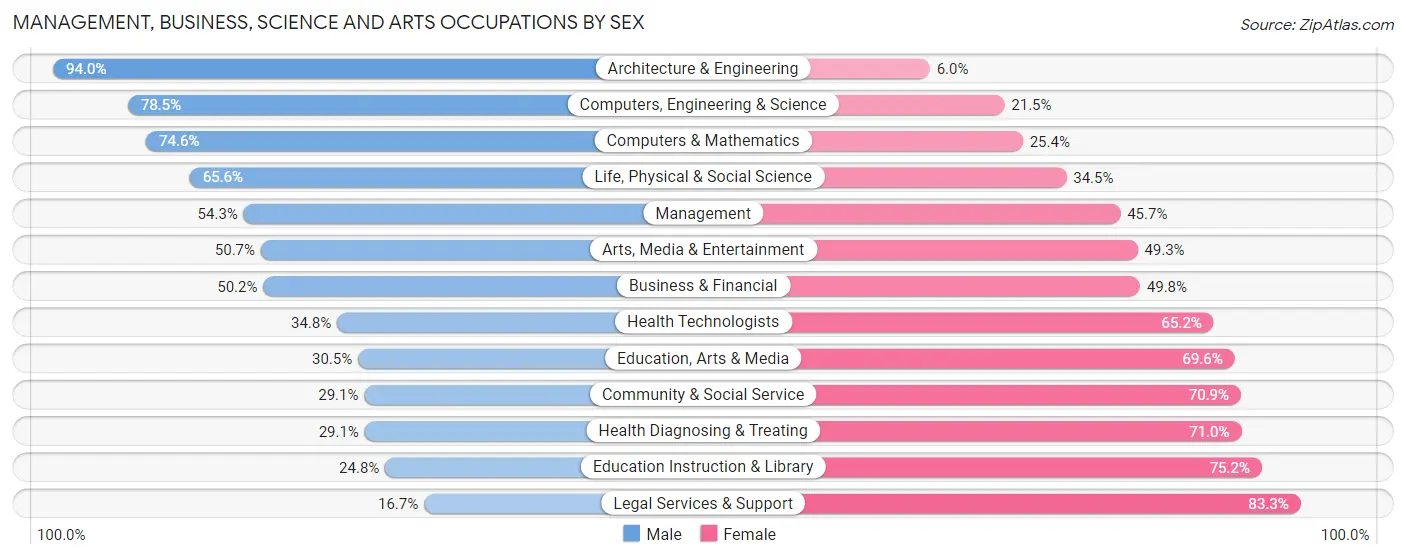
Management, Business, Science and Arts Occupations by Sex
Within the Management, Business, Science and Arts occupations in Kennewick, the most male-oriented occupations are Architecture & Engineering (94.0%), Computers, Engineering & Science (78.5%), and Computers & Mathematics (74.6%), while the most female-oriented occupations are Legal Services & Support (83.3%), Education Instruction & Library (75.2%), and Health Diagnosing & Treating (71.0%).
| Occupation | Male | Female |
| Management | 1,642 (54.3%) | 1,382 (45.7%) |
| Business & Financial | 850 (50.2%) | 843 (49.8%) |
| Computers, Engineering & Science | 1,746 (78.5%) | 479 (21.5%) |
| Computers & Mathematics | 518 (74.6%) | 176 (25.4%) |
| Architecture & Engineering | 741 (94.0%) | 47 (6.0%) |
| Life, Physical & Social Science | 487 (65.5%) | 256 (34.4%) |
| Community & Social Service | 1,088 (29.1%) | 2,646 (70.9%) |
| Education, Arts & Media | 197 (30.4%) | 450 (69.6%) |
| Legal Services & Support | 41 (16.7%) | 205 (83.3%) |
| Education Instruction & Library | 565 (24.8%) | 1,714 (75.2%) |
| Arts, Media & Entertainment | 285 (50.7%) | 277 (49.3%) |
| Health Diagnosing & Treating | 620 (29.0%) | 1,514 (71.0%) |
| Health Technologists | 546 (34.8%) | 1,022 (65.2%) |
| Total (Category) | 5,946 (46.4%) | 6,864 (53.6%) |
| Total (Overall) | 20,668 (55.0%) | 16,904 (45.0%) |
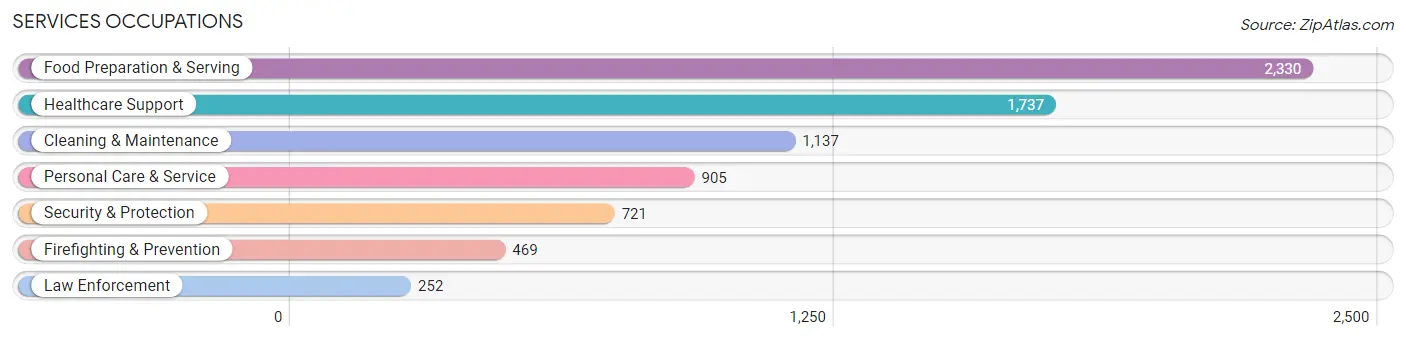
Services Occupations
The most common Services occupations in Kennewick are Food Preparation & Serving (2,330 | 6.2%), Healthcare Support (1,737 | 4.6%), Cleaning & Maintenance (1,137 | 3.0%), Personal Care & Service (905 | 2.4%), and Security & Protection (721 | 1.9%).
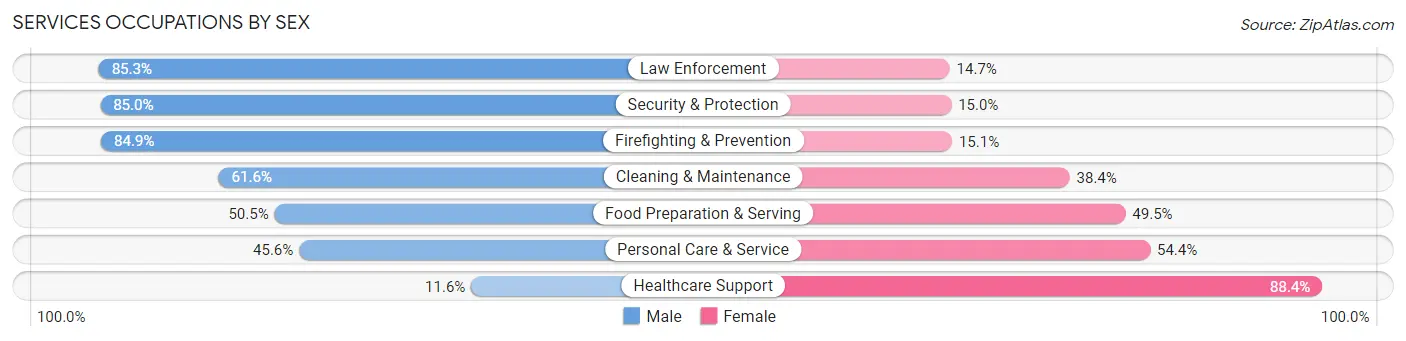
Services Occupations by Sex
Within the Services occupations in Kennewick, the most male-oriented occupations are Law Enforcement (85.3%), Security & Protection (85.0%), and Firefighting & Prevention (84.9%), while the most female-oriented occupations are Healthcare Support (88.4%), Personal Care & Service (54.4%), and Food Preparation & Serving (49.5%).
| Occupation | Male | Female |
| Healthcare Support | 201 (11.6%) | 1,536 (88.4%) |
| Security & Protection | 613 (85.0%) | 108 (15.0%) |
| Firefighting & Prevention | 398 (84.9%) | 71 (15.1%) |
| Law Enforcement | 215 (85.3%) | 37 (14.7%) |
| Food Preparation & Serving | 1,177 (50.5%) | 1,153 (49.5%) |
| Cleaning & Maintenance | 700 (61.6%) | 437 (38.4%) |
| Personal Care & Service | 413 (45.6%) | 492 (54.4%) |
| Total (Category) | 3,104 (45.5%) | 3,726 (54.5%) |
| Total (Overall) | 20,668 (55.0%) | 16,904 (45.0%) |
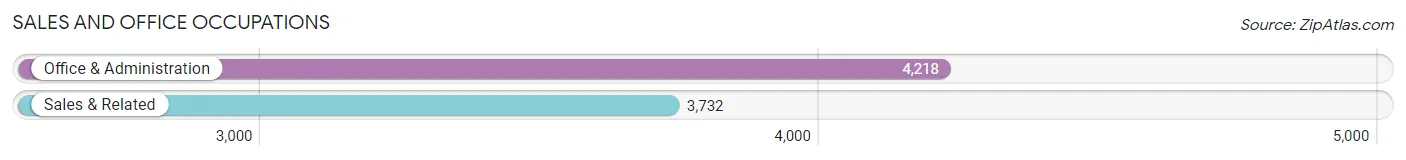
Sales and Office Occupations
The most common Sales and Office occupations in Kennewick are Office & Administration (4,218 | 11.2%), and Sales & Related (3,732 | 9.9%).
Sales and Office Occupations by Sex
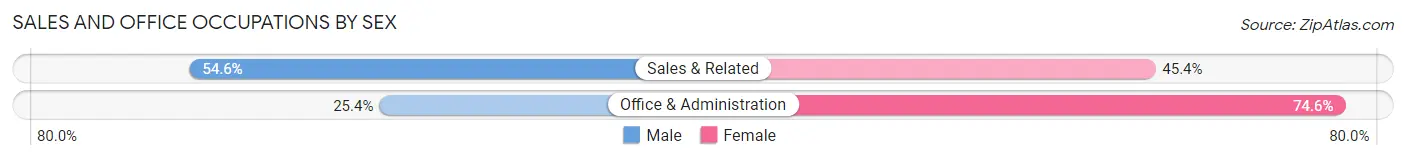
| Occupation | Male | Female |
| Sales & Related | 2,039 (54.6%) | 1,693 (45.4%) |
| Office & Administration | 1,073 (25.4%) | 3,145 (74.6%) |
| Total (Category) | 3,112 (39.1%) | 4,838 (60.9%) |
| Total (Overall) | 20,668 (55.0%) | 16,904 (45.0%) |
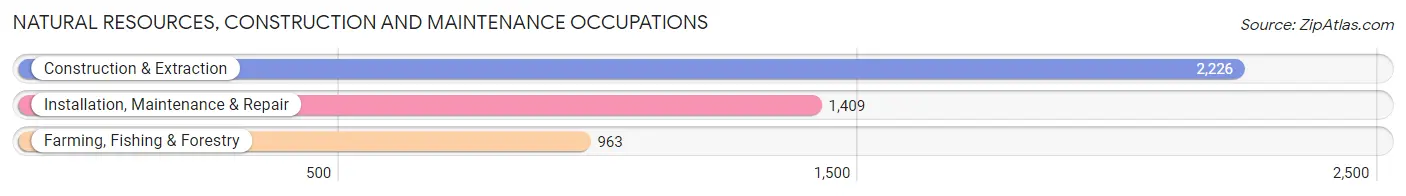
Natural Resources, Construction and Maintenance Occupations
The most common Natural Resources, Construction and Maintenance occupations in Kennewick are Construction & Extraction (2,226 | 5.9%), Installation, Maintenance & Repair (1,409 | 3.7%), and Farming, Fishing & Forestry (963 | 2.6%).
Natural Resources, Construction and Maintenance Occupations by Sex
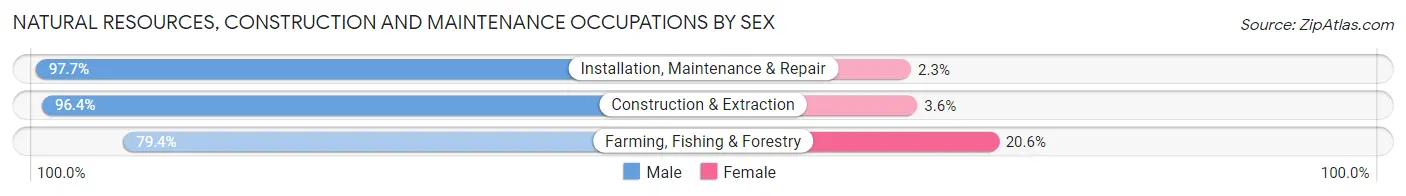
| Occupation | Male | Female |
| Farming, Fishing & Forestry | 765 (79.4%) | 198 (20.6%) |
| Construction & Extraction | 2,145 (96.4%) | 81 (3.6%) |
| Installation, Maintenance & Repair | 1,376 (97.7%) | 33 (2.3%) |
| Total (Category) | 4,286 (93.2%) | 312 (6.8%) |
| Total (Overall) | 20,668 (55.0%) | 16,904 (45.0%) |
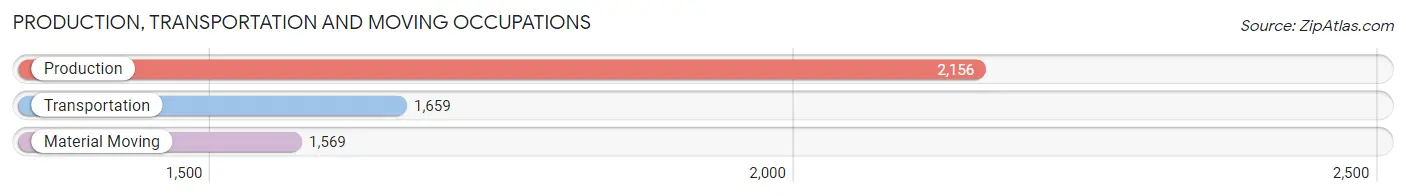
Production, Transportation and Moving Occupations
The most common Production, Transportation and Moving occupations in Kennewick are Production (2,156 | 5.7%), Transportation (1,659 | 4.4%), and Material Moving (1,569 | 4.2%).
Production, Transportation and Moving Occupations by Sex
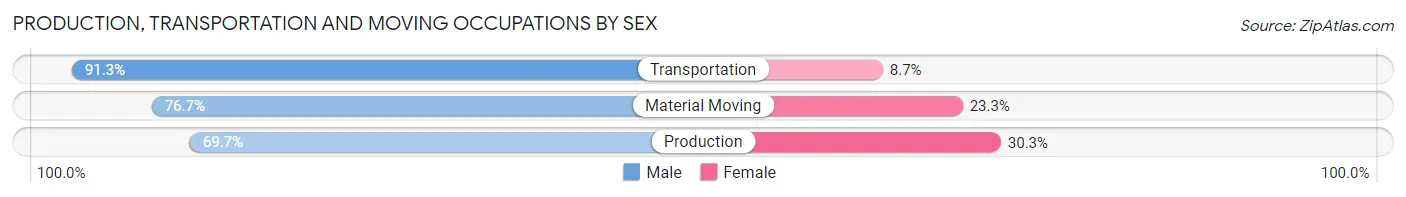
| Occupation | Male | Female |
| Production | 1,502 (69.7%) | 654 (30.3%) |
| Transportation | 1,515 (91.3%) | 144 (8.7%) |
| Material Moving | 1,203 (76.7%) | 366 (23.3%) |
| Total (Category) | 4,220 (78.4%) | 1,164 (21.6%) |
| Total (Overall) | 20,668 (55.0%) | 16,904 (45.0%) |
Employment Industries by Sex in Kennewick
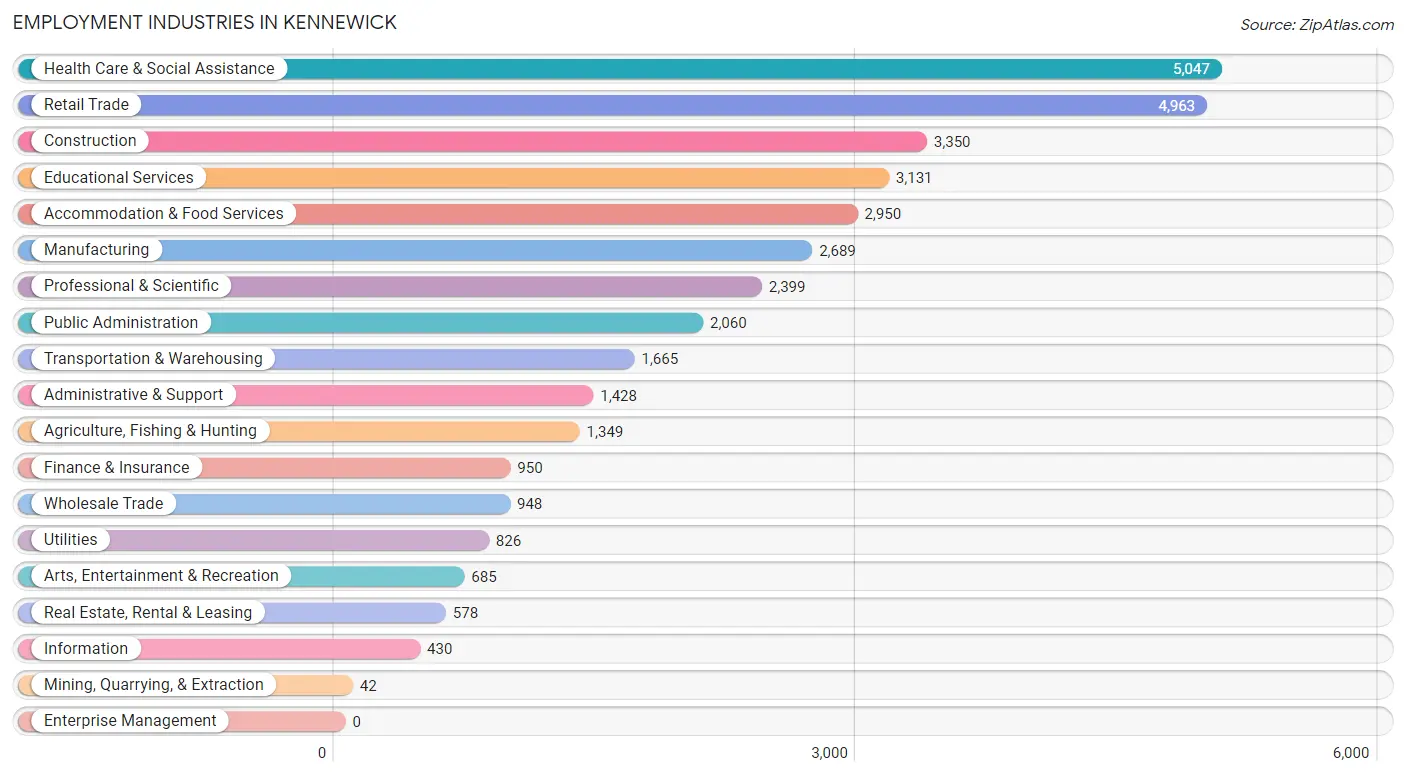
Employment Industries in Kennewick
The major employment industries in Kennewick include Health Care & Social Assistance (5,047 | 13.4%), Retail Trade (4,963 | 13.2%), Construction (3,350 | 8.9%), Educational Services (3,131 | 8.3%), and Accommodation & Food Services (2,950 | 7.9%).
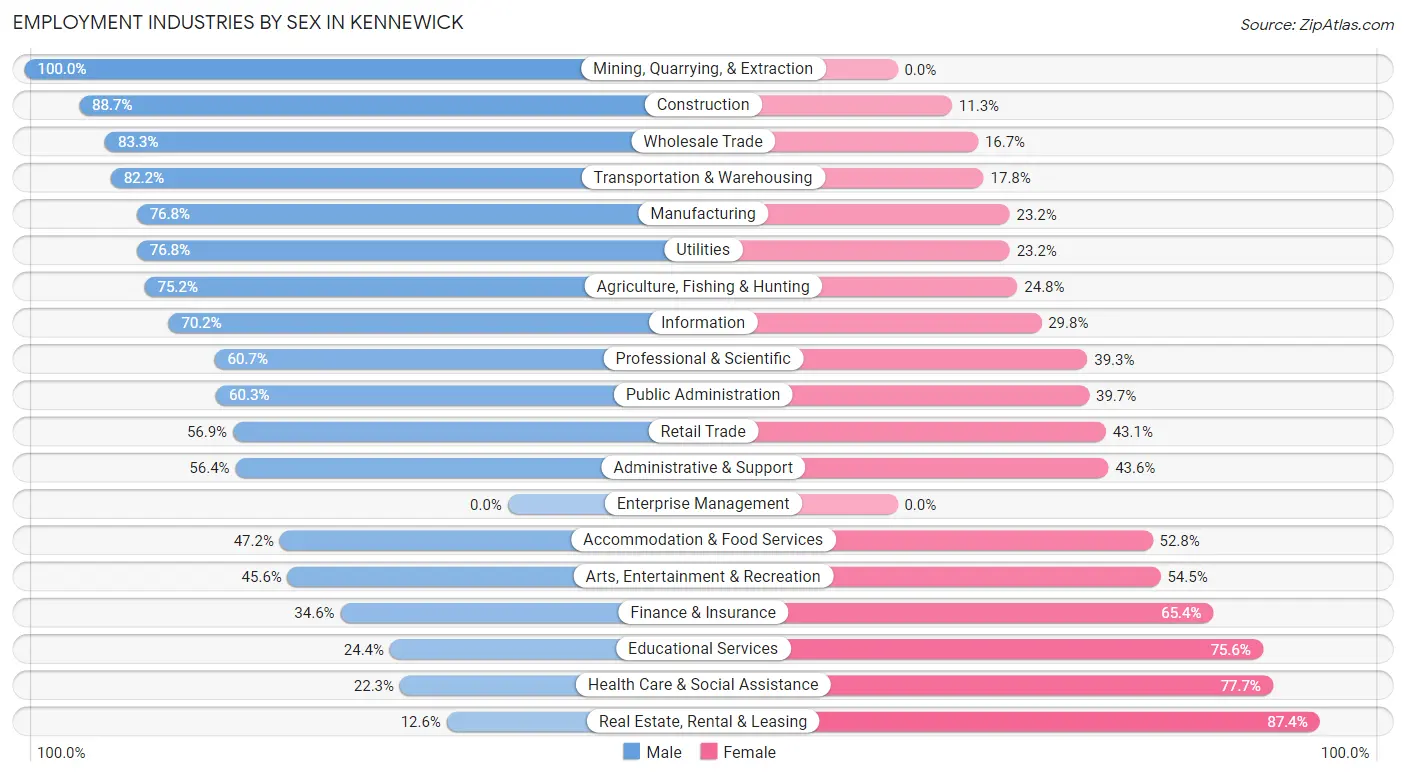
Employment Industries by Sex in Kennewick
The Kennewick industries that see more men than women are Mining, Quarrying, & Extraction (100.0%), Construction (88.7%), and Wholesale Trade (83.3%), whereas the industries that tend to have a higher number of women are Real Estate, Rental & Leasing (87.4%), Health Care & Social Assistance (77.7%), and Educational Services (75.6%).
| Industry | Male | Female |
| Agriculture, Fishing & Hunting | 1,014 (75.2%) | 335 (24.8%) |
| Mining, Quarrying, & Extraction | 42 (100.0%) | 0 (0.0%) |
| Construction | 2,972 (88.7%) | 378 (11.3%) |
| Manufacturing | 2,065 (76.8%) | 624 (23.2%) |
| Wholesale Trade | 790 (83.3%) | 158 (16.7%) |
| Retail Trade | 2,823 (56.9%) | 2,140 (43.1%) |
| Transportation & Warehousing | 1,368 (82.2%) | 297 (17.8%) |
| Utilities | 634 (76.8%) | 192 (23.2%) |
| Information | 302 (70.2%) | 128 (29.8%) |
| Finance & Insurance | 329 (34.6%) | 621 (65.4%) |
| Real Estate, Rental & Leasing | 73 (12.6%) | 505 (87.4%) |
| Professional & Scientific | 1,456 (60.7%) | 943 (39.3%) |
| Enterprise Management | 0 (0.0%) | 0 (0.0%) |
| Administrative & Support | 805 (56.4%) | 623 (43.6%) |
| Educational Services | 764 (24.4%) | 2,367 (75.6%) |
| Health Care & Social Assistance | 1,127 (22.3%) | 3,920 (77.7%) |
| Arts, Entertainment & Recreation | 312 (45.6%) | 373 (54.4%) |
| Accommodation & Food Services | 1,392 (47.2%) | 1,558 (52.8%) |
| Public Administration | 1,243 (60.3%) | 817 (39.7%) |
| Total | 20,668 (55.0%) | 16,904 (45.0%) |
Education in Kennewick
School Enrollment in Kennewick
The most common levels of schooling among the 21,244 students in Kennewick are elementary school (5,171 | 24.3%), high school (4,976 | 23.4%), and middle school (4,162 | 19.6%).
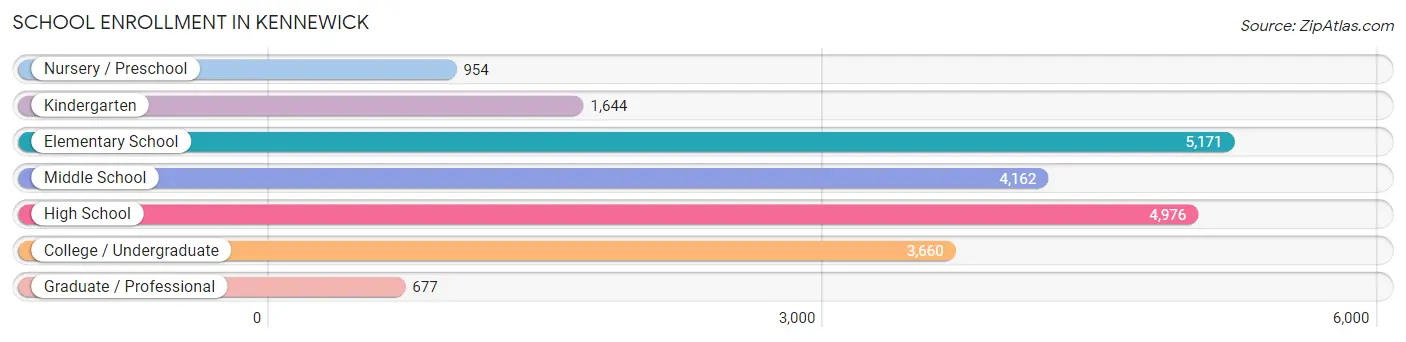
| School Level | # Students | % Students |
| Nursery / Preschool | 954 | 4.5% |
| Kindergarten | 1,644 | 7.7% |
| Elementary School | 5,171 | 24.3% |
| Middle School | 4,162 | 19.6% |
| High School | 4,976 | 23.4% |
| College / Undergraduate | 3,660 | 17.2% |
| Graduate / Professional | 677 | 3.2% |
| Total | 21,244 | 100.0% |
School Enrollment by Age by Funding Source in Kennewick
Out of a total of 21,244 students who are enrolled in schools in Kennewick, 2,528 (11.9%) attend a private institution, while the remaining 18,716 (88.1%) are enrolled in public schools. The age group of 3 to 4 year olds has the highest likelihood of being enrolled in private schools, with 345 (50.0% in the age bracket) enrolled. Conversely, the age group of 10 to 14 year olds has the lowest likelihood of being enrolled in a private school, with 4,704 (92.4% in the age bracket) attending a public institution.
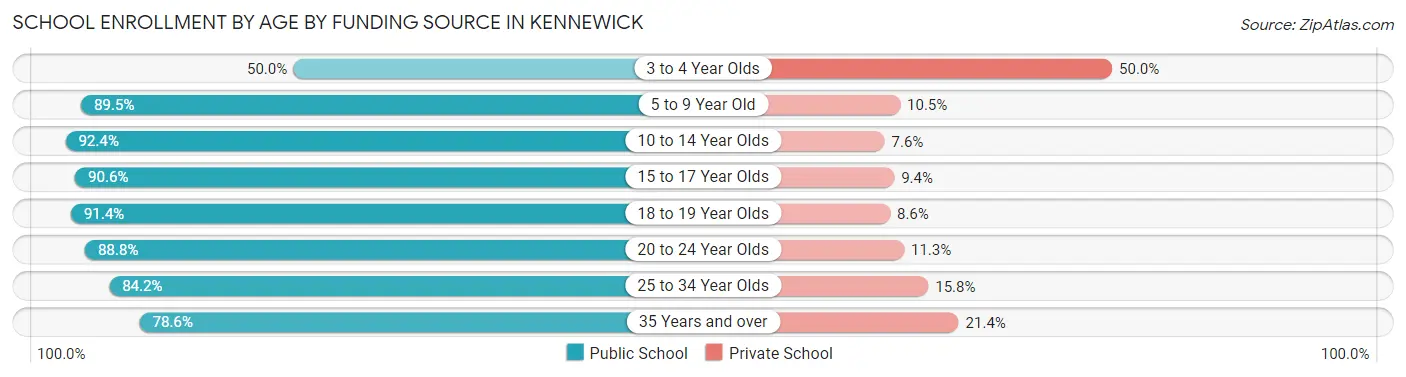
| Age Bracket | Public School | Private School |
| 3 to 4 Year Olds | 345 (50.0%) | 345 (50.0%) |
| 5 to 9 Year Old | 5,825 (89.5%) | 684 (10.5%) |
| 10 to 14 Year Olds | 4,704 (92.4%) | 388 (7.6%) |
| 15 to 17 Year Olds | 3,365 (90.6%) | 350 (9.4%) |
| 18 to 19 Year Olds | 1,038 (91.4%) | 98 (8.6%) |
| 20 to 24 Year Olds | 1,112 (88.7%) | 141 (11.3%) |
| 25 to 34 Year Olds | 1,165 (84.2%) | 218 (15.8%) |
| 35 Years and over | 1,152 (78.6%) | 314 (21.4%) |
| Total | 18,716 (88.1%) | 2,528 (11.9%) |
Educational Attainment by Field of Study in Kennewick
Business (2,402 | 15.4%), science & technology (2,035 | 13.1%), education (1,907 | 12.2%), bio, nature & agricultural (1,588 | 10.2%), and arts & humanities (1,398 | 9.0%) are the most common fields of study among 15,586 individuals in Kennewick who have obtained a bachelor's degree or higher.
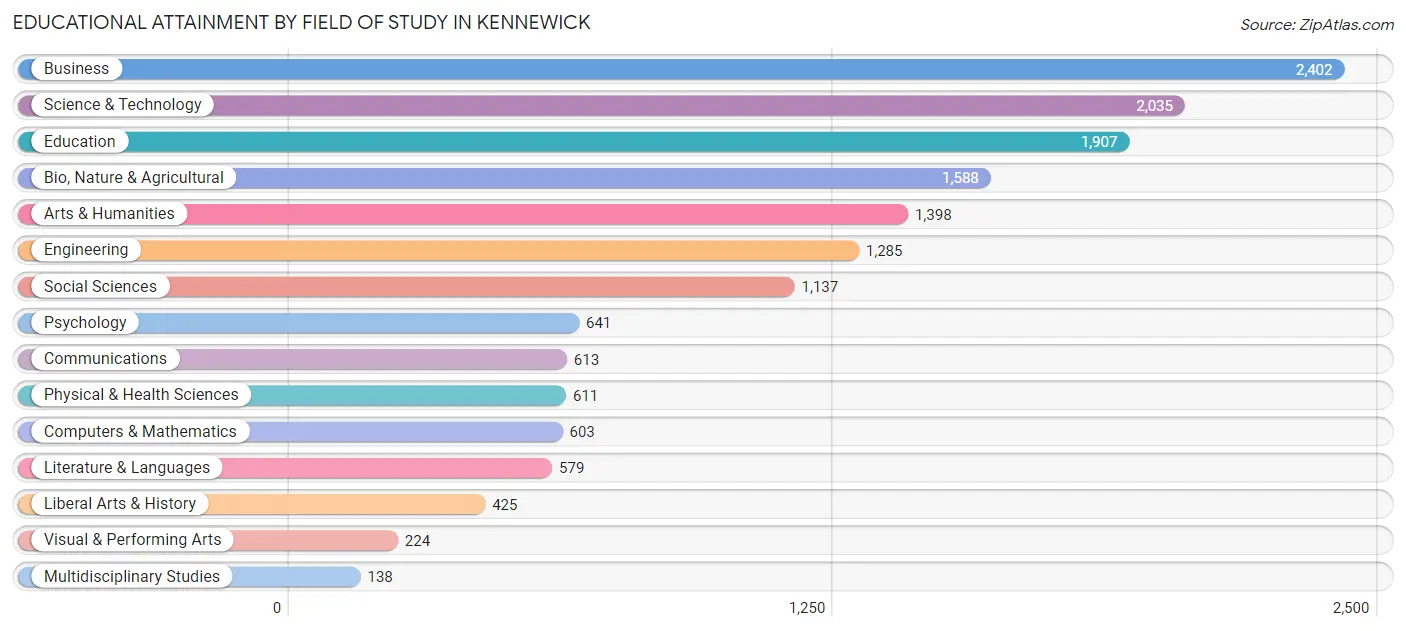
| Field of Study | # Graduates | % Graduates |
| Computers & Mathematics | 603 | 3.9% |
| Bio, Nature & Agricultural | 1,588 | 10.2% |
| Physical & Health Sciences | 611 | 3.9% |
| Psychology | 641 | 4.1% |
| Social Sciences | 1,137 | 7.3% |
| Engineering | 1,285 | 8.2% |
| Multidisciplinary Studies | 138 | 0.9% |
| Science & Technology | 2,035 | 13.1% |
| Business | 2,402 | 15.4% |
| Education | 1,907 | 12.2% |
| Literature & Languages | 579 | 3.7% |
| Liberal Arts & History | 425 | 2.7% |
| Visual & Performing Arts | 224 | 1.4% |
| Communications | 613 | 3.9% |
| Arts & Humanities | 1,398 | 9.0% |
| Total | 15,586 | 100.0% |
Transportation & Commute in Kennewick
Vehicle Availability by Sex in Kennewick
The most prevalent vehicle ownership categories in Kennewick are males with 2 vehicles (7,840, accounting for 38.9%) and females with 2 vehicles (6,132, making up 47.0%).
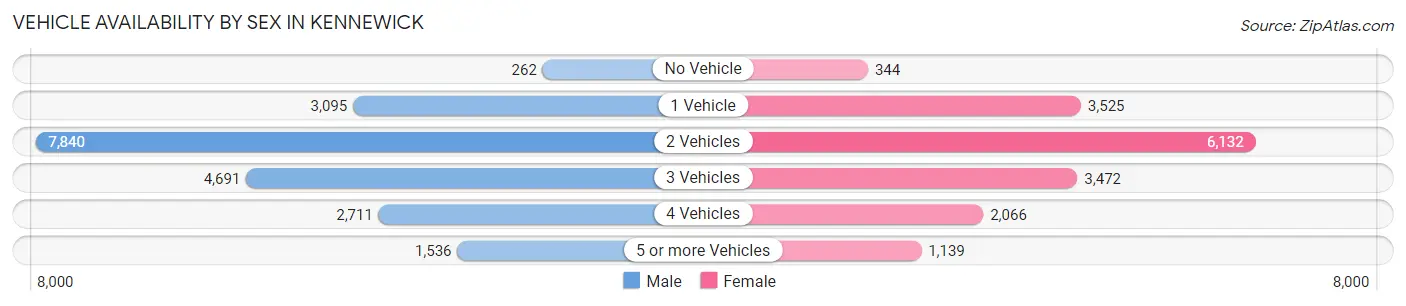
| Vehicles Available | Male | Female |
| No Vehicle | 262 (1.3%) | 344 (2.1%) |
| 1 Vehicle | 3,095 (15.4%) | 3,525 (21.1%) |
| 2 Vehicles | 7,840 (38.9%) | 6,132 (36.8%) |
| 3 Vehicles | 4,691 (23.3%) | 3,472 (20.8%) |
| 4 Vehicles | 2,711 (13.5%) | 2,066 (12.4%) |
| 5 or more Vehicles | 1,536 (7.6%) | 1,139 (6.8%) |
| Total | 20,135 (100.0%) | 16,678 (100.0%) |
Commute Time in Kennewick
The most frequently occuring commute durations in Kennewick are 15 to 19 minutes (6,877 commuters, 20.1%), 10 to 14 minutes (6,737 commuters, 19.7%), and 20 to 24 minutes (6,021 commuters, 17.6%).
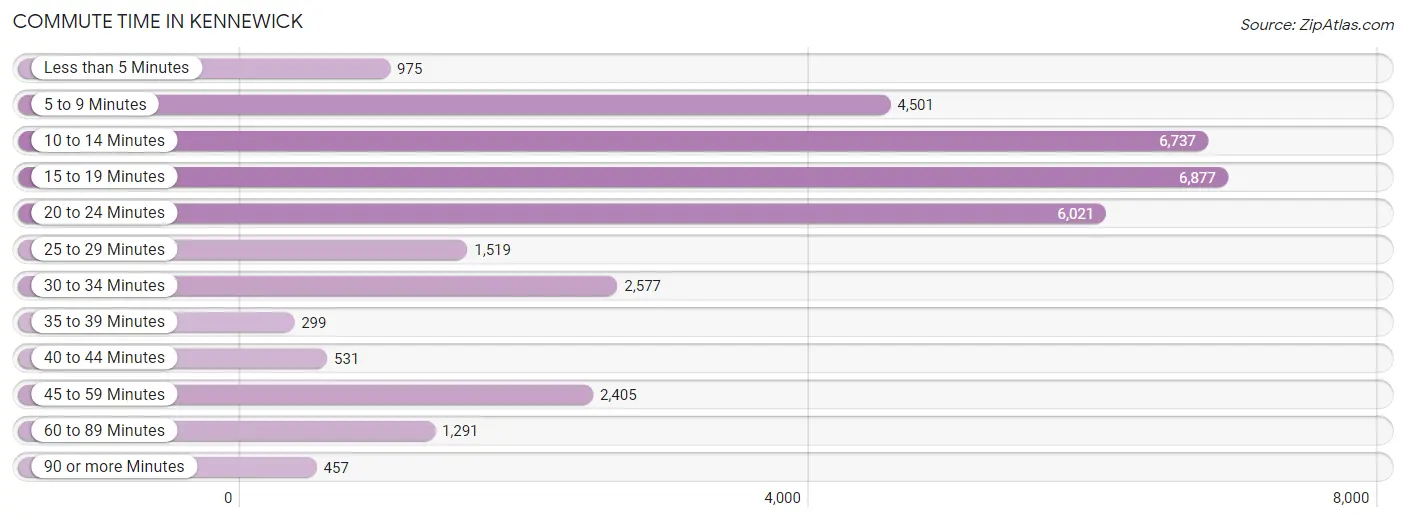
| Commute Time | # Commuters | % Commuters |
| Less than 5 Minutes | 975 | 2.9% |
| 5 to 9 Minutes | 4,501 | 13.2% |
| 10 to 14 Minutes | 6,737 | 19.7% |
| 15 to 19 Minutes | 6,877 | 20.1% |
| 20 to 24 Minutes | 6,021 | 17.6% |
| 25 to 29 Minutes | 1,519 | 4.4% |
| 30 to 34 Minutes | 2,577 | 7.5% |
| 35 to 39 Minutes | 299 | 0.9% |
| 40 to 44 Minutes | 531 | 1.5% |
| 45 to 59 Minutes | 2,405 | 7.0% |
| 60 to 89 Minutes | 1,291 | 3.8% |
| 90 or more Minutes | 457 | 1.3% |
Commute Time by Sex in Kennewick
The most common commute times in Kennewick are 15 to 19 minutes (3,366 commuters, 17.8%) for males and 15 to 19 minutes (3,511 commuters, 23.0%) for females.
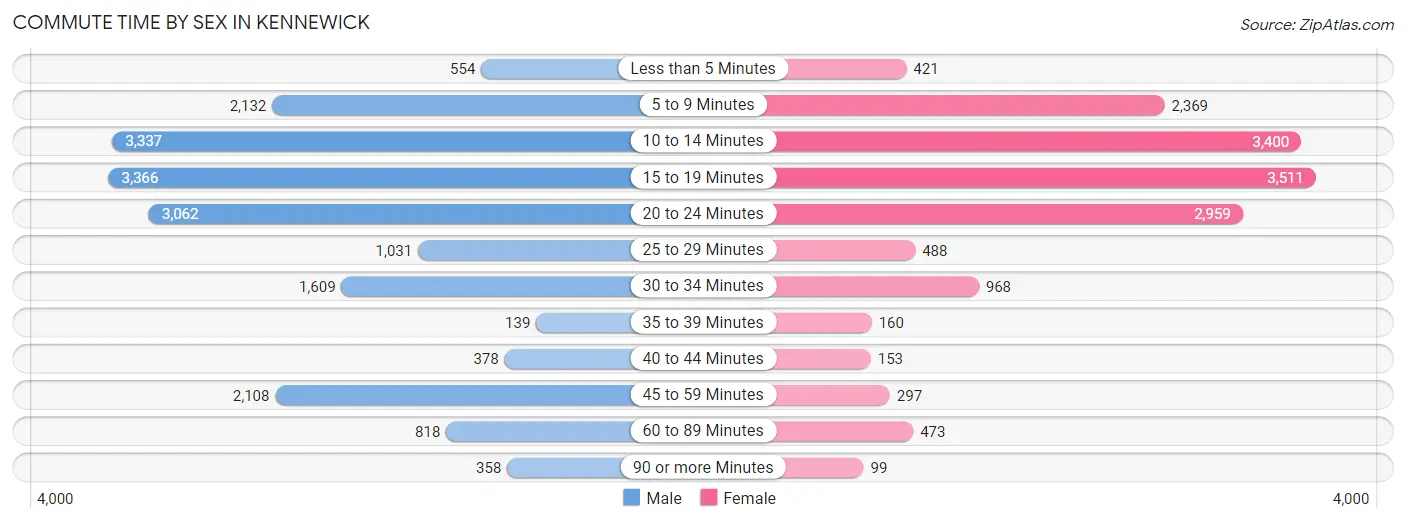
| Commute Time | Male | Female |
| Less than 5 Minutes | 554 (2.9%) | 421 (2.8%) |
| 5 to 9 Minutes | 2,132 (11.3%) | 2,369 (15.5%) |
| 10 to 14 Minutes | 3,337 (17.7%) | 3,400 (22.2%) |
| 15 to 19 Minutes | 3,366 (17.8%) | 3,511 (23.0%) |
| 20 to 24 Minutes | 3,062 (16.2%) | 2,959 (19.3%) |
| 25 to 29 Minutes | 1,031 (5.5%) | 488 (3.2%) |
| 30 to 34 Minutes | 1,609 (8.5%) | 968 (6.3%) |
| 35 to 39 Minutes | 139 (0.7%) | 160 (1.1%) |
| 40 to 44 Minutes | 378 (2.0%) | 153 (1.0%) |
| 45 to 59 Minutes | 2,108 (11.2%) | 297 (1.9%) |
| 60 to 89 Minutes | 818 (4.3%) | 473 (3.1%) |
| 90 or more Minutes | 358 (1.9%) | 99 (0.6%) |
Time of Departure to Work by Sex in Kennewick
The most frequent times of departure to work in Kennewick are 12:00 AM to 4:59 AM (2,461, 13.0%) for males and 7:30 AM to 7:59 AM (2,259, 14.8%) for females.
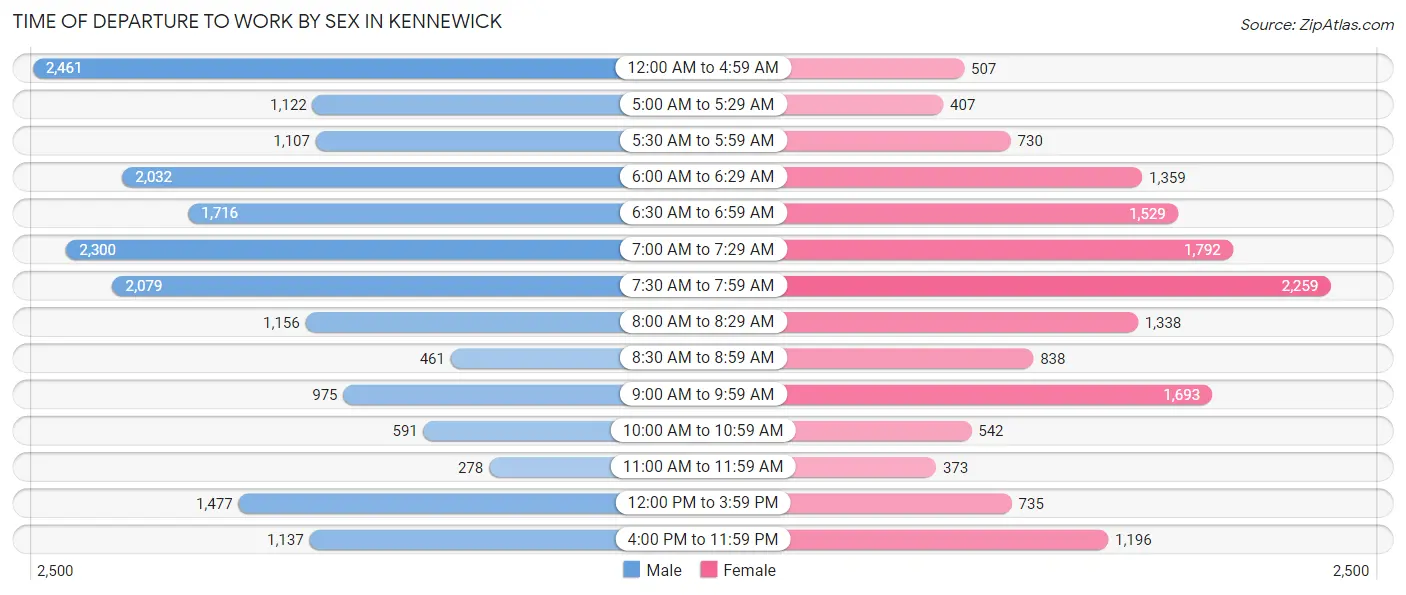
| Time of Departure | Male | Female |
| 12:00 AM to 4:59 AM | 2,461 (13.0%) | 507 (3.3%) |
| 5:00 AM to 5:29 AM | 1,122 (5.9%) | 407 (2.7%) |
| 5:30 AM to 5:59 AM | 1,107 (5.9%) | 730 (4.8%) |
| 6:00 AM to 6:29 AM | 2,032 (10.8%) | 1,359 (8.9%) |
| 6:30 AM to 6:59 AM | 1,716 (9.1%) | 1,529 (10.0%) |
| 7:00 AM to 7:29 AM | 2,300 (12.2%) | 1,792 (11.7%) |
| 7:30 AM to 7:59 AM | 2,079 (11.0%) | 2,259 (14.8%) |
| 8:00 AM to 8:29 AM | 1,156 (6.1%) | 1,338 (8.7%) |
| 8:30 AM to 8:59 AM | 461 (2.4%) | 838 (5.5%) |
| 9:00 AM to 9:59 AM | 975 (5.2%) | 1,693 (11.1%) |
| 10:00 AM to 10:59 AM | 591 (3.1%) | 542 (3.5%) |
| 11:00 AM to 11:59 AM | 278 (1.5%) | 373 (2.4%) |
| 12:00 PM to 3:59 PM | 1,477 (7.8%) | 735 (4.8%) |
| 4:00 PM to 11:59 PM | 1,137 (6.0%) | 1,196 (7.8%) |
| Total | 18,892 (100.0%) | 15,298 (100.0%) |
Housing Occupancy in Kennewick
Occupancy by Ownership in Kennewick
Of the total 30,651 dwellings in Kennewick, owner-occupied units account for 19,268 (62.9%), while renter-occupied units make up 11,383 (37.1%).
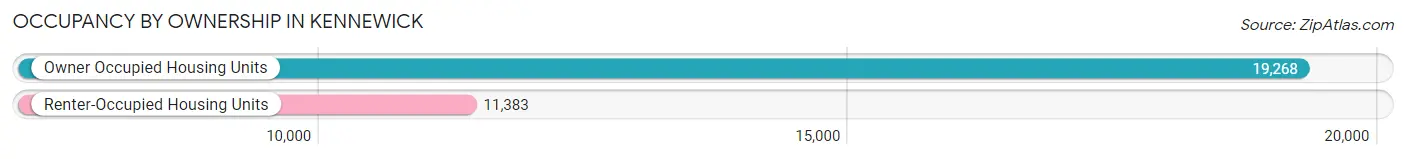
| Occupancy | # Housing Units | % Housing Units |
| Owner Occupied Housing Units | 19,268 | 62.9% |
| Renter-Occupied Housing Units | 11,383 | 37.1% |
| Total Occupied Housing Units | 30,651 | 100.0% |
Occupancy by Household Size in Kennewick
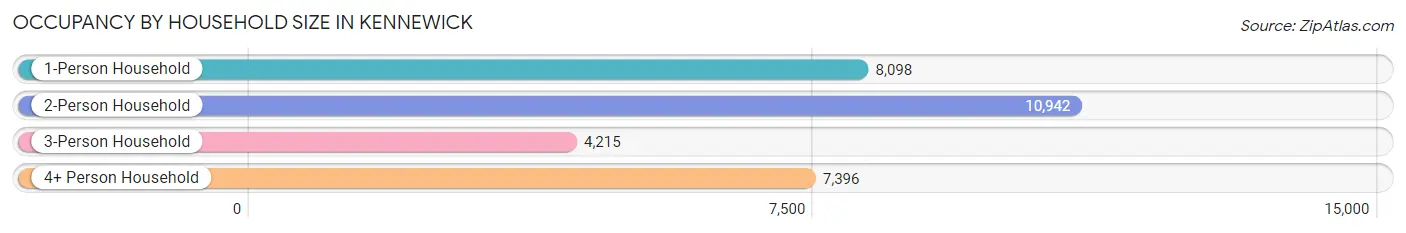
| Household Size | # Housing Units | % Housing Units |
| 1-Person Household | 8,098 | 26.4% |
| 2-Person Household | 10,942 | 35.7% |
| 3-Person Household | 4,215 | 13.8% |
| 4+ Person Household | 7,396 | 24.1% |
| Total Housing Units | 30,651 | 100.0% |
Occupancy by Ownership by Household Size in Kennewick
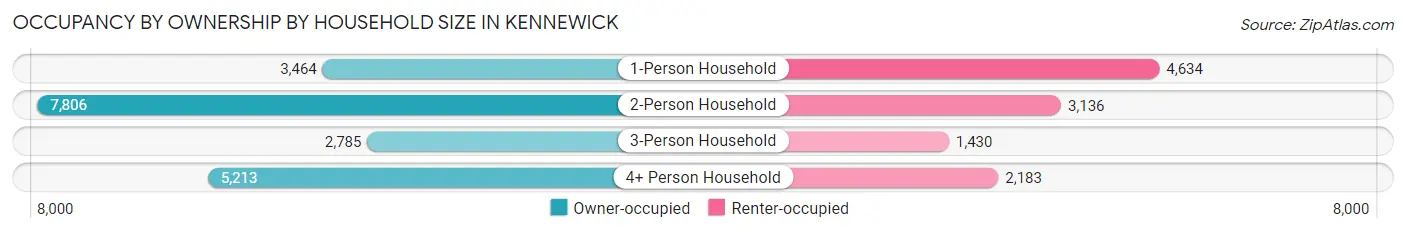
| Household Size | Owner-occupied | Renter-occupied |
| 1-Person Household | 3,464 (42.8%) | 4,634 (57.2%) |
| 2-Person Household | 7,806 (71.3%) | 3,136 (28.7%) |
| 3-Person Household | 2,785 (66.1%) | 1,430 (33.9%) |
| 4+ Person Household | 5,213 (70.5%) | 2,183 (29.5%) |
| Total Housing Units | 19,268 (62.9%) | 11,383 (37.1%) |
Occupancy by Educational Attainment in Kennewick
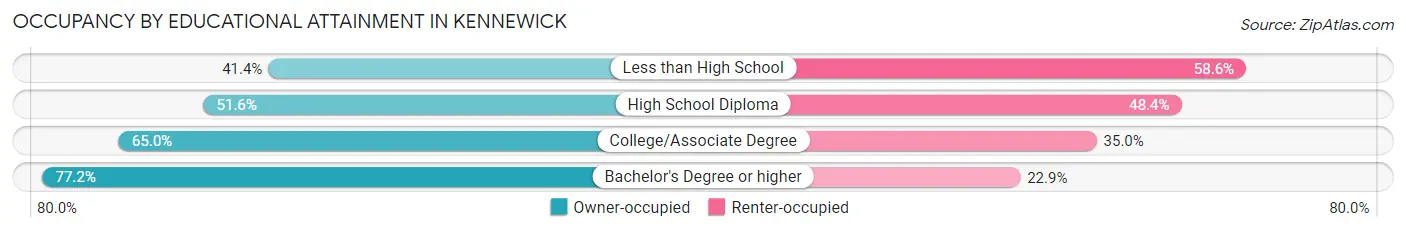
| Household Size | Owner-occupied | Renter-occupied |
| Less than High School | 1,382 (41.4%) | 1,959 (58.6%) |
| High School Diploma | 3,630 (51.6%) | 3,404 (48.4%) |
| College/Associate Degree | 7,451 (65.0%) | 4,005 (35.0%) |
| Bachelor's Degree or higher | 6,805 (77.1%) | 2,015 (22.9%) |
Occupancy by Age of Householder in Kennewick
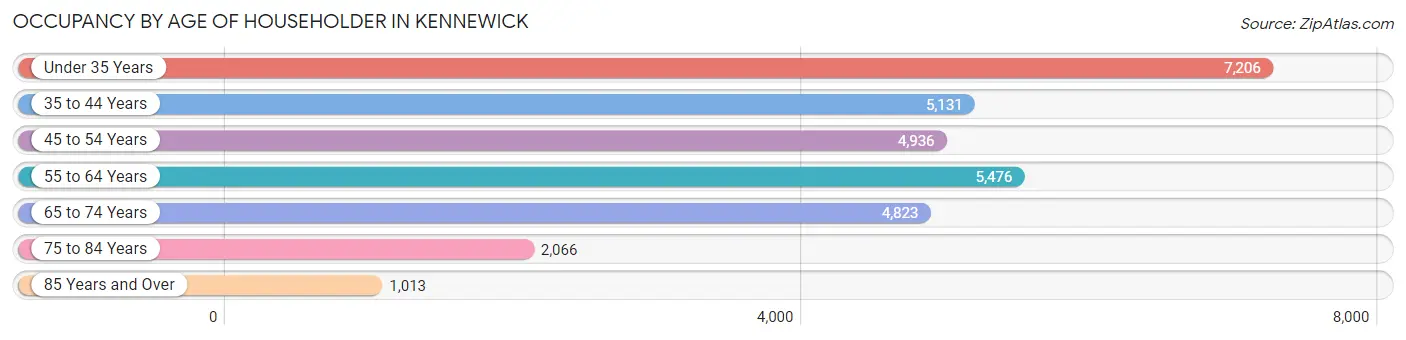
| Age Bracket | # Households | % Households |
| Under 35 Years | 7,206 | 23.5% |
| 35 to 44 Years | 5,131 | 16.7% |
| 45 to 54 Years | 4,936 | 16.1% |
| 55 to 64 Years | 5,476 | 17.9% |
| 65 to 74 Years | 4,823 | 15.7% |
| 75 to 84 Years | 2,066 | 6.7% |
| 85 Years and Over | 1,013 | 3.3% |
| Total | 30,651 | 100.0% |
Housing Finances in Kennewick
Median Income by Occupancy in Kennewick
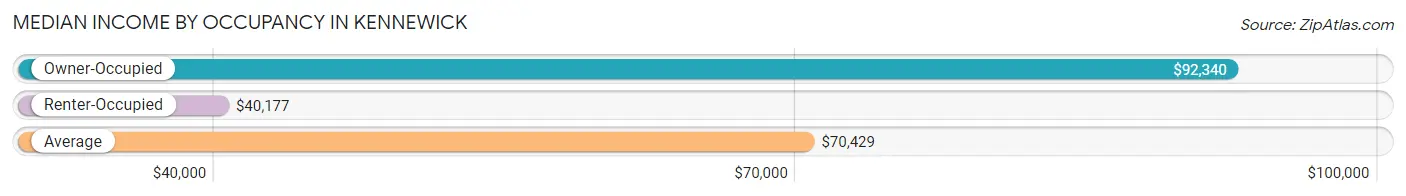
| Occupancy Type | # Households | Median Income |
| Owner-Occupied | 19,268 (62.9%) | $92,340 |
| Renter-Occupied | 11,383 (37.1%) | $40,177 |
| Average | 30,651 (100.0%) | $70,429 |
Occupancy by Householder Income Bracket in Kennewick
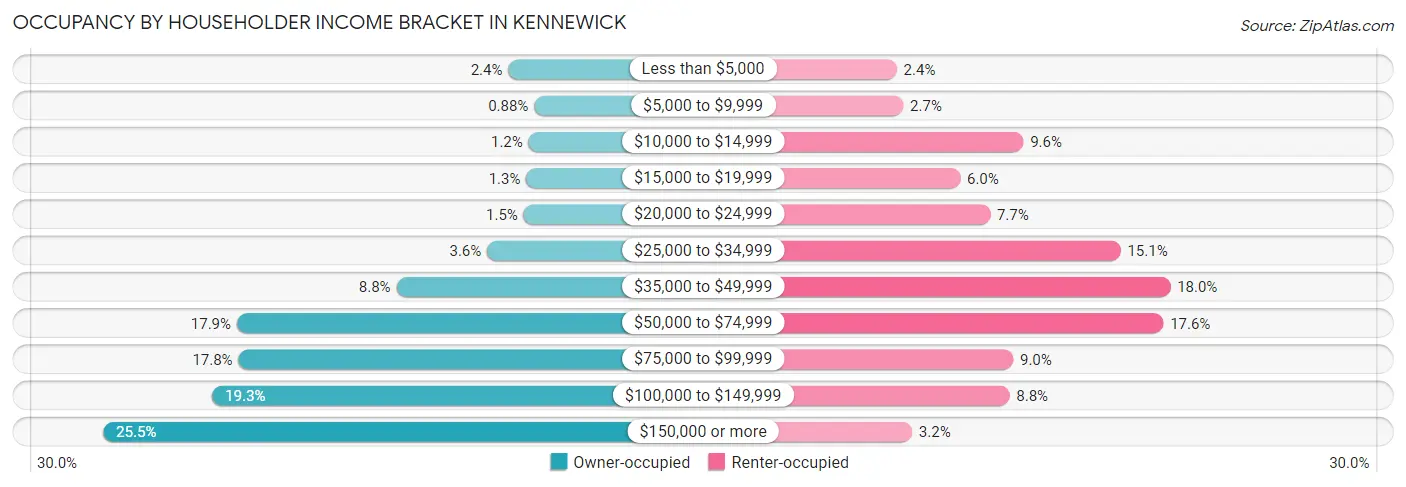
| Income Bracket | Owner-occupied | Renter-occupied |
| Less than $5,000 | 455 (2.4%) | 267 (2.4%) |
| $5,000 to $9,999 | 169 (0.9%) | 310 (2.7%) |
| $10,000 to $14,999 | 231 (1.2%) | 1,090 (9.6%) |
| $15,000 to $19,999 | 257 (1.3%) | 679 (6.0%) |
| $20,000 to $24,999 | 285 (1.5%) | 874 (7.7%) |
| $25,000 to $34,999 | 687 (3.6%) | 1,723 (15.1%) |
| $35,000 to $49,999 | 1,685 (8.7%) | 2,047 (18.0%) |
| $50,000 to $74,999 | 3,444 (17.9%) | 2,001 (17.6%) |
| $75,000 to $99,999 | 3,425 (17.8%) | 1,024 (9.0%) |
| $100,000 to $149,999 | 3,715 (19.3%) | 1,001 (8.8%) |
| $150,000 or more | 4,915 (25.5%) | 367 (3.2%) |
| Total | 19,268 (100.0%) | 11,383 (100.0%) |
Monthly Housing Cost Tiers in Kennewick
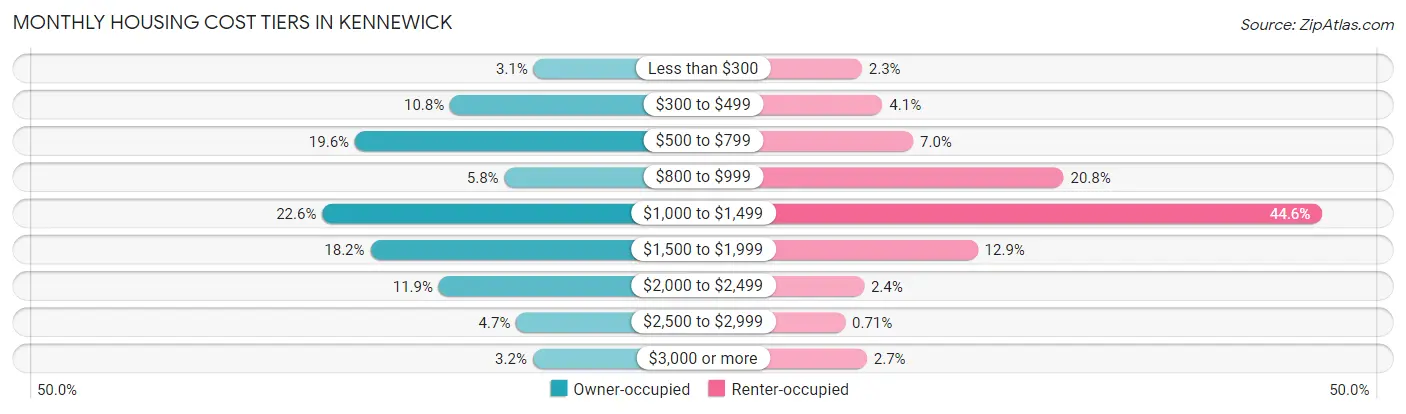
| Monthly Cost | Owner-occupied | Renter-occupied |
| Less than $300 | 605 (3.1%) | 256 (2.2%) |
| $300 to $499 | 2,086 (10.8%) | 471 (4.1%) |
| $500 to $799 | 3,775 (19.6%) | 793 (7.0%) |
| $800 to $999 | 1,124 (5.8%) | 2,370 (20.8%) |
| $1,000 to $1,499 | 4,354 (22.6%) | 5,079 (44.6%) |
| $1,500 to $1,999 | 3,501 (18.2%) | 1,469 (12.9%) |
| $2,000 to $2,499 | 2,288 (11.9%) | 278 (2.4%) |
| $2,500 to $2,999 | 914 (4.7%) | 81 (0.7%) |
| $3,000 or more | 621 (3.2%) | 308 (2.7%) |
| Total | 19,268 (100.0%) | 11,383 (100.0%) |
Physical Housing Characteristics in Kennewick
Housing Structures in Kennewick
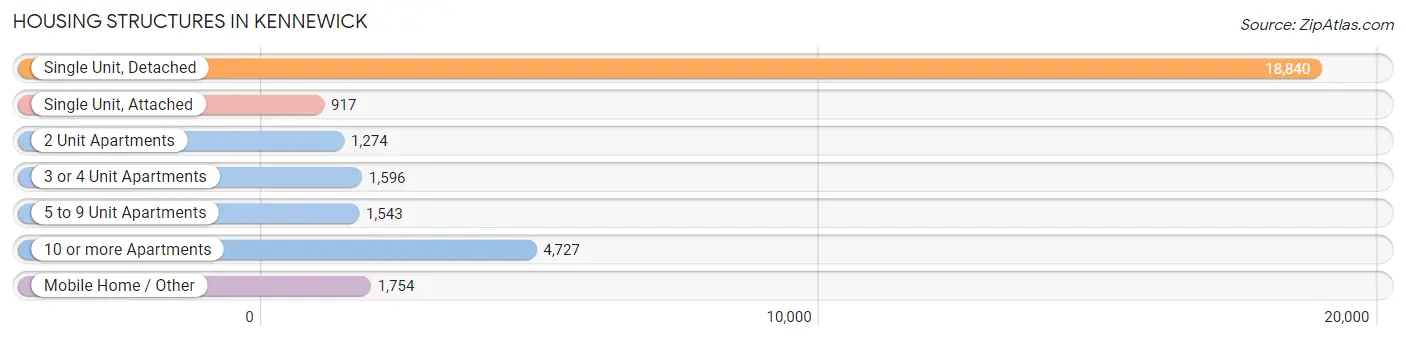
| Structure Type | # Housing Units | % Housing Units |
| Single Unit, Detached | 18,840 | 61.5% |
| Single Unit, Attached | 917 | 3.0% |
| 2 Unit Apartments | 1,274 | 4.2% |
| 3 or 4 Unit Apartments | 1,596 | 5.2% |
| 5 to 9 Unit Apartments | 1,543 | 5.0% |
| 10 or more Apartments | 4,727 | 15.4% |
| Mobile Home / Other | 1,754 | 5.7% |
| Total | 30,651 | 100.0% |
Housing Structures by Occupancy in Kennewick
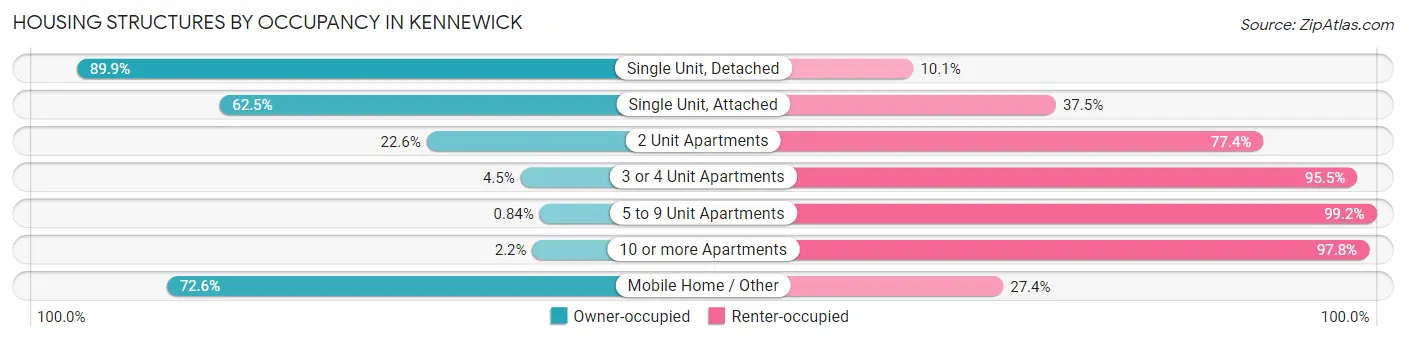
| Structure Type | Owner-occupied | Renter-occupied |
| Single Unit, Detached | 16,942 (89.9%) | 1,898 (10.1%) |
| Single Unit, Attached | 573 (62.5%) | 344 (37.5%) |
| 2 Unit Apartments | 288 (22.6%) | 986 (77.4%) |
| 3 or 4 Unit Apartments | 72 (4.5%) | 1,524 (95.5%) |
| 5 to 9 Unit Apartments | 13 (0.8%) | 1,530 (99.2%) |
| 10 or more Apartments | 106 (2.2%) | 4,621 (97.8%) |
| Mobile Home / Other | 1,274 (72.6%) | 480 (27.4%) |
| Total | 19,268 (62.9%) | 11,383 (37.1%) |
Housing Structures by Number of Rooms in Kennewick
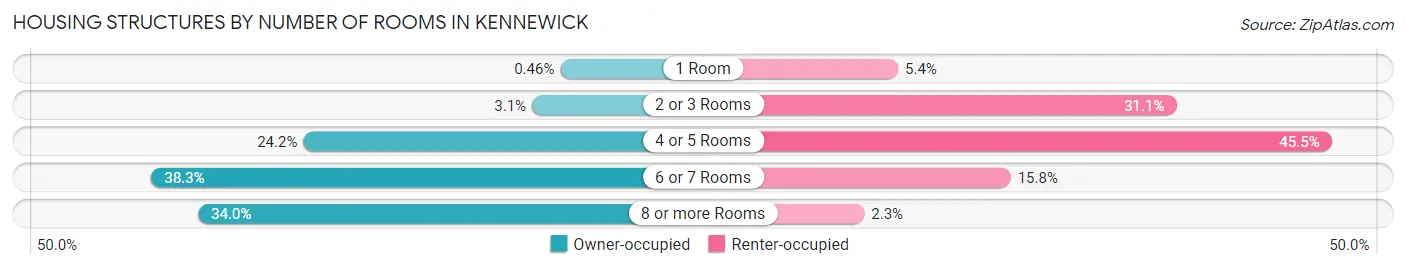
| Number of Rooms | Owner-occupied | Renter-occupied |
| 1 Room | 88 (0.5%) | 612 (5.4%) |
| 2 or 3 Rooms | 593 (3.1%) | 3,540 (31.1%) |
| 4 or 5 Rooms | 4,669 (24.2%) | 5,175 (45.5%) |
| 6 or 7 Rooms | 7,376 (38.3%) | 1,799 (15.8%) |
| 8 or more Rooms | 6,542 (34.0%) | 257 (2.3%) |
| Total | 19,268 (100.0%) | 11,383 (100.0%) |
Housing Structure by Heating Type in Kennewick
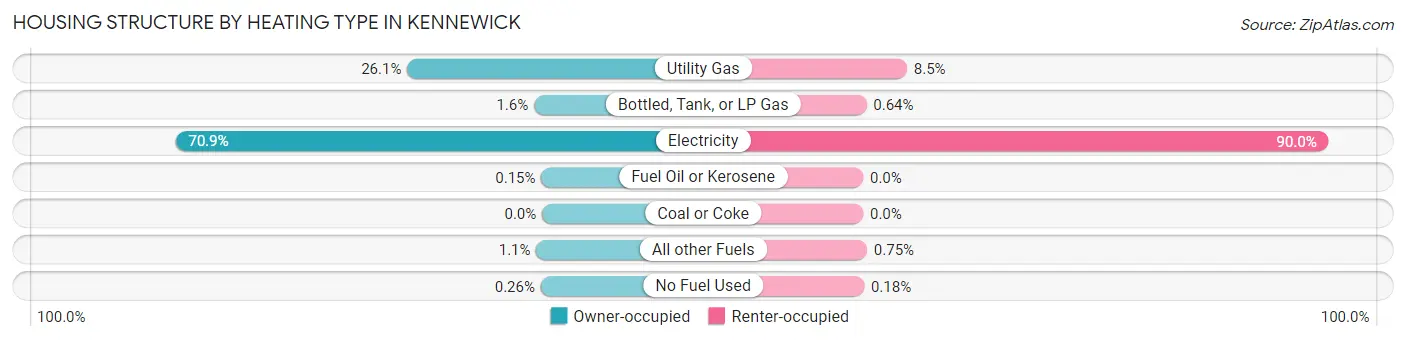
| Heating Type | Owner-occupied | Renter-occupied |
| Utility Gas | 5,021 (26.1%) | 963 (8.5%) |
| Bottled, Tank, or LP Gas | 301 (1.6%) | 73 (0.6%) |
| Electricity | 13,655 (70.9%) | 10,241 (90.0%) |
| Fuel Oil or Kerosene | 28 (0.2%) | 0 (0.0%) |
| Coal or Coke | 0 (0.0%) | 0 (0.0%) |
| All other Fuels | 213 (1.1%) | 85 (0.7%) |
| No Fuel Used | 50 (0.3%) | 21 (0.2%) |
| Total | 19,268 (100.0%) | 11,383 (100.0%) |
Household Vehicle Usage in Kennewick
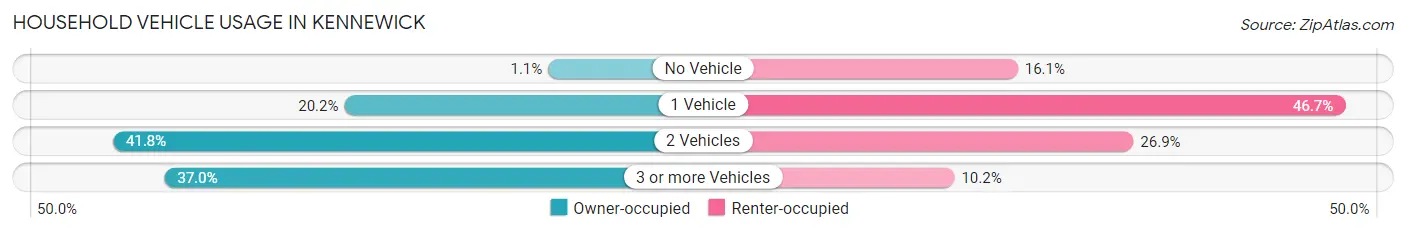
| Vehicles per Household | Owner-occupied | Renter-occupied |
| No Vehicle | 217 (1.1%) | 1,837 (16.1%) |
| 1 Vehicle | 3,884 (20.2%) | 5,315 (46.7%) |
| 2 Vehicles | 8,046 (41.8%) | 3,066 (26.9%) |
| 3 or more Vehicles | 7,121 (37.0%) | 1,165 (10.2%) |
| Total | 19,268 (100.0%) | 11,383 (100.0%) |
Real Estate & Mortgages in Kennewick
Real Estate and Mortgage Overview in Kennewick
| Characteristic | Without Mortgage | With Mortgage |
| Housing Units | 6,927 | 12,341 |
| Median Property Value | $302,900 | $325,500 |
| Median Household Income | $69,533 | $3,689 |
| Monthly Housing Costs | $563 | $606 |
| Real Estate Taxes | $2,454 | $271 |
Property Value by Mortgage Status in Kennewick
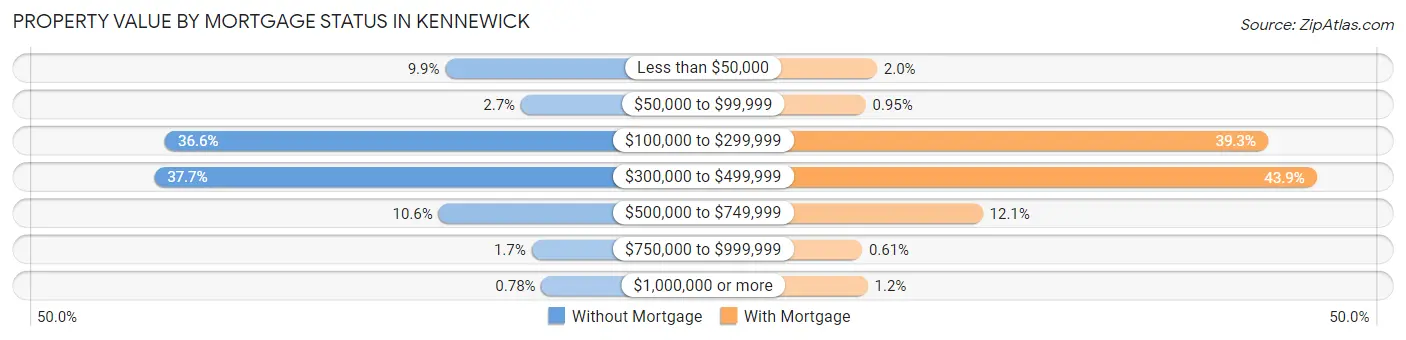
| Property Value | Without Mortgage | With Mortgage |
| Less than $50,000 | 688 (9.9%) | 250 (2.0%) |
| $50,000 to $99,999 | 189 (2.7%) | 117 (0.9%) |
| $100,000 to $299,999 | 2,536 (36.6%) | 4,845 (39.3%) |
| $300,000 to $499,999 | 2,608 (37.7%) | 5,419 (43.9%) |
| $500,000 to $749,999 | 733 (10.6%) | 1,493 (12.1%) |
| $750,000 to $999,999 | 119 (1.7%) | 75 (0.6%) |
| $1,000,000 or more | 54 (0.8%) | 142 (1.1%) |
| Total | 6,927 (100.0%) | 12,341 (100.0%) |
Household Income by Mortgage Status in Kennewick
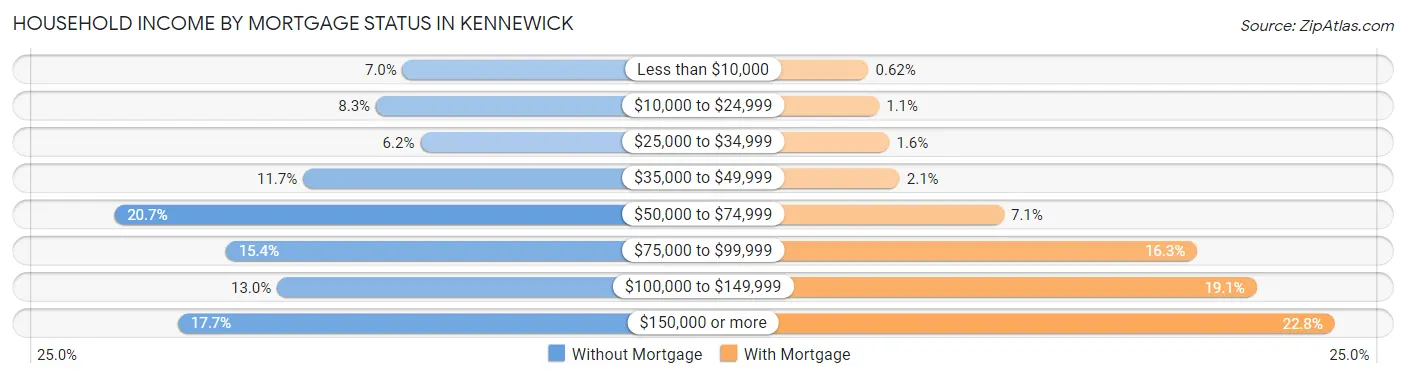
| Household Income | Without Mortgage | With Mortgage |
| Less than $10,000 | 485 (7.0%) | 76 (0.6%) |
| $10,000 to $24,999 | 573 (8.3%) | 139 (1.1%) |
| $25,000 to $34,999 | 427 (6.2%) | 200 (1.6%) |
| $35,000 to $49,999 | 813 (11.7%) | 260 (2.1%) |
| $50,000 to $74,999 | 1,436 (20.7%) | 872 (7.1%) |
| $75,000 to $99,999 | 1,068 (15.4%) | 2,008 (16.3%) |
| $100,000 to $149,999 | 899 (13.0%) | 2,357 (19.1%) |
| $150,000 or more | 1,226 (17.7%) | 2,816 (22.8%) |
| Total | 6,927 (100.0%) | 12,341 (100.0%) |
Property Value to Household Income Ratio in Kennewick
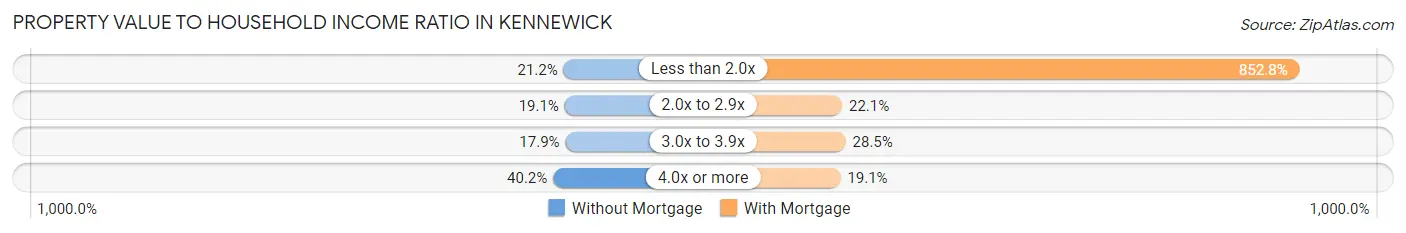
| Value-to-Income Ratio | Without Mortgage | With Mortgage |
| Less than 2.0x | 1,469 (21.2%) | 105,243 (852.8%) |
| 2.0x to 2.9x | 1,324 (19.1%) | 2,722 (22.1%) |
| 3.0x to 3.9x | 1,238 (17.9%) | 3,516 (28.5%) |
| 4.0x or more | 2,782 (40.2%) | 2,360 (19.1%) |
| Total | 6,927 (100.0%) | 12,341 (100.0%) |
Real Estate Taxes by Mortgage Status in Kennewick
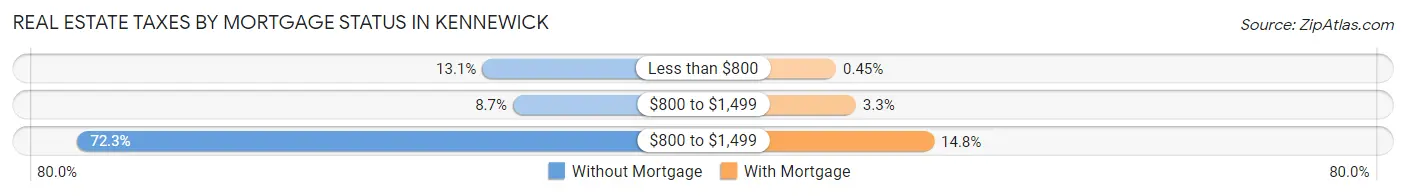
| Property Taxes | Without Mortgage | With Mortgage |
| Less than $800 | 910 (13.1%) | 55 (0.4%) |
| $800 to $1,499 | 600 (8.7%) | 412 (3.3%) |
| $800 to $1,499 | 5,008 (72.3%) | 1,823 (14.8%) |
| Total | 6,927 (100.0%) | 12,341 (100.0%) |
Health & Disability in Kennewick
Health Insurance Coverage by Age in Kennewick
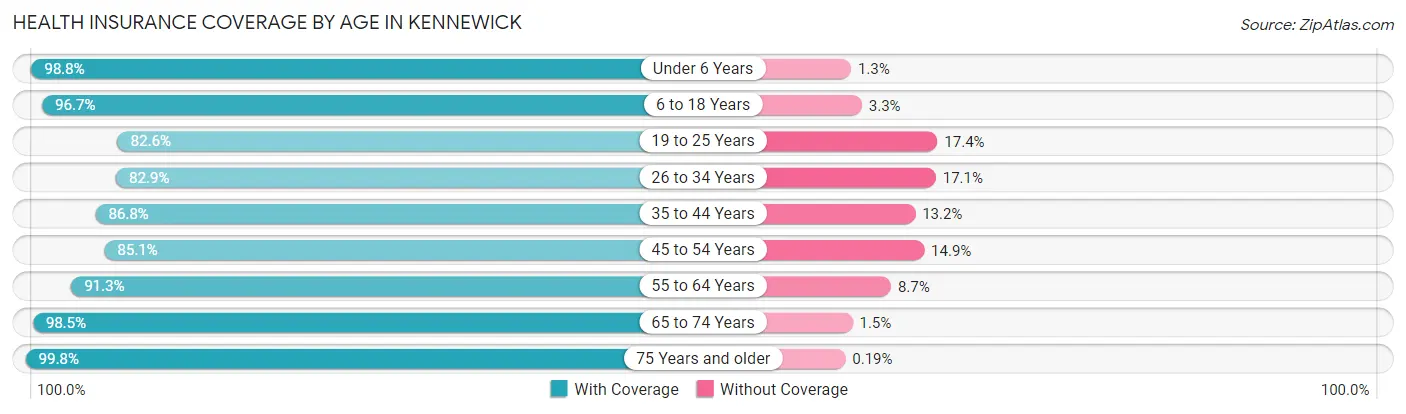
| Age Bracket | With Coverage | Without Coverage |
| Under 6 Years | 6,770 (98.8%) | 86 (1.3%) |
| 6 to 18 Years | 15,305 (96.7%) | 519 (3.3%) |
| 19 to 25 Years | 6,381 (82.6%) | 1,340 (17.4%) |
| 26 to 34 Years | 9,030 (82.9%) | 1,857 (17.1%) |
| 35 to 44 Years | 9,458 (86.8%) | 1,441 (13.2%) |
| 45 to 54 Years | 7,198 (85.1%) | 1,259 (14.9%) |
| 55 to 64 Years | 8,689 (91.3%) | 828 (8.7%) |
| 65 to 74 Years | 7,877 (98.5%) | 122 (1.5%) |
| 75 Years and older | 4,698 (99.8%) | 9 (0.2%) |
| Total | 75,406 (91.0%) | 7,461 (9.0%) |
Health Insurance Coverage by Citizenship Status in Kennewick
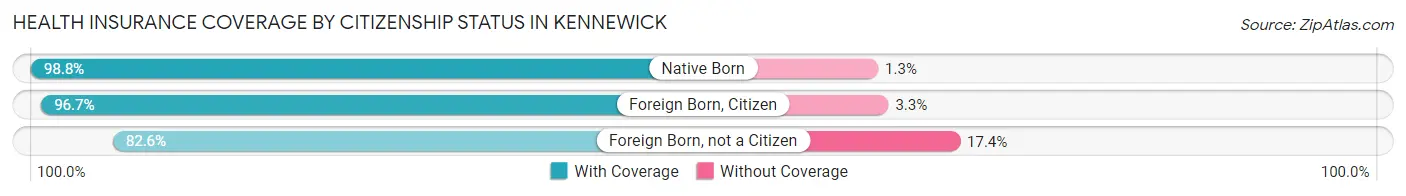
| Citizenship Status | With Coverage | Without Coverage |
| Native Born | 6,770 (98.8%) | 86 (1.3%) |
| Foreign Born, Citizen | 15,305 (96.7%) | 519 (3.3%) |
| Foreign Born, not a Citizen | 6,381 (82.6%) | 1,340 (17.4%) |
Health Insurance Coverage by Household Income in Kennewick
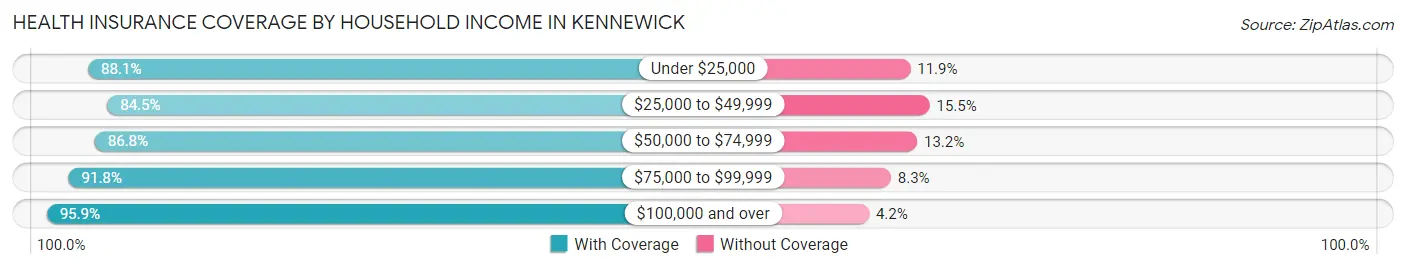
| Household Income | With Coverage | Without Coverage |
| Under $25,000 | 7,732 (88.1%) | 1,044 (11.9%) |
| $25,000 to $49,999 | 11,984 (84.5%) | 2,199 (15.5%) |
| $50,000 to $74,999 | 11,622 (86.8%) | 1,762 (13.2%) |
| $75,000 to $99,999 | 11,683 (91.7%) | 1,051 (8.3%) |
| $100,000 and over | 32,141 (95.9%) | 1,390 (4.2%) |
Public vs Private Health Insurance Coverage by Age in Kennewick
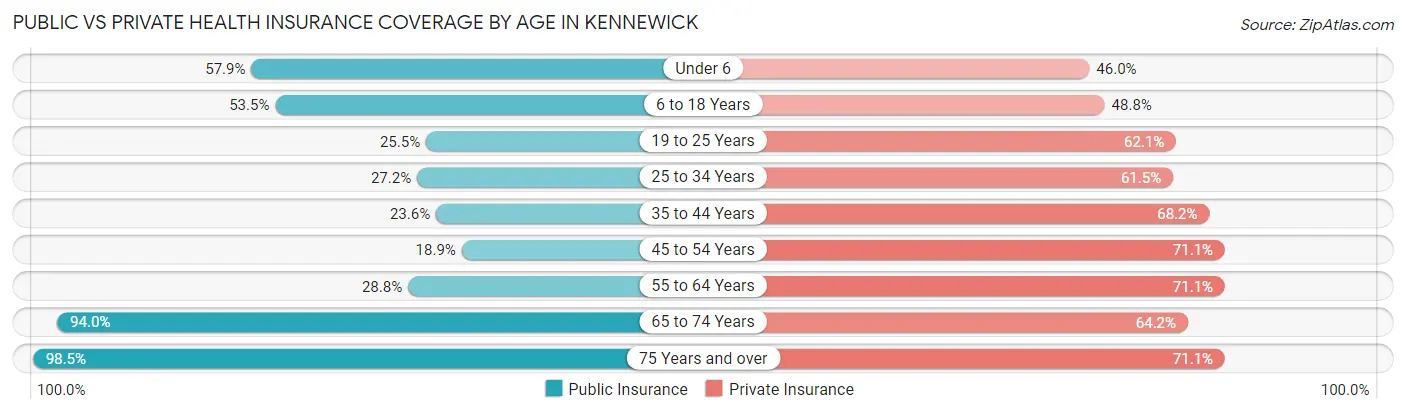
| Age Bracket | Public Insurance | Private Insurance |
| Under 6 | 3,971 (57.9%) | 3,151 (46.0%) |
| 6 to 18 Years | 8,462 (53.5%) | 7,721 (48.8%) |
| 19 to 25 Years | 1,969 (25.5%) | 4,792 (62.1%) |
| 25 to 34 Years | 2,958 (27.2%) | 6,692 (61.5%) |
| 35 to 44 Years | 2,576 (23.6%) | 7,435 (68.2%) |
| 45 to 54 Years | 1,597 (18.9%) | 6,014 (71.1%) |
| 55 to 64 Years | 2,745 (28.8%) | 6,767 (71.1%) |
| 65 to 74 Years | 7,515 (94.0%) | 5,138 (64.2%) |
| 75 Years and over | 4,636 (98.5%) | 3,347 (71.1%) |
| Total | 36,429 (44.0%) | 51,057 (61.6%) |
Disability Status by Sex by Age in Kennewick
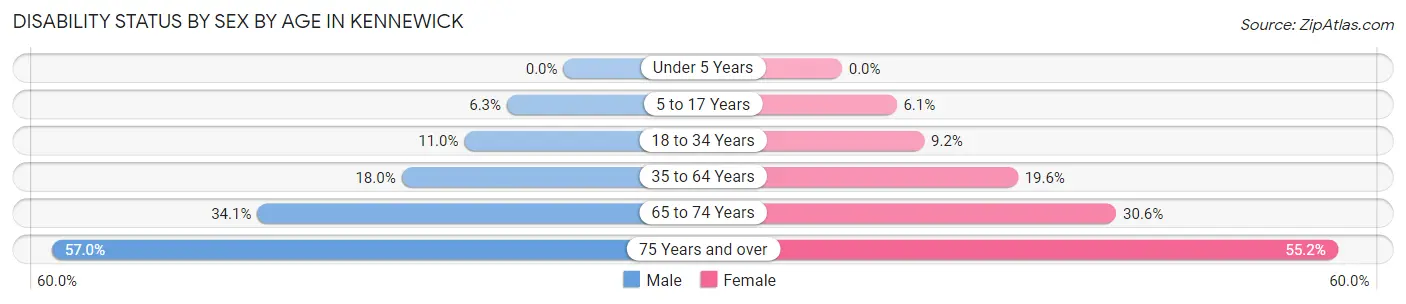
| Age Bracket | Male | Female |
| Under 5 Years | 0 (0.0%) | 0 (0.0%) |
| 5 to 17 Years | 493 (6.3%) | 492 (6.1%) |
| 18 to 34 Years | 1,144 (11.0%) | 857 (9.2%) |
| 35 to 64 Years | 2,535 (18.0%) | 2,902 (19.6%) |
| 65 to 74 Years | 1,315 (34.1%) | 1,265 (30.5%) |
| 75 Years and over | 1,144 (57.0%) | 1,490 (55.2%) |
Disability Class by Sex by Age in Kennewick
Disability Class: Hearing Difficulty
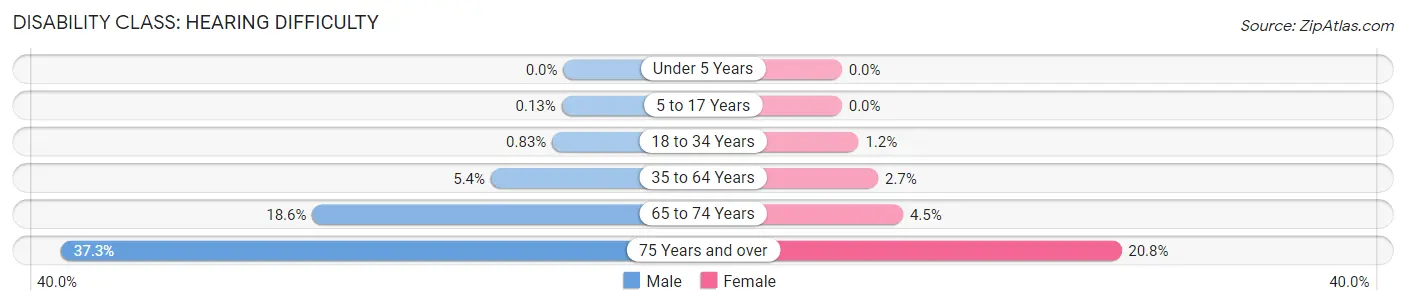
| Age Bracket | Male | Female |
| Under 5 Years | 0 (0.0%) | 0 (0.0%) |
| 5 to 17 Years | 10 (0.1%) | 0 (0.0%) |
| 18 to 34 Years | 86 (0.8%) | 116 (1.2%) |
| 35 to 64 Years | 756 (5.4%) | 398 (2.7%) |
| 65 to 74 Years | 719 (18.6%) | 188 (4.5%) |
| 75 Years and over | 749 (37.3%) | 560 (20.7%) |
Disability Class: Vision Difficulty
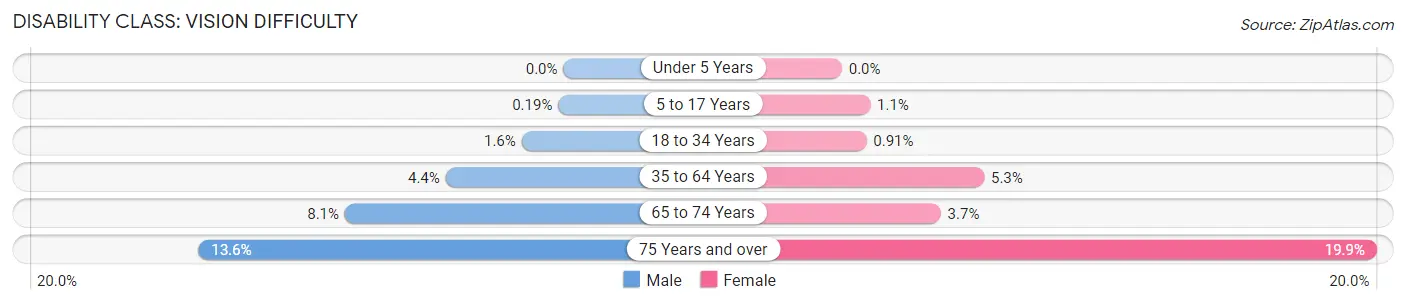
| Age Bracket | Male | Female |
| Under 5 Years | 0 (0.0%) | 0 (0.0%) |
| 5 to 17 Years | 15 (0.2%) | 85 (1.1%) |
| 18 to 34 Years | 161 (1.5%) | 85 (0.9%) |
| 35 to 64 Years | 614 (4.4%) | 782 (5.3%) |
| 65 to 74 Years | 313 (8.1%) | 152 (3.7%) |
| 75 Years and over | 272 (13.6%) | 536 (19.9%) |
Disability Class: Cognitive Difficulty
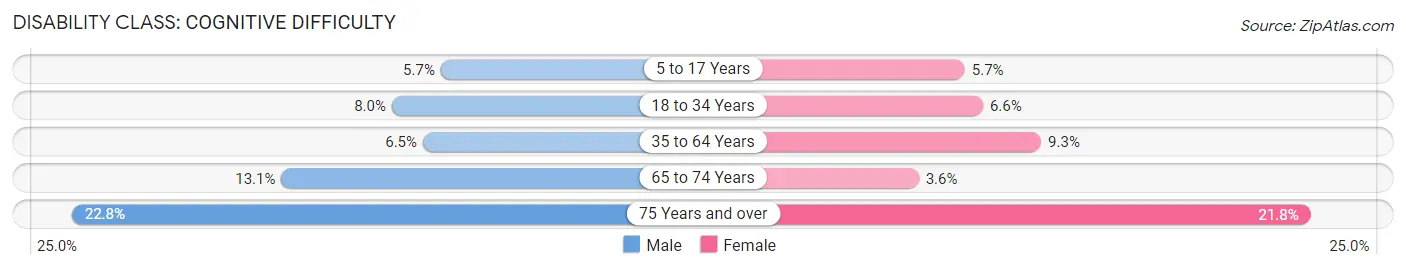
| Age Bracket | Male | Female |
| 5 to 17 Years | 446 (5.7%) | 461 (5.7%) |
| 18 to 34 Years | 825 (8.0%) | 612 (6.6%) |
| 35 to 64 Years | 916 (6.5%) | 1,371 (9.2%) |
| 65 to 74 Years | 505 (13.1%) | 148 (3.6%) |
| 75 Years and over | 458 (22.8%) | 587 (21.7%) |
Disability Class: Ambulatory Difficulty
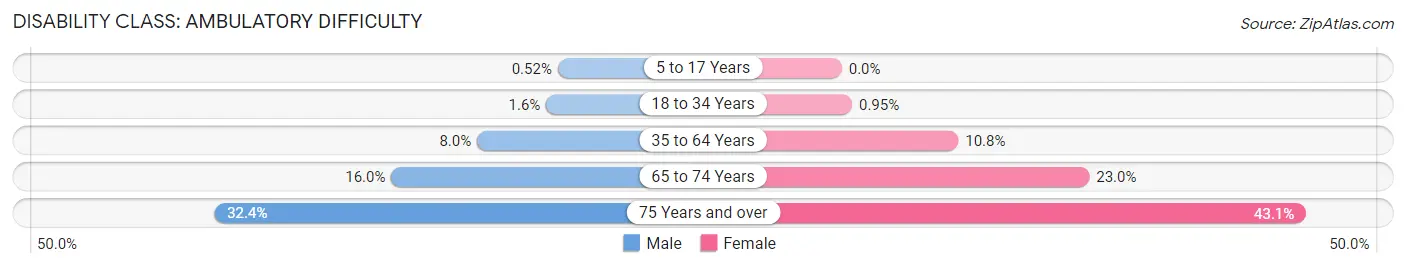
| Age Bracket | Male | Female |
| 5 to 17 Years | 41 (0.5%) | 0 (0.0%) |
| 18 to 34 Years | 165 (1.6%) | 89 (0.9%) |
| 35 to 64 Years | 1,126 (8.0%) | 1,602 (10.8%) |
| 65 to 74 Years | 616 (16.0%) | 951 (23.0%) |
| 75 Years and over | 651 (32.4%) | 1,163 (43.1%) |
Disability Class: Self-Care Difficulty
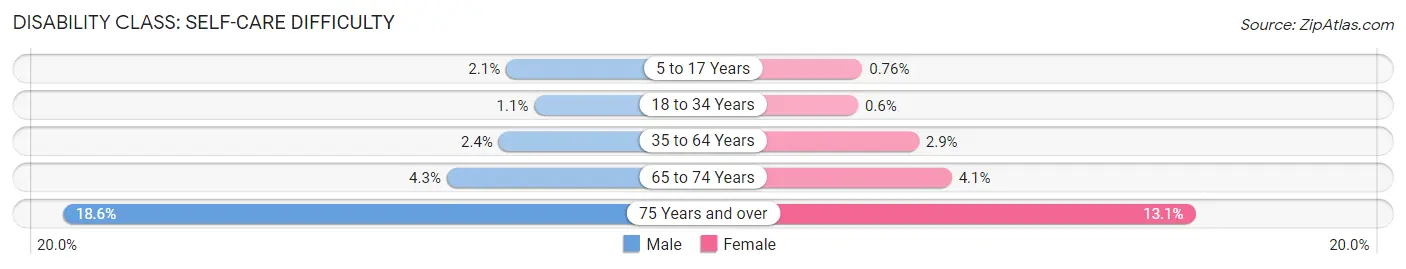
| Age Bracket | Male | Female |
| 5 to 17 Years | 167 (2.1%) | 61 (0.8%) |
| 18 to 34 Years | 112 (1.1%) | 56 (0.6%) |
| 35 to 64 Years | 337 (2.4%) | 424 (2.9%) |
| 65 to 74 Years | 167 (4.3%) | 169 (4.1%) |
| 75 Years and over | 373 (18.6%) | 354 (13.1%) |
Technology Access in Kennewick
Computing Device Access in Kennewick
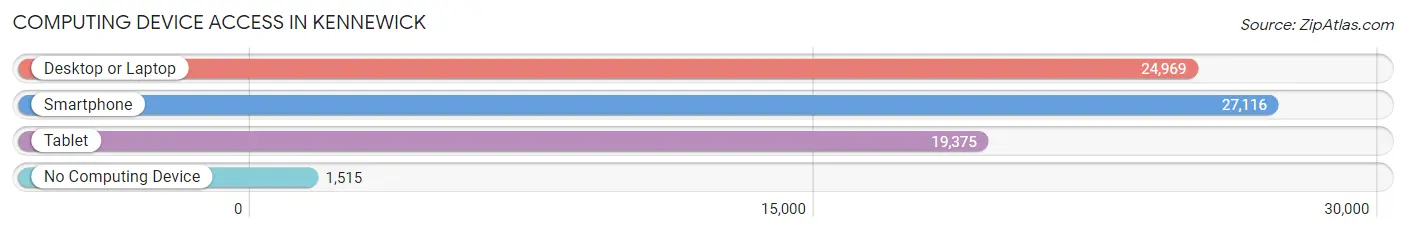
| Device Type | # Households | % Households |
| Desktop or Laptop | 24,969 | 81.5% |
| Smartphone | 27,116 | 88.5% |
| Tablet | 19,375 | 63.2% |
| No Computing Device | 1,515 | 4.9% |
| Total | 30,651 | 100.0% |
Internet Access in Kennewick
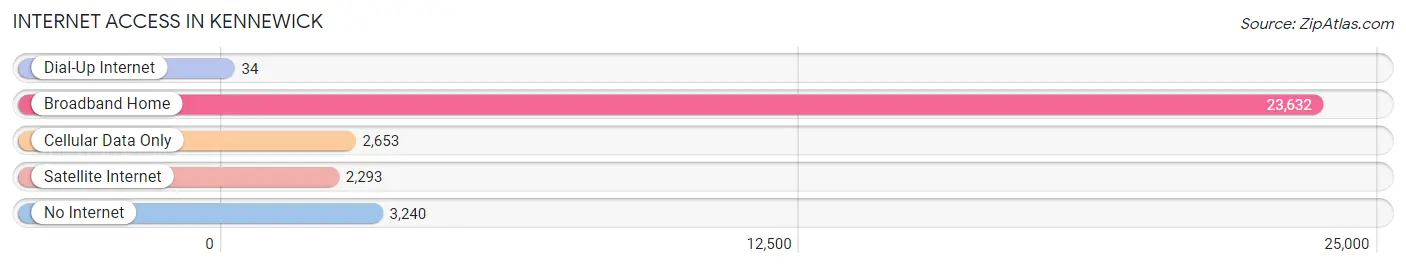
| Internet Type | # Households | % Households |
| Dial-Up Internet | 34 | 0.1% |
| Broadband Home | 23,632 | 77.1% |
| Cellular Data Only | 2,653 | 8.7% |
| Satellite Internet | 2,293 | 7.5% |
| No Internet | 3,240 | 10.6% |
| Total | 30,651 | 100.0% |
Kennewick Summary
Kennewick, Washington is a city located in Benton County in the southeastern part of the state. It is the largest city in the Tri-Cities metropolitan area, which also includes the cities of Pasco and Richland. The population of Kennewick was estimated to be 73,917 in 2019, making it the ninth-largest city in Washington.
History
The area that is now Kennewick was originally inhabited by the Yakama, Umatilla, and Walla Walla Native American tribes. The first European settlers arrived in the area in the early 1800s, and the first permanent settlement was established in 1864. The city was officially incorporated in 1904 and was named after the Kennewick River, which was named after a Native American chief.
In the early 1900s, the city was a major hub for the agricultural industry, with many farms and orchards in the area. The city also became a major transportation hub, with the Northern Pacific Railway running through the city.
Geography
Kennewick is located in southeastern Washington, in the Columbia River Plateau region. It is situated at the confluence of the Columbia and Yakima Rivers. The city covers an area of 28.3 square miles and has an elevation of 486 feet.
The climate in Kennewick is semi-arid, with hot summers and mild winters. The average annual temperature is around 50°F, and the average annual precipitation is around 8.5 inches.
Economy
The economy of Kennewick is largely based on agriculture, manufacturing, and services. The city is home to several large companies, including Lamb Weston, a potato processing company, and the Tri-Cities Airport. The city is also home to several wineries and breweries, as well as a number of retail stores and restaurants.
The city is also home to several educational institutions, including Columbia Basin College, Washington State University Tri-Cities, and the Tri-Cities Research District.
Demographics
As of 2019, the population of Kennewick was estimated to be 73,917. The racial makeup of the city was 79.2% White, 5.3% Hispanic or Latino, 4.2% Asian, 3.7% African American, and 0.7% Native American. The median household income was $60,945, and the median home value was $223,400.
Conclusion
Kennewick, Washington is a city located in Benton County in the southeastern part of the state. It is the largest city in the Tri-Cities metropolitan area, and its population was estimated to be 73,917 in 2019. The city is largely based on agriculture, manufacturing, and services, and it is home to several large companies, wineries, breweries, and educational institutions. The racial makeup of the city was 79.2% White, 5.3% Hispanic or Latino, 4.2% Asian, 3.7% African American, and 0.7% Native American. The median household income was $60,945, and the median home value was $223,400.
Common Questions
What is the Total Population of Kennewick?
Total Population of Kennewick is 83,823.
What is the Total Male Population of Kennewick?
Total Male Population of Kennewick is 41,413.
What is the Total Female Population of Kennewick?
Total Female Population of Kennewick is 42,410.
What is the Ratio of Males per 100 Females in Kennewick?
There are 97.65 Males per 100 Females in Kennewick.
What is the Ratio of Females per 100 Males in Kennewick?
There are 102.41 Females per 100 Males in Kennewick.
What is the Median Population Age in Kennewick?
Median Population Age in Kennewick is 35.2 Years.
What is the Average Family Size in Kennewick
Average Family Size in Kennewick is 3.2 People.
What is the Average Household Size in Kennewick
Average Household Size in Kennewick is 2.7 People.
What is Per Capita Income in Kennewick?
Per Capita income in Kennewick is $34,211.
What is the Median Family Income in Kennewick?
Median Family Income in Kennewick is $84,811.
What is the Median Household income in Kennewick?
Median Household Income in Kennewick is $70,429.
What is Income or Wage Gap in Kennewick?
Income or Wage Gap in Kennewick is 31.1%.
Women in Kennewick earn 68.9 cents for every dollar earned by a man.
What is Family Income Deficit in Kennewick?
Family Income Deficit in Kennewick is $9,433.
Families that are below poverty line in Kennewick earn $9,433 less on average than the poverty threshold level.
What is Inequality or Gini Index in Kennewick?
Inequality or Gini Index in Kennewick is 0.43.
How Large is the Labor Force in Kennewick?
There are 39,398 People in the Labor Forcein in Kennewick.
What is the Percentage of People in the Labor Force in Kennewick?
61.1% of People are in the Labor Force in Kennewick.
What is the Unemployment Rate in Kennewick?
Unemployment Rate in Kennewick is 4.5%.