Cities with the Largest Samoan Community in Washington
RELATED REPORTS & OPTIONS
Samoan
Washington
Compare Cities
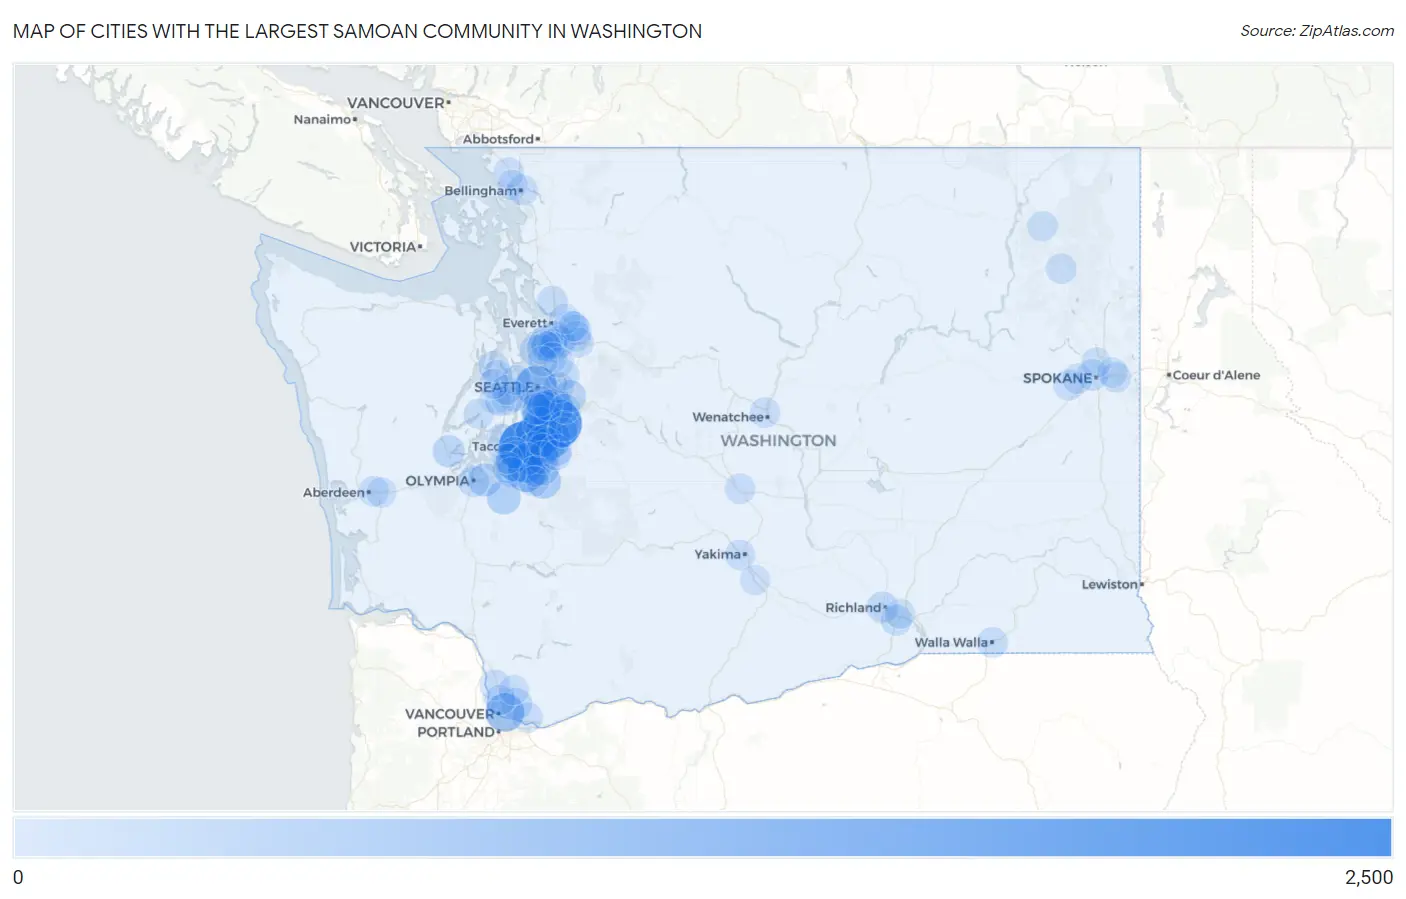
Map of Cities with the Largest Samoan Community in Washington
0
2,500
Cities with the Largest Samoan Community in Washington
| City | Samoan | vs State | vs National | |
| 1. | Tacoma | 2,027 | 25,010(8.10%)#1 | 228,399(0.89%)#8 |
| 2. | Kent | 1,922 | 25,010(7.68%)#2 | 228,399(0.84%)#9 |
| 3. | Federal Way | 1,345 | 25,010(5.38%)#3 | 228,399(0.59%)#21 |
| 4. | Seattle | 1,164 | 25,010(4.65%)#4 | 228,399(0.51%)#26 |
| 5. | Lakewood | 1,059 | 25,010(4.23%)#5 | 228,399(0.46%)#28 |
| 6. | Auburn | 898 | 25,010(3.59%)#6 | 228,399(0.39%)#37 |
| 7. | Spanaway | 891 | 25,010(3.56%)#7 | 228,399(0.39%)#38 |
| 8. | Vancouver | 863 | 25,010(3.45%)#8 | 228,399(0.38%)#42 |
| 9. | Parkland | 858 | 25,010(3.43%)#9 | 228,399(0.38%)#44 |
| 10. | Renton | 840 | 25,010(3.36%)#10 | 228,399(0.37%)#45 |
| 11. | Seatac | 829 | 25,010(3.31%)#11 | 228,399(0.36%)#47 |
| 12. | Lakeland North | 555 | 25,010(2.22%)#12 | 228,399(0.24%)#75 |
| 13. | Tukwila | 529 | 25,010(2.12%)#13 | 228,399(0.23%)#80 |
| 14. | Graham | 459 | 25,010(1.84%)#14 | 228,399(0.20%)#93 |
| 15. | Fife | 443 | 25,010(1.77%)#15 | 228,399(0.19%)#98 |
| 16. | Des Moines | 420 | 25,010(1.68%)#16 | 228,399(0.18%)#105 |
| 17. | Pacific | 385 | 25,010(1.54%)#17 | 228,399(0.17%)#119 |
| 18. | Yelm | 373 | 25,010(1.49%)#18 | 228,399(0.16%)#125 |
| 19. | South Hill | 327 | 25,010(1.31%)#19 | 228,399(0.14%)#142 |
| 20. | Lacey | 314 | 25,010(1.26%)#20 | 228,399(0.14%)#152 |
| 21. | Edgewood | 293 | 25,010(1.17%)#21 | 228,399(0.13%)#159 |
| 22. | Puyallup | 288 | 25,010(1.15%)#22 | 228,399(0.13%)#165 |
| 23. | Lake Stickney | 251 | 25,010(1.00%)#23 | 228,399(0.11%)#186 |
| 24. | Midland | 237 | 25,010(0.95%)#24 | 228,399(0.10%)#198 |
| 25. | Shelton | 226 | 25,010(0.90%)#25 | 228,399(0.10%)#206 |
| 26. | Lakeland South | 221 | 25,010(0.88%)#26 | 228,399(0.10%)#213 |
| 27. | Silver Firs | 215 | 25,010(0.86%)#27 | 228,399(0.09%)#218 |
| 28. | Issaquah | 210 | 25,010(0.84%)#28 | 228,399(0.09%)#227 |
| 29. | Burien | 201 | 25,010(0.80%)#29 | 228,399(0.09%)#233 |
| 30. | Orchards | 172 | 25,010(0.69%)#30 | 228,399(0.08%)#266 |
| 31. | Lake Tapps | 168 | 25,010(0.67%)#31 | 228,399(0.07%)#272 |
| 32. | Everett | 166 | 25,010(0.66%)#32 | 228,399(0.07%)#274 |
| 33. | Richland | 165 | 25,010(0.66%)#33 | 228,399(0.07%)#276 |
| 34. | North Lynnwood | 149 | 25,010(0.60%)#34 | 228,399(0.07%)#300 |
| 35. | Olympia | 143 | 25,010(0.57%)#35 | 228,399(0.06%)#320 |
| 36. | Beacon Hill | 140 | 25,010(0.56%)#36 | 228,399(0.06%)#325 |
| 37. | University Place | 124 | 25,010(0.50%)#37 | 228,399(0.05%)#352 |
| 38. | Spokane | 122 | 25,010(0.49%)#38 | 228,399(0.05%)#359 |
| 39. | Kennewick | 112 | 25,010(0.45%)#39 | 228,399(0.05%)#381 |
| 40. | North Fort Lewis | 112 | 25,010(0.45%)#40 | 228,399(0.05%)#386 |
| 41. | Edmonds | 107 | 25,010(0.43%)#41 | 228,399(0.05%)#402 |
| 42. | Fairchild Afb | 97 | 25,010(0.39%)#42 | 228,399(0.04%)#438 |
| 43. | Bellevue | 91 | 25,010(0.36%)#43 | 228,399(0.04%)#455 |
| 44. | Marysville | 85 | 25,010(0.34%)#44 | 228,399(0.04%)#481 |
| 45. | Frederickson | 84 | 25,010(0.34%)#45 | 228,399(0.04%)#488 |
| 46. | Bryn Mawr Skyway | 80 | 25,010(0.32%)#46 | 228,399(0.04%)#503 |
| 47. | Bremerton | 79 | 25,010(0.32%)#47 | 228,399(0.03%)#506 |
| 48. | Ridgefield | 79 | 25,010(0.32%)#48 | 228,399(0.03%)#507 |
| 49. | Three Lakes | 75 | 25,010(0.30%)#49 | 228,399(0.03%)#529 |
| 50. | Bangor Base | 74 | 25,010(0.30%)#50 | 228,399(0.03%)#532 |
| 51. | Redmond | 72 | 25,010(0.29%)#51 | 228,399(0.03%)#544 |
| 52. | Walla Walla | 70 | 25,010(0.28%)#52 | 228,399(0.03%)#554 |
| 53. | Bellingham | 67 | 25,010(0.27%)#53 | 228,399(0.03%)#563 |
| 54. | Yakima | 63 | 25,010(0.25%)#54 | 228,399(0.03%)#587 |
| 55. | Camas | 62 | 25,010(0.25%)#55 | 228,399(0.03%)#598 |
| 56. | Mill Creek East | 62 | 25,010(0.25%)#56 | 228,399(0.03%)#599 |
| 57. | Ferndale | 57 | 25,010(0.23%)#57 | 228,399(0.02%)#625 |
| 58. | Bonney Lake | 55 | 25,010(0.22%)#58 | 228,399(0.02%)#640 |
| 59. | Ellensburg | 54 | 25,010(0.22%)#59 | 228,399(0.02%)#649 |
| 60. | Chewelah | 54 | 25,010(0.22%)#60 | 228,399(0.02%)#650 |
| 61. | Boulevard Park | 49 | 25,010(0.20%)#61 | 228,399(0.02%)#695 |
| 62. | Chain Lake | 48 | 25,010(0.19%)#62 | 228,399(0.02%)#709 |
| 63. | Elk Plain | 47 | 25,010(0.19%)#63 | 228,399(0.02%)#714 |
| 64. | Salmon Creek | 46 | 25,010(0.18%)#64 | 228,399(0.02%)#720 |
| 65. | Lake Morton Berrydale | 46 | 25,010(0.18%)#65 | 228,399(0.02%)#723 |
| 66. | Manchester | 46 | 25,010(0.18%)#66 | 228,399(0.02%)#724 |
| 67. | Covington | 45 | 25,010(0.18%)#67 | 228,399(0.02%)#731 |
| 68. | Wenatchee | 44 | 25,010(0.18%)#68 | 228,399(0.02%)#739 |
| 69. | Aberdeen | 43 | 25,010(0.17%)#69 | 228,399(0.02%)#750 |
| 70. | Eastmont | 42 | 25,010(0.17%)#70 | 228,399(0.02%)#763 |
| 71. | Spokane Valley | 37 | 25,010(0.15%)#71 | 228,399(0.02%)#813 |
| 72. | Parkwood | 37 | 25,010(0.15%)#72 | 228,399(0.02%)#825 |
| 73. | Fort Lewis | 36 | 25,010(0.14%)#73 | 228,399(0.02%)#841 |
| 74. | Airway Heights | 36 | 25,010(0.14%)#74 | 228,399(0.02%)#843 |
| 75. | Colville | 36 | 25,010(0.14%)#75 | 228,399(0.02%)#846 |
| 76. | Belfair | 35 | 25,010(0.14%)#76 | 228,399(0.02%)#860 |
| 77. | Central Park | 33 | 25,010(0.13%)#77 | 228,399(0.01%)#879 |
| 78. | Battle Ground | 28 | 25,010(0.11%)#78 | 228,399(0.01%)#941 |
| 79. | Wapato | 27 | 25,010(0.11%)#79 | 228,399(0.01%)#968 |
| 80. | Silverdale | 26 | 25,010(0.10%)#80 | 228,399(0.01%)#981 |
| 81. | Port Orchard | 26 | 25,010(0.10%)#81 | 228,399(0.01%)#983 |
| 82. | Marietta Alderwood | 26 | 25,010(0.10%)#82 | 228,399(0.01%)#991 |
| 83. | Lynnwood | 25 | 25,010(0.10%)#83 | 228,399(0.01%)#998 |
| 84. | Mill Creek | 25 | 25,010(0.10%)#84 | 228,399(0.01%)#1,002 |
| 85. | Monroe | 25 | 25,010(0.10%)#85 | 228,399(0.01%)#1,004 |
| 86. | East Renton Highlands | 25 | 25,010(0.10%)#86 | 228,399(0.01%)#1,009 |
| 87. | Artondale | 24 | 25,010(0.10%)#87 | 228,399(0.01%)#1,025 |
| 88. | Bainbridge Island | 23 | 25,010(0.09%)#88 | 228,399(0.01%)#1,039 |
| 89. | Lake Stevens | 22 | 25,010(0.09%)#89 | 228,399(0.01%)#1,061 |
| 90. | Larch Way | 22 | 25,010(0.09%)#90 | 228,399(0.01%)#1,076 |
| 91. | Millwood | 22 | 25,010(0.09%)#91 | 228,399(0.01%)#1,079 |
| 92. | Enetai | 21 | 25,010(0.08%)#92 | 228,399(0.01%)#1,100 |
| 93. | Pasco | 20 | 25,010(0.08%)#93 | 228,399(0.01%)#1,103 |
| 94. | Woodinville | 20 | 25,010(0.08%)#94 | 228,399(0.01%)#1,117 |
| 95. | Snohomish | 20 | 25,010(0.08%)#95 | 228,399(0.01%)#1,120 |
| 96. | Steilacoom | 19 | 25,010(0.08%)#96 | 228,399(0.01%)#1,150 |
| 97. | Bothell | 18 | 25,010(0.07%)#97 | 228,399(0.01%)#1,163 |
| 98. | Country Homes | 18 | 25,010(0.07%)#98 | 228,399(0.01%)#1,177 |
| 99. | Lake Forest Park | 17 | 25,010(0.07%)#99 | 228,399(0.01%)#1,193 |
| 100. | Chico | 17 | 25,010(0.07%)#100 | 228,399(0.01%)#1,200 |
Common Questions
What are the Top 10 Cities with the Largest Samoan Community in Washington?
Top 10 Cities with the Largest Samoan Community in Washington are:
What city has the Largest Samoan Community in Washington?
Tacoma has the Largest Samoan Community in Washington with 2,027.
What is the Total Samoan Population in the State of Washington?
Total Samoan Population in Washington is 25,010.
What is the Total Samoan Population in the United States?
Total Samoan Population in the United States is 228,399.