Cities with the Highest Percentage of Population Employed in Life, Physical & Social Science in Washington
RELATED REPORTS & OPTIONS
Life, Physical & Social Science
Washington
Compare Cities
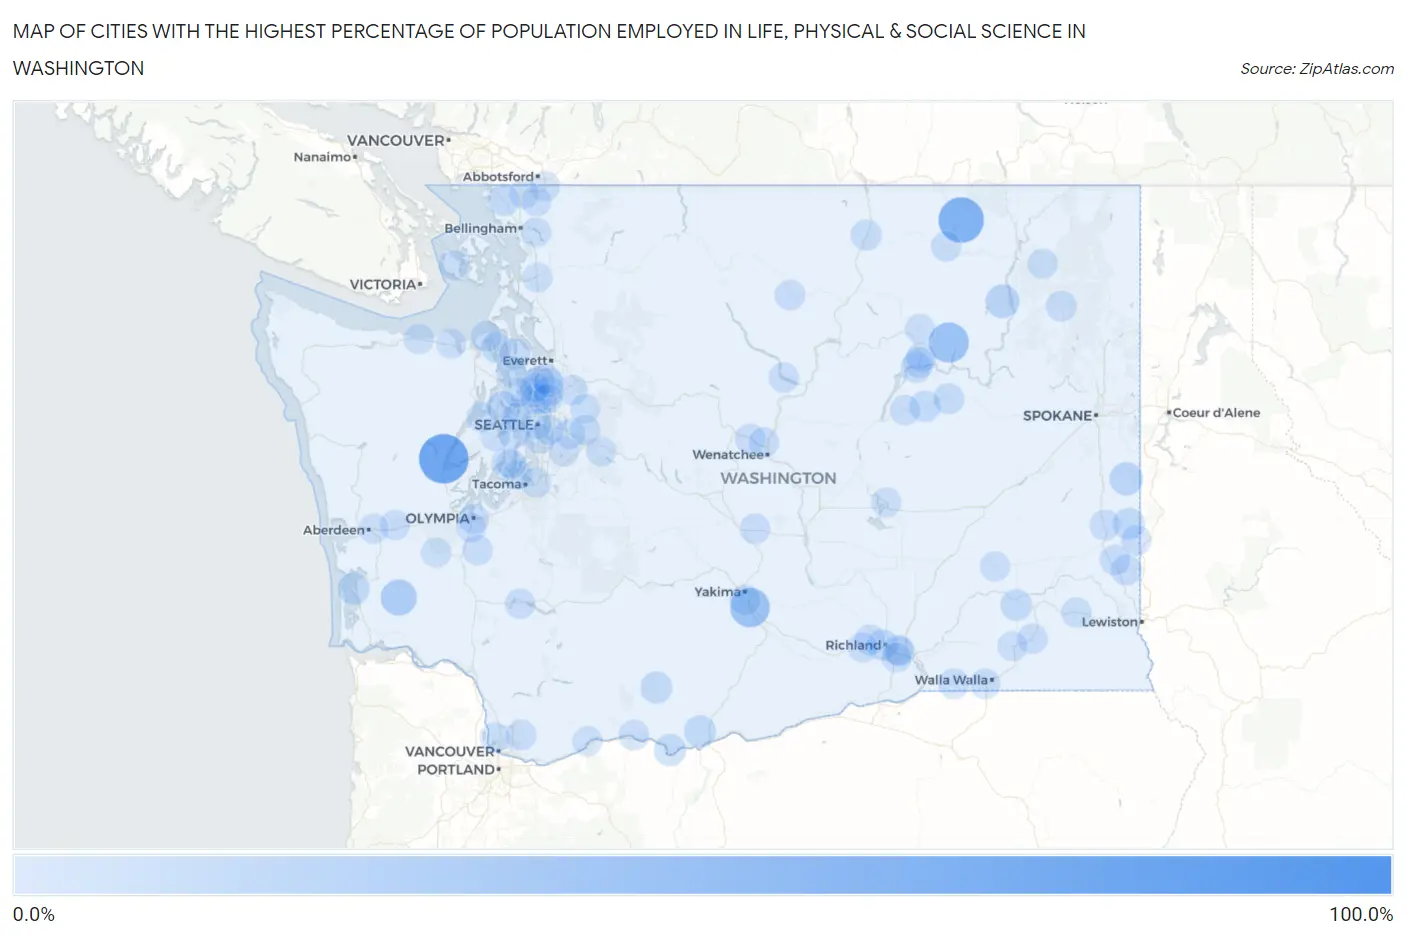
Map of Cities with the Highest Percentage of Population Employed in Life, Physical & Social Science in Washington
0.0%
100.0%
Cities with the Highest Percentage of Population Employed in Life, Physical & Social Science in Washington
| City | % Employed | vs State | vs National | |
| 1. | Wheeler | 100.0% | 1.3%(+98.7)#1 | 1.1%(+98.9)#1 |
| 2. | Hoodsport | 73.0% | 1.3%(+71.7)#2 | 1.1%(+71.9)#6 |
| 3. | Malo | 57.1% | 1.3%(+55.8)#3 | 1.1%(+56.1)#9 |
| 4. | Keller | 38.0% | 1.3%(+36.7)#4 | 1.1%(+36.9)#28 |
| 5. | Parker | 35.5% | 1.3%(+34.2)#5 | 1.1%(+34.4)#32 |
| 6. | Lebam | 23.5% | 1.3%(+22.2)#6 | 1.1%(+22.4)#58 |
| 7. | Inchelium | 14.1% | 1.3%(+12.8)#7 | 1.1%(+13.0)#139 |
| 8. | Latah | 12.8% | 1.3%(+11.5)#8 | 1.1%(+11.7)#164 |
| 9. | Keyport | 11.7% | 1.3%(+10.4)#9 | 1.1%(+10.6)#181 |
| 10. | Centerville | 9.0% | 1.3%(+7.64)#10 | 1.1%(+7.86)#285 |
| 11. | Glenwood | 8.8% | 1.3%(+7.54)#11 | 1.1%(+7.76)#290 |
| 12. | Bay Center | 8.7% | 1.3%(+7.38)#12 | 1.1%(+7.60)#294 |
| 13. | Dallesport | 8.3% | 1.3%(+6.98)#13 | 1.1%(+7.20)#323 |
| 14. | Garfield | 8.1% | 1.3%(+6.82)#14 | 1.1%(+7.04)#331 |
| 15. | Custer | 7.1% | 1.3%(+5.79)#15 | 1.1%(+6.01)#421 |
| 16. | Starbuck | 7.0% | 1.3%(+5.71)#16 | 1.1%(+5.93)#433 |
| 17. | Almira | 6.2% | 1.3%(+4.94)#17 | 1.1%(+5.16)#542 |
| 18. | Richland | 6.2% | 1.3%(+4.88)#18 | 1.1%(+5.10)#553 |
| 19. | Wilbur | 5.4% | 1.3%(+4.05)#19 | 1.1%(+4.27)#701 |
| 20. | Tonasket | 4.8% | 1.3%(+3.48)#20 | 1.1%(+3.70)#849 |
| 21. | Grand Coulee | 4.7% | 1.3%(+3.36)#21 | 1.1%(+3.58)#883 |
| 22. | Pullman | 4.6% | 1.3%(+3.27)#22 | 1.1%(+3.49)#915 |
| 23. | Freeland | 4.4% | 1.3%(+3.13)#23 | 1.1%(+3.35)#973 |
| 24. | Union Gap | 4.4% | 1.3%(+3.11)#24 | 1.1%(+3.33)#988 |
| 25. | Meadowdale | 4.3% | 1.3%(+2.96)#25 | 1.1%(+3.18)#1,049 |
| 26. | Chewelah | 4.3% | 1.3%(+2.95)#26 | 1.1%(+3.17)#1,051 |
| 27. | Steptoe | 4.2% | 1.3%(+2.86)#27 | 1.1%(+3.08)#1,092 |
| 28. | Albion | 4.0% | 1.3%(+2.70)#28 | 1.1%(+2.92)#1,155 |
| 29. | Twisp | 4.0% | 1.3%(+2.65)#29 | 1.1%(+2.87)#1,192 |
| 30. | Touchet | 3.9% | 1.3%(+2.64)#30 | 1.1%(+2.86)#1,196 |
| 31. | Coulee Dam | 3.9% | 1.3%(+2.56)#31 | 1.1%(+2.78)#1,241 |
| 32. | Marrowstone | 3.8% | 1.3%(+2.49)#32 | 1.1%(+2.71)#1,274 |
| 33. | West Richland | 3.8% | 1.3%(+2.45)#33 | 1.1%(+2.67)#1,291 |
| 34. | West Pasco | 3.7% | 1.3%(+2.39)#34 | 1.1%(+2.61)#1,319 |
| 35. | Hockinson | 3.7% | 1.3%(+2.37)#35 | 1.1%(+2.59)#1,351 |
| 36. | Woodway | 3.6% | 1.3%(+2.28)#36 | 1.1%(+2.50)#1,402 |
| 37. | High Bridge | 3.6% | 1.3%(+2.27)#37 | 1.1%(+2.49)#1,409 |
| 38. | Port Townsend | 3.6% | 1.3%(+2.27)#38 | 1.1%(+2.49)#1,412 |
| 39. | White Salmon | 3.5% | 1.3%(+2.18)#39 | 1.1%(+2.40)#1,489 |
| 40. | Palouse | 3.3% | 1.3%(+2.03)#40 | 1.1%(+2.25)#1,579 |
| 41. | Manchester | 3.2% | 1.3%(+1.92)#41 | 1.1%(+2.14)#1,672 |
| 42. | Manson | 3.2% | 1.3%(+1.91)#42 | 1.1%(+2.13)#1,674 |
| 43. | Lake Forest Park | 3.2% | 1.3%(+1.88)#43 | 1.1%(+2.10)#1,702 |
| 44. | Shoreline | 3.2% | 1.3%(+1.88)#44 | 1.1%(+2.10)#1,705 |
| 45. | Cashmere | 3.2% | 1.3%(+1.84)#45 | 1.1%(+2.06)#1,733 |
| 46. | Olympia | 3.1% | 1.3%(+1.82)#46 | 1.1%(+2.04)#1,758 |
| 47. | Dayton | 3.1% | 1.3%(+1.82)#47 | 1.1%(+2.04)#1,759 |
| 48. | Sunnyslope | 3.1% | 1.3%(+1.80)#48 | 1.1%(+2.02)#1,785 |
| 49. | Kittitas | 3.1% | 1.3%(+1.76)#49 | 1.1%(+1.98)#1,822 |
| 50. | College Place | 3.0% | 1.3%(+1.67)#50 | 1.1%(+1.89)#1,901 |
| 51. | Tenino | 3.0% | 1.3%(+1.65)#51 | 1.1%(+1.87)#1,918 |
| 52. | Republic | 2.9% | 1.3%(+1.55)#52 | 1.1%(+1.77)#2,004 |
| 53. | Hartline | 2.9% | 1.3%(+1.55)#53 | 1.1%(+1.77)#2,008 |
| 54. | Issaquah | 2.8% | 1.3%(+1.53)#54 | 1.1%(+1.75)#2,022 |
| 55. | Mossyrock | 2.8% | 1.3%(+1.51)#55 | 1.1%(+1.73)#2,050 |
| 56. | Fall City | 2.7% | 1.3%(+1.44)#56 | 1.1%(+1.66)#2,160 |
| 57. | Seattle | 2.7% | 1.3%(+1.42)#57 | 1.1%(+1.64)#2,182 |
| 58. | Colville | 2.7% | 1.3%(+1.42)#58 | 1.1%(+1.64)#2,190 |
| 59. | Fife Heights | 2.7% | 1.3%(+1.39)#59 | 1.1%(+1.61)#2,218 |
| 60. | Montesano | 2.7% | 1.3%(+1.35)#60 | 1.1%(+1.57)#2,270 |
| 61. | Pomeroy | 2.7% | 1.3%(+1.34)#61 | 1.1%(+1.56)#2,274 |
| 62. | Hansville | 2.6% | 1.3%(+1.34)#62 | 1.1%(+1.56)#2,288 |
| 63. | Bothell West | 2.6% | 1.3%(+1.24)#63 | 1.1%(+1.46)#2,427 |
| 64. | Canterwood | 2.5% | 1.3%(+1.23)#64 | 1.1%(+1.45)#2,449 |
| 65. | Tumwater | 2.5% | 1.3%(+1.22)#65 | 1.1%(+1.44)#2,467 |
| 66. | Port Angeles East | 2.5% | 1.3%(+1.21)#66 | 1.1%(+1.43)#2,497 |
| 67. | Stevenson | 2.5% | 1.3%(+1.19)#67 | 1.1%(+1.41)#2,520 |
| 68. | Benton City | 2.5% | 1.3%(+1.16)#68 | 1.1%(+1.38)#2,570 |
| 69. | Oakville | 2.4% | 1.3%(+1.11)#69 | 1.1%(+1.33)#2,654 |
| 70. | Ruston | 2.4% | 1.3%(+1.05)#70 | 1.1%(+1.27)#2,751 |
| 71. | Lake Stickney | 2.4% | 1.3%(+1.05)#71 | 1.1%(+1.27)#2,762 |
| 72. | Pasco | 2.3% | 1.3%(+1.03)#72 | 1.1%(+1.25)#2,791 |
| 73. | Kenmore | 2.3% | 1.3%(+1.02)#73 | 1.1%(+1.24)#2,807 |
| 74. | Washtucna | 2.3% | 1.3%(+1.01)#74 | 1.1%(+1.23)#2,822 |
| 75. | Edmonds | 2.3% | 1.3%(+0.946)#75 | 1.1%(+1.17)#2,933 |
| 76. | Burlington | 2.2% | 1.3%(+0.922)#76 | 1.1%(+1.14)#2,978 |
| 77. | Sudden Valley | 2.2% | 1.3%(+0.912)#77 | 1.1%(+1.13)#2,993 |
| 78. | Elmer City | 2.2% | 1.3%(+0.911)#78 | 1.1%(+1.13)#3,000 |
| 79. | Felida | 2.2% | 1.3%(+0.873)#79 | 1.1%(+1.09)#3,066 |
| 80. | Maple Heights Lake Desire | 2.2% | 1.3%(+0.863)#80 | 1.1%(+1.08)#3,084 |
| 81. | Nespelem | 2.2% | 1.3%(+0.863)#81 | 1.1%(+1.08)#3,090 |
| 82. | Friday Harbor | 2.2% | 1.3%(+0.852)#82 | 1.1%(+1.07)#3,117 |
| 83. | Moses Lake | 2.1% | 1.3%(+0.837)#83 | 1.1%(+1.06)#3,135 |
| 84. | Sequim | 2.1% | 1.3%(+0.836)#84 | 1.1%(+1.06)#3,137 |
| 85. | Bremerton | 2.1% | 1.3%(+0.835)#85 | 1.1%(+1.05)#3,139 |
| 86. | Sumas | 2.1% | 1.3%(+0.817)#86 | 1.1%(+1.04)#3,171 |
| 87. | Seabeck | 2.1% | 1.3%(+0.811)#87 | 1.1%(+1.03)#3,181 |
| 88. | Bainbridge Island | 2.1% | 1.3%(+0.783)#88 | 1.1%(+1.00)#3,238 |
| 89. | Waitsburg | 2.1% | 1.3%(+0.778)#89 | 1.1%(+0.998)#3,247 |
| 90. | Wilderness Rim | 2.1% | 1.3%(+0.744)#90 | 1.1%(+0.964)#3,305 |
| 91. | Aberdeen | 2.1% | 1.3%(+0.743)#91 | 1.1%(+0.963)#3,308 |
| 92. | Kennewick | 2.0% | 1.3%(+0.666)#92 | 1.1%(+0.887)#3,479 |
| 93. | Kingston | 2.0% | 1.3%(+0.660)#93 | 1.1%(+0.880)#3,494 |
| 94. | Boulevard Park | 1.9% | 1.3%(+0.634)#94 | 1.1%(+0.855)#3,552 |
| 95. | Lynden | 1.9% | 1.3%(+0.607)#95 | 1.1%(+0.827)#3,611 |
| 96. | Everson | 1.9% | 1.3%(+0.604)#96 | 1.1%(+0.824)#3,619 |
| 97. | Lake Marcel Stillwater | 1.9% | 1.3%(+0.580)#97 | 1.1%(+0.801)#3,682 |
| 98. | Martha Lake | 1.8% | 1.3%(+0.532)#98 | 1.1%(+0.752)#3,819 |
| 99. | Mercer Island | 1.8% | 1.3%(+0.522)#99 | 1.1%(+0.742)#3,838 |
| 100. | Maplewood | 1.8% | 1.3%(+0.507)#100 | 1.1%(+0.727)#3,873 |
Common Questions
What are the Top 10 Cities with the Highest Percentage of Population Employed in Life, Physical & Social Science in Washington?
Top 10 Cities with the Highest Percentage of Population Employed in Life, Physical & Social Science in Washington are:
What city has the Highest Percentage of Population Employed in Life, Physical & Social Science in Washington?
Hoodsport has the Highest Percentage of Population Employed in Life, Physical & Social Science in Washington with 73.0%.
What is the Percentage of Population Employed in Life, Physical & Social Science in the State of Washington?
Percentage of Population Employed in Life, Physical & Social Science in Washington is 1.3%.
What is the Percentage of Population Employed in Life, Physical & Social Science in the United States?
Percentage of Population Employed in Life, Physical & Social Science in the United States is 1.1%.