Cities with the Highest Percentage of Renter-Occupied Units in Washington
RELATED REPORTS & OPTIONS
Highest Renter-Occupied
Washington
Compare Cities
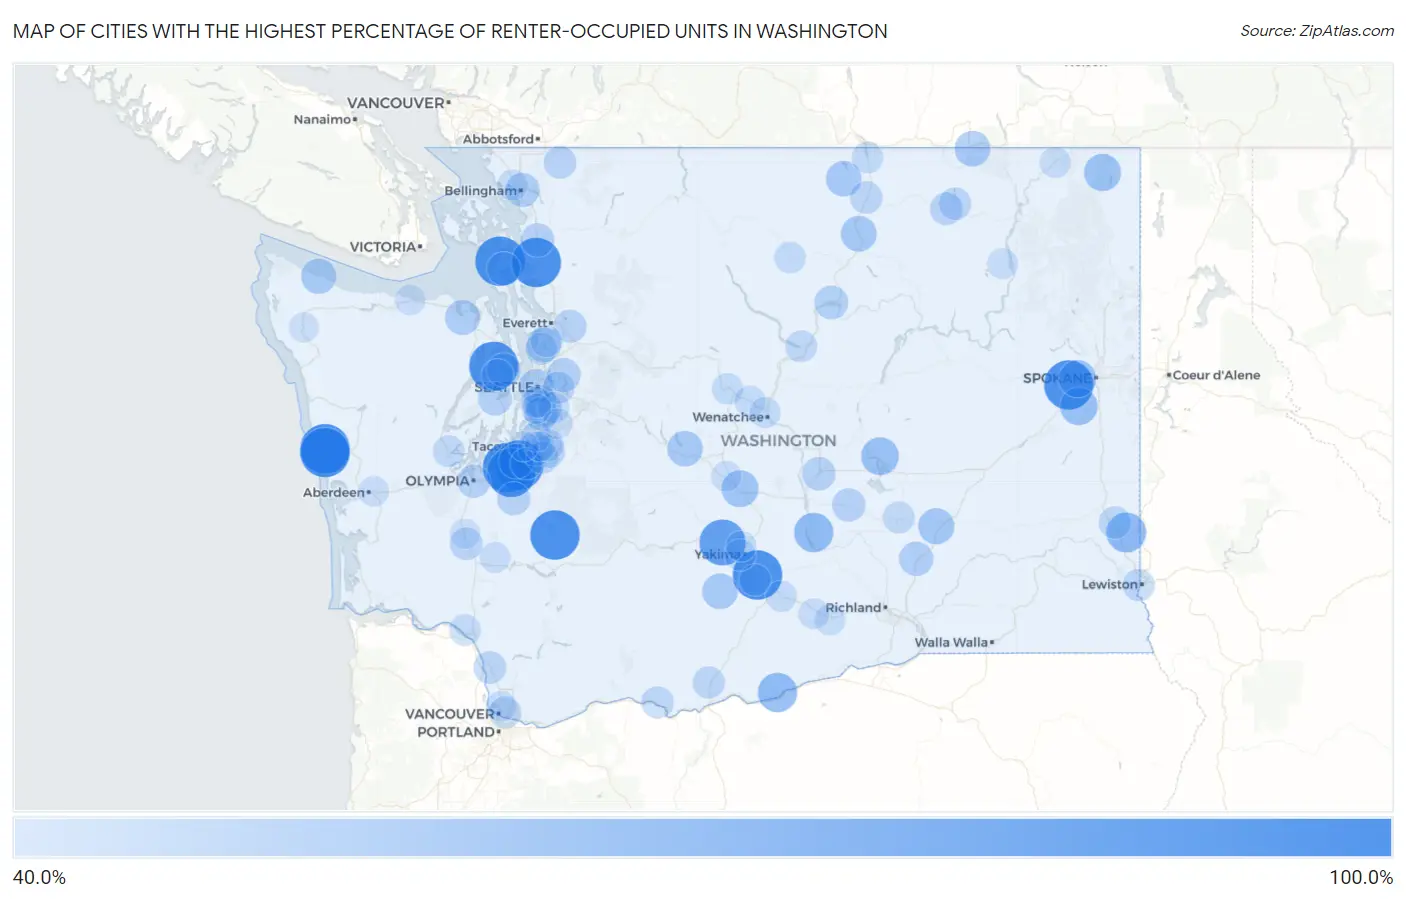
Map of Cities with the Highest Percentage of Renter-Occupied Units in Washington
0.0%
100.0%
Cities with the Highest Percentage of Renter-Occupied Units in Washington
| City | % Renter-Occupied | vs State | vs National | |
| 1. | North Fort Lewis | 100.0% | 36.2%(+63.8)#1 | 35.2%(+64.8)#12 |
| 2. | Mcchord Afb | 100.0% | 36.2%(+63.8)#2 | 35.2%(+64.8)#28 |
| 3. | Whidbey Island Station | 100.0% | 36.2%(+63.8)#3 | 35.2%(+64.8)#35 |
| 4. | Donald | 100.0% | 36.2%(+63.8)#4 | 35.2%(+64.8)#104 |
| 5. | Moclips | 100.0% | 36.2%(+63.8)#5 | 35.2%(+64.8)#132 |
| 6. | Pacific Beach | 100.0% | 36.2%(+63.8)#6 | 35.2%(+64.8)#136 |
| 7. | Mineral | 100.0% | 36.2%(+63.8)#7 | 35.2%(+64.8)#143 |
| 8. | Conway | 100.0% | 36.2%(+63.8)#8 | 35.2%(+64.8)#162 |
| 9. | Fairchild Afb | 99.4% | 36.2%(+63.1)#9 | 35.2%(+64.2)#242 |
| 10. | Bangor Base | 99.0% | 36.2%(+62.8)#10 | 35.2%(+63.8)#253 |
| 11. | Fort Lewis | 98.6% | 36.2%(+62.4)#11 | 35.2%(+63.4)#263 |
| 12. | Cowiche | 89.5% | 36.2%(+53.2)#12 | 35.2%(+54.3)#335 |
| 13. | Pullman | 70.8% | 36.2%(+34.6)#13 | 35.2%(+35.7)#676 |
| 14. | Roosevelt | 69.2% | 36.2%(+33.0)#14 | 35.2%(+34.0)#748 |
| 15. | Mattawa | 69.1% | 36.2%(+32.8)#15 | 35.2%(+33.9)#760 |
| 16. | Moses Lake North | 64.7% | 36.2%(+28.5)#16 | 35.2%(+29.5)#969 |
| 17. | Cheney | 64.6% | 36.2%(+28.4)#17 | 35.2%(+29.4)#979 |
| 18. | Airway Heights | 63.9% | 36.2%(+27.7)#18 | 35.2%(+28.7)#1,031 |
| 19. | Metaline Falls | 62.9% | 36.2%(+26.7)#19 | 35.2%(+27.8)#1,111 |
| 20. | Ellensburg | 62.3% | 36.2%(+26.1)#20 | 35.2%(+27.1)#1,166 |
| 21. | Hatton | 60.0% | 36.2%(+23.8)#21 | 35.2%(+24.8)#1,365 |
| 22. | Riverside | 59.0% | 36.2%(+22.7)#22 | 35.2%(+23.8)#1,484 |
| 23. | White Swan | 58.6% | 36.2%(+22.4)#23 | 35.2%(+23.4)#1,520 |
| 24. | Ronald | 58.5% | 36.2%(+22.2)#24 | 35.2%(+23.3)#1,538 |
| 25. | Loomis | 58.3% | 36.2%(+22.1)#25 | 35.2%(+23.1)#1,547 |
| 26. | Danville | 58.3% | 36.2%(+22.1)#26 | 35.2%(+23.1)#1,548 |
| 27. | Tukwila | 57.6% | 36.2%(+21.4)#27 | 35.2%(+22.4)#1,657 |
| 28. | Clallam Bay | 57.3% | 36.2%(+21.1)#28 | 35.2%(+22.1)#1,691 |
| 29. | Blyn | 56.7% | 36.2%(+20.4)#29 | 35.2%(+21.5)#1,771 |
| 30. | Lakewood | 56.4% | 36.2%(+20.2)#30 | 35.2%(+21.2)#1,802 |
| 31. | Seattle | 55.5% | 36.2%(+19.3)#31 | 35.2%(+20.4)#1,947 |
| 32. | North Lynnwood | 55.1% | 36.2%(+18.9)#32 | 35.2%(+19.9)#2,020 |
| 33. | Mesa | 54.8% | 36.2%(+18.6)#33 | 35.2%(+19.6)#2,065 |
| 34. | Bellingham | 54.4% | 36.2%(+18.2)#34 | 35.2%(+19.3)#2,120 |
| 35. | Fife | 53.8% | 36.2%(+17.6)#35 | 35.2%(+18.6)#2,215 |
| 36. | Bremerton | 53.4% | 36.2%(+17.2)#36 | 35.2%(+18.3)#2,281 |
| 37. | Brewster | 53.4% | 36.2%(+17.2)#37 | 35.2%(+18.2)#2,288 |
| 38. | Redmond | 53.4% | 36.2%(+17.2)#38 | 35.2%(+18.2)#2,293 |
| 39. | Seatac | 53.1% | 36.2%(+16.9)#39 | 35.2%(+18.0)#2,347 |
| 40. | Keyport | 52.9% | 36.2%(+16.7)#40 | 35.2%(+17.7)#2,404 |
| 41. | Kitsap Lake | 52.8% | 36.2%(+16.5)#41 | 35.2%(+17.6)#2,431 |
| 42. | Oak Harbor | 52.7% | 36.2%(+16.5)#42 | 35.2%(+17.5)#2,434 |
| 43. | Burlington | 52.7% | 36.2%(+16.5)#43 | 35.2%(+17.5)#2,441 |
| 44. | George | 52.6% | 36.2%(+16.4)#44 | 35.2%(+17.4)#2,450 |
| 45. | Royal City | 52.1% | 36.2%(+15.9)#45 | 35.2%(+16.9)#2,573 |
| 46. | Mckenna | 51.8% | 36.2%(+15.6)#46 | 35.2%(+16.6)#2,623 |
| 47. | Olympia | 51.7% | 36.2%(+15.5)#47 | 35.2%(+16.5)#2,646 |
| 48. | Everett | 51.5% | 36.2%(+15.3)#48 | 35.2%(+16.3)#2,705 |
| 49. | Kendall | 50.3% | 36.2%(+14.1)#49 | 35.2%(+15.2)#3,000 |
| 50. | Chehalis | 50.3% | 36.2%(+14.1)#50 | 35.2%(+15.1)#3,011 |
| 51. | Boulevard Park | 50.2% | 36.2%(+14.0)#51 | 35.2%(+15.1)#3,031 |
| 52. | Republic | 50.2% | 36.2%(+14.0)#52 | 35.2%(+15.0)#3,038 |
| 53. | Torboy | 50.0% | 36.2%(+13.8)#53 | 35.2%(+14.8)#3,099 |
| 54. | Sumner | 50.0% | 36.2%(+13.8)#54 | 35.2%(+14.8)#3,150 |
| 55. | Woodland | 49.9% | 36.2%(+13.6)#55 | 35.2%(+14.7)#3,169 |
| 56. | Tonasket | 49.7% | 36.2%(+13.4)#56 | 35.2%(+14.5)#3,209 |
| 57. | Albion | 49.4% | 36.2%(+13.1)#57 | 35.2%(+14.2)#3,283 |
| 58. | Goldendale | 49.1% | 36.2%(+12.9)#58 | 35.2%(+13.9)#3,339 |
| 59. | Vancouver | 49.1% | 36.2%(+12.9)#59 | 35.2%(+13.9)#3,344 |
| 60. | Lyle | 48.9% | 36.2%(+12.7)#60 | 35.2%(+13.7)#3,399 |
| 61. | Pacific | 48.8% | 36.2%(+12.6)#61 | 35.2%(+13.6)#3,436 |
| 62. | Clarkston | 48.7% | 36.2%(+12.5)#62 | 35.2%(+13.6)#3,461 |
| 63. | Puyallup | 48.7% | 36.2%(+12.5)#63 | 35.2%(+13.5)#3,475 |
| 64. | Bellevue | 48.3% | 36.2%(+12.1)#64 | 35.2%(+13.2)#3,575 |
| 65. | Othello | 48.0% | 36.2%(+11.8)#65 | 35.2%(+12.9)#3,664 |
| 66. | Shelton | 47.9% | 36.2%(+11.7)#66 | 35.2%(+12.7)#3,713 |
| 67. | Lynnwood | 47.7% | 36.2%(+11.5)#67 | 35.2%(+12.5)#3,787 |
| 68. | Silverdale | 47.6% | 36.2%(+11.4)#68 | 35.2%(+12.4)#3,819 |
| 69. | Lake Stickney | 47.5% | 36.2%(+11.3)#69 | 35.2%(+12.3)#3,849 |
| 70. | Wapato | 47.5% | 36.2%(+11.3)#70 | 35.2%(+12.3)#3,850 |
| 71. | Chelan | 47.4% | 36.2%(+11.2)#71 | 35.2%(+12.2)#3,872 |
| 72. | Longview | 47.3% | 36.2%(+11.1)#72 | 35.2%(+12.1)#3,904 |
| 73. | Oroville | 47.3% | 36.2%(+11.1)#73 | 35.2%(+12.1)#3,912 |
| 74. | Parkland | 46.9% | 36.2%(+10.7)#74 | 35.2%(+11.7)#4,045 |
| 75. | Twisp | 46.9% | 36.2%(+10.7)#75 | 35.2%(+11.7)#4,048 |
| 76. | Yakima | 46.9% | 36.2%(+10.7)#76 | 35.2%(+11.7)#4,053 |
| 77. | Leavenworth | 46.5% | 36.2%(+10.3)#77 | 35.2%(+11.4)#4,172 |
| 78. | Renton | 46.4% | 36.2%(+10.2)#78 | 35.2%(+11.2)#4,208 |
| 79. | Granger | 45.8% | 36.2%(+9.63)#79 | 35.2%(+10.7)#4,397 |
| 80. | Cashmere | 45.8% | 36.2%(+9.61)#80 | 35.2%(+10.6)#4,404 |
| 81. | Wenatchee | 45.6% | 36.2%(+9.36)#81 | 35.2%(+10.4)#4,483 |
| 82. | Northport | 45.5% | 36.2%(+9.24)#82 | 35.2%(+10.3)#4,517 |
| 83. | White Center | 45.5% | 36.2%(+9.24)#83 | 35.2%(+10.3)#4,526 |
| 84. | Onalaska | 45.0% | 36.2%(+8.82)#84 | 35.2%(+9.86)#4,672 |
| 85. | Inchelium | 45.0% | 36.2%(+8.78)#85 | 35.2%(+9.82)#4,689 |
| 86. | Marietta Alderwood | 44.9% | 36.2%(+8.67)#86 | 35.2%(+9.70)#4,729 |
| 87. | Prosser | 44.7% | 36.2%(+8.48)#87 | 35.2%(+9.52)#4,795 |
| 88. | Selah | 44.6% | 36.2%(+8.43)#88 | 35.2%(+9.46)#4,816 |
| 89. | Federal Way | 44.6% | 36.2%(+8.39)#89 | 35.2%(+9.42)#4,833 |
| 90. | Grandview | 44.5% | 36.2%(+8.29)#90 | 35.2%(+9.33)#4,860 |
| 91. | Aberdeen | 44.4% | 36.2%(+8.19)#91 | 35.2%(+9.22)#4,908 |
| 92. | Port Angeles | 44.4% | 36.2%(+8.14)#92 | 35.2%(+9.18)#4,923 |
| 93. | Hazel Dell | 44.3% | 36.2%(+8.08)#93 | 35.2%(+9.12)#4,955 |
| 94. | Kent | 44.2% | 36.2%(+7.95)#94 | 35.2%(+8.99)#5,003 |
| 95. | Thorp | 44.0% | 36.2%(+7.78)#95 | 35.2%(+8.82)#5,054 |
| 96. | Milton | 43.4% | 36.2%(+7.18)#96 | 35.2%(+8.21)#5,312 |
| 97. | Burien | 43.3% | 36.2%(+7.11)#97 | 35.2%(+8.14)#5,333 |
| 98. | Centralia | 43.3% | 36.2%(+7.06)#98 | 35.2%(+8.10)#5,349 |
| 99. | Tacoma | 43.2% | 36.2%(+6.99)#99 | 35.2%(+8.02)#5,379 |
| 100. | Forks | 43.1% | 36.2%(+6.87)#100 | 35.2%(+7.90)#5,423 |
Common Questions
What are the Top 10 Cities with the Highest Percentage of Renter-Occupied Units in Washington?
Top 10 Cities with the Highest Percentage of Renter-Occupied Units in Washington are:
#1
100.0%
#2
100.0%
#3
100.0%
#4
100.0%
#5
100.0%
#6
100.0%
#7
100.0%
#8
100.0%
#9
99.4%
#10
99.0%
What city has the Highest Percentage of Renter-Occupied Units in Washington?
North Fort Lewis has the Highest Percentage of Renter-Occupied Units in Washington with 100.0%.
What is the Percentage of Renter-Occupied Units in the State of Washington?
Percentage of Renter-Occupied Units in Washington is 36.2%.
What is the Percentage of Renter-Occupied Units in the United States?
Percentage of Renter-Occupied Units in the United States is 35.2%.