Cities with the Highest Percentage of Nigerian Population in Washington
RELATED REPORTS & OPTIONS
Nigerian
Washington
Compare Cities
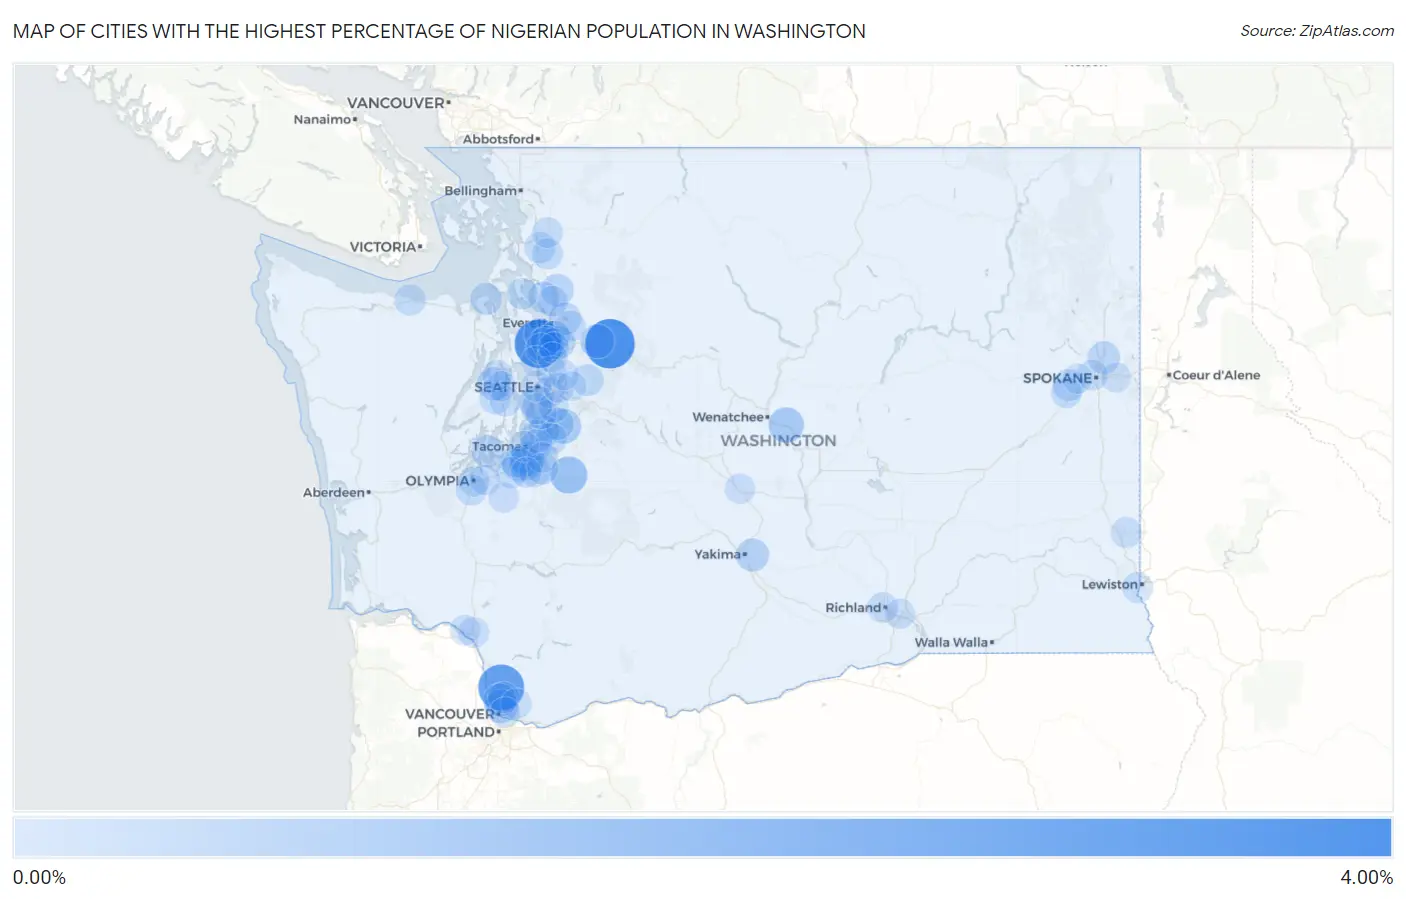
Map of Cities with the Highest Percentage of Nigerian Population in Washington
0.00%
4.00%
Cities with the Highest Percentage of Nigerian Population in Washington
| City | Nigerian | vs State | vs National | |
| 1. | Gold Bar | 3.68% | 0.085%(+3.59)#1 | 0.18%(+3.50)#66 |
| 2. | Meadowdale | 3.44% | 0.085%(+3.35)#2 | 0.18%(+3.26)#77 |
| 3. | Duluth | 2.96% | 0.085%(+2.87)#3 | 0.18%(+2.78)#94 |
| 4. | Carbonado | 1.27% | 0.085%(+1.19)#4 | 0.18%(+1.10)#279 |
| 5. | Rock Island | 0.95% | 0.085%(+0.868)#5 | 0.18%(+0.777)#402 |
| 6. | Covington | 0.85% | 0.085%(+0.766)#6 | 0.18%(+0.675)#452 |
| 7. | Midland | 0.74% | 0.085%(+0.653)#7 | 0.18%(+0.562)#520 |
| 8. | Sultan | 0.71% | 0.085%(+0.629)#8 | 0.18%(+0.538)#538 |
| 9. | North Lynnwood | 0.71% | 0.085%(+0.629)#9 | 0.18%(+0.538)#539 |
| 10. | White Center | 0.64% | 0.085%(+0.555)#10 | 0.18%(+0.464)#602 |
| 11. | Hazel Dell | 0.61% | 0.085%(+0.527)#11 | 0.18%(+0.436)#637 |
| 12. | Chico | 0.59% | 0.085%(+0.500)#12 | 0.18%(+0.409)#682 |
| 13. | Silver Firs | 0.54% | 0.085%(+0.455)#13 | 0.18%(+0.364)#743 |
| 14. | Terrace Heights | 0.53% | 0.085%(+0.447)#14 | 0.18%(+0.356)#751 |
| 15. | Parkland | 0.52% | 0.085%(+0.438)#15 | 0.18%(+0.347)#758 |
| 16. | Salmon Creek | 0.51% | 0.085%(+0.422)#16 | 0.18%(+0.331)#780 |
| 17. | Federal Way | 0.49% | 0.085%(+0.401)#17 | 0.18%(+0.310)#812 |
| 18. | Arlington | 0.44% | 0.085%(+0.355)#18 | 0.18%(+0.263)#887 |
| 19. | Mead | 0.43% | 0.085%(+0.348)#19 | 0.18%(+0.257)#901 |
| 20. | Longbranch | 0.42% | 0.085%(+0.332)#20 | 0.18%(+0.241)#928 |
| 21. | Mcchord Afb | 0.41% | 0.085%(+0.329)#21 | 0.18%(+0.238)#933 |
| 22. | Lake Stevens | 0.41% | 0.085%(+0.322)#22 | 0.18%(+0.231)#949 |
| 23. | Kent | 0.41% | 0.085%(+0.322)#23 | 0.18%(+0.231)#950 |
| 24. | Lake Goodwin | 0.34% | 0.085%(+0.256)#24 | 0.18%(+0.165)#1,096 |
| 25. | Port Townsend | 0.32% | 0.085%(+0.240)#25 | 0.18%(+0.149)#1,138 |
| 26. | Carnation | 0.32% | 0.085%(+0.233)#26 | 0.18%(+0.142)#1,156 |
| 27. | Mukilteo | 0.29% | 0.085%(+0.201)#27 | 0.18%(+0.110)#1,248 |
| 28. | Fairchild Afb | 0.28% | 0.085%(+0.198)#28 | 0.18%(+0.107)#1,253 |
| 29. | Lakewood | 0.28% | 0.085%(+0.192)#29 | 0.18%(+0.101)#1,275 |
| 30. | Lakeland North | 0.27% | 0.085%(+0.183)#30 | 0.18%(+0.092)#1,307 |
| 31. | Frederickson | 0.27% | 0.085%(+0.182)#31 | 0.18%(+0.091)#1,310 |
| 32. | Fife Heights | 0.25% | 0.085%(+0.170)#32 | 0.18%(+0.079)#1,341 |
| 33. | South Hill | 0.25% | 0.085%(+0.169)#33 | 0.18%(+0.078)#1,344 |
| 34. | Auburn | 0.24% | 0.085%(+0.156)#34 | 0.18%(+0.065)#1,391 |
| 35. | Camano | 0.22% | 0.085%(+0.131)#35 | 0.18%(+0.040)#1,483 |
| 36. | Port Angeles | 0.21% | 0.085%(+0.130)#36 | 0.18%(+0.039)#1,484 |
| 37. | Fort Lewis | 0.19% | 0.085%(+0.109)#37 | 0.18%(+0.018)#1,564 |
| 38. | Mount Vista | 0.18% | 0.085%(+0.098)#38 | 0.18%(+0.007)#1,604 |
| 39. | Bremerton | 0.18% | 0.085%(+0.093)#39 | 0.18%(+0.002)#1,644 |
| 40. | Mount Vernon | 0.18% | 0.085%(+0.092)#40 | 0.18%(+0.001)#1,652 |
| 41. | Big Lake | 0.18% | 0.085%(+0.092)#41 | 0.18%(+0.001)#1,653 |
| 42. | Mill Creek | 0.17% | 0.085%(+0.088)#42 | 0.18%(-0.003)#1,665 |
| 43. | Everett | 0.17% | 0.085%(+0.087)#43 | 0.18%(-0.004)#1,678 |
| 44. | Tumwater | 0.17% | 0.085%(+0.083)#44 | 0.18%(-0.008)#1,704 |
| 45. | Medical Lake | 0.16% | 0.085%(+0.078)#45 | 0.18%(-0.013)#1,728 |
| 46. | Pullman | 0.16% | 0.085%(+0.072)#46 | 0.18%(-0.019)#1,761 |
| 47. | West Clarkston Highland | 0.15% | 0.085%(+0.063)#47 | 0.18%(-0.028)#1,822 |
| 48. | Eastmont | 0.14% | 0.085%(+0.053)#48 | 0.18%(-0.038)#1,878 |
| 49. | Sedro Woolley | 0.14% | 0.085%(+0.052)#49 | 0.18%(-0.039)#1,891 |
| 50. | Olympia | 0.13% | 0.085%(+0.049)#50 | 0.18%(-0.042)#1,902 |
| 51. | Seatac | 0.13% | 0.085%(+0.045)#51 | 0.18%(-0.046)#1,939 |
| 52. | Lynnwood | 0.13% | 0.085%(+0.043)#52 | 0.18%(-0.048)#1,949 |
| 53. | Mercer Island | 0.12% | 0.085%(+0.037)#53 | 0.18%(-0.054)#1,989 |
| 54. | Burien | 0.12% | 0.085%(+0.034)#54 | 0.18%(-0.057)#2,007 |
| 55. | Richland | 0.10% | 0.085%(+0.019)#55 | 0.18%(-0.072)#2,104 |
| 56. | Marysville | 0.10% | 0.085%(+0.017)#56 | 0.18%(-0.074)#2,118 |
| 57. | Kirkland | 0.099% | 0.085%(+0.014)#57 | 0.18%(-0.077)#2,137 |
| 58. | Spokane | 0.098% | 0.085%(+0.013)#58 | 0.18%(-0.078)#2,144 |
| 59. | Lake Stickney | 0.095% | 0.085%(+0.011)#59 | 0.18%(-0.080)#2,160 |
| 60. | Kelso | 0.095% | 0.085%(+0.010)#60 | 0.18%(-0.081)#2,165 |
| 61. | Seattle | 0.094% | 0.085%(+0.009)#61 | 0.18%(-0.082)#2,168 |
| 62. | East Port Orchard | 0.091% | 0.085%(+0.006)#62 | 0.18%(-0.085)#2,191 |
| 63. | Lacey | 0.091% | 0.085%(+0.006)#63 | 0.18%(-0.085)#2,197 |
| 64. | Silverdale | 0.087% | 0.085%(+0.003)#64 | 0.18%(-0.088)#2,227 |
| 65. | Shoreline | 0.084% | 0.085%(-0.001)#65 | 0.18%(-0.092)#2,259 |
| 66. | Mill Creek East | 0.083% | 0.085%(-0.002)#66 | 0.18%(-0.093)#2,261 |
| 67. | Tacoma | 0.079% | 0.085%(-0.006)#67 | 0.18%(-0.097)#2,286 |
| 68. | Puyallup | 0.075% | 0.085%(-0.010)#68 | 0.18%(-0.101)#2,316 |
| 69. | Orchards | 0.072% | 0.085%(-0.013)#69 | 0.18%(-0.104)#2,341 |
| 70. | Renton | 0.065% | 0.085%(-0.020)#70 | 0.18%(-0.111)#2,413 |
| 71. | Longview | 0.064% | 0.085%(-0.021)#71 | 0.18%(-0.112)#2,422 |
| 72. | Vancouver | 0.063% | 0.085%(-0.021)#72 | 0.18%(-0.112)#2,423 |
| 73. | Tracyton | 0.053% | 0.085%(-0.031)#73 | 0.18%(-0.122)#2,510 |
| 74. | Spanaway | 0.050% | 0.085%(-0.035)#74 | 0.18%(-0.126)#2,533 |
| 75. | Yelm | 0.048% | 0.085%(-0.037)#75 | 0.18%(-0.128)#2,559 |
| 76. | Bellevue | 0.041% | 0.085%(-0.044)#76 | 0.18%(-0.135)#2,618 |
| 77. | Pasco | 0.038% | 0.085%(-0.047)#77 | 0.18%(-0.138)#2,658 |
| 78. | Ellensburg | 0.037% | 0.085%(-0.048)#78 | 0.18%(-0.139)#2,666 |
| 79. | Spokane Valley | 0.033% | 0.085%(-0.052)#79 | 0.18%(-0.143)#2,712 |
| 80. | Redmond | 0.027% | 0.085%(-0.058)#80 | 0.18%(-0.149)#2,777 |
| 81. | Airway Heights | 0.019% | 0.085%(-0.066)#81 | 0.18%(-0.157)#2,854 |
| 82. | Sammamish | 0.014% | 0.085%(-0.071)#82 | 0.18%(-0.162)#2,903 |
| 83. | Bothell | 0.0042% | 0.085%(-0.081)#83 | 0.18%(-0.172)#2,987 |
Common Questions
What are the Top 10 Cities with the Highest Percentage of Nigerian Population in Washington?
Top 10 Cities with the Highest Percentage of Nigerian Population in Washington are:
#1
3.68%
#2
3.44%
#3
2.96%
#4
1.27%
#5
0.95%
#6
0.85%
#7
0.74%
#8
0.71%
#9
0.71%
#10
0.64%
What city has the Highest Percentage of Nigerian Population in Washington?
Gold Bar has the Highest Percentage of Nigerian Population in Washington with 3.68%.
What is the Percentage of Nigerian Population in the State of Washington?
Percentage of Nigerian Population in Washington is 0.085%.
What is the Percentage of Nigerian Population in the United States?
Percentage of Nigerian Population in the United States is 0.18%.