North Lynnwood, WA
North Lynnwood Map
North Lynnwood Overview
24,235
TOTAL POPULATION
12,037
MALE POPULATION
12,198
FEMALE POPULATION
98.68
MALES / 100 FEMALES
101.34
FEMALES / 100 MALES
32.5
MEDIAN AGE
3.1
AVG FAMILY SIZE
2.5
AVG HOUSEHOLD SIZE
$42,480
PER CAPITA INCOME
$102,843
AVG FAMILY INCOME
$89,944
AVG HOUSEHOLD INCOME
21.0%
WAGE / INCOME GAP [ % ]
79.0¢/ $1
WAGE / INCOME GAP [ $ ]
$15,457
FAMILY INCOME DEFICIT
0.37
INEQUALITY / GINI INDEX
14,992
LABOR FORCE [ PEOPLE ]
76.1%
PERCENT IN LABOR FORCE
3.6%
UNEMPLOYMENT RATE
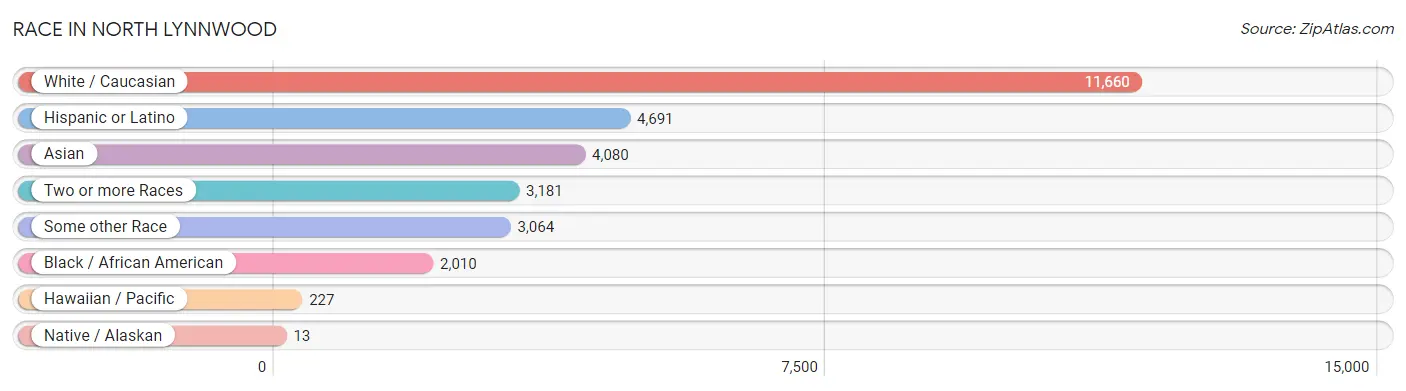
Race in North Lynnwood
The most populous races in North Lynnwood are White / Caucasian (11,660 | 48.1%), Hispanic or Latino (4,691 | 19.4%), and Asian (4,080 | 16.8%).
| Race | # Population | % Population |
| Asian | 4,080 | 16.8% |
| Black / African American | 2,010 | 8.3% |
| Hawaiian / Pacific | 227 | 0.9% |
| Hispanic or Latino | 4,691 | 19.4% |
| Native / Alaskan | 13 | 0.1% |
| White / Caucasian | 11,660 | 48.1% |
| Two or more Races | 3,181 | 13.1% |
| Some other Race | 3,064 | 12.6% |
| Total | 24,235 | 100.0% |
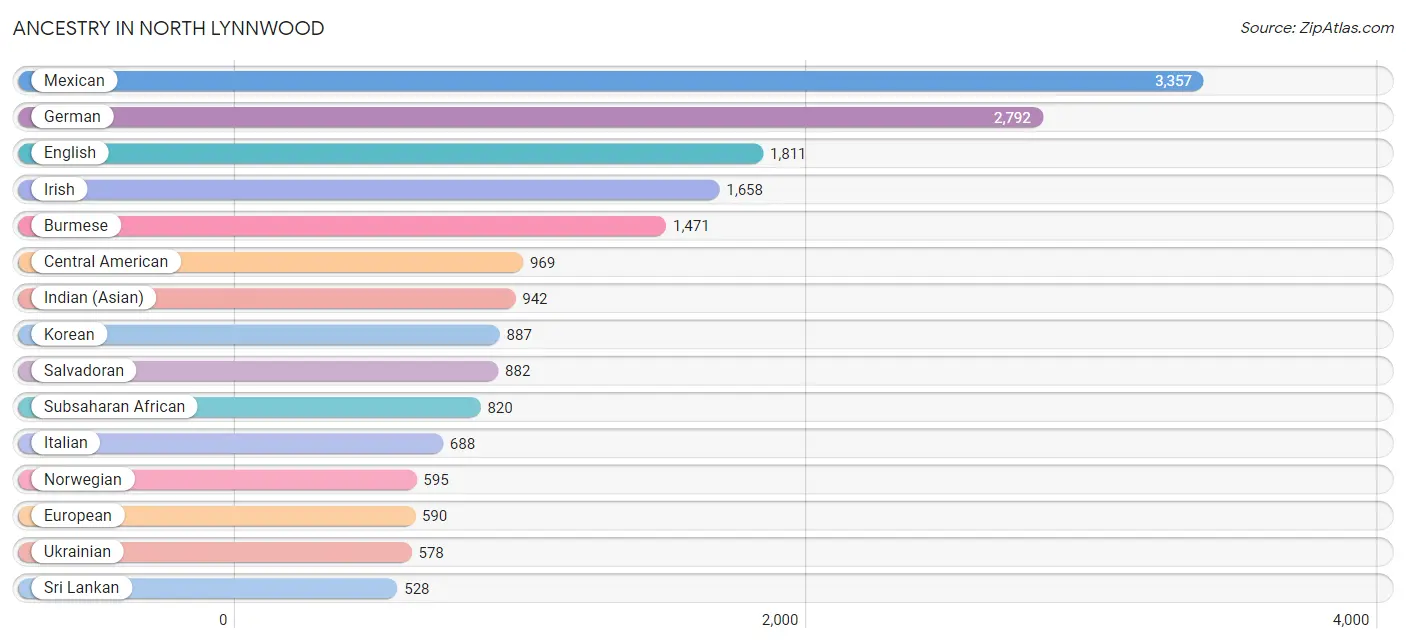
Ancestry in North Lynnwood
The most populous ancestries reported in North Lynnwood are Mexican (3,357 | 13.9%), German (2,792 | 11.5%), English (1,811 | 7.5%), Irish (1,658 | 6.8%), and Burmese (1,471 | 6.1%), together accounting for 45.8% of all North Lynnwood residents.
| Ancestry | # Population | % Population |
| African | 212 | 0.9% |
| Alsatian | 3 | 0.0% |
| American | 451 | 1.9% |
| Apache | 18 | 0.1% |
| Arab | 48 | 0.2% |
| Armenian | 37 | 0.2% |
| Austrian | 28 | 0.1% |
| Belgian | 63 | 0.3% |
| Bhutanese | 497 | 2.1% |
| Brazilian | 164 | 0.7% |
| British | 106 | 0.4% |
| Burmese | 1,471 | 6.1% |
| Canadian | 51 | 0.2% |
| Celtic | 11 | 0.1% |
| Central American | 969 | 4.0% |
| Cherokee | 186 | 0.8% |
| Chinese | 13 | 0.1% |
| Choctaw | 11 | 0.1% |
| Colombian | 13 | 0.1% |
| Comanche | 18 | 0.1% |
| Czech | 15 | 0.1% |
| Czechoslovakian | 16 | 0.1% |
| Danish | 74 | 0.3% |
| Dutch | 331 | 1.4% |
| Eastern European | 68 | 0.3% |
| Egyptian | 16 | 0.1% |
| English | 1,811 | 7.5% |
| Ethiopian | 384 | 1.6% |
| European | 590 | 2.4% |
| Finnish | 212 | 0.9% |
| French | 303 | 1.3% |
| French Canadian | 11 | 0.1% |
| German | 2,792 | 11.5% |
| Greek | 30 | 0.1% |
| Guamanian / Chamorro | 25 | 0.1% |
| Hmong | 35 | 0.1% |
| Honduran | 75 | 0.3% |
| Hungarian | 225 | 0.9% |
| Icelander | 25 | 0.1% |
| Indian (Asian) | 942 | 3.9% |
| Indonesian | 50 | 0.2% |
| Iranian | 118 | 0.5% |
| Irish | 1,658 | 6.8% |
| Israeli | 13 | 0.1% |
| Italian | 688 | 2.8% |
| Jamaican | 176 | 0.7% |
| Japanese | 93 | 0.4% |
| Korean | 887 | 3.7% |
| Laotian | 32 | 0.1% |
| Lebanese | 16 | 0.1% |
| Lithuanian | 13 | 0.1% |
| Malaysian | 75 | 0.3% |
| Mexican | 3,357 | 13.9% |
| Native Hawaiian | 444 | 1.8% |
| New Zealander | 24 | 0.1% |
| Nigerian | 173 | 0.7% |
| Northern European | 180 | 0.7% |
| Norwegian | 595 | 2.5% |
| Pakistani | 68 | 0.3% |
| Palestinian | 16 | 0.1% |
| Pennsylvania German | 31 | 0.1% |
| Peruvian | 32 | 0.1% |
| Polish | 235 | 1.0% |
| Portuguese | 128 | 0.5% |
| Puerto Rican | 260 | 1.1% |
| Romanian | 59 | 0.2% |
| Russian | 357 | 1.5% |
| Salvadoran | 882 | 3.6% |
| Samoan | 149 | 0.6% |
| Scandinavian | 207 | 0.9% |
| Scotch-Irish | 266 | 1.1% |
| Scottish | 519 | 2.1% |
| Sioux | 10 | 0.0% |
| Slovak | 9 | 0.0% |
| South American | 67 | 0.3% |
| Sri Lankan | 528 | 2.2% |
| Subsaharan African | 820 | 3.4% |
| Swedish | 369 | 1.5% |
| Swiss | 13 | 0.1% |
| Thai | 316 | 1.3% |
| Ukrainian | 578 | 2.4% |
| Venezuelan | 22 | 0.1% |
| Welsh | 61 | 0.3% |
| Yugoslavian | 14 | 0.1% | View All 84 Rows |
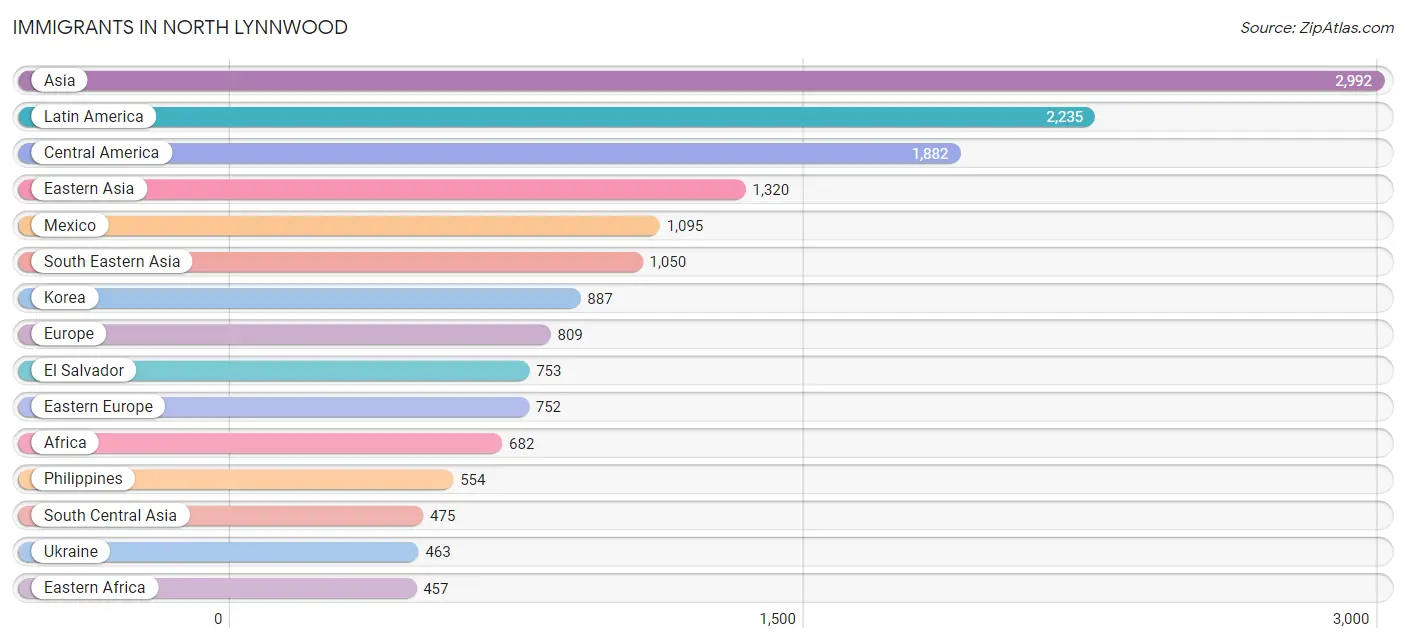
Immigrants in North Lynnwood
The most numerous immigrant groups reported in North Lynnwood came from Asia (2,992 | 12.3%), Latin America (2,235 | 9.2%), Central America (1,882 | 7.8%), Eastern Asia (1,320 | 5.4%), and Mexico (1,095 | 4.5%), together accounting for 39.3% of all North Lynnwood residents.
| Immigration Origin | # Population | % Population |
| Africa | 682 | 2.8% |
| Armenia | 13 | 0.1% |
| Asia | 2,992 | 12.3% |
| Australia | 11 | 0.1% |
| Belarus | 110 | 0.4% |
| Brazil | 164 | 0.7% |
| Cambodia | 11 | 0.1% |
| Cameroon | 13 | 0.1% |
| Canada | 64 | 0.3% |
| Caribbean | 139 | 0.6% |
| Central America | 1,882 | 7.8% |
| China | 333 | 1.4% |
| Colombia | 28 | 0.1% |
| Eastern Africa | 457 | 1.9% |
| Eastern Asia | 1,320 | 5.4% |
| Eastern Europe | 752 | 3.1% |
| El Salvador | 753 | 3.1% |
| England | 20 | 0.1% |
| Eritrea | 208 | 0.9% |
| Ethiopia | 249 | 1.0% |
| Europe | 809 | 3.3% |
| Germany | 23 | 0.1% |
| Honduras | 34 | 0.1% |
| Hong Kong | 104 | 0.4% |
| India | 162 | 0.7% |
| Indonesia | 29 | 0.1% |
| Iran | 126 | 0.5% |
| Israel | 13 | 0.1% |
| Jamaica | 139 | 0.6% |
| Japan | 100 | 0.4% |
| Korea | 887 | 3.7% |
| Latin America | 2,235 | 9.2% |
| Lebanon | 16 | 0.1% |
| Mexico | 1,095 | 4.5% |
| Middle Africa | 13 | 0.1% |
| Nepal | 17 | 0.1% |
| Nigeria | 105 | 0.4% |
| Northern Europe | 34 | 0.1% |
| Oceania | 35 | 0.1% |
| Pakistan | 170 | 0.7% |
| Philippines | 554 | 2.3% |
| Poland | 14 | 0.1% |
| Romania | 72 | 0.3% |
| Russia | 93 | 0.4% |
| Saudi Arabia | 16 | 0.1% |
| South Africa | 9 | 0.0% |
| South America | 214 | 0.9% |
| South Central Asia | 475 | 2.0% |
| South Eastern Asia | 1,050 | 4.3% |
| Taiwan | 13 | 0.1% |
| Thailand | 65 | 0.3% |
| Ukraine | 463 | 1.9% |
| Venezuela | 22 | 0.1% |
| Vietnam | 359 | 1.5% |
| Western Africa | 203 | 0.8% |
| Western Asia | 131 | 0.5% |
| Western Europe | 23 | 0.1% | View All 57 Rows |
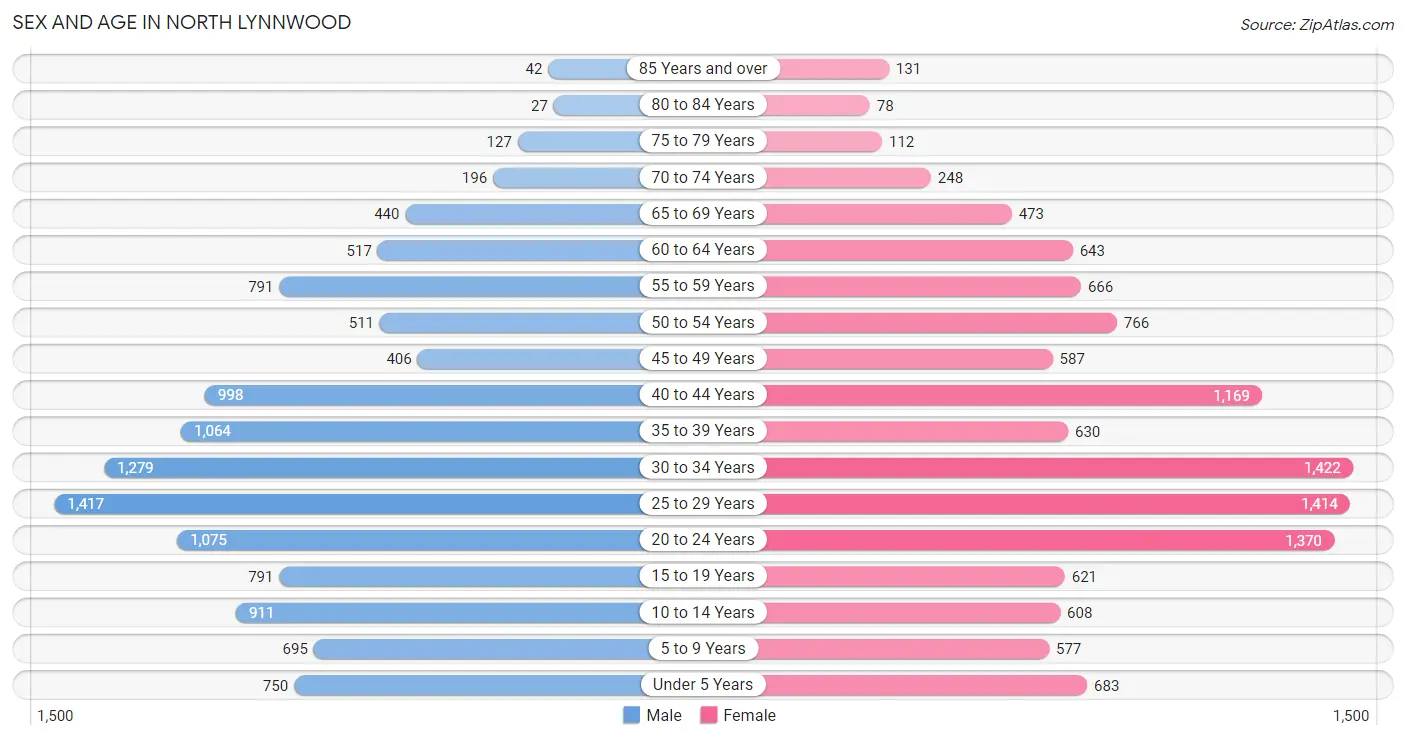
Sex and Age in North Lynnwood
Sex and Age in North Lynnwood
The most populous age groups in North Lynnwood are 25 to 29 Years (1,417 | 11.8%) for men and 30 to 34 Years (1,422 | 11.7%) for women.
| Age Bracket | Male | Female |
| Under 5 Years | 750 (6.2%) | 683 (5.6%) |
| 5 to 9 Years | 695 (5.8%) | 577 (4.7%) |
| 10 to 14 Years | 911 (7.6%) | 608 (5.0%) |
| 15 to 19 Years | 791 (6.6%) | 621 (5.1%) |
| 20 to 24 Years | 1,075 (8.9%) | 1,370 (11.2%) |
| 25 to 29 Years | 1,417 (11.8%) | 1,414 (11.6%) |
| 30 to 34 Years | 1,279 (10.6%) | 1,422 (11.7%) |
| 35 to 39 Years | 1,064 (8.8%) | 630 (5.2%) |
| 40 to 44 Years | 998 (8.3%) | 1,169 (9.6%) |
| 45 to 49 Years | 406 (3.4%) | 587 (4.8%) |
| 50 to 54 Years | 511 (4.3%) | 766 (6.3%) |
| 55 to 59 Years | 791 (6.6%) | 666 (5.5%) |
| 60 to 64 Years | 517 (4.3%) | 643 (5.3%) |
| 65 to 69 Years | 440 (3.7%) | 473 (3.9%) |
| 70 to 74 Years | 196 (1.6%) | 248 (2.0%) |
| 75 to 79 Years | 127 (1.1%) | 112 (0.9%) |
| 80 to 84 Years | 27 (0.2%) | 78 (0.6%) |
| 85 Years and over | 42 (0.4%) | 131 (1.1%) |
| Total | 12,037 (100.0%) | 12,198 (100.0%) |
Families and Households in North Lynnwood
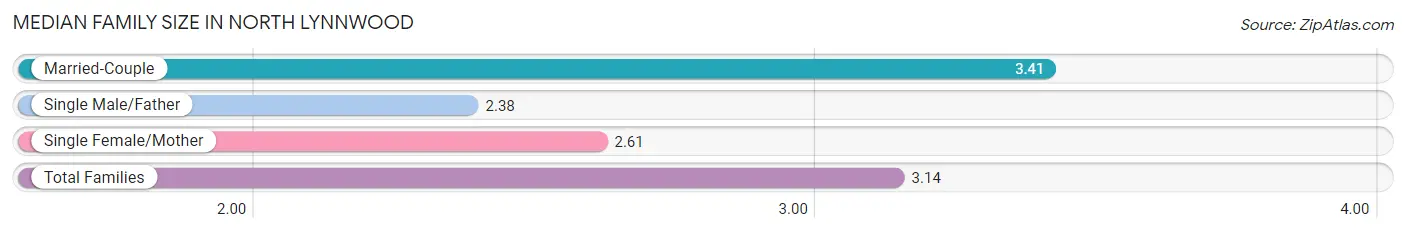
Median Family Size in North Lynnwood
The median family size in North Lynnwood is 3.14 persons per family, with married-couple families (3,654 | 68.2%) accounting for the largest median family size of 3.41 persons per family. On the other hand, single male/father families (495 | 9.2%) represent the smallest median family size with 2.38 persons per family.
| Family Type | # Families | Family Size |
| Married-Couple | 3,654 (68.2%) | 3.41 |
| Single Male/Father | 495 (9.2%) | 2.38 |
| Single Female/Mother | 1,209 (22.6%) | 2.61 |
| Total Families | 5,358 (100.0%) | 3.14 |
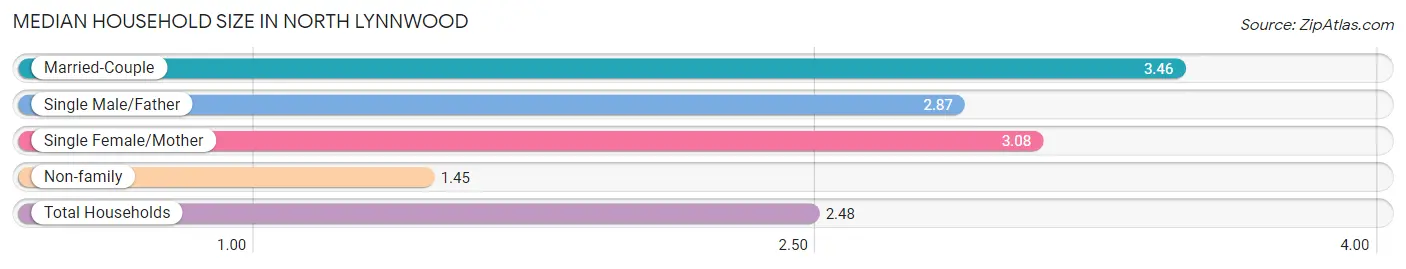
Median Household Size in North Lynnwood
The median household size in North Lynnwood is 2.48 persons per household, with married-couple households (3,654 | 37.4%) accounting for the largest median household size of 3.46 persons per household. non-family households (4,407 | 45.1%) represent the smallest median household size with 1.45 persons per household.
| Household Type | # Households | Household Size |
| Married-Couple | 3,654 (37.4%) | 3.46 |
| Single Male/Father | 495 (5.1%) | 2.87 |
| Single Female/Mother | 1,209 (12.4%) | 3.08 |
| Non-family | 4,407 (45.1%) | 1.45 |
| Total Households | 9,765 (100.0%) | 2.48 |
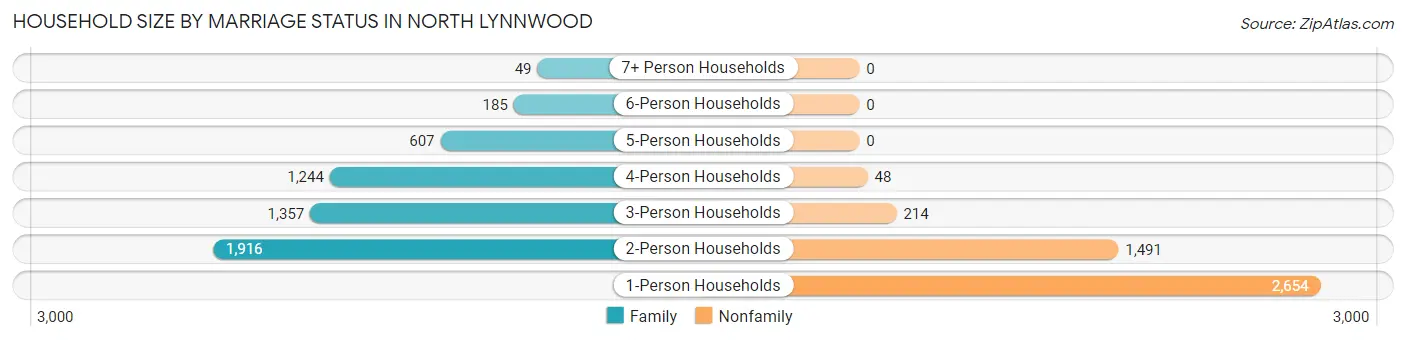
Household Size by Marriage Status in North Lynnwood
Out of a total of 9,765 households in North Lynnwood, 5,358 (54.9%) are family households, while 4,407 (45.1%) are nonfamily households. The most numerous type of family households are 2-person households, comprising 1,916, and the most common type of nonfamily households are 1-person households, comprising 2,654.
| Household Size | Family Households | Nonfamily Households |
| 1-Person Households | - | 2,654 (27.2%) |
| 2-Person Households | 1,916 (19.6%) | 1,491 (15.3%) |
| 3-Person Households | 1,357 (13.9%) | 214 (2.2%) |
| 4-Person Households | 1,244 (12.7%) | 48 (0.5%) |
| 5-Person Households | 607 (6.2%) | 0 (0.0%) |
| 6-Person Households | 185 (1.9%) | 0 (0.0%) |
| 7+ Person Households | 49 (0.5%) | 0 (0.0%) |
| Total | 5,358 (54.9%) | 4,407 (45.1%) |
Female Fertility in North Lynnwood
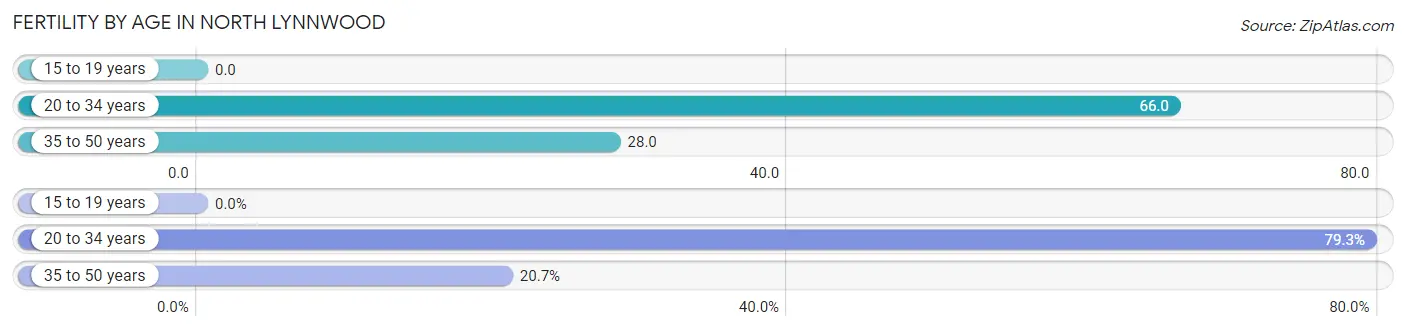
Fertility by Age in North Lynnwood
Average fertility rate in North Lynnwood is 47.0 births per 1,000 women. Women in the age bracket of 20 to 34 years have the highest fertility rate with 66.0 births per 1,000 women. Women in the age bracket of 20 to 34 years acount for 79.3% of all women with births.
| Age Bracket | Women with Births | Births / 1,000 Women |
| 15 to 19 years | 0 (0.0%) | 0.0 |
| 20 to 34 years | 276 (79.3%) | 66.0 |
| 35 to 50 years | 72 (20.7%) | 28.0 |
| Total | 348 (100.0%) | 47.0 |
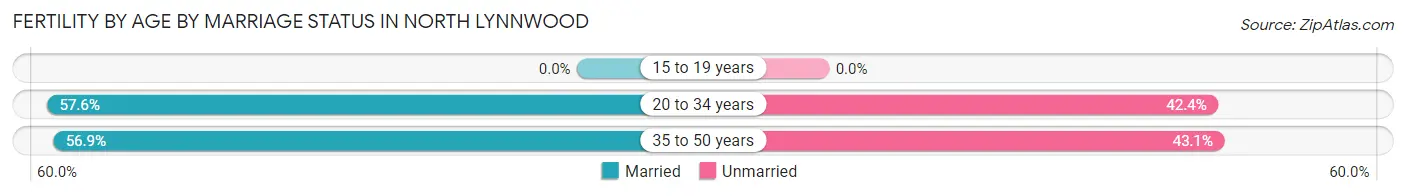
Fertility by Age by Marriage Status in North Lynnwood
57.5% of women with births (348) in North Lynnwood are married. The highest percentage of unmarried women with births falls into 35 to 50 years age bracket with 43.1% of them unmarried at the time of birth, while the lowest percentage of unmarried women with births belong to 20 to 34 years age bracket with 42.4% of them unmarried.
| Age Bracket | Married | Unmarried |
| 15 to 19 years | 0 (0.0%) | 0 (0.0%) |
| 20 to 34 years | 159 (57.6%) | 117 (42.4%) |
| 35 to 50 years | 41 (56.9%) | 31 (43.1%) |
| Total | 200 (57.5%) | 148 (42.5%) |
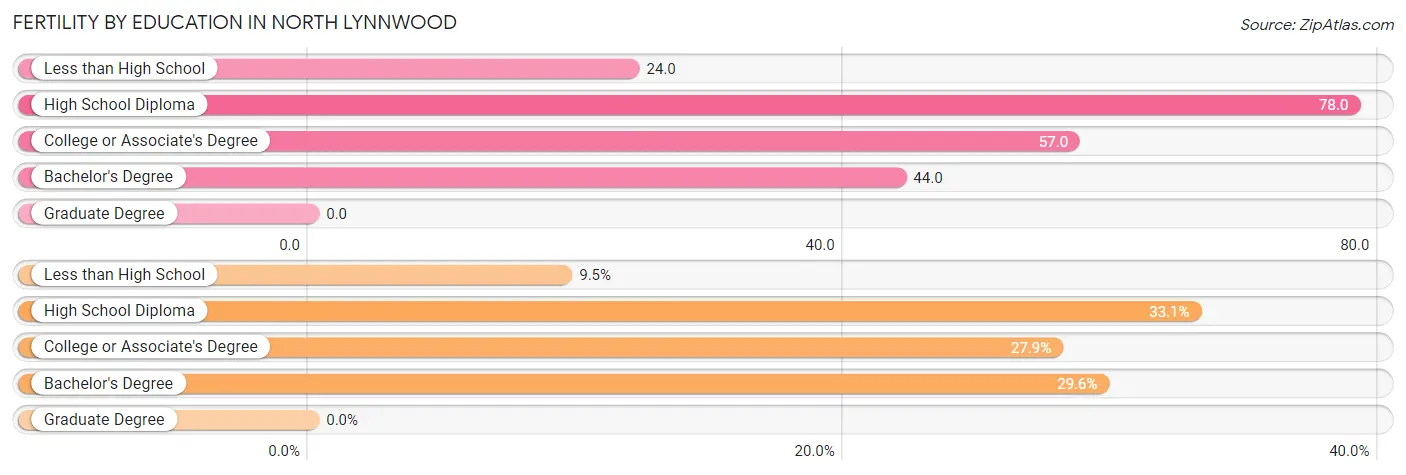
Fertility by Education in North Lynnwood
| Educational Attainment | Women with Births | Births / 1,000 Women |
| Less than High School | 33 (9.5%) | 24.0 |
| High School Diploma | 115 (33.1%) | 78.0 |
| College or Associate's Degree | 97 (27.9%) | 57.0 |
| Bachelor's Degree | 103 (29.6%) | 44.0 |
| Graduate Degree | 0 (0.0%) | 0.0 |
| Total | 348 (100.0%) | 47.0 |
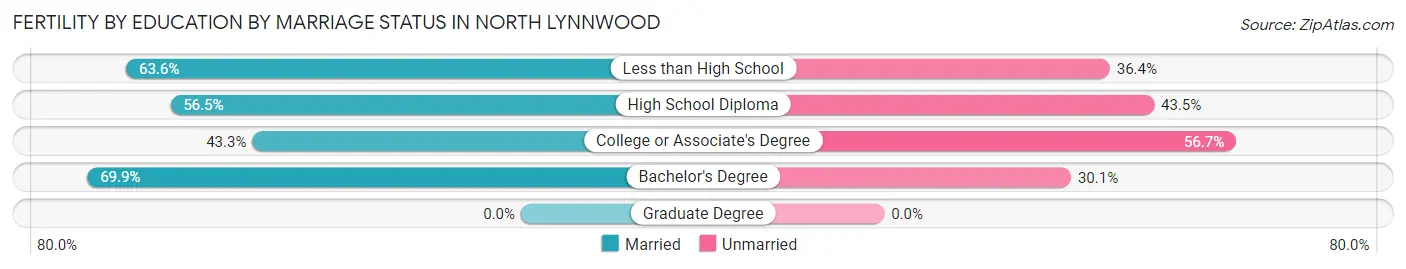
Fertility by Education by Marriage Status in North Lynnwood
42.5% of women with births in North Lynnwood are unmarried. Women with the educational attainment of bachelor's degree are most likely to be married with 69.9% of them married at childbirth, while women with the educational attainment of college or associate's degree are least likely to be married with 56.7% of them unmarried at childbirth.
| Educational Attainment | Married | Unmarried |
| Less than High School | 21 (63.6%) | 12 (36.4%) |
| High School Diploma | 65 (56.5%) | 50 (43.5%) |
| College or Associate's Degree | 42 (43.3%) | 55 (56.7%) |
| Bachelor's Degree | 72 (69.9%) | 31 (30.1%) |
| Graduate Degree | 0 (0.0%) | 0 (0.0%) |
| Total | 200 (57.5%) | 148 (42.5%) |
Income in North Lynnwood
Income Overview in North Lynnwood
Per Capita Income in North Lynnwood is $42,480, while median incomes of families and households are $102,843 and $89,944 respectively.
| Characteristic | Number | Measure |
| Per Capita Income | 24,235 | $42,480 |
| Median Family Income | 5,358 | $102,843 |
| Mean Family Income | 5,358 | $110,010 |
| Median Household Income | 9,765 | $89,944 |
| Mean Household Income | 9,765 | $104,347 |
| Income Deficit | 5,358 | $15,457 |
| Wage / Income Gap (%) | 24,235 | 21.01% |
| Wage / Income Gap ($) | 24,235 | 78.99¢ per $1 |
| Gini / Inequality Index | 24,235 | 0.37 |
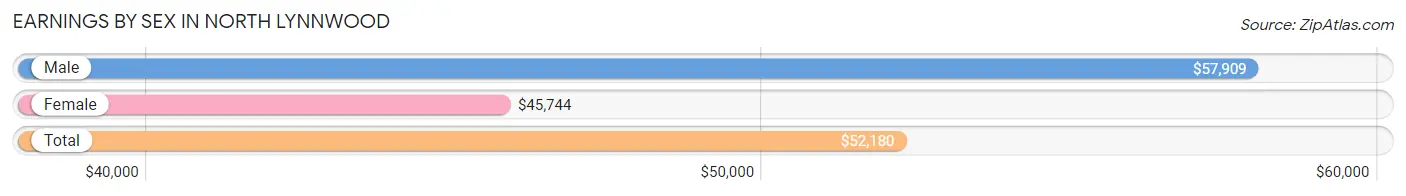
Earnings by Sex in North Lynnwood
Average Earnings in North Lynnwood are $52,180, $57,909 for men and $45,744 for women, a difference of 21.0%.
| Sex | Number | Average Earnings |
| Male | 7,903 (50.8%) | $57,909 |
| Female | 7,664 (49.2%) | $45,744 |
| Total | 15,567 (100.0%) | $52,180 |
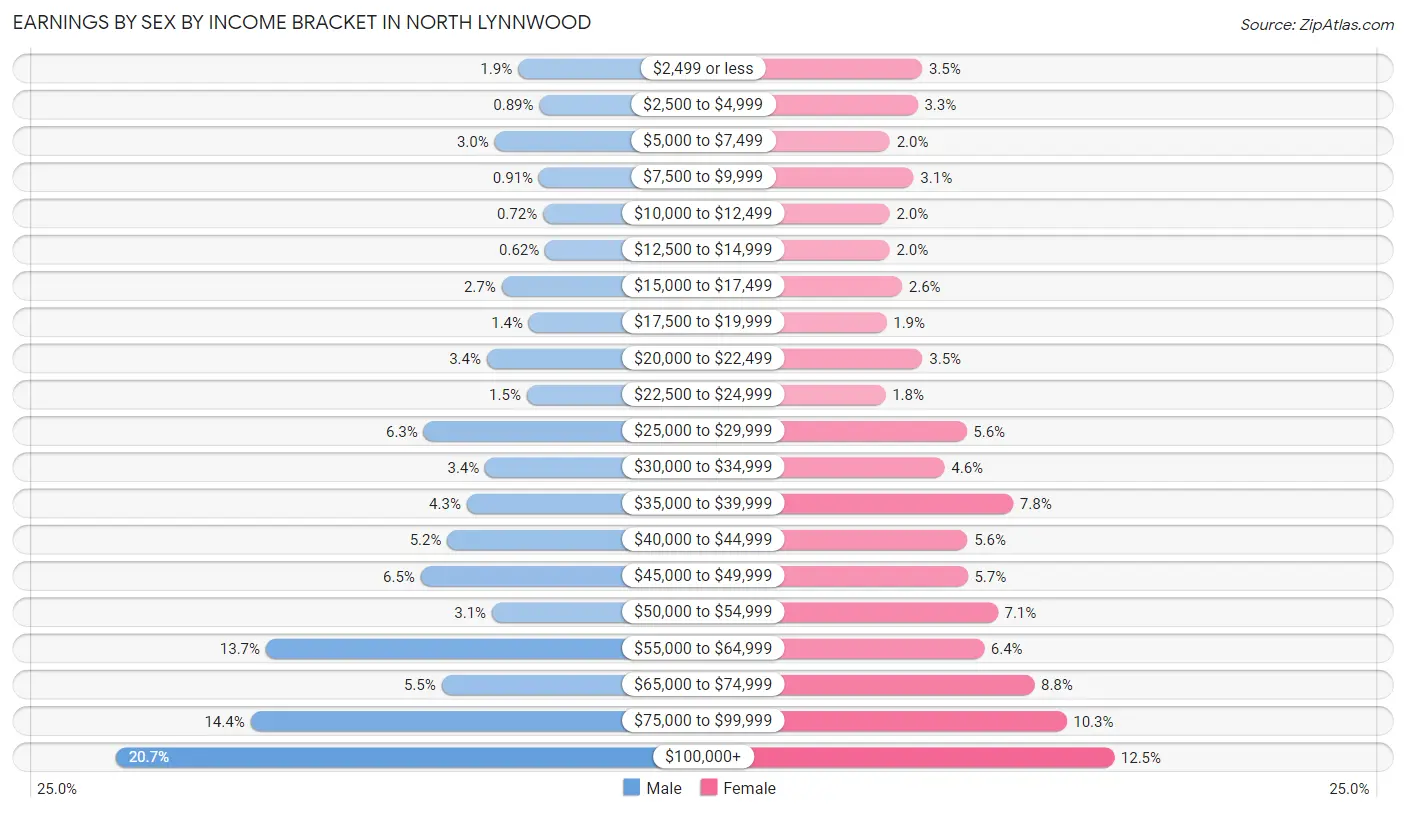
Earnings by Sex by Income Bracket in North Lynnwood
The most common earnings brackets in North Lynnwood are $100,000+ for men (1,638 | 20.7%) and $100,000+ for women (959 | 12.5%).
| Income | Male | Female |
| $2,499 or less | 149 (1.9%) | 270 (3.5%) |
| $2,500 to $4,999 | 70 (0.9%) | 254 (3.3%) |
| $5,000 to $7,499 | 236 (3.0%) | 154 (2.0%) |
| $7,500 to $9,999 | 72 (0.9%) | 239 (3.1%) |
| $10,000 to $12,499 | 57 (0.7%) | 153 (2.0%) |
| $12,500 to $14,999 | 49 (0.6%) | 153 (2.0%) |
| $15,000 to $17,499 | 210 (2.7%) | 198 (2.6%) |
| $17,500 to $19,999 | 109 (1.4%) | 142 (1.8%) |
| $20,000 to $22,499 | 265 (3.4%) | 271 (3.5%) |
| $22,500 to $24,999 | 117 (1.5%) | 138 (1.8%) |
| $25,000 to $29,999 | 499 (6.3%) | 429 (5.6%) |
| $30,000 to $34,999 | 271 (3.4%) | 350 (4.6%) |
| $35,000 to $39,999 | 339 (4.3%) | 596 (7.8%) |
| $40,000 to $44,999 | 411 (5.2%) | 432 (5.6%) |
| $45,000 to $49,999 | 510 (6.5%) | 433 (5.7%) |
| $50,000 to $54,999 | 246 (3.1%) | 541 (7.1%) |
| $55,000 to $64,999 | 1,083 (13.7%) | 492 (6.4%) |
| $65,000 to $74,999 | 432 (5.5%) | 672 (8.8%) |
| $75,000 to $99,999 | 1,140 (14.4%) | 788 (10.3%) |
| $100,000+ | 1,638 (20.7%) | 959 (12.5%) |
| Total | 7,903 (100.0%) | 7,664 (100.0%) |
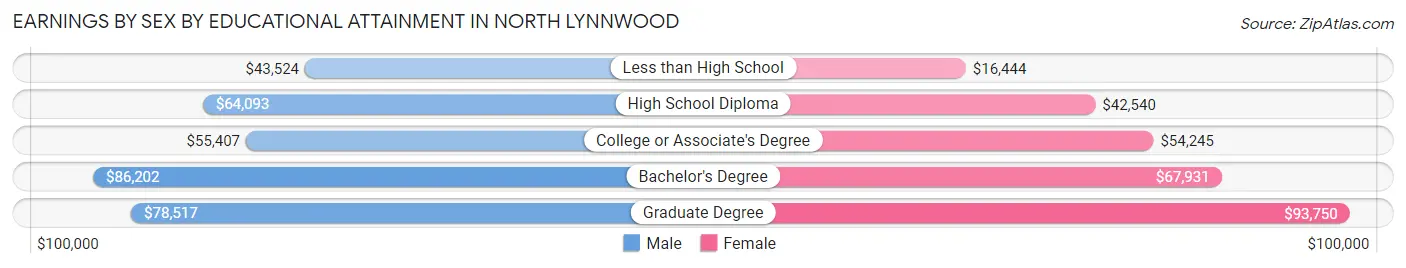
Earnings by Sex by Educational Attainment in North Lynnwood
Average earnings in North Lynnwood are $62,571 for men and $52,183 for women, a difference of 16.6%. Men with an educational attainment of bachelor's degree enjoy the highest average annual earnings of $86,202, while those with less than high school education earn the least with $43,524. Women with an educational attainment of graduate degree earn the most with the average annual earnings of $93,750, while those with less than high school education have the smallest earnings of $16,444.
| Educational Attainment | Male Income | Female Income |
| Less than High School | $43,524 | $16,444 |
| High School Diploma | $64,093 | $42,540 |
| College or Associate's Degree | $55,407 | $54,245 |
| Bachelor's Degree | $86,202 | $67,931 |
| Graduate Degree | $78,517 | $93,750 |
| Total | $62,571 | $52,183 |
Family Income in North Lynnwood
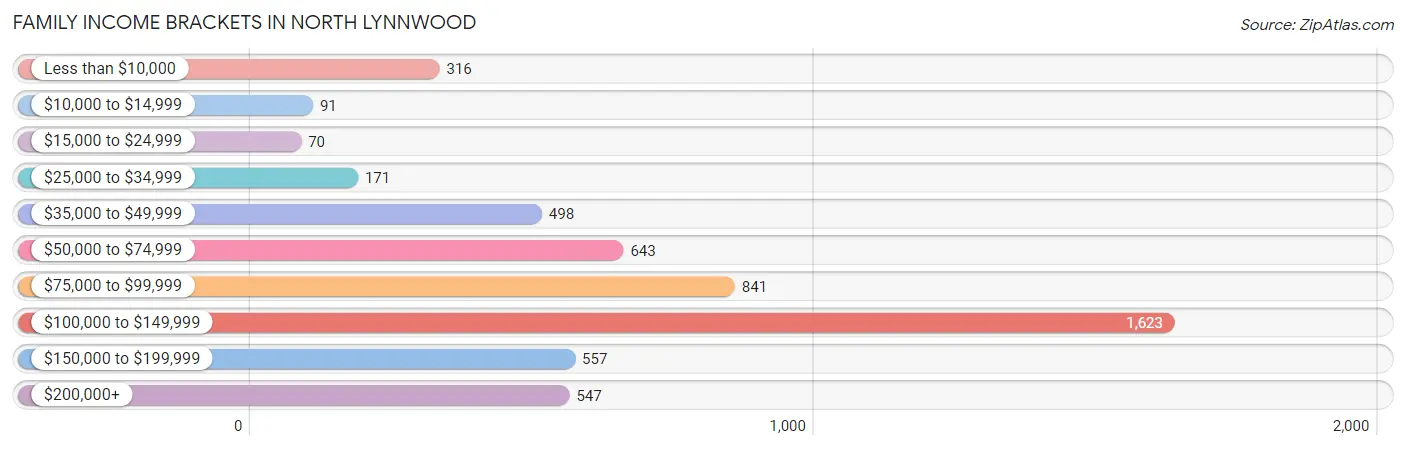
Family Income Brackets in North Lynnwood
According to the North Lynnwood family income data, there are 1,623 families falling into the $100,000 to $149,999 income range, which is the most common income bracket and makes up 30.3% of all families. Conversely, the $15,000 to $24,999 income bracket is the least frequent group with only 70 families (1.3%) belonging to this category.
| Income Bracket | # Families | % Families |
| Less than $10,000 | 316 | 5.9% |
| $10,000 to $14,999 | 91 | 1.7% |
| $15,000 to $24,999 | 70 | 1.3% |
| $25,000 to $34,999 | 171 | 3.2% |
| $35,000 to $49,999 | 498 | 9.3% |
| $50,000 to $74,999 | 643 | 12.0% |
| $75,000 to $99,999 | 841 | 15.7% |
| $100,000 to $149,999 | 1,623 | 30.3% |
| $150,000 to $199,999 | 557 | 10.4% |
| $200,000+ | 547 | 10.2% |
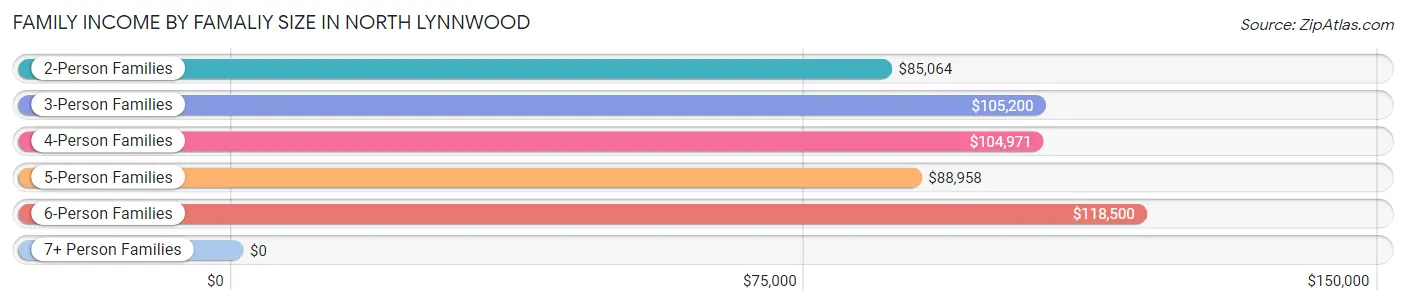
Family Income by Famaliy Size in North Lynnwood
6-person families (166 | 3.1%) account for the highest median family income in North Lynnwood with $118,500 per family, while 2-person families (2,400 | 44.8%) have the highest median income of $42,532 per family member.
| Income Bracket | # Families | Median Income |
| 2-Person Families | 2,400 (44.8%) | $85,064 |
| 3-Person Families | 1,114 (20.8%) | $105,200 |
| 4-Person Families | 1,100 (20.5%) | $104,971 |
| 5-Person Families | 544 (10.2%) | $88,958 |
| 6-Person Families | 166 (3.1%) | $118,500 |
| 7+ Person Families | 34 (0.6%) | $0 |
| Total | 5,358 (100.0%) | $102,843 |
Family Income by Number of Earners in North Lynnwood
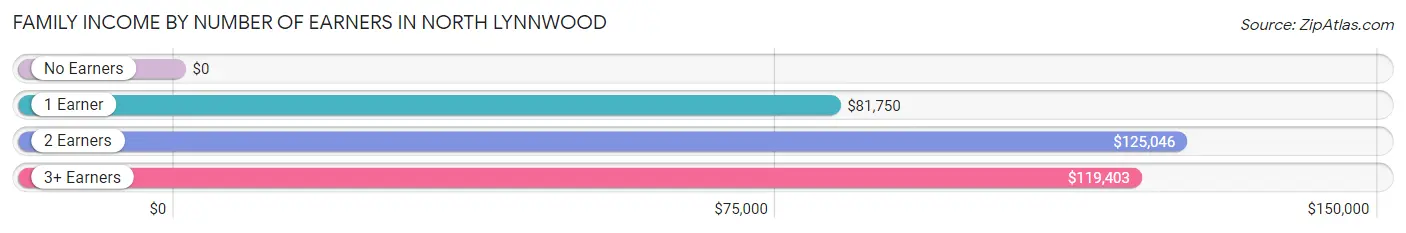
| Number of Earners | # Families | Median Income |
| No Earners | 510 (9.5%) | $0 |
| 1 Earner | 1,736 (32.4%) | $81,750 |
| 2 Earners | 2,493 (46.5%) | $125,046 |
| 3+ Earners | 619 (11.6%) | $119,403 |
| Total | 5,358 (100.0%) | $102,843 |
Household Income in North Lynnwood
Household Income Brackets in North Lynnwood
With 2,597 households falling in the category, the $100,000 to $149,999 income range is the most frequent in North Lynnwood, accounting for 26.6% of all households. In contrast, only 137 households (1.4%) fall into the $10,000 to $14,999 income bracket, making it the least populous group.
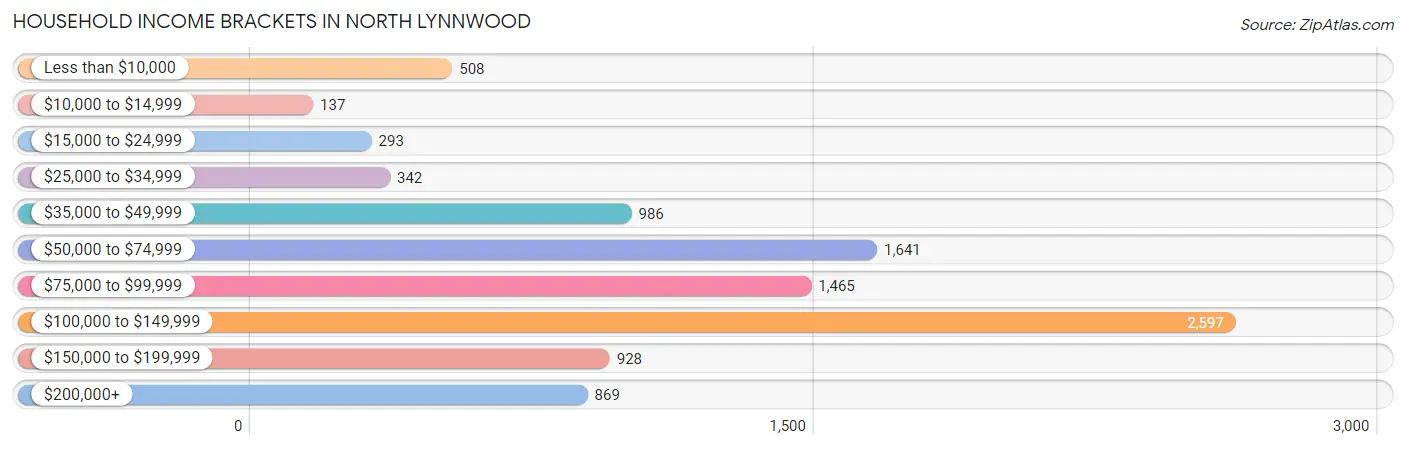
| Income Bracket | # Households | % Households |
| Less than $10,000 | 508 | 5.2% |
| $10,000 to $14,999 | 137 | 1.4% |
| $15,000 to $24,999 | 293 | 3.0% |
| $25,000 to $34,999 | 342 | 3.5% |
| $35,000 to $49,999 | 986 | 10.1% |
| $50,000 to $74,999 | 1,641 | 16.8% |
| $75,000 to $99,999 | 1,465 | 15.0% |
| $100,000 to $149,999 | 2,597 | 26.6% |
| $150,000 to $199,999 | 928 | 9.5% |
| $200,000+ | 869 | 8.9% |
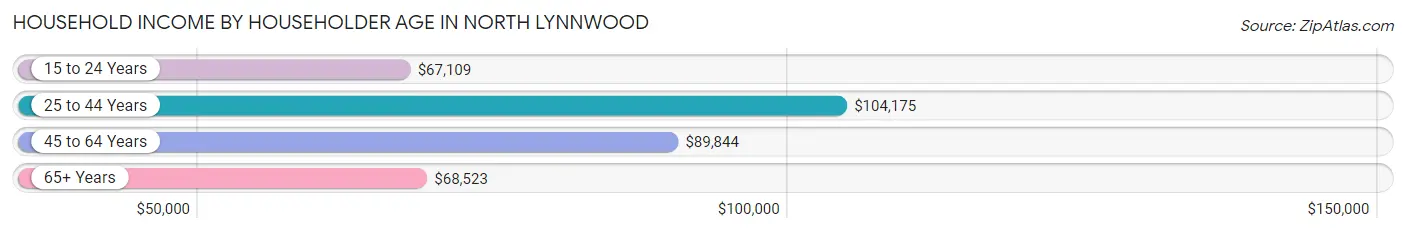
Household Income by Householder Age in North Lynnwood
The median household income in North Lynnwood is $89,944, with the highest median household income of $104,175 found in the 25 to 44 years age bracket for the primary householder. A total of 4,643 households (47.5%) fall into this category. Meanwhile, the 15 to 24 years age bracket for the primary householder has the lowest median household income of $67,109, with 945 households (9.7%) in this group.
| Income Bracket | # Households | Median Income |
| 15 to 24 Years | 945 (9.7%) | $67,109 |
| 25 to 44 Years | 4,643 (47.5%) | $104,175 |
| 45 to 64 Years | 2,986 (30.6%) | $89,844 |
| 65+ Years | 1,191 (12.2%) | $68,523 |
| Total | 9,765 (100.0%) | $89,944 |
Poverty in North Lynnwood
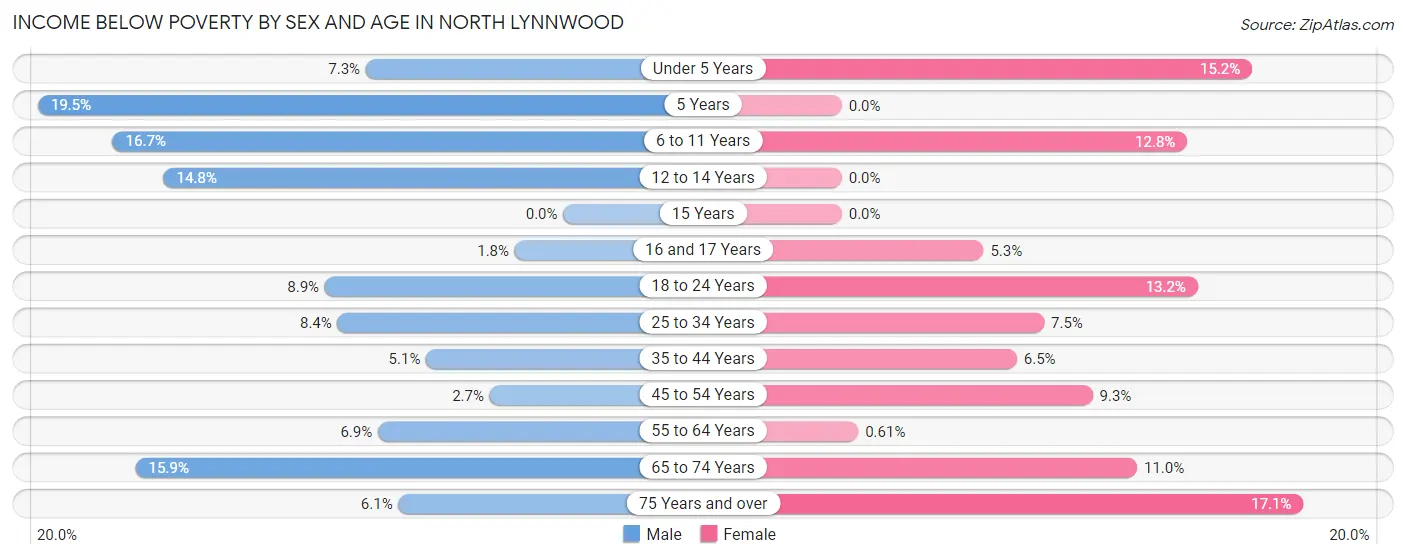
Income Below Poverty by Sex and Age in North Lynnwood
With 8.2% poverty level for males and 8.3% for females among the residents of North Lynnwood, 5 year old males and 75 year old and over females are the most vulnerable to poverty, with 16 males (19.5%) and 55 females (17.1%) in their respective age groups living below the poverty level.
| Age Bracket | Male | Female |
| Under 5 Years | 55 (7.3%) | 104 (15.2%) |
| 5 Years | 16 (19.5%) | 0 (0.0%) |
| 6 to 11 Years | 127 (16.7%) | 75 (12.8%) |
| 12 to 14 Years | 104 (14.8%) | 0 (0.0%) |
| 15 Years | 0 (0.0%) | 0 (0.0%) |
| 16 and 17 Years | 5 (1.8%) | 15 (5.3%) |
| 18 to 24 Years | 118 (8.8%) | 218 (13.2%) |
| 25 to 34 Years | 226 (8.4%) | 213 (7.5%) |
| 35 to 44 Years | 105 (5.1%) | 117 (6.5%) |
| 45 to 54 Years | 25 (2.7%) | 126 (9.3%) |
| 55 to 64 Years | 90 (6.9%) | 8 (0.6%) |
| 65 to 74 Years | 101 (15.9%) | 79 (11.0%) |
| 75 Years and over | 12 (6.1%) | 55 (17.1%) |
| Total | 984 (8.2%) | 1,010 (8.3%) |
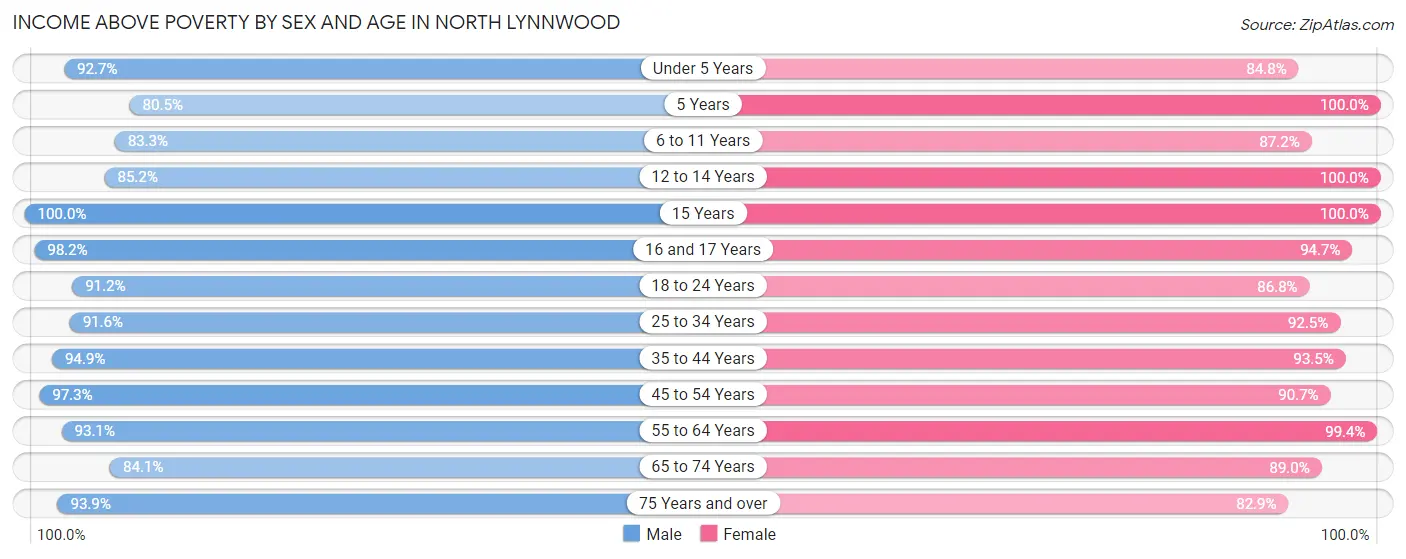
Income Above Poverty by Sex and Age in North Lynnwood
According to the poverty statistics in North Lynnwood, males aged 15 years and females aged 5 years are the age groups that are most secure financially, with 100.0% of males and 100.0% of females in these age groups living above the poverty line.
| Age Bracket | Male | Female |
| Under 5 Years | 695 (92.7%) | 579 (84.8%) |
| 5 Years | 66 (80.5%) | 66 (100.0%) |
| 6 to 11 Years | 632 (83.3%) | 510 (87.2%) |
| 12 to 14 Years | 597 (85.2%) | 528 (100.0%) |
| 15 Years | 254 (100.0%) | 56 (100.0%) |
| 16 and 17 Years | 273 (98.2%) | 270 (94.7%) |
| 18 to 24 Years | 1,216 (91.1%) | 1,432 (86.8%) |
| 25 to 34 Years | 2,470 (91.6%) | 2,623 (92.5%) |
| 35 to 44 Years | 1,957 (94.9%) | 1,682 (93.5%) |
| 45 to 54 Years | 892 (97.3%) | 1,227 (90.7%) |
| 55 to 64 Years | 1,218 (93.1%) | 1,301 (99.4%) |
| 65 to 74 Years | 535 (84.1%) | 642 (89.0%) |
| 75 Years and over | 184 (93.9%) | 266 (82.9%) |
| Total | 10,989 (91.8%) | 11,182 (91.7%) |
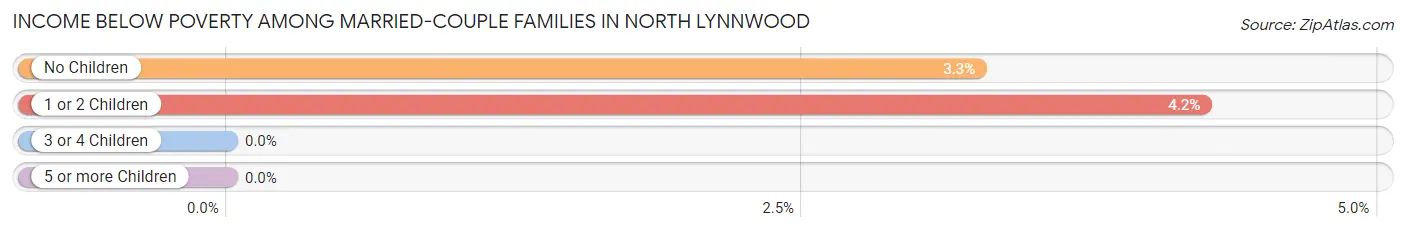
Income Below Poverty Among Married-Couple Families in North Lynnwood
The poverty statistics for married-couple families in North Lynnwood show that 3.3% or 121 of the total 3,654 families live below the poverty line. Families with 1 or 2 children have the highest poverty rate of 4.2%, comprising of 69 families. On the other hand, families with 3 or 4 children have the lowest poverty rate of 0.0%, which includes 0 families.
| Children | Above Poverty | Below Poverty |
| No Children | 1,541 (96.7%) | 52 (3.3%) |
| 1 or 2 Children | 1,559 (95.8%) | 69 (4.2%) |
| 3 or 4 Children | 433 (100.0%) | 0 (0.0%) |
| 5 or more Children | 0 (0.0%) | 0 (0.0%) |
| Total | 3,533 (96.7%) | 121 (3.3%) |
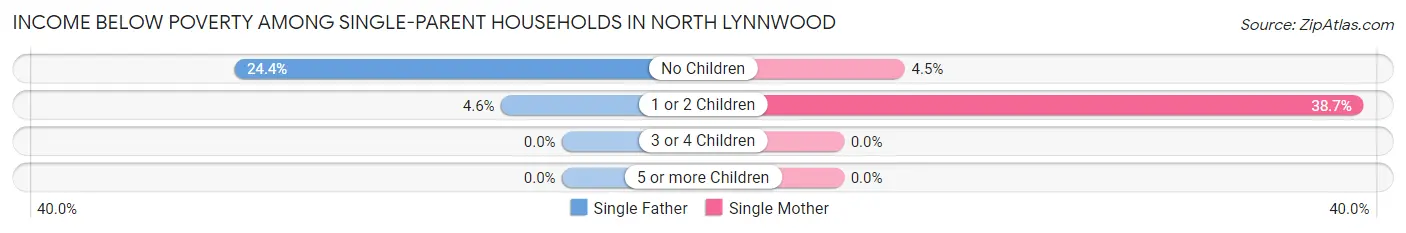
Income Below Poverty Among Single-Parent Households in North Lynnwood
According to the poverty data in North Lynnwood, 12.9% or 64 single-father households and 22.2% or 268 single-mother households are living below the poverty line. Among single-father households, those with no children have the highest poverty rate, with 51 households (24.4%) experiencing poverty. Likewise, among single-mother households, those with 1 or 2 children have the highest poverty rate, with 244 households (38.7%) falling below the poverty line.
| Children | Single Father | Single Mother |
| No Children | 51 (24.4%) | 24 (4.5%) |
| 1 or 2 Children | 13 (4.5%) | 244 (38.7%) |
| 3 or 4 Children | 0 (0.0%) | 0 (0.0%) |
| 5 or more Children | 0 (0.0%) | 0 (0.0%) |
| Total | 64 (12.9%) | 268 (22.2%) |
Income Below Poverty Among Married-Couple vs Single-Parent Households in North Lynnwood
The poverty data for North Lynnwood shows that 121 of the married-couple family households (3.3%) and 332 of the single-parent households (19.5%) are living below the poverty level. Within the married-couple family households, those with 1 or 2 children have the highest poverty rate, with 69 households (4.2%) falling below the poverty line. Among the single-parent households, those with 1 or 2 children have the highest poverty rate, with 257 household (28.1%) living below poverty.
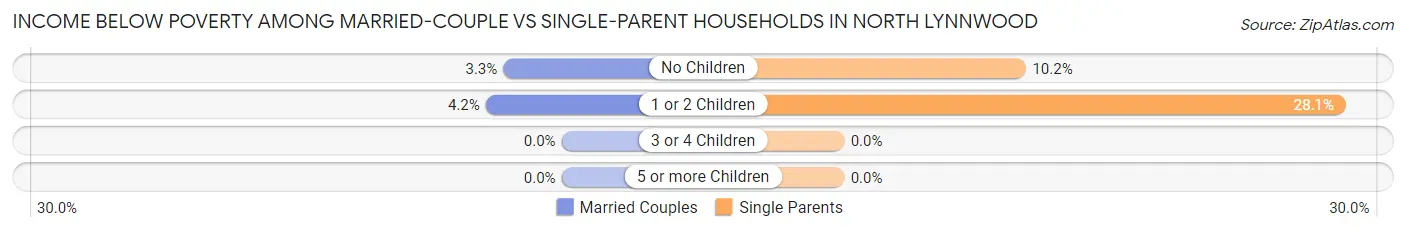
| Children | Married-Couple Families | Single-Parent Households |
| No Children | 52 (3.3%) | 75 (10.2%) |
| 1 or 2 Children | 69 (4.2%) | 257 (28.1%) |
| 3 or 4 Children | 0 (0.0%) | 0 (0.0%) |
| 5 or more Children | 0 (0.0%) | 0 (0.0%) |
| Total | 121 (3.3%) | 332 (19.5%) |
Employment Characteristics in North Lynnwood
Employment by Class of Employer in North Lynnwood
Among the 14,141 employed individuals in North Lynnwood, private company employees (10,462 | 74.0%), not-for-profit organizations (1,551 | 11.0%), and state government employees (677 | 4.8%) make up the most common classes of employment.
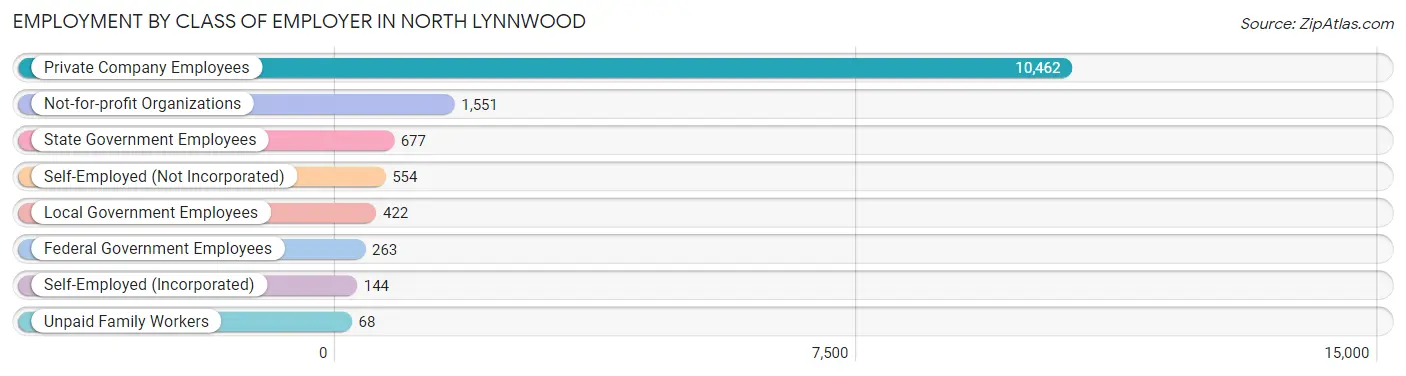
| Employer Class | # Employees | % Employees |
| Private Company Employees | 10,462 | 74.0% |
| Self-Employed (Incorporated) | 144 | 1.0% |
| Self-Employed (Not Incorporated) | 554 | 3.9% |
| Not-for-profit Organizations | 1,551 | 11.0% |
| Local Government Employees | 422 | 3.0% |
| State Government Employees | 677 | 4.8% |
| Federal Government Employees | 263 | 1.9% |
| Unpaid Family Workers | 68 | 0.5% |
| Total | 14,141 | 100.0% |
Employment Status by Age in North Lynnwood
According to the labor force statistics for North Lynnwood, out of the total population over 16 years of age (19,701), 76.1% or 14,992 individuals are in the labor force, with 3.6% or 540 of them unemployed. The age group with the highest labor force participation rate is 35 to 44 years, with 88.7% or 3,425 individuals in the labor force. Within the labor force, the 16 to 19 years age range has the highest percentage of unemployed individuals, with 18.8% or 72 of them being unemployed.
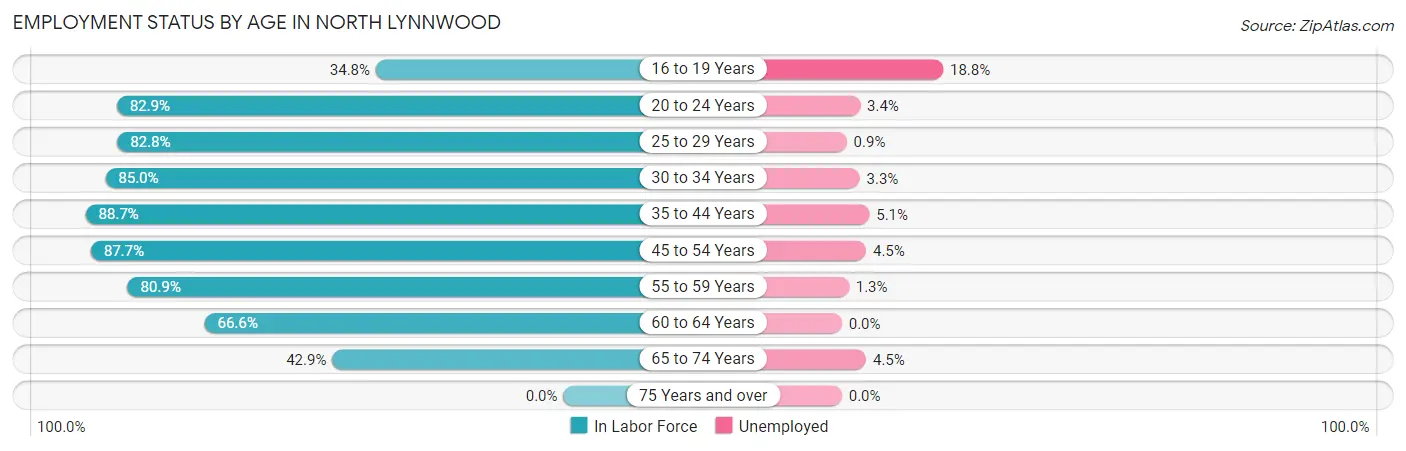
| Age Bracket | In Labor Force | Unemployed |
| 16 to 19 Years | 383 (34.8%) | 72 (18.8%) |
| 20 to 24 Years | 2,027 (82.9%) | 69 (3.4%) |
| 25 to 29 Years | 2,344 (82.8%) | 21 (0.9%) |
| 30 to 34 Years | 2,296 (85.0%) | 76 (3.3%) |
| 35 to 44 Years | 3,425 (88.7%) | 175 (5.1%) |
| 45 to 54 Years | 1,991 (87.7%) | 90 (4.5%) |
| 55 to 59 Years | 1,179 (80.9%) | 15 (1.3%) |
| 60 to 64 Years | 773 (66.6%) | 0 (0.0%) |
| 65 to 74 Years | 582 (42.9%) | 26 (4.5%) |
| 75 Years and over | 0 (0.0%) | 0 (0.0%) |
| Total | 14,992 (76.1%) | 540 (3.6%) |
Employment Status by Educational Attainment in North Lynnwood
According to labor force statistics for North Lynnwood, 84.1% of individuals (12,009) out of the total population between 25 and 64 years of age (14,280) are in the labor force, with 3.1% or 372 of them being unemployed. The group with the highest labor force participation rate are those with the educational attainment of bachelor's degree or higher, with 90.7% or 5,083 individuals in the labor force. Within the labor force, individuals with less than high school education have the highest percentage of unemployment, with 4.1% or 53 of them being unemployed.
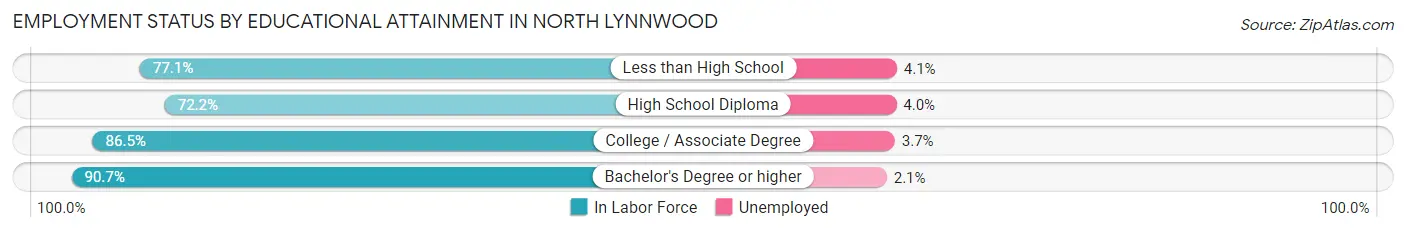
| Educational Attainment | In Labor Force | Unemployed |
| Less than High School | 1,295 (77.1%) | 69 (4.1%) |
| High School Diploma | 2,146 (72.2%) | 119 (4.0%) |
| College / Associate Degree | 3,482 (86.5%) | 149 (3.7%) |
| Bachelor's Degree or higher | 5,083 (90.7%) | 118 (2.1%) |
| Total | 12,009 (84.1%) | 443 (3.1%) |
Employment Occupations by Sex in North Lynnwood
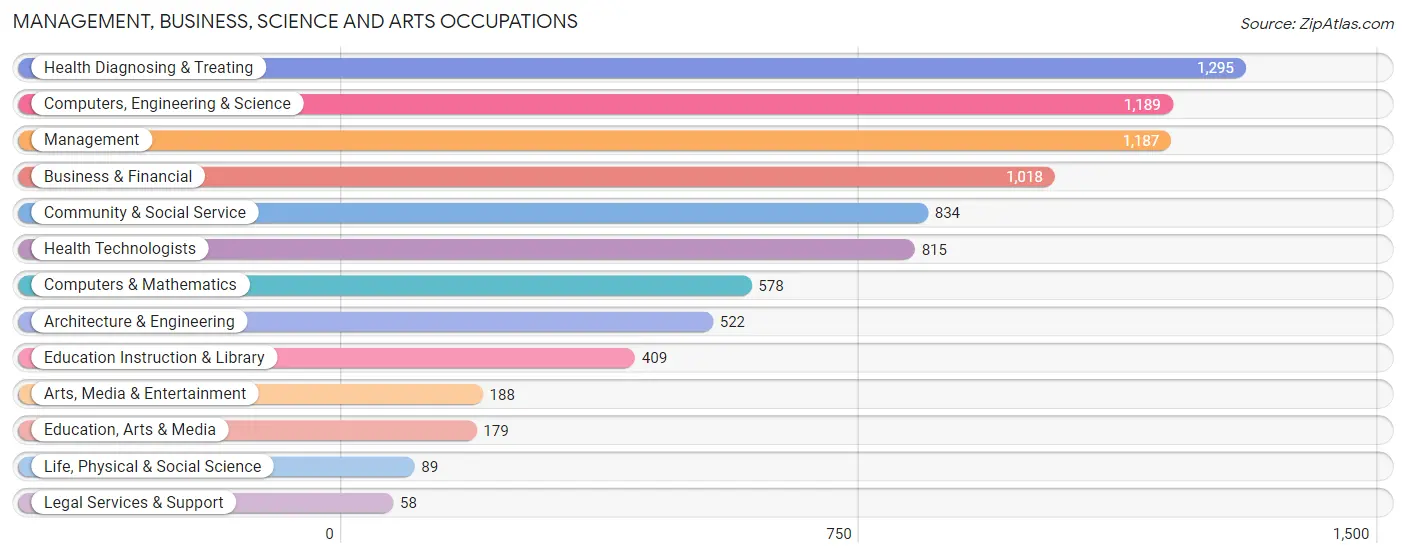
Management, Business, Science and Arts Occupations
The most common Management, Business, Science and Arts occupations in North Lynnwood are Health Diagnosing & Treating (1,295 | 9.0%), Computers, Engineering & Science (1,189 | 8.2%), Management (1,187 | 8.2%), Business & Financial (1,018 | 7.1%), and Community & Social Service (834 | 5.8%).
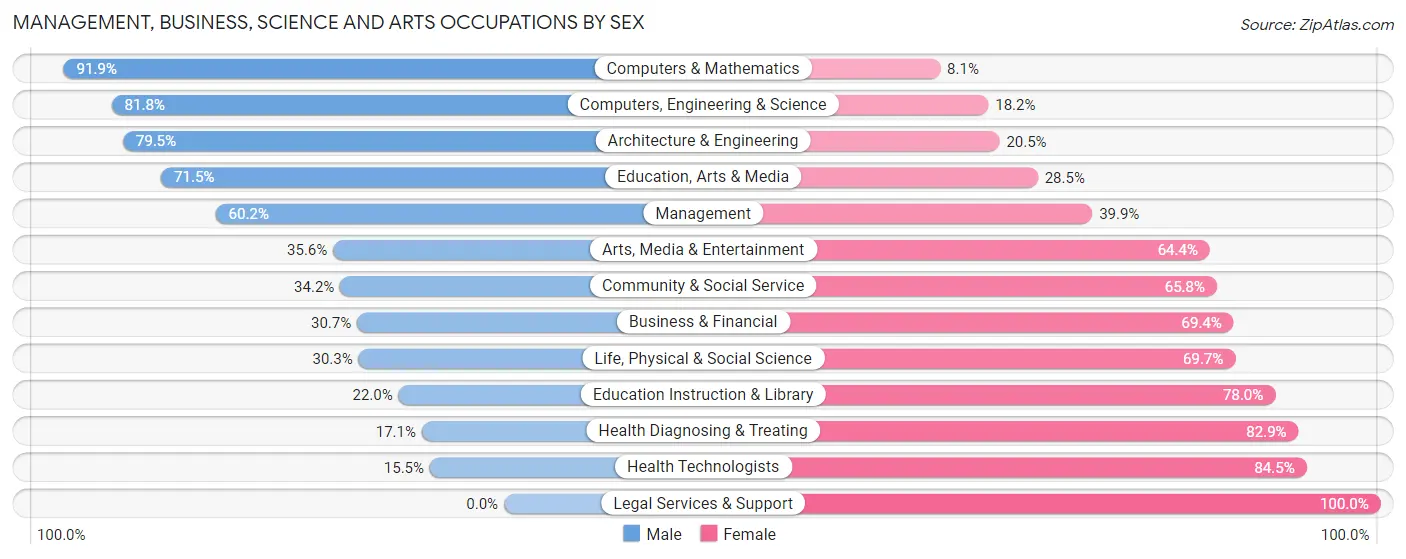
Management, Business, Science and Arts Occupations by Sex
Within the Management, Business, Science and Arts occupations in North Lynnwood, the most male-oriented occupations are Computers & Mathematics (91.9%), Computers, Engineering & Science (81.8%), and Architecture & Engineering (79.5%), while the most female-oriented occupations are Legal Services & Support (100.0%), Health Technologists (84.5%), and Health Diagnosing & Treating (82.9%).
| Occupation | Male | Female |
| Management | 714 (60.2%) | 473 (39.9%) |
| Business & Financial | 312 (30.6%) | 706 (69.4%) |
| Computers, Engineering & Science | 973 (81.8%) | 216 (18.2%) |
| Computers & Mathematics | 531 (91.9%) | 47 (8.1%) |
| Architecture & Engineering | 415 (79.5%) | 107 (20.5%) |
| Life, Physical & Social Science | 27 (30.3%) | 62 (69.7%) |
| Community & Social Service | 285 (34.2%) | 549 (65.8%) |
| Education, Arts & Media | 128 (71.5%) | 51 (28.5%) |
| Legal Services & Support | 0 (0.0%) | 58 (100.0%) |
| Education Instruction & Library | 90 (22.0%) | 319 (78.0%) |
| Arts, Media & Entertainment | 67 (35.6%) | 121 (64.4%) |
| Health Diagnosing & Treating | 222 (17.1%) | 1,073 (82.9%) |
| Health Technologists | 126 (15.5%) | 689 (84.5%) |
| Total (Category) | 2,506 (45.4%) | 3,017 (54.6%) |
| Total (Overall) | 7,333 (50.8%) | 7,094 (49.2%) |
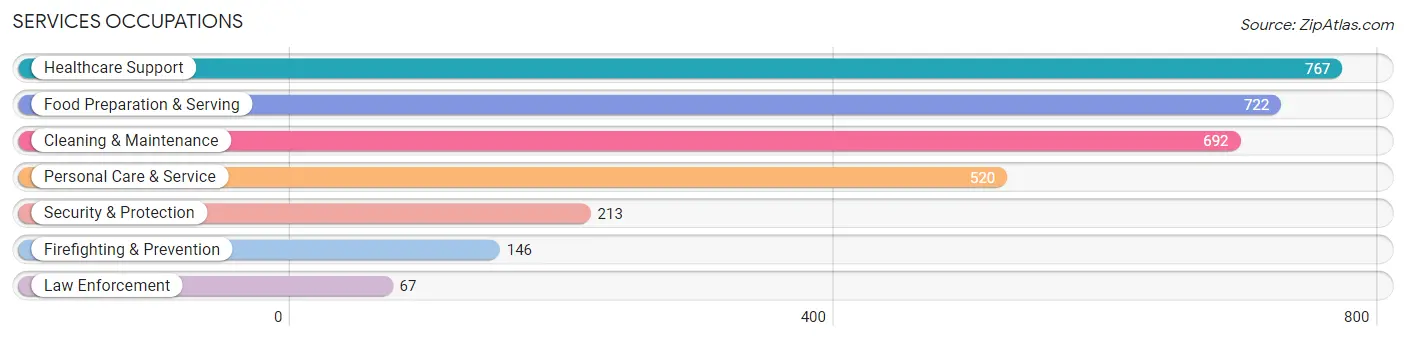
Services Occupations
The most common Services occupations in North Lynnwood are Healthcare Support (767 | 5.3%), Food Preparation & Serving (722 | 5.0%), Cleaning & Maintenance (692 | 4.8%), Personal Care & Service (520 | 3.6%), and Security & Protection (213 | 1.5%).
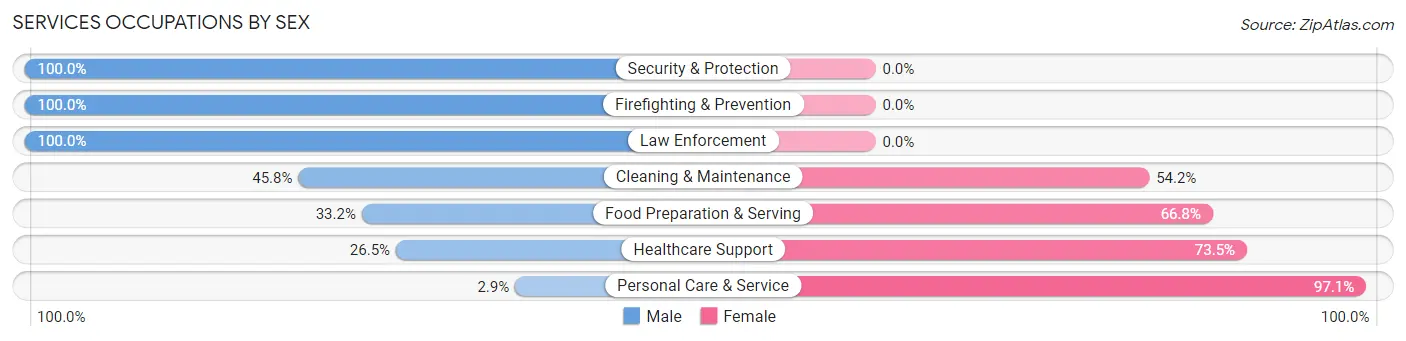
Services Occupations by Sex
Within the Services occupations in North Lynnwood, the most male-oriented occupations are Security & Protection (100.0%), Firefighting & Prevention (100.0%), and Law Enforcement (100.0%), while the most female-oriented occupations are Personal Care & Service (97.1%), Healthcare Support (73.5%), and Food Preparation & Serving (66.8%).
| Occupation | Male | Female |
| Healthcare Support | 203 (26.5%) | 564 (73.5%) |
| Security & Protection | 213 (100.0%) | 0 (0.0%) |
| Firefighting & Prevention | 146 (100.0%) | 0 (0.0%) |
| Law Enforcement | 67 (100.0%) | 0 (0.0%) |
| Food Preparation & Serving | 240 (33.2%) | 482 (66.8%) |
| Cleaning & Maintenance | 317 (45.8%) | 375 (54.2%) |
| Personal Care & Service | 15 (2.9%) | 505 (97.1%) |
| Total (Category) | 988 (33.9%) | 1,926 (66.1%) |
| Total (Overall) | 7,333 (50.8%) | 7,094 (49.2%) |
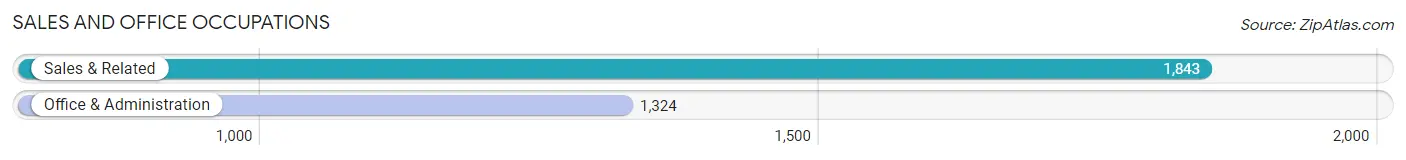
Sales and Office Occupations
The most common Sales and Office occupations in North Lynnwood are Sales & Related (1,843 | 12.8%), and Office & Administration (1,324 | 9.2%).
Sales and Office Occupations by Sex
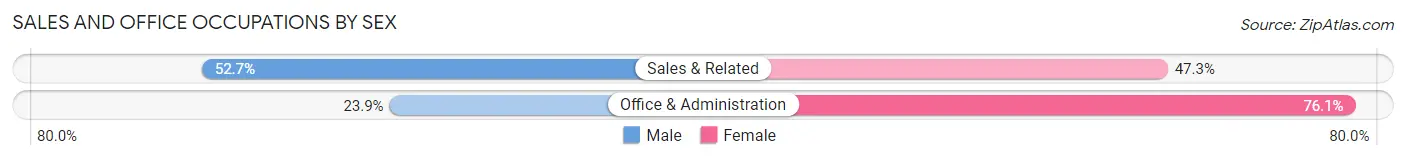
| Occupation | Male | Female |
| Sales & Related | 972 (52.7%) | 871 (47.3%) |
| Office & Administration | 316 (23.9%) | 1,008 (76.1%) |
| Total (Category) | 1,288 (40.7%) | 1,879 (59.3%) |
| Total (Overall) | 7,333 (50.8%) | 7,094 (49.2%) |
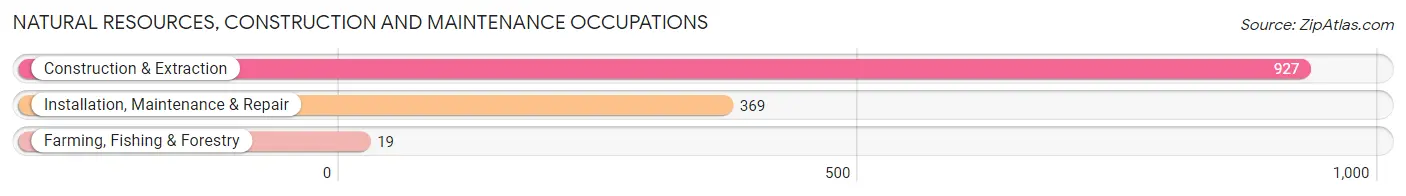
Natural Resources, Construction and Maintenance Occupations
The most common Natural Resources, Construction and Maintenance occupations in North Lynnwood are Construction & Extraction (927 | 6.4%), Installation, Maintenance & Repair (369 | 2.6%), and Farming, Fishing & Forestry (19 | 0.1%).
Natural Resources, Construction and Maintenance Occupations by Sex
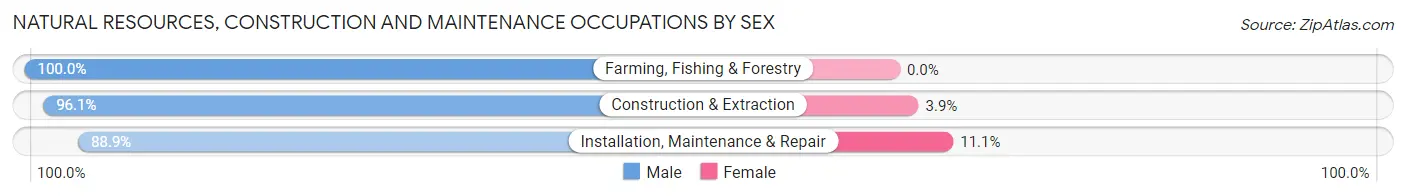
| Occupation | Male | Female |
| Farming, Fishing & Forestry | 19 (100.0%) | 0 (0.0%) |
| Construction & Extraction | 891 (96.1%) | 36 (3.9%) |
| Installation, Maintenance & Repair | 328 (88.9%) | 41 (11.1%) |
| Total (Category) | 1,238 (94.1%) | 77 (5.9%) |
| Total (Overall) | 7,333 (50.8%) | 7,094 (49.2%) |
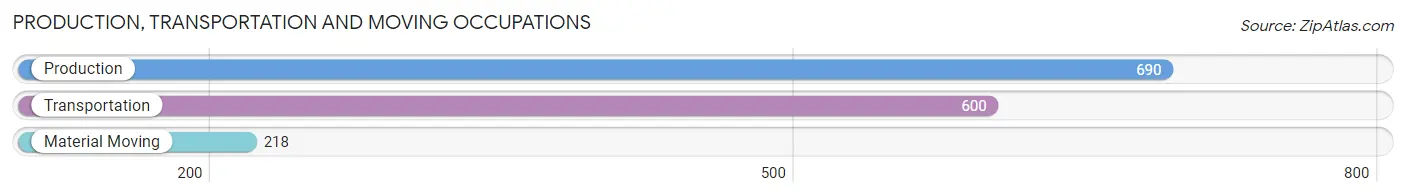
Production, Transportation and Moving Occupations
The most common Production, Transportation and Moving occupations in North Lynnwood are Production (690 | 4.8%), Transportation (600 | 4.2%), and Material Moving (218 | 1.5%).
Production, Transportation and Moving Occupations by Sex
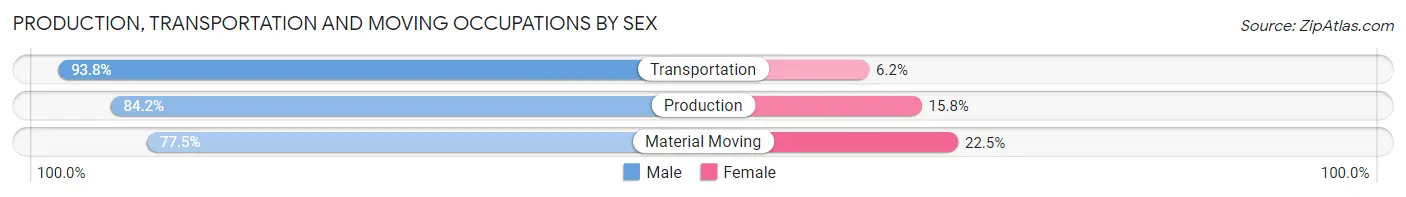
| Occupation | Male | Female |
| Production | 581 (84.2%) | 109 (15.8%) |
| Transportation | 563 (93.8%) | 37 (6.2%) |
| Material Moving | 169 (77.5%) | 49 (22.5%) |
| Total (Category) | 1,313 (87.1%) | 195 (12.9%) |
| Total (Overall) | 7,333 (50.8%) | 7,094 (49.2%) |
Employment Industries by Sex in North Lynnwood
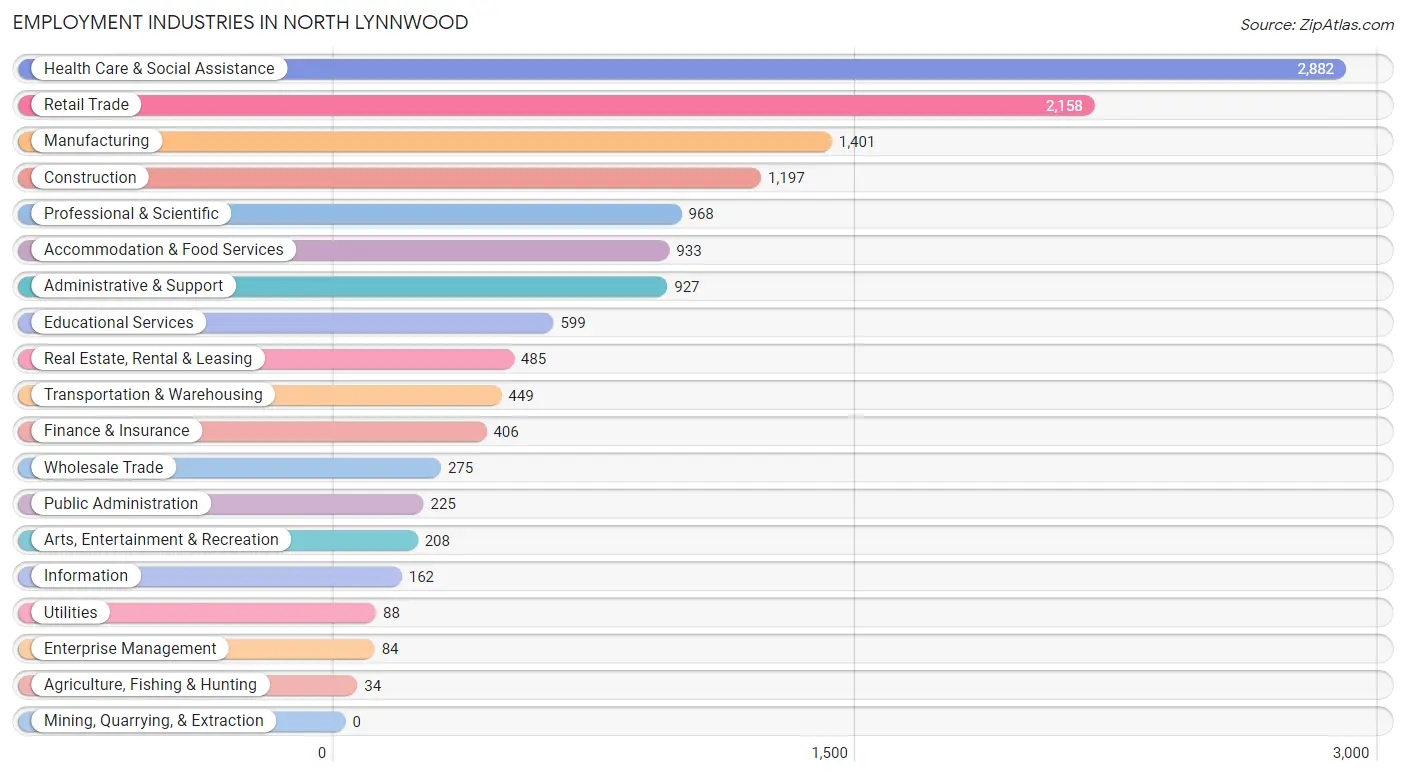
Employment Industries in North Lynnwood
The major employment industries in North Lynnwood include Health Care & Social Assistance (2,882 | 20.0%), Retail Trade (2,158 | 15.0%), Manufacturing (1,401 | 9.7%), Construction (1,197 | 8.3%), and Professional & Scientific (968 | 6.7%).
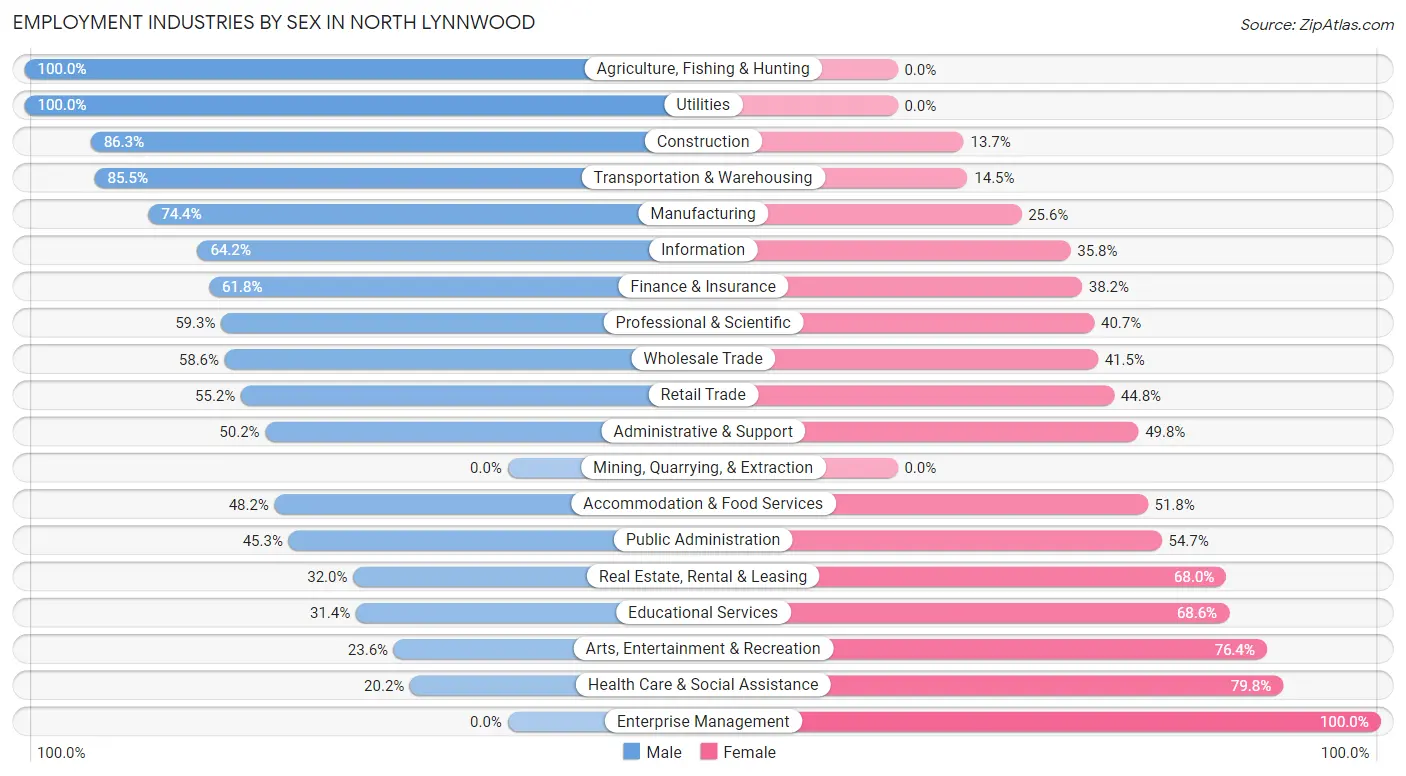
Employment Industries by Sex in North Lynnwood
The North Lynnwood industries that see more men than women are Agriculture, Fishing & Hunting (100.0%), Utilities (100.0%), and Construction (86.3%), whereas the industries that tend to have a higher number of women are Enterprise Management (100.0%), Health Care & Social Assistance (79.8%), and Arts, Entertainment & Recreation (76.4%).
| Industry | Male | Female |
| Agriculture, Fishing & Hunting | 34 (100.0%) | 0 (0.0%) |
| Mining, Quarrying, & Extraction | 0 (0.0%) | 0 (0.0%) |
| Construction | 1,033 (86.3%) | 164 (13.7%) |
| Manufacturing | 1,042 (74.4%) | 359 (25.6%) |
| Wholesale Trade | 161 (58.6%) | 114 (41.4%) |
| Retail Trade | 1,191 (55.2%) | 967 (44.8%) |
| Transportation & Warehousing | 384 (85.5%) | 65 (14.5%) |
| Utilities | 88 (100.0%) | 0 (0.0%) |
| Information | 104 (64.2%) | 58 (35.8%) |
| Finance & Insurance | 251 (61.8%) | 155 (38.2%) |
| Real Estate, Rental & Leasing | 155 (32.0%) | 330 (68.0%) |
| Professional & Scientific | 574 (59.3%) | 394 (40.7%) |
| Enterprise Management | 0 (0.0%) | 84 (100.0%) |
| Administrative & Support | 465 (50.2%) | 462 (49.8%) |
| Educational Services | 188 (31.4%) | 411 (68.6%) |
| Health Care & Social Assistance | 582 (20.2%) | 2,300 (79.8%) |
| Arts, Entertainment & Recreation | 49 (23.6%) | 159 (76.4%) |
| Accommodation & Food Services | 450 (48.2%) | 483 (51.8%) |
| Public Administration | 102 (45.3%) | 123 (54.7%) |
| Total | 7,333 (50.8%) | 7,094 (49.2%) |
Education in North Lynnwood
School Enrollment in North Lynnwood
The most common levels of schooling among the 5,529 students in North Lynnwood are middle school (1,442 | 26.1%), high school (1,183 | 21.4%), and college / undergraduate (1,112 | 20.1%).

| School Level | # Students | % Students |
| Nursery / Preschool | 317 | 5.7% |
| Kindergarten | 154 | 2.8% |
| Elementary School | 970 | 17.5% |
| Middle School | 1,442 | 26.1% |
| High School | 1,183 | 21.4% |
| College / Undergraduate | 1,112 | 20.1% |
| Graduate / Professional | 351 | 6.4% |
| Total | 5,529 | 100.0% |
School Enrollment by Age by Funding Source in North Lynnwood
Out of a total of 5,529 students who are enrolled in schools in North Lynnwood, 1,006 (18.2%) attend a private institution, while the remaining 4,523 (81.8%) are enrolled in public schools. The age group of 18 to 19 year olds has the highest likelihood of being enrolled in private schools, with 105 (43.9% in the age bracket) enrolled. Conversely, the age group of 20 to 24 year olds has the lowest likelihood of being enrolled in a private school, with 524 (94.6% in the age bracket) attending a public institution.
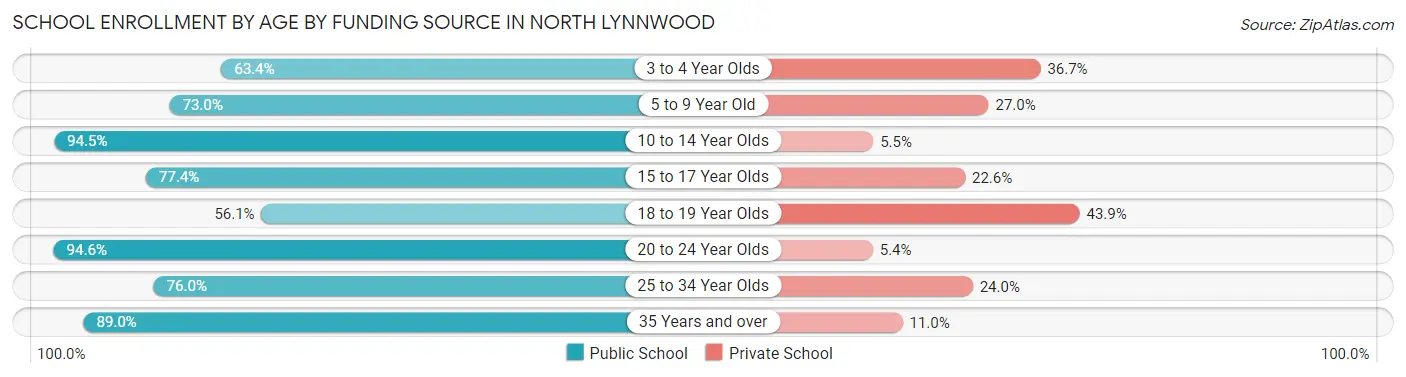
| Age Bracket | Public School | Private School |
| 3 to 4 Year Olds | 159 (63.3%) | 92 (36.6%) |
| 5 to 9 Year Old | 836 (73.0%) | 309 (27.0%) |
| 10 to 14 Year Olds | 1,426 (94.5%) | 83 (5.5%) |
| 15 to 17 Year Olds | 668 (77.4%) | 195 (22.6%) |
| 18 to 19 Year Olds | 134 (56.1%) | 105 (43.9%) |
| 20 to 24 Year Olds | 524 (94.6%) | 30 (5.4%) |
| 25 to 34 Year Olds | 493 (76.0%) | 156 (24.0%) |
| 35 Years and over | 284 (89.0%) | 35 (11.0%) |
| Total | 4,523 (81.8%) | 1,006 (18.2%) |
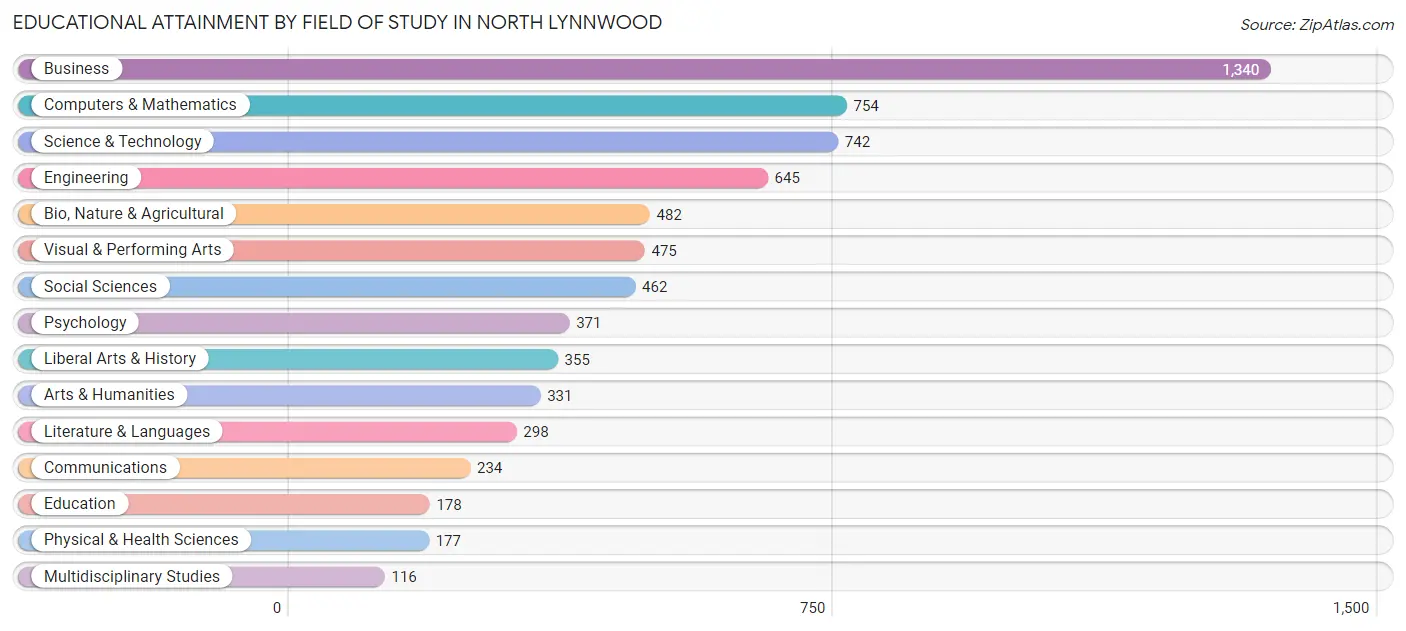
Educational Attainment by Field of Study in North Lynnwood
Business (1,340 | 19.3%), computers & mathematics (754 | 10.8%), science & technology (742 | 10.7%), engineering (645 | 9.3%), and bio, nature & agricultural (482 | 6.9%) are the most common fields of study among 6,960 individuals in North Lynnwood who have obtained a bachelor's degree or higher.
| Field of Study | # Graduates | % Graduates |
| Computers & Mathematics | 754 | 10.8% |
| Bio, Nature & Agricultural | 482 | 6.9% |
| Physical & Health Sciences | 177 | 2.5% |
| Psychology | 371 | 5.3% |
| Social Sciences | 462 | 6.6% |
| Engineering | 645 | 9.3% |
| Multidisciplinary Studies | 116 | 1.7% |
| Science & Technology | 742 | 10.7% |
| Business | 1,340 | 19.3% |
| Education | 178 | 2.6% |
| Literature & Languages | 298 | 4.3% |
| Liberal Arts & History | 355 | 5.1% |
| Visual & Performing Arts | 475 | 6.8% |
| Communications | 234 | 3.4% |
| Arts & Humanities | 331 | 4.8% |
| Total | 6,960 | 100.0% |
Transportation & Commute in North Lynnwood
Vehicle Availability by Sex in North Lynnwood
The most prevalent vehicle ownership categories in North Lynnwood are males with 2 vehicles (3,214, accounting for 44.5%) and females with 2 vehicles (3,308, making up 46.5%).
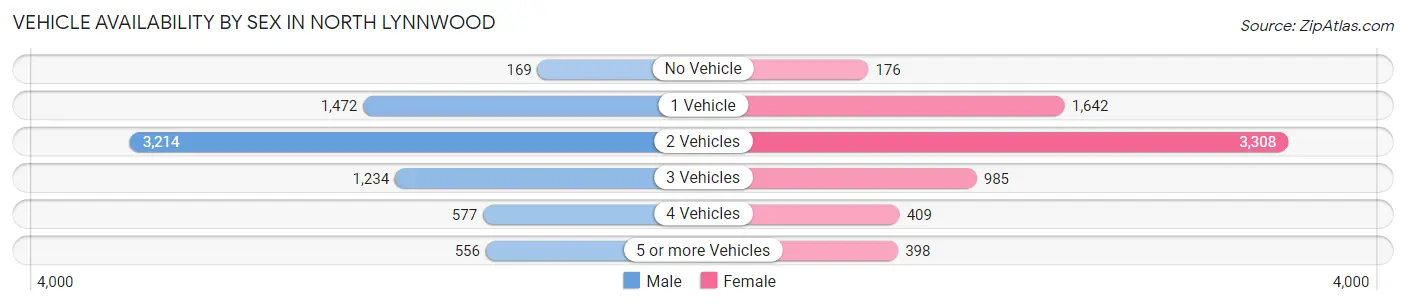
| Vehicles Available | Male | Female |
| No Vehicle | 169 (2.3%) | 176 (2.5%) |
| 1 Vehicle | 1,472 (20.4%) | 1,642 (23.7%) |
| 2 Vehicles | 3,214 (44.5%) | 3,308 (47.8%) |
| 3 Vehicles | 1,234 (17.1%) | 985 (14.2%) |
| 4 Vehicles | 577 (8.0%) | 409 (5.9%) |
| 5 or more Vehicles | 556 (7.7%) | 398 (5.8%) |
| Total | 7,222 (100.0%) | 6,918 (100.0%) |
Commute Time in North Lynnwood
The most frequently occuring commute durations in North Lynnwood are 30 to 34 minutes (2,360 commuters, 19.2%), 20 to 24 minutes (1,793 commuters, 14.6%), and 45 to 59 minutes (1,618 commuters, 13.2%).
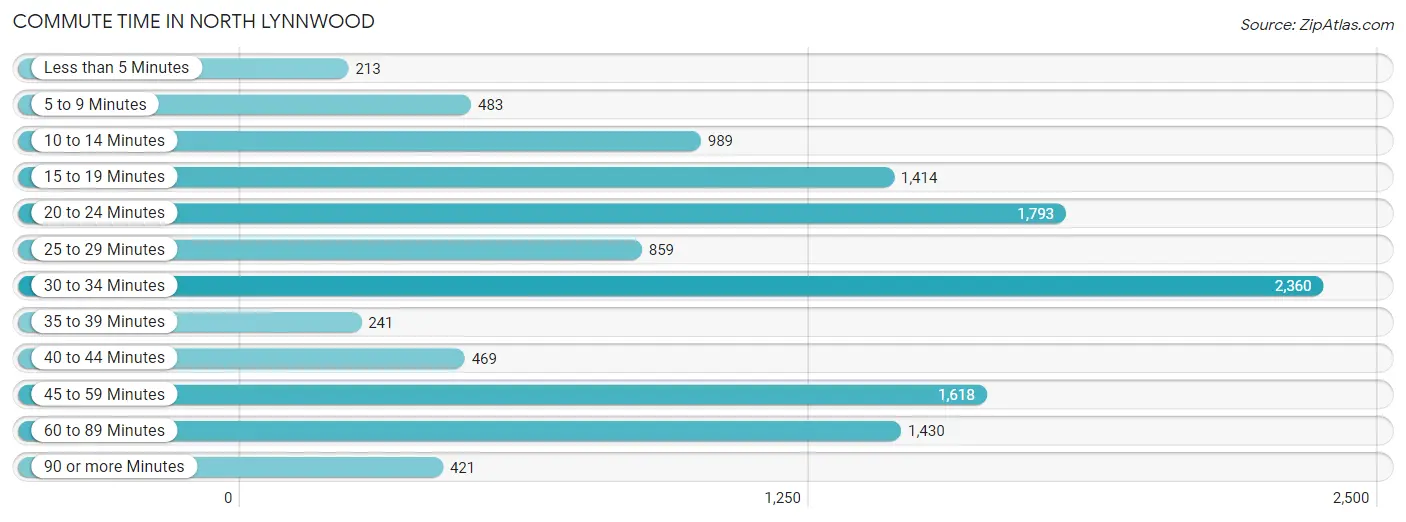
| Commute Time | # Commuters | % Commuters |
| Less than 5 Minutes | 213 | 1.7% |
| 5 to 9 Minutes | 483 | 3.9% |
| 10 to 14 Minutes | 989 | 8.1% |
| 15 to 19 Minutes | 1,414 | 11.5% |
| 20 to 24 Minutes | 1,793 | 14.6% |
| 25 to 29 Minutes | 859 | 7.0% |
| 30 to 34 Minutes | 2,360 | 19.2% |
| 35 to 39 Minutes | 241 | 2.0% |
| 40 to 44 Minutes | 469 | 3.8% |
| 45 to 59 Minutes | 1,618 | 13.2% |
| 60 to 89 Minutes | 1,430 | 11.6% |
| 90 or more Minutes | 421 | 3.4% |
Commute Time by Sex in North Lynnwood
The most common commute times in North Lynnwood are 30 to 34 minutes (1,078 commuters, 17.4%) for males and 30 to 34 minutes (1,282 commuters, 21.0%) for females.
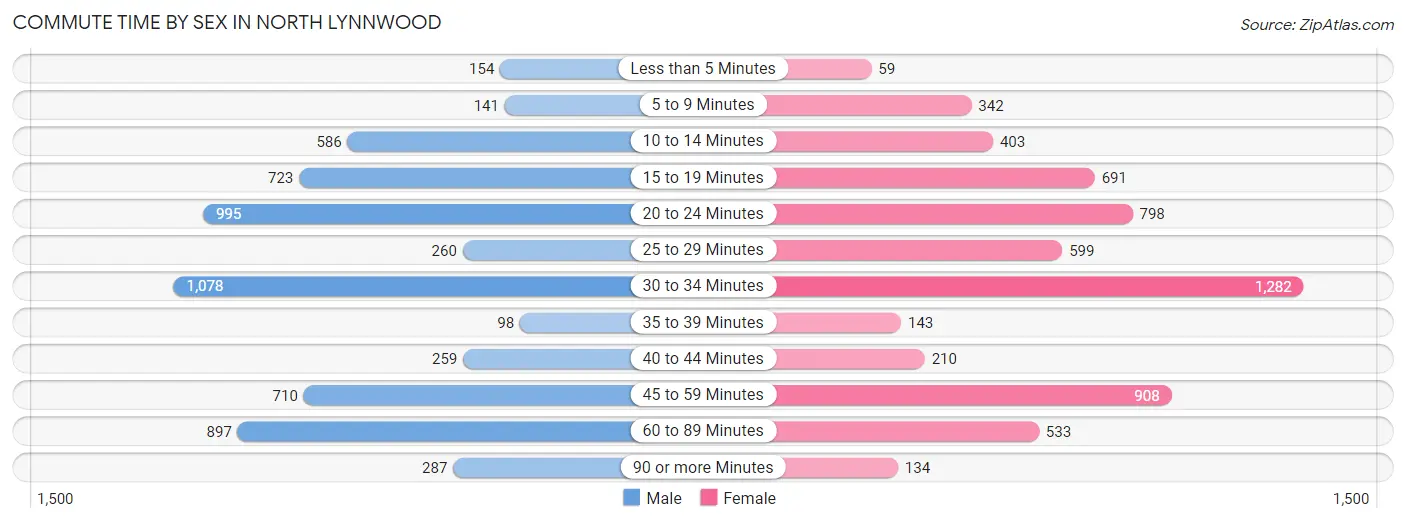
| Commute Time | Male | Female |
| Less than 5 Minutes | 154 (2.5%) | 59 (1.0%) |
| 5 to 9 Minutes | 141 (2.3%) | 342 (5.6%) |
| 10 to 14 Minutes | 586 (9.5%) | 403 (6.6%) |
| 15 to 19 Minutes | 723 (11.7%) | 691 (11.3%) |
| 20 to 24 Minutes | 995 (16.1%) | 798 (13.1%) |
| 25 to 29 Minutes | 260 (4.2%) | 599 (9.8%) |
| 30 to 34 Minutes | 1,078 (17.4%) | 1,282 (21.0%) |
| 35 to 39 Minutes | 98 (1.6%) | 143 (2.3%) |
| 40 to 44 Minutes | 259 (4.2%) | 210 (3.4%) |
| 45 to 59 Minutes | 710 (11.5%) | 908 (14.9%) |
| 60 to 89 Minutes | 897 (14.5%) | 533 (8.7%) |
| 90 or more Minutes | 287 (4.6%) | 134 (2.2%) |
Time of Departure to Work by Sex in North Lynnwood
The most frequent times of departure to work in North Lynnwood are 8:00 AM to 8:29 AM (730, 11.8%) for males and 7:00 AM to 7:29 AM (761, 12.5%) for females.
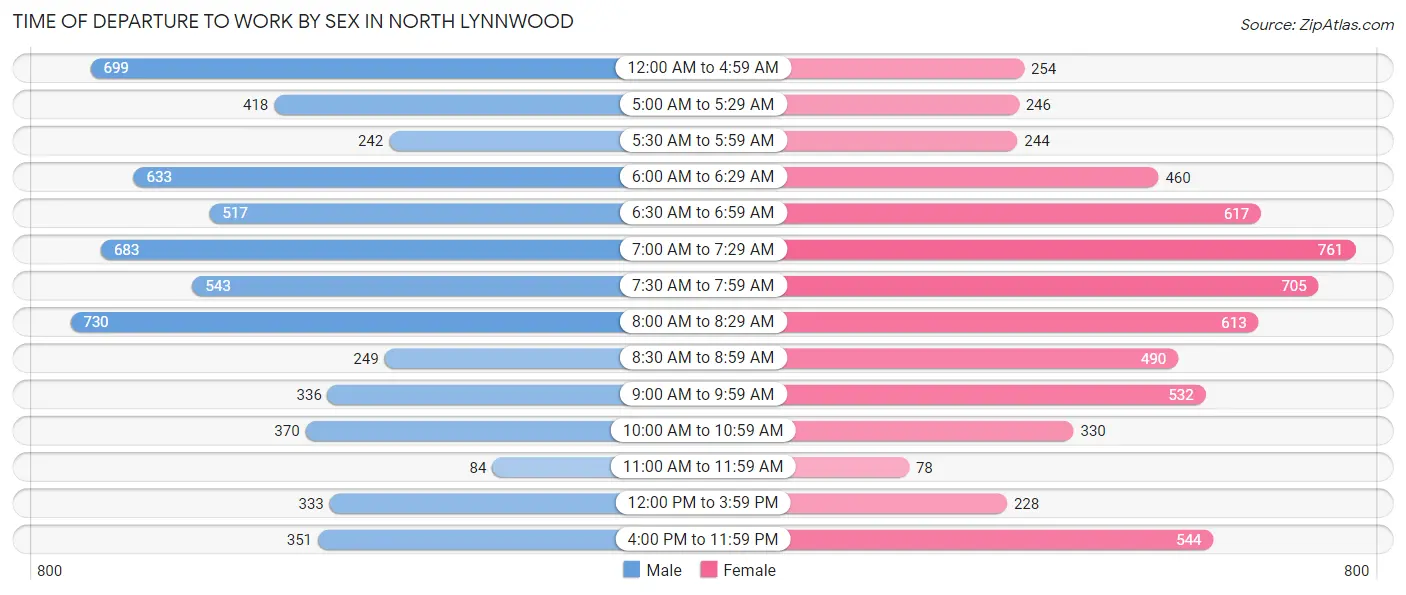
| Time of Departure | Male | Female |
| 12:00 AM to 4:59 AM | 699 (11.3%) | 254 (4.2%) |
| 5:00 AM to 5:29 AM | 418 (6.8%) | 246 (4.0%) |
| 5:30 AM to 5:59 AM | 242 (3.9%) | 244 (4.0%) |
| 6:00 AM to 6:29 AM | 633 (10.2%) | 460 (7.5%) |
| 6:30 AM to 6:59 AM | 517 (8.4%) | 617 (10.1%) |
| 7:00 AM to 7:29 AM | 683 (11.0%) | 761 (12.5%) |
| 7:30 AM to 7:59 AM | 543 (8.8%) | 705 (11.6%) |
| 8:00 AM to 8:29 AM | 730 (11.8%) | 613 (10.1%) |
| 8:30 AM to 8:59 AM | 249 (4.0%) | 490 (8.0%) |
| 9:00 AM to 9:59 AM | 336 (5.4%) | 532 (8.7%) |
| 10:00 AM to 10:59 AM | 370 (6.0%) | 330 (5.4%) |
| 11:00 AM to 11:59 AM | 84 (1.4%) | 78 (1.3%) |
| 12:00 PM to 3:59 PM | 333 (5.4%) | 228 (3.7%) |
| 4:00 PM to 11:59 PM | 351 (5.7%) | 544 (8.9%) |
| Total | 6,188 (100.0%) | 6,102 (100.0%) |
Housing Occupancy in North Lynnwood
Occupancy by Ownership in North Lynnwood
Of the total 9,765 dwellings in North Lynnwood, owner-occupied units account for 4,384 (44.9%), while renter-occupied units make up 5,381 (55.1%).
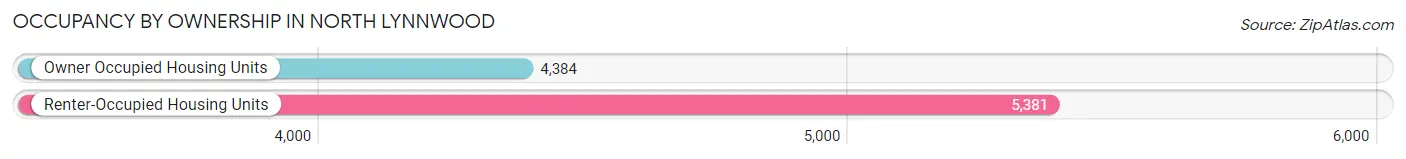
| Occupancy | # Housing Units | % Housing Units |
| Owner Occupied Housing Units | 4,384 | 44.9% |
| Renter-Occupied Housing Units | 5,381 | 55.1% |
| Total Occupied Housing Units | 9,765 | 100.0% |
Occupancy by Household Size in North Lynnwood
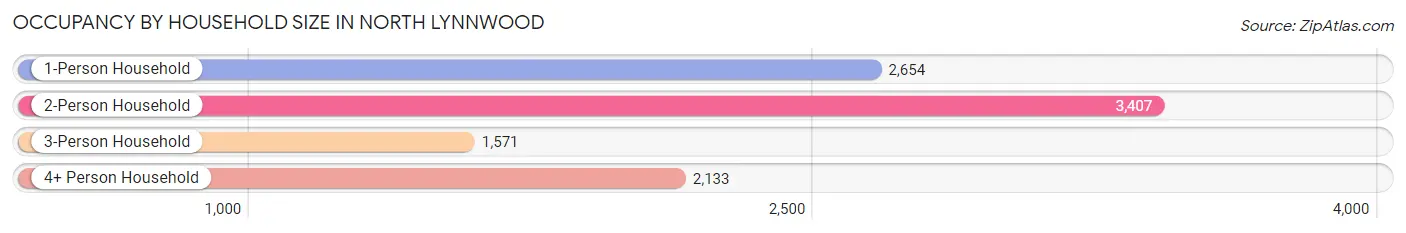
| Household Size | # Housing Units | % Housing Units |
| 1-Person Household | 2,654 | 27.2% |
| 2-Person Household | 3,407 | 34.9% |
| 3-Person Household | 1,571 | 16.1% |
| 4+ Person Household | 2,133 | 21.8% |
| Total Housing Units | 9,765 | 100.0% |
Occupancy by Ownership by Household Size in North Lynnwood
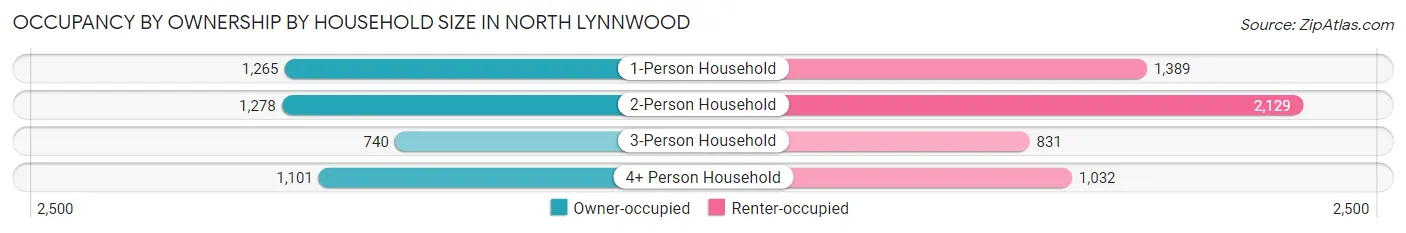
| Household Size | Owner-occupied | Renter-occupied |
| 1-Person Household | 1,265 (47.7%) | 1,389 (52.3%) |
| 2-Person Household | 1,278 (37.5%) | 2,129 (62.5%) |
| 3-Person Household | 740 (47.1%) | 831 (52.9%) |
| 4+ Person Household | 1,101 (51.6%) | 1,032 (48.4%) |
| Total Housing Units | 4,384 (44.9%) | 5,381 (55.1%) |
Occupancy by Educational Attainment in North Lynnwood
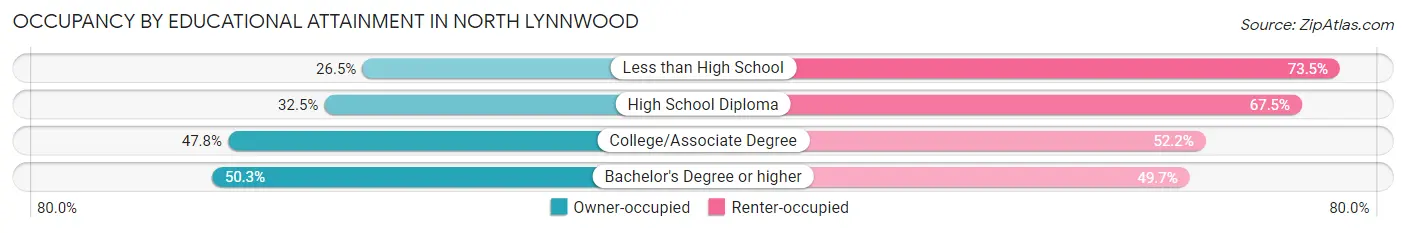
| Household Size | Owner-occupied | Renter-occupied |
| Less than High School | 218 (26.5%) | 606 (73.5%) |
| High School Diploma | 465 (32.5%) | 966 (67.5%) |
| College/Associate Degree | 1,443 (47.8%) | 1,578 (52.2%) |
| Bachelor's Degree or higher | 2,258 (50.3%) | 2,231 (49.7%) |
Occupancy by Age of Householder in North Lynnwood
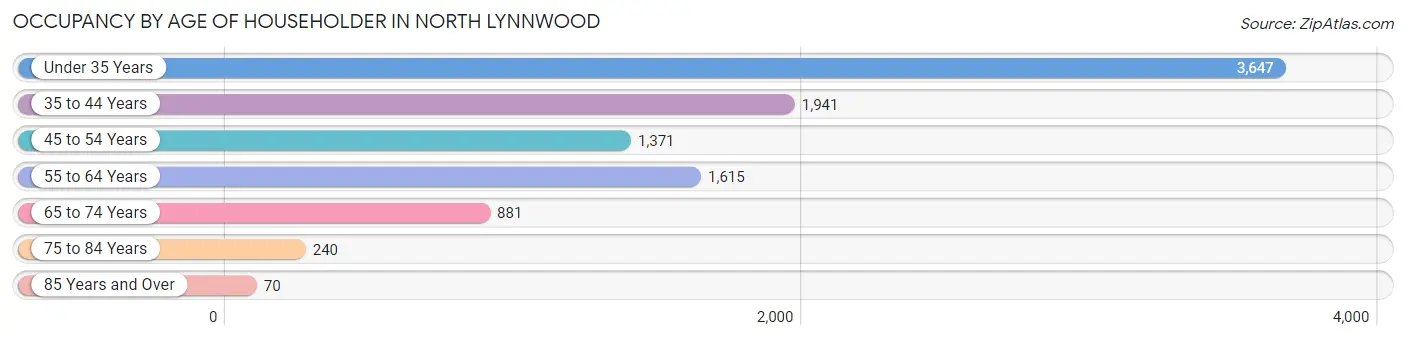
| Age Bracket | # Households | % Households |
| Under 35 Years | 3,647 | 37.3% |
| 35 to 44 Years | 1,941 | 19.9% |
| 45 to 54 Years | 1,371 | 14.0% |
| 55 to 64 Years | 1,615 | 16.5% |
| 65 to 74 Years | 881 | 9.0% |
| 75 to 84 Years | 240 | 2.5% |
| 85 Years and Over | 70 | 0.7% |
| Total | 9,765 | 100.0% |
Housing Finances in North Lynnwood
Median Income by Occupancy in North Lynnwood
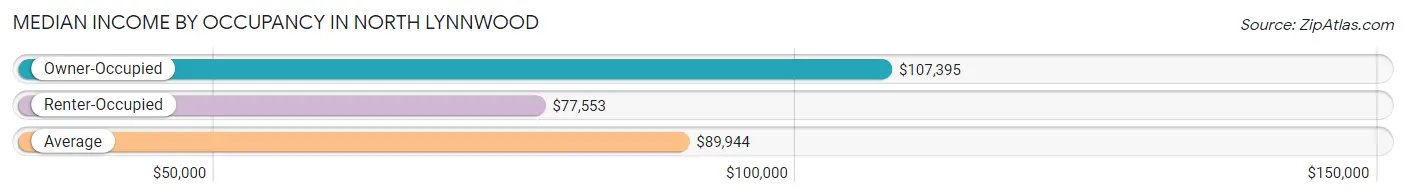
| Occupancy Type | # Households | Median Income |
| Owner-Occupied | 4,384 (44.9%) | $107,395 |
| Renter-Occupied | 5,381 (55.1%) | $77,553 |
| Average | 9,765 (100.0%) | $89,944 |
Occupancy by Householder Income Bracket in North Lynnwood
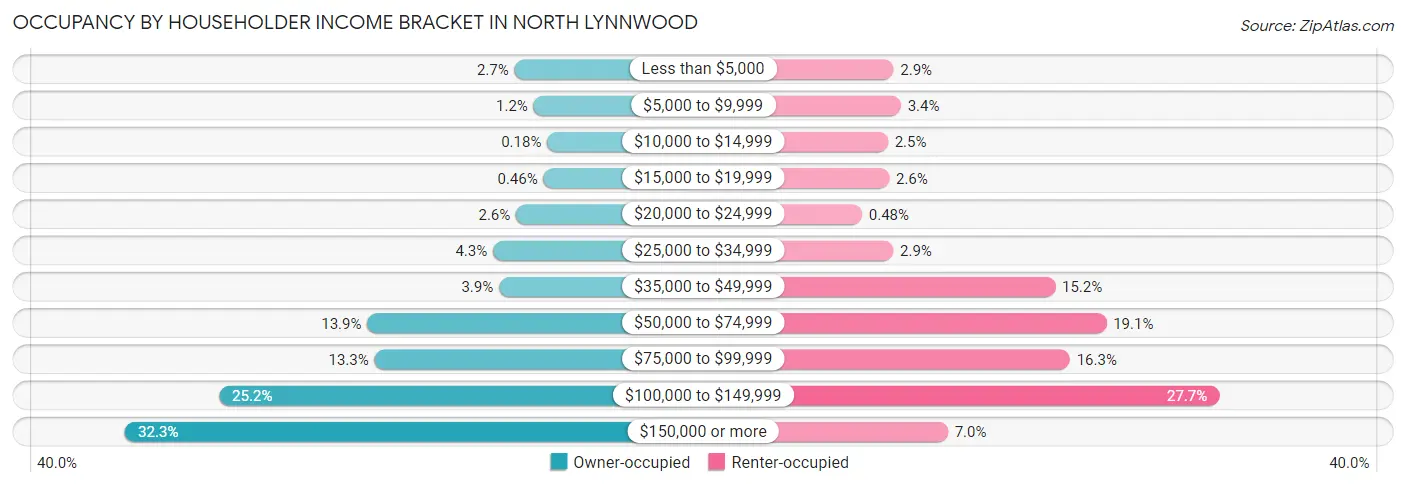
| Income Bracket | Owner-occupied | Renter-occupied |
| Less than $5,000 | 117 (2.7%) | 155 (2.9%) |
| $5,000 to $9,999 | 53 (1.2%) | 185 (3.4%) |
| $10,000 to $14,999 | 8 (0.2%) | 132 (2.5%) |
| $15,000 to $19,999 | 20 (0.5%) | 137 (2.5%) |
| $20,000 to $24,999 | 112 (2.5%) | 26 (0.5%) |
| $25,000 to $34,999 | 189 (4.3%) | 154 (2.9%) |
| $35,000 to $49,999 | 169 (3.8%) | 818 (15.2%) |
| $50,000 to $74,999 | 609 (13.9%) | 1,028 (19.1%) |
| $75,000 to $99,999 | 585 (13.3%) | 878 (16.3%) |
| $100,000 to $149,999 | 1,104 (25.2%) | 1,490 (27.7%) |
| $150,000 or more | 1,418 (32.3%) | 378 (7.0%) |
| Total | 4,384 (100.0%) | 5,381 (100.0%) |
Monthly Housing Cost Tiers in North Lynnwood
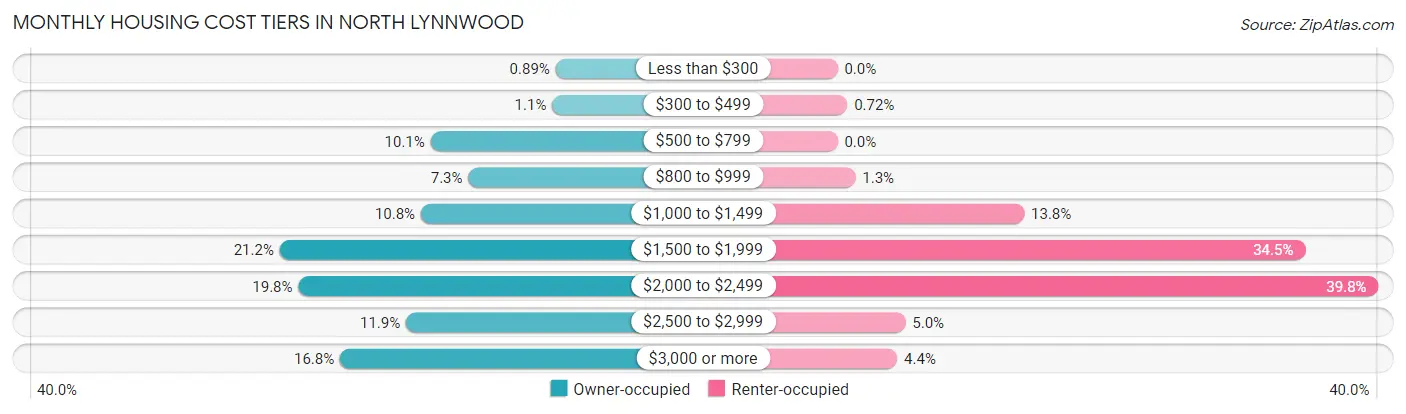
| Monthly Cost | Owner-occupied | Renter-occupied |
| Less than $300 | 39 (0.9%) | 0 (0.0%) |
| $300 to $499 | 50 (1.1%) | 39 (0.7%) |
| $500 to $799 | 443 (10.1%) | 0 (0.0%) |
| $800 to $999 | 321 (7.3%) | 71 (1.3%) |
| $1,000 to $1,499 | 474 (10.8%) | 740 (13.8%) |
| $1,500 to $1,999 | 930 (21.2%) | 1,854 (34.4%) |
| $2,000 to $2,499 | 870 (19.8%) | 2,144 (39.8%) |
| $2,500 to $2,999 | 522 (11.9%) | 269 (5.0%) |
| $3,000 or more | 735 (16.8%) | 237 (4.4%) |
| Total | 4,384 (100.0%) | 5,381 (100.0%) |
Physical Housing Characteristics in North Lynnwood
Housing Structures in North Lynnwood
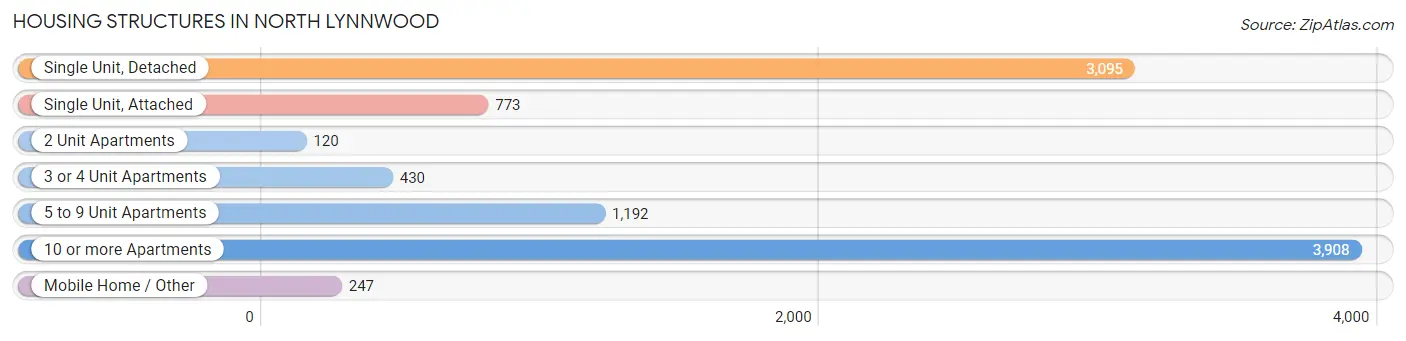
| Structure Type | # Housing Units | % Housing Units |
| Single Unit, Detached | 3,095 | 31.7% |
| Single Unit, Attached | 773 | 7.9% |
| 2 Unit Apartments | 120 | 1.2% |
| 3 or 4 Unit Apartments | 430 | 4.4% |
| 5 to 9 Unit Apartments | 1,192 | 12.2% |
| 10 or more Apartments | 3,908 | 40.0% |
| Mobile Home / Other | 247 | 2.5% |
| Total | 9,765 | 100.0% |
Housing Structures by Occupancy in North Lynnwood
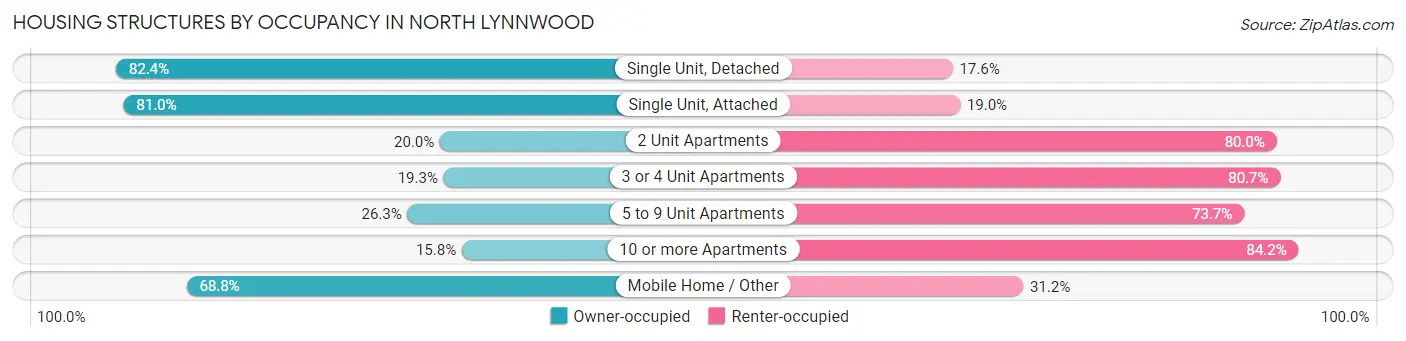
| Structure Type | Owner-occupied | Renter-occupied |
| Single Unit, Detached | 2,551 (82.4%) | 544 (17.6%) |
| Single Unit, Attached | 626 (81.0%) | 147 (19.0%) |
| 2 Unit Apartments | 24 (20.0%) | 96 (80.0%) |
| 3 or 4 Unit Apartments | 83 (19.3%) | 347 (80.7%) |
| 5 to 9 Unit Apartments | 313 (26.3%) | 879 (73.7%) |
| 10 or more Apartments | 617 (15.8%) | 3,291 (84.2%) |
| Mobile Home / Other | 170 (68.8%) | 77 (31.2%) |
| Total | 4,384 (44.9%) | 5,381 (55.1%) |
Housing Structures by Number of Rooms in North Lynnwood
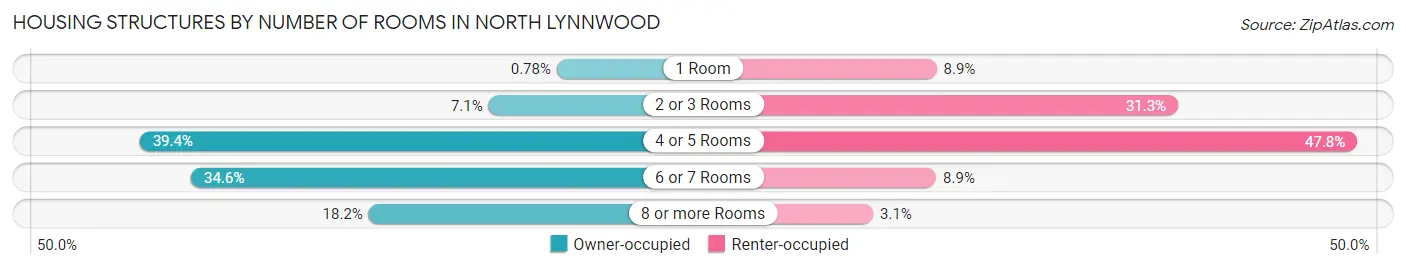
| Number of Rooms | Owner-occupied | Renter-occupied |
| 1 Room | 34 (0.8%) | 481 (8.9%) |
| 2 or 3 Rooms | 311 (7.1%) | 1,682 (31.3%) |
| 4 or 5 Rooms | 1,725 (39.4%) | 2,574 (47.8%) |
| 6 or 7 Rooms | 1,517 (34.6%) | 479 (8.9%) |
| 8 or more Rooms | 797 (18.2%) | 165 (3.1%) |
| Total | 4,384 (100.0%) | 5,381 (100.0%) |
Housing Structure by Heating Type in North Lynnwood
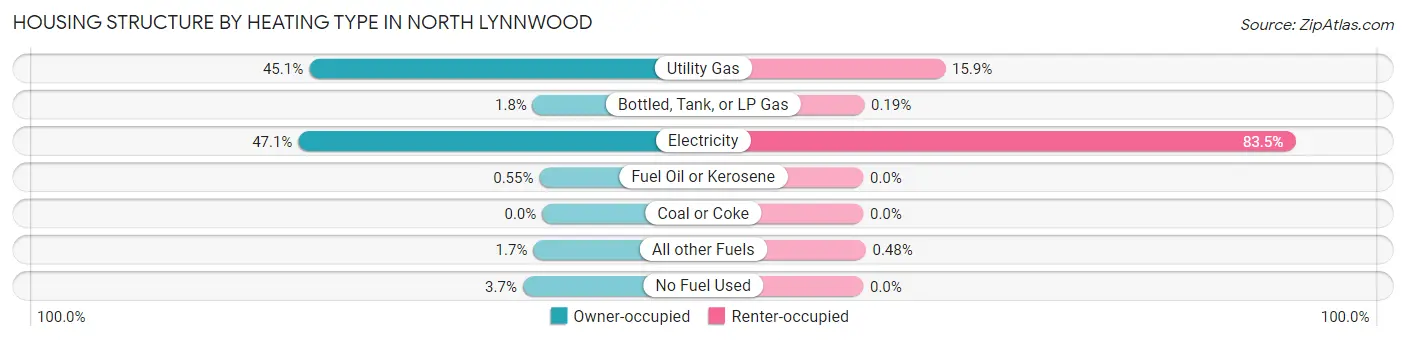
| Heating Type | Owner-occupied | Renter-occupied |
| Utility Gas | 1,975 (45.1%) | 853 (15.9%) |
| Bottled, Tank, or LP Gas | 80 (1.8%) | 10 (0.2%) |
| Electricity | 2,066 (47.1%) | 4,492 (83.5%) |
| Fuel Oil or Kerosene | 24 (0.5%) | 0 (0.0%) |
| Coal or Coke | 0 (0.0%) | 0 (0.0%) |
| All other Fuels | 75 (1.7%) | 26 (0.5%) |
| No Fuel Used | 164 (3.7%) | 0 (0.0%) |
| Total | 4,384 (100.0%) | 5,381 (100.0%) |
Household Vehicle Usage in North Lynnwood
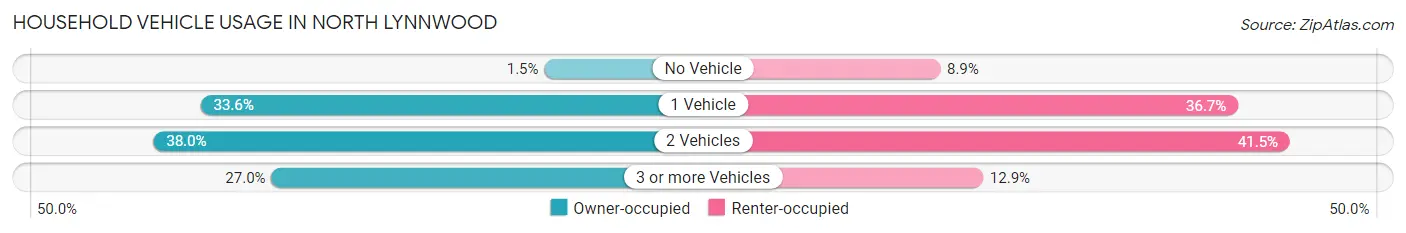
| Vehicles per Household | Owner-occupied | Renter-occupied |
| No Vehicle | 65 (1.5%) | 478 (8.9%) |
| 1 Vehicle | 1,472 (33.6%) | 1,975 (36.7%) |
| 2 Vehicles | 1,665 (38.0%) | 2,235 (41.5%) |
| 3 or more Vehicles | 1,182 (27.0%) | 693 (12.9%) |
| Total | 4,384 (100.0%) | 5,381 (100.0%) |
Real Estate & Mortgages in North Lynnwood
Real Estate and Mortgage Overview in North Lynnwood
| Characteristic | Without Mortgage | With Mortgage |
| Housing Units | 962 | 3,422 |
| Median Property Value | $454,300 | $542,600 |
| Median Household Income | $63,662 | $1,318 |
| Monthly Housing Costs | $782 | $735 |
| Real Estate Taxes | $3,931 | $59 |
Property Value by Mortgage Status in North Lynnwood
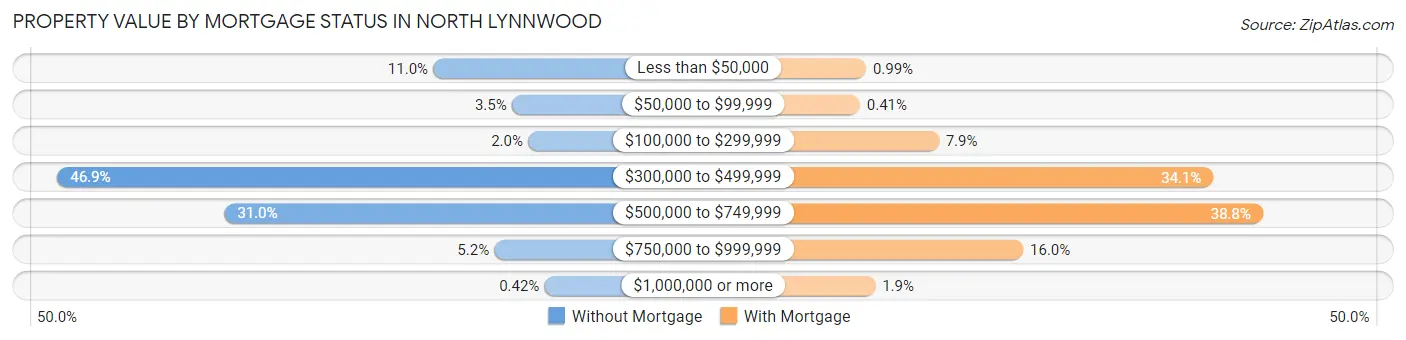
| Property Value | Without Mortgage | With Mortgage |
| Less than $50,000 | 106 (11.0%) | 34 (1.0%) |
| $50,000 to $99,999 | 34 (3.5%) | 14 (0.4%) |
| $100,000 to $299,999 | 19 (2.0%) | 271 (7.9%) |
| $300,000 to $499,999 | 451 (46.9%) | 1,166 (34.1%) |
| $500,000 to $749,999 | 298 (31.0%) | 1,327 (38.8%) |
| $750,000 to $999,999 | 50 (5.2%) | 546 (16.0%) |
| $1,000,000 or more | 4 (0.4%) | 64 (1.9%) |
| Total | 962 (100.0%) | 3,422 (100.0%) |
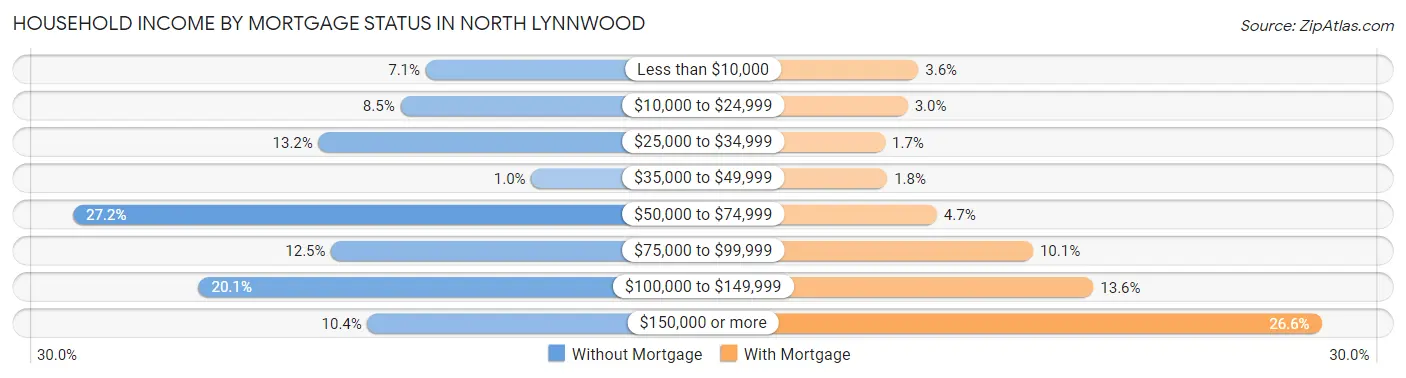
Household Income by Mortgage Status in North Lynnwood
| Household Income | Without Mortgage | With Mortgage |
| Less than $10,000 | 68 (7.1%) | 123 (3.6%) |
| $10,000 to $24,999 | 82 (8.5%) | 102 (3.0%) |
| $25,000 to $34,999 | 127 (13.2%) | 58 (1.7%) |
| $35,000 to $49,999 | 10 (1.0%) | 62 (1.8%) |
| $50,000 to $74,999 | 262 (27.2%) | 159 (4.6%) |
| $75,000 to $99,999 | 120 (12.5%) | 347 (10.1%) |
| $100,000 to $149,999 | 193 (20.1%) | 465 (13.6%) |
| $150,000 or more | 100 (10.4%) | 911 (26.6%) |
| Total | 962 (100.0%) | 3,422 (100.0%) |
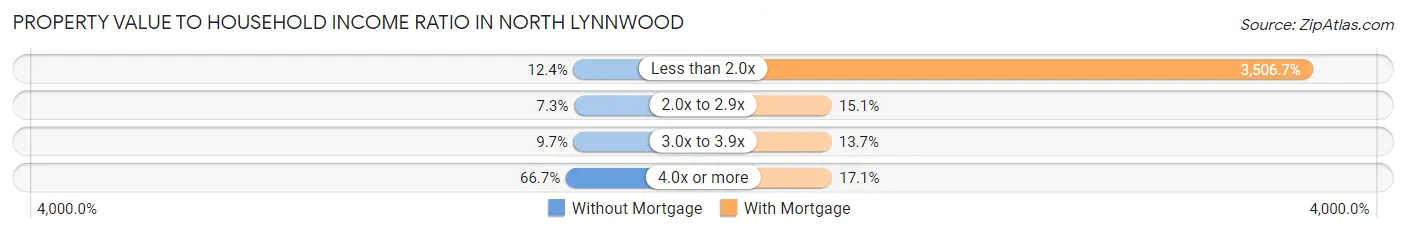
Property Value to Household Income Ratio in North Lynnwood
| Value-to-Income Ratio | Without Mortgage | With Mortgage |
| Less than 2.0x | 119 (12.4%) | 120,000 (3,506.7%) |
| 2.0x to 2.9x | 70 (7.3%) | 517 (15.1%) |
| 3.0x to 3.9x | 93 (9.7%) | 470 (13.7%) |
| 4.0x or more | 642 (66.7%) | 586 (17.1%) |
| Total | 962 (100.0%) | 3,422 (100.0%) |
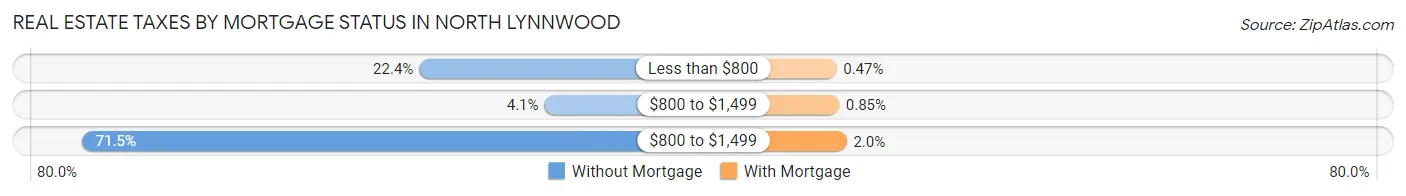
Real Estate Taxes by Mortgage Status in North Lynnwood
| Property Taxes | Without Mortgage | With Mortgage |
| Less than $800 | 215 (22.4%) | 16 (0.5%) |
| $800 to $1,499 | 39 (4.1%) | 29 (0.9%) |
| $800 to $1,499 | 688 (71.5%) | 67 (2.0%) |
| Total | 962 (100.0%) | 3,422 (100.0%) |
Health & Disability in North Lynnwood
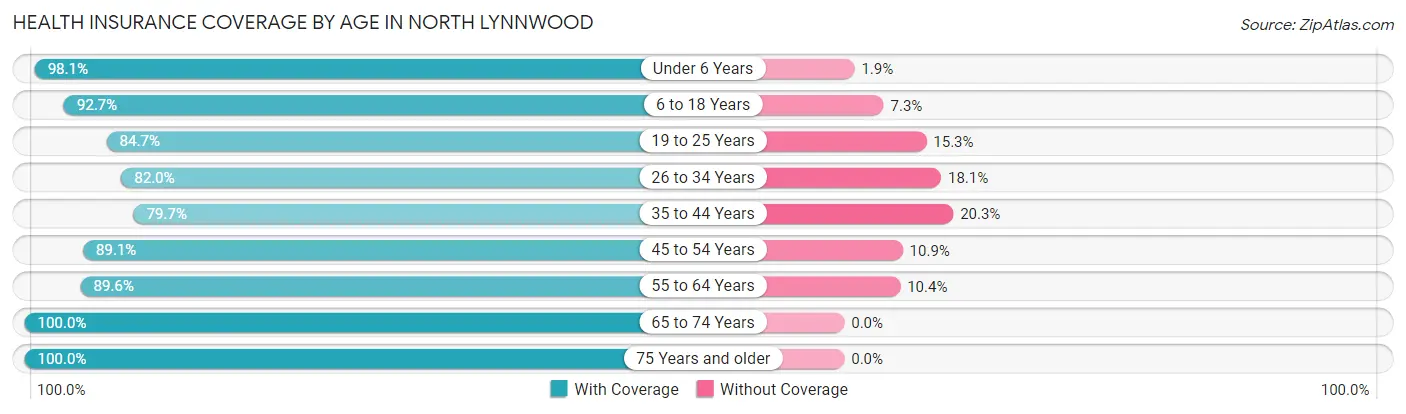
Health Insurance Coverage by Age in North Lynnwood
| Age Bracket | With Coverage | Without Coverage |
| Under 6 Years | 1,551 (98.1%) | 30 (1.9%) |
| 6 to 18 Years | 3,517 (92.7%) | 278 (7.3%) |
| 19 to 25 Years | 2,601 (84.7%) | 470 (15.3%) |
| 26 to 34 Years | 4,208 (82.0%) | 927 (18.0%) |
| 35 to 44 Years | 3,077 (79.7%) | 784 (20.3%) |
| 45 to 54 Years | 2,023 (89.1%) | 247 (10.9%) |
| 55 to 64 Years | 2,344 (89.6%) | 273 (10.4%) |
| 65 to 74 Years | 1,357 (100.0%) | 0 (0.0%) |
| 75 Years and older | 517 (100.0%) | 0 (0.0%) |
| Total | 21,195 (87.6%) | 3,009 (12.4%) |
Health Insurance Coverage by Citizenship Status in North Lynnwood
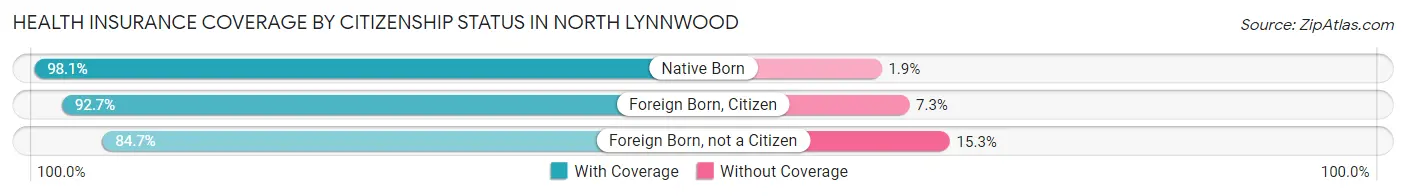
| Citizenship Status | With Coverage | Without Coverage |
| Native Born | 1,551 (98.1%) | 30 (1.9%) |
| Foreign Born, Citizen | 3,517 (92.7%) | 278 (7.3%) |
| Foreign Born, not a Citizen | 2,601 (84.7%) | 470 (15.3%) |
Health Insurance Coverage by Household Income in North Lynnwood
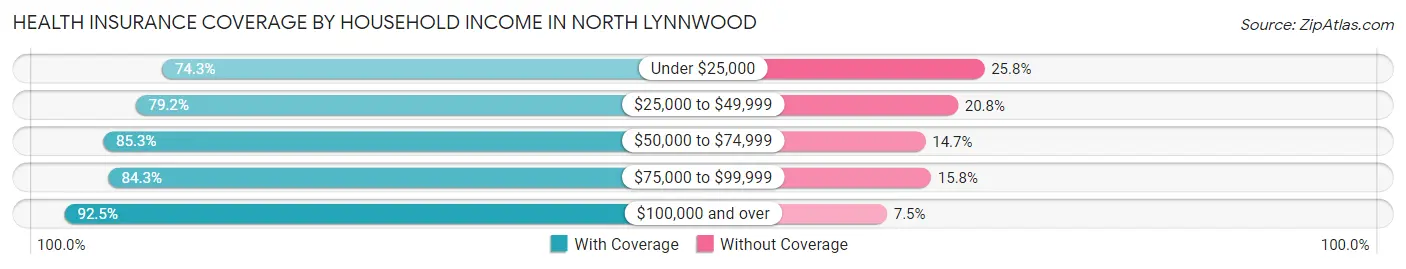
| Household Income | With Coverage | Without Coverage |
| Under $25,000 | 1,156 (74.3%) | 401 (25.8%) |
| $25,000 to $49,999 | 2,324 (79.2%) | 610 (20.8%) |
| $50,000 to $74,999 | 3,058 (85.3%) | 527 (14.7%) |
| $75,000 to $99,999 | 2,712 (84.3%) | 507 (15.8%) |
| $100,000 and over | 11,900 (92.5%) | 964 (7.5%) |
Public vs Private Health Insurance Coverage by Age in North Lynnwood
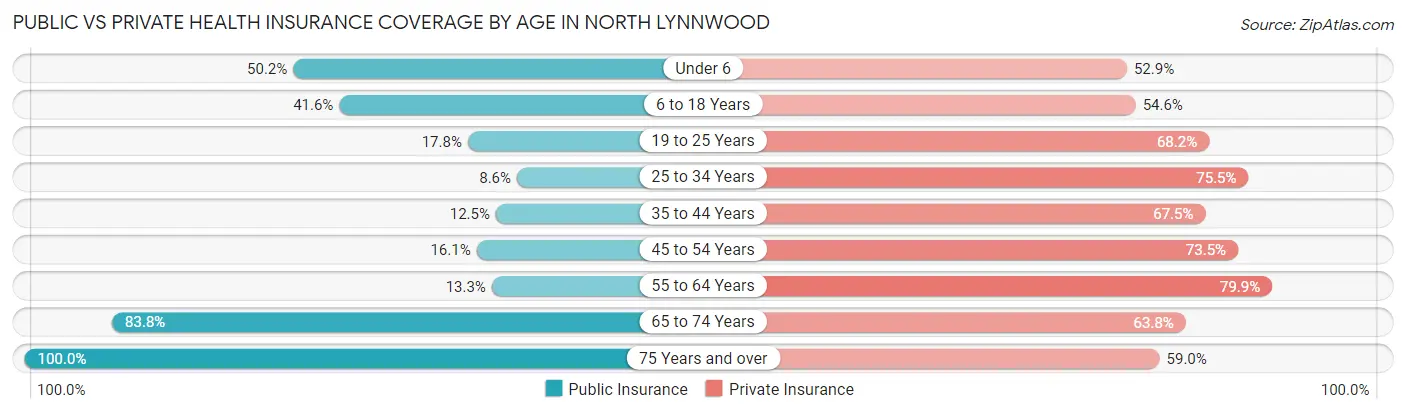
| Age Bracket | Public Insurance | Private Insurance |
| Under 6 | 793 (50.2%) | 837 (52.9%) |
| 6 to 18 Years | 1,579 (41.6%) | 2,070 (54.5%) |
| 19 to 25 Years | 545 (17.7%) | 2,093 (68.1%) |
| 25 to 34 Years | 443 (8.6%) | 3,875 (75.5%) |
| 35 to 44 Years | 484 (12.5%) | 2,605 (67.5%) |
| 45 to 54 Years | 366 (16.1%) | 1,669 (73.5%) |
| 55 to 64 Years | 348 (13.3%) | 2,090 (79.9%) |
| 65 to 74 Years | 1,137 (83.8%) | 866 (63.8%) |
| 75 Years and over | 517 (100.0%) | 305 (59.0%) |
| Total | 6,212 (25.7%) | 16,410 (67.8%) |
Disability Status by Sex by Age in North Lynnwood
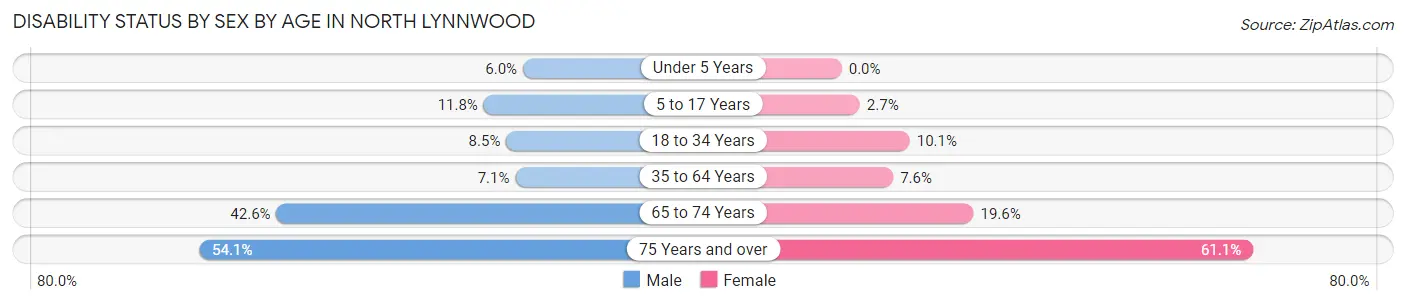
| Age Bracket | Male | Female |
| Under 5 Years | 45 (6.0%) | 0 (0.0%) |
| 5 to 17 Years | 253 (11.8%) | 41 (2.7%) |
| 18 to 34 Years | 339 (8.5%) | 453 (10.1%) |
| 35 to 64 Years | 306 (7.1%) | 341 (7.6%) |
| 65 to 74 Years | 271 (42.6%) | 141 (19.6%) |
| 75 Years and over | 106 (54.1%) | 196 (61.1%) |
Disability Class by Sex by Age in North Lynnwood
Disability Class: Hearing Difficulty
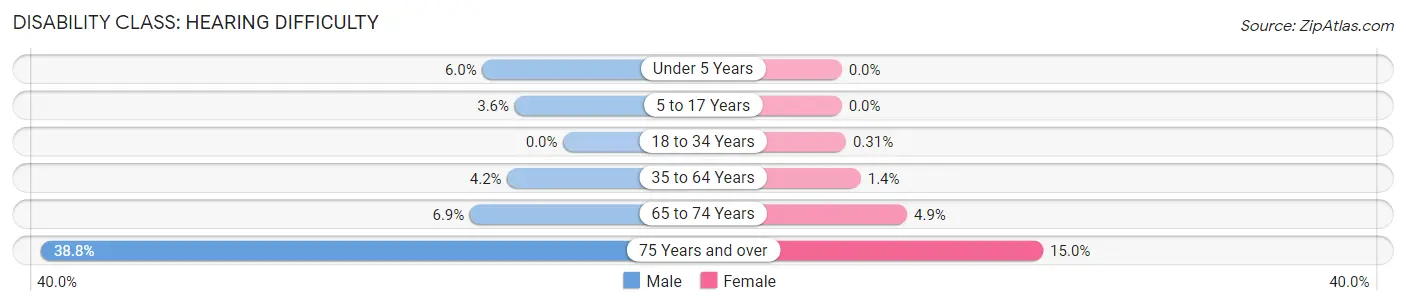
| Age Bracket | Male | Female |
| Under 5 Years | 45 (6.0%) | 0 (0.0%) |
| 5 to 17 Years | 77 (3.6%) | 0 (0.0%) |
| 18 to 34 Years | 0 (0.0%) | 14 (0.3%) |
| 35 to 64 Years | 178 (4.2%) | 63 (1.4%) |
| 65 to 74 Years | 44 (6.9%) | 35 (4.9%) |
| 75 Years and over | 76 (38.8%) | 48 (14.9%) |
Disability Class: Vision Difficulty
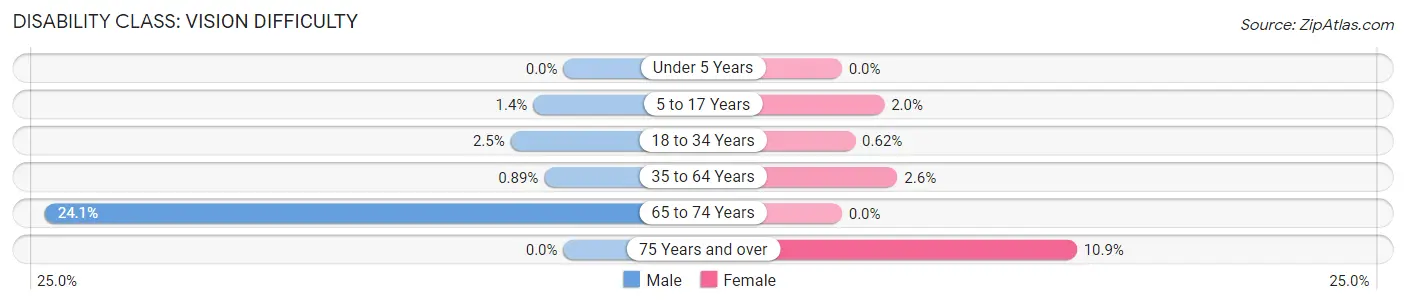
| Age Bracket | Male | Female |
| Under 5 Years | 0 (0.0%) | 0 (0.0%) |
| 5 to 17 Years | 30 (1.4%) | 30 (2.0%) |
| 18 to 34 Years | 98 (2.5%) | 28 (0.6%) |
| 35 to 64 Years | 38 (0.9%) | 115 (2.6%) |
| 65 to 74 Years | 153 (24.1%) | 0 (0.0%) |
| 75 Years and over | 0 (0.0%) | 35 (10.9%) |
Disability Class: Cognitive Difficulty
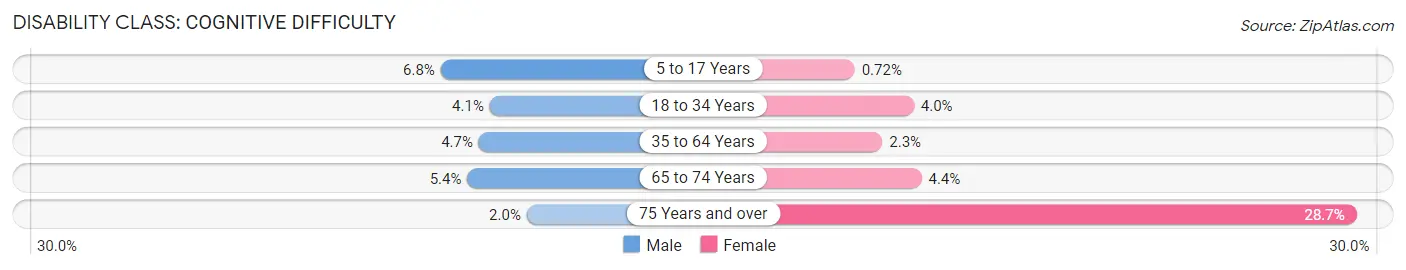
| Age Bracket | Male | Female |
| 5 to 17 Years | 146 (6.8%) | 11 (0.7%) |
| 18 to 34 Years | 164 (4.1%) | 180 (4.0%) |
| 35 to 64 Years | 202 (4.7%) | 101 (2.3%) |
| 65 to 74 Years | 34 (5.3%) | 32 (4.4%) |
| 75 Years and over | 4 (2.0%) | 92 (28.7%) |
Disability Class: Ambulatory Difficulty
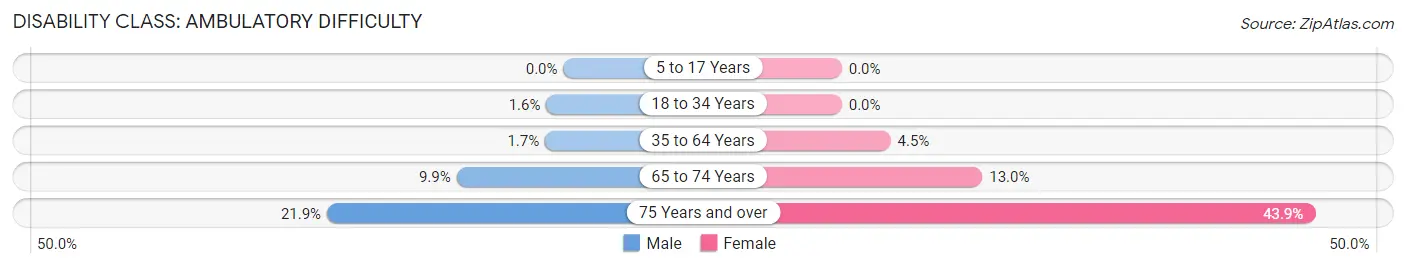
| Age Bracket | Male | Female |
| 5 to 17 Years | 0 (0.0%) | 0 (0.0%) |
| 18 to 34 Years | 63 (1.6%) | 0 (0.0%) |
| 35 to 64 Years | 73 (1.7%) | 202 (4.5%) |
| 65 to 74 Years | 63 (9.9%) | 94 (13.0%) |
| 75 Years and over | 43 (21.9%) | 141 (43.9%) |
Disability Class: Self-Care Difficulty
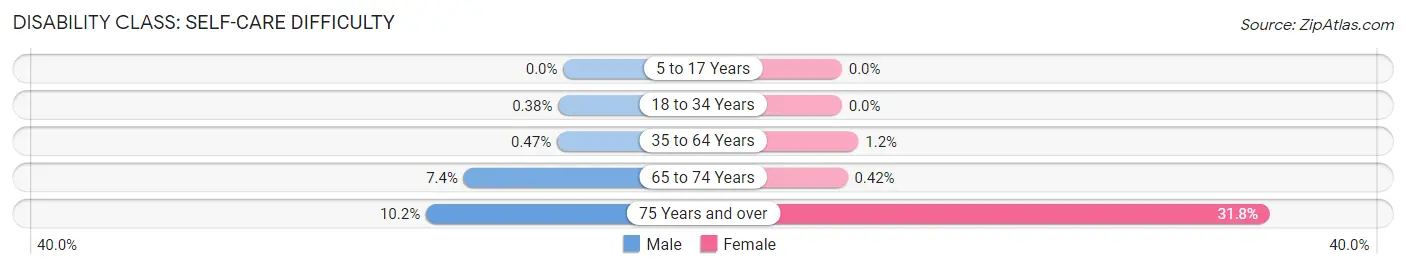
| Age Bracket | Male | Female |
| 5 to 17 Years | 0 (0.0%) | 0 (0.0%) |
| 18 to 34 Years | 15 (0.4%) | 0 (0.0%) |
| 35 to 64 Years | 20 (0.5%) | 55 (1.2%) |
| 65 to 74 Years | 47 (7.4%) | 3 (0.4%) |
| 75 Years and over | 20 (10.2%) | 102 (31.8%) |
Technology Access in North Lynnwood
Computing Device Access in North Lynnwood
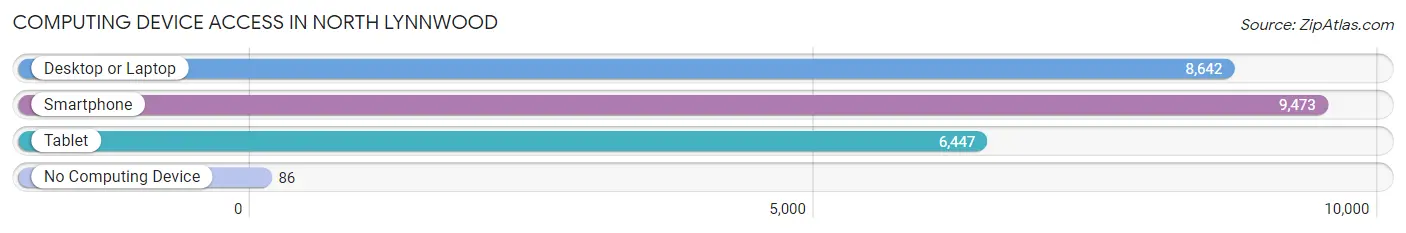
| Device Type | # Households | % Households |
| Desktop or Laptop | 8,642 | 88.5% |
| Smartphone | 9,473 | 97.0% |
| Tablet | 6,447 | 66.0% |
| No Computing Device | 86 | 0.9% |
| Total | 9,765 | 100.0% |
Internet Access in North Lynnwood
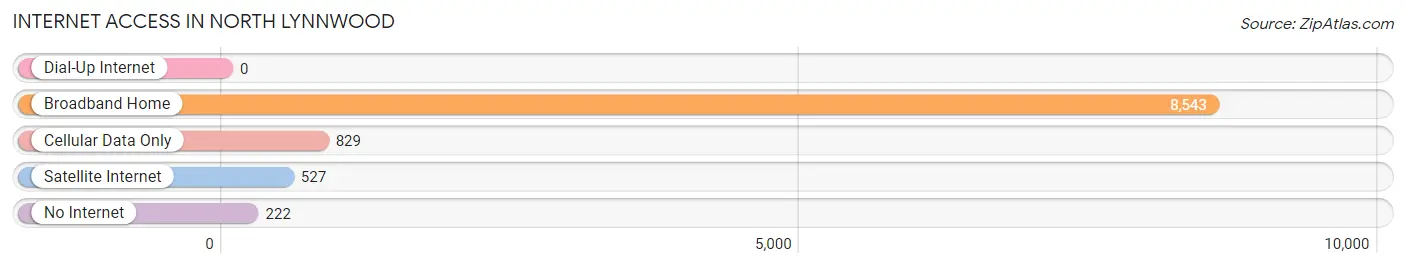
| Internet Type | # Households | % Households |
| Dial-Up Internet | 0 | 0.0% |
| Broadband Home | 8,543 | 87.5% |
| Cellular Data Only | 829 | 8.5% |
| Satellite Internet | 527 | 5.4% |
| No Internet | 222 | 2.3% |
| Total | 9,765 | 100.0% |
North Lynnwood Summary
Lynnwood, Washington is a city located in Snohomish County, Washington, United States. It is part of the Seattle metropolitan area and is located about 20 miles north of Seattle. The city is bordered by the cities of Edmonds to the west, Mountlake Terrace to the south, Brier to the east, and unincorporated areas of Snohomish County to the north. The population of Lynnwood was 36,485 at the 2010 census, making it the fourth largest city in Snohomish County.
History
The area that is now Lynnwood was originally inhabited by the Snohomish people, who were part of the Coast Salish culture. The first European settlers arrived in the area in the late 19th century, and the area was officially incorporated as the city of Lynnwood in 1959.
The city was named after the wife of the first postmaster, Charles Lynn. The city was originally a small farming community, but it began to grow rapidly in the 1950s and 1960s as the Seattle metropolitan area expanded.
Geography
Lynnwood is located at 47°48'N 122°17'W (47.8, -122.3). According to the United States Census Bureau, the city has a total area of 10.3 square miles, of which 10.2 square miles is land and 0.1 square miles is water.
The city is located in the Puget Sound region of Washington, and is bordered by the cities of Edmonds to the west, Mountlake Terrace to the south, Brier to the east, and unincorporated areas of Snohomish County to the north.
Economy
The economy of Lynnwood is largely based on retail and services. The city is home to several large shopping centers, including Alderwood Mall, which is the largest mall in Snohomish County. The city is also home to several large employers, including Boeing, Microsoft, and Amazon.
Demographics
As of the 2010 census, there were 36,485 people, 14,945 households, and 9,845 families residing in the city. The population density was 3,567.2 people per square mile. The racial makeup of the city was 68.2% White, 8.3% African American, 0.7% Native American, 13.2% Asian, 0.3% Pacific Islander, 4.7% from other races, and 4.2% from two or more races. Hispanic or Latino of any race were 11.2% of the population.
The median income for a household in the city was $60,945, and the median income for a family was $71,845. The per capita income for the city was $27,945. About 6.2% of families and 8.7% of the population were below the poverty line, including 11.2% of those under age 18 and 6.2% of those age 65 or over.
Common Questions
What is the Total Population of North Lynnwood?
Total Population of North Lynnwood is 24,235.
What is the Total Male Population of North Lynnwood?
Total Male Population of North Lynnwood is 12,037.
What is the Total Female Population of North Lynnwood?
Total Female Population of North Lynnwood is 12,198.
What is the Ratio of Males per 100 Females in North Lynnwood?
There are 98.68 Males per 100 Females in North Lynnwood.
What is the Ratio of Females per 100 Males in North Lynnwood?
There are 101.34 Females per 100 Males in North Lynnwood.
What is the Median Population Age in North Lynnwood?
Median Population Age in North Lynnwood is 32.5 Years.
What is the Average Family Size in North Lynnwood
Average Family Size in North Lynnwood is 3.1 People.
What is the Average Household Size in North Lynnwood
Average Household Size in North Lynnwood is 2.5 People.
What is Per Capita Income in North Lynnwood?
Per Capita income in North Lynnwood is $42,480.
What is the Median Family Income in North Lynnwood?
Median Family Income in North Lynnwood is $102,843.
What is the Median Household income in North Lynnwood?
Median Household Income in North Lynnwood is $89,944.
What is Income or Wage Gap in North Lynnwood?
Income or Wage Gap in North Lynnwood is 21.0%.
Women in North Lynnwood earn 79.0 cents for every dollar earned by a man.
What is Family Income Deficit in North Lynnwood?
Family Income Deficit in North Lynnwood is $15,457.
Families that are below poverty line in North Lynnwood earn $15,457 less on average than the poverty threshold level.
What is Inequality or Gini Index in North Lynnwood?
Inequality or Gini Index in North Lynnwood is 0.37.
How Large is the Labor Force in North Lynnwood?
There are 14,992 People in the Labor Forcein in North Lynnwood.
What is the Percentage of People in the Labor Force in North Lynnwood?
76.1% of People are in the Labor Force in North Lynnwood.
What is the Unemployment Rate in North Lynnwood?
Unemployment Rate in North Lynnwood is 3.6%.