Cities with the Highest Percentage of Danish Population in Washington
RELATED REPORTS & OPTIONS
Danish
Washington
Compare Cities
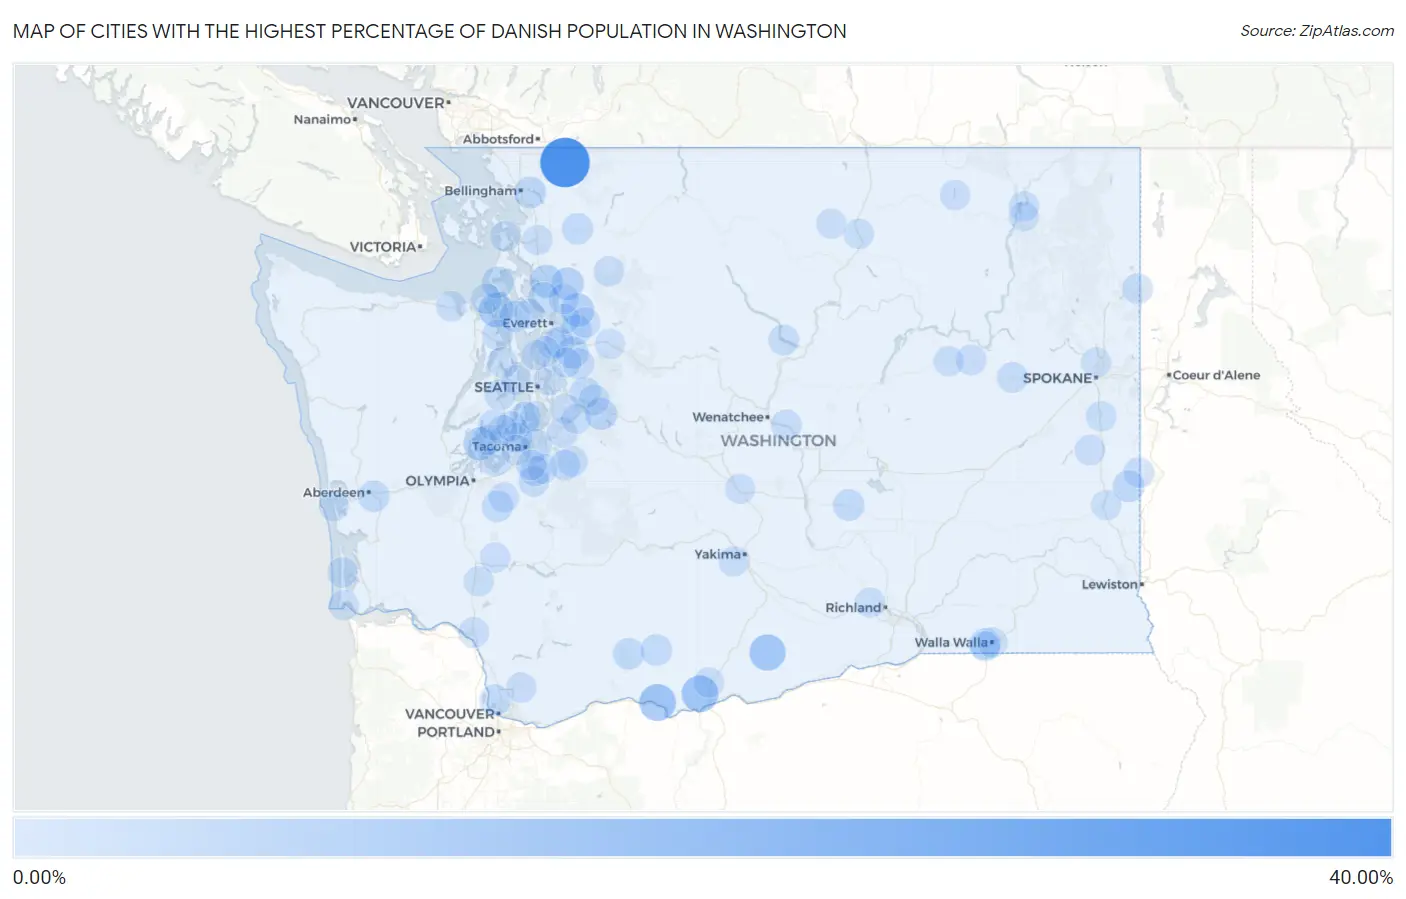
Map of Cities with the Highest Percentage of Danish Population in Washington
0.00%
40.00%
Cities with the Highest Percentage of Danish Population in Washington
| City | Danish | vs State | vs National | |
| 1. | Maple Falls | 35.50% | 0.80%(+34.7)#1 | 0.36%(+35.1)#20 |
| 2. | Lyle | 12.60% | 0.80%(+11.8)#2 | 0.36%(+12.2)#141 |
| 3. | Centerville | 12.39% | 0.80%(+11.6)#3 | 0.36%(+12.0)#147 |
| 4. | Bickleton | 11.54% | 0.80%(+10.7)#4 | 0.36%(+11.2)#168 |
| 5. | Sunland Estates | 10.00% | 0.80%(+9.20)#5 | 0.36%(+9.64)#200 |
| 6. | Marrowstone | 9.30% | 0.80%(+8.50)#6 | 0.36%(+8.94)#218 |
| 7. | Herron Island | 6.56% | 0.80%(+5.76)#7 | 0.36%(+6.20)#385 |
| 8. | Lake Bosworth | 6.52% | 0.80%(+5.72)#8 | 0.36%(+6.16)#388 |
| 9. | Sunday Lake | 6.26% | 0.80%(+5.46)#9 | 0.36%(+5.90)#408 |
| 10. | Arlington Heights | 5.70% | 0.80%(+4.90)#10 | 0.36%(+5.34)#471 |
| 11. | Wilderness Rim | 4.65% | 0.80%(+3.85)#11 | 0.36%(+4.29)#629 |
| 12. | Coupeville | 4.36% | 0.80%(+3.56)#12 | 0.36%(+4.01)#676 |
| 13. | Geneva | 4.15% | 0.80%(+3.35)#13 | 0.36%(+3.79)#741 |
| 14. | High Bridge | 4.14% | 0.80%(+3.35)#14 | 0.36%(+3.79)#742 |
| 15. | Garfield | 3.92% | 0.80%(+3.13)#15 | 0.36%(+3.57)#798 |
| 16. | Fife Heights | 3.69% | 0.80%(+2.89)#16 | 0.36%(+3.33)#877 |
| 17. | Royal City | 3.64% | 0.80%(+2.84)#17 | 0.36%(+3.28)#893 |
| 18. | Glenwood | 3.64% | 0.80%(+2.84)#18 | 0.36%(+3.28)#894 |
| 19. | Cosmopolis | 3.55% | 0.80%(+2.75)#19 | 0.36%(+3.19)#923 |
| 20. | Trout Lake | 3.53% | 0.80%(+2.73)#20 | 0.36%(+3.17)#931 |
| 21. | Garrett | 3.52% | 0.80%(+2.72)#21 | 0.36%(+3.17)#933 |
| 22. | Vashon | 3.44% | 0.80%(+2.64)#22 | 0.36%(+3.08)#958 |
| 23. | Felida | 3.28% | 0.80%(+2.48)#23 | 0.36%(+2.92)#1,003 |
| 24. | Rainier | 3.25% | 0.80%(+2.45)#24 | 0.36%(+2.89)#1,018 |
| 25. | Freeland | 3.22% | 0.80%(+2.42)#25 | 0.36%(+2.86)#1,039 |
| 26. | Hamilton | 3.19% | 0.80%(+2.39)#26 | 0.36%(+2.83)#1,048 |
| 27. | Fall City | 3.07% | 0.80%(+2.27)#27 | 0.36%(+2.72)#1,097 |
| 28. | Lake Goodwin | 2.81% | 0.80%(+2.01)#28 | 0.36%(+2.46)#1,209 |
| 29. | Snoqualmie | 2.69% | 0.80%(+1.89)#29 | 0.36%(+2.33)#1,271 |
| 30. | Duvall | 2.68% | 0.80%(+1.88)#30 | 0.36%(+2.32)#1,276 |
| 31. | Stansberry Lake | 2.60% | 0.80%(+1.80)#31 | 0.36%(+2.24)#1,330 |
| 32. | Navy Yard City | 2.53% | 0.80%(+1.74)#32 | 0.36%(+2.18)#1,362 |
| 33. | Davenport | 2.43% | 0.80%(+1.63)#33 | 0.36%(+2.08)#1,426 |
| 34. | Three Lakes | 2.41% | 0.80%(+1.61)#34 | 0.36%(+2.05)#1,447 |
| 35. | Port Ludlow | 2.39% | 0.80%(+1.59)#35 | 0.36%(+2.03)#1,460 |
| 36. | Elk Plain | 2.31% | 0.80%(+1.51)#36 | 0.36%(+1.96)#1,522 |
| 37. | Rock Island | 2.30% | 0.80%(+1.50)#37 | 0.36%(+1.95)#1,526 |
| 38. | Buckley | 2.29% | 0.80%(+1.49)#38 | 0.36%(+1.94)#1,532 |
| 39. | South Prairie | 2.27% | 0.80%(+1.47)#39 | 0.36%(+1.91)#1,549 |
| 40. | Manson | 2.24% | 0.80%(+1.44)#40 | 0.36%(+1.88)#1,566 |
| 41. | Newport | 2.20% | 0.80%(+1.40)#41 | 0.36%(+1.84)#1,593 |
| 42. | Hunts Point | 2.17% | 0.80%(+1.37)#42 | 0.36%(+1.81)#1,616 |
| 43. | Kelso | 2.16% | 0.80%(+1.36)#43 | 0.36%(+1.81)#1,620 |
| 44. | Poulsbo | 2.15% | 0.80%(+1.35)#44 | 0.36%(+1.79)#1,630 |
| 45. | Farmington | 2.08% | 0.80%(+1.28)#45 | 0.36%(+1.73)#1,686 |
| 46. | Malden | 2.06% | 0.80%(+1.26)#46 | 0.36%(+1.70)#1,710 |
| 47. | Mill Creek | 2.00% | 0.80%(+1.20)#47 | 0.36%(+1.64)#1,777 |
| 48. | Ocean Park | 1.99% | 0.80%(+1.19)#48 | 0.36%(+1.64)#1,779 |
| 49. | Sisco Heights | 1.95% | 0.80%(+1.15)#49 | 0.36%(+1.59)#1,814 |
| 50. | Silver Firs | 1.95% | 0.80%(+1.15)#50 | 0.36%(+1.59)#1,817 |
| 51. | Curlew Lake | 1.88% | 0.80%(+1.08)#51 | 0.36%(+1.52)#1,878 |
| 52. | Creston | 1.88% | 0.80%(+1.08)#52 | 0.36%(+1.52)#1,880 |
| 53. | Swede Heaven | 1.83% | 0.80%(+1.03)#53 | 0.36%(+1.47)#1,938 |
| 54. | Goldendale | 1.83% | 0.80%(+1.03)#54 | 0.36%(+1.47)#1,942 |
| 55. | Frederickson | 1.82% | 0.80%(+1.02)#55 | 0.36%(+1.46)#1,955 |
| 56. | Burlington | 1.76% | 0.80%(+0.963)#56 | 0.36%(+1.41)#2,013 |
| 57. | Spangle | 1.76% | 0.80%(+0.961)#57 | 0.36%(+1.40)#2,016 |
| 58. | Wilbur | 1.75% | 0.80%(+0.946)#58 | 0.36%(+1.39)#2,032 |
| 59. | Yelm | 1.74% | 0.80%(+0.944)#59 | 0.36%(+1.39)#2,035 |
| 60. | Venersborg | 1.73% | 0.80%(+0.933)#60 | 0.36%(+1.38)#2,046 |
| 61. | Ahtanum | 1.73% | 0.80%(+0.930)#61 | 0.36%(+1.37)#2,052 |
| 62. | Toledo | 1.72% | 0.80%(+0.921)#62 | 0.36%(+1.36)#2,064 |
| 63. | Lake Roesiger | 1.71% | 0.80%(+0.913)#63 | 0.36%(+1.36)#2,070 |
| 64. | Port Townsend | 1.69% | 0.80%(+0.893)#64 | 0.36%(+1.34)#2,099 |
| 65. | Fairwood Cdp King County | 1.67% | 0.80%(+0.871)#65 | 0.36%(+1.31)#2,117 |
| 66. | Onalaska | 1.67% | 0.80%(+0.870)#66 | 0.36%(+1.31)#2,122 |
| 67. | Lake Morton Berrydale | 1.66% | 0.80%(+0.864)#67 | 0.36%(+1.31)#2,128 |
| 68. | Sequim | 1.66% | 0.80%(+0.860)#68 | 0.36%(+1.30)#2,133 |
| 69. | Home | 1.65% | 0.80%(+0.855)#69 | 0.36%(+1.30)#2,142 |
| 70. | Ruston | 1.65% | 0.80%(+0.854)#70 | 0.36%(+1.30)#2,146 |
| 71. | Riverside | 1.65% | 0.80%(+0.851)#71 | 0.36%(+1.29)#2,151 |
| 72. | Marcus | 1.65% | 0.80%(+0.848)#72 | 0.36%(+1.29)#2,158 |
| 73. | Maplewood | 1.61% | 0.80%(+0.813)#73 | 0.36%(+1.26)#2,195 |
| 74. | Ilwaco | 1.61% | 0.80%(+0.805)#74 | 0.36%(+1.25)#2,209 |
| 75. | Anacortes | 1.60% | 0.80%(+0.802)#75 | 0.36%(+1.24)#2,212 |
| 76. | Alderwood Manor | 1.60% | 0.80%(+0.796)#76 | 0.36%(+1.24)#2,223 |
| 77. | Cottage Lake | 1.58% | 0.80%(+0.775)#77 | 0.36%(+1.22)#2,250 |
| 78. | Normandy Park | 1.55% | 0.80%(+0.753)#78 | 0.36%(+1.20)#2,290 |
| 79. | Anderson Island | 1.54% | 0.80%(+0.742)#79 | 0.36%(+1.18)#2,310 |
| 80. | Country Homes | 1.54% | 0.80%(+0.737)#80 | 0.36%(+1.18)#2,319 |
| 81. | Fircrest | 1.54% | 0.80%(+0.736)#81 | 0.36%(+1.18)#2,321 |
| 82. | Walla Walla | 1.52% | 0.80%(+0.725)#82 | 0.36%(+1.17)#2,339 |
| 83. | South Hill | 1.51% | 0.80%(+0.714)#83 | 0.36%(+1.16)#2,357 |
| 84. | Clover Creek | 1.51% | 0.80%(+0.710)#84 | 0.36%(+1.15)#2,364 |
| 85. | Conconully | 1.51% | 0.80%(+0.708)#85 | 0.36%(+1.15)#2,368 |
| 86. | Langley | 1.49% | 0.80%(+0.687)#86 | 0.36%(+1.13)#2,405 |
| 87. | College Place | 1.47% | 0.80%(+0.670)#87 | 0.36%(+1.11)#2,446 |
| 88. | Gold Bar | 1.45% | 0.80%(+0.654)#88 | 0.36%(+1.10)#2,468 |
| 89. | East Renton Highlands | 1.45% | 0.80%(+0.649)#89 | 0.36%(+1.09)#2,475 |
| 90. | West Richland | 1.44% | 0.80%(+0.645)#90 | 0.36%(+1.09)#2,480 |
| 91. | Rosedale | 1.43% | 0.80%(+0.628)#91 | 0.36%(+1.07)#2,503 |
| 92. | Westport | 1.40% | 0.80%(+0.601)#92 | 0.36%(+1.04)#2,550 |
| 93. | Bainbridge Island | 1.40% | 0.80%(+0.598)#93 | 0.36%(+1.04)#2,557 |
| 94. | Hobart | 1.38% | 0.80%(+0.584)#94 | 0.36%(+1.03)#2,590 |
| 95. | Esperance | 1.38% | 0.80%(+0.583)#95 | 0.36%(+1.03)#2,593 |
| 96. | Kettle Falls | 1.38% | 0.80%(+0.577)#96 | 0.36%(+1.02)#2,602 |
| 97. | Erlands Point | 1.37% | 0.80%(+0.570)#97 | 0.36%(+1.01)#2,610 |
| 98. | Ellensburg | 1.37% | 0.80%(+0.568)#98 | 0.36%(+1.01)#2,616 |
| 99. | Colfax | 1.32% | 0.80%(+0.522)#99 | 0.36%(+0.965)#2,727 |
| 100. | Lake Stevens | 1.32% | 0.80%(+0.522)#100 | 0.36%(+0.964)#2,728 |
Common Questions
What are the Top 10 Cities with the Highest Percentage of Danish Population in Washington?
Top 10 Cities with the Highest Percentage of Danish Population in Washington are:
#1
35.50%
#2
12.60%
#3
12.39%
#4
11.54%
#5
9.30%
#6
6.56%
#7
6.52%
#8
6.26%
#9
5.70%
#10
4.65%
What city has the Highest Percentage of Danish Population in Washington?
Maple Falls has the Highest Percentage of Danish Population in Washington with 35.50%.
What is the Percentage of Danish Population in the State of Washington?
Percentage of Danish Population in Washington is 0.80%.
What is the Percentage of Danish Population in the United States?
Percentage of Danish Population in the United States is 0.36%.