Cities with the Highest Percentage of Greek Population in Washington
RELATED REPORTS & OPTIONS
Greek
Washington
Compare Cities
Map of Cities with the Highest Percentage of Greek Population in Washington
0.00%
8.00%
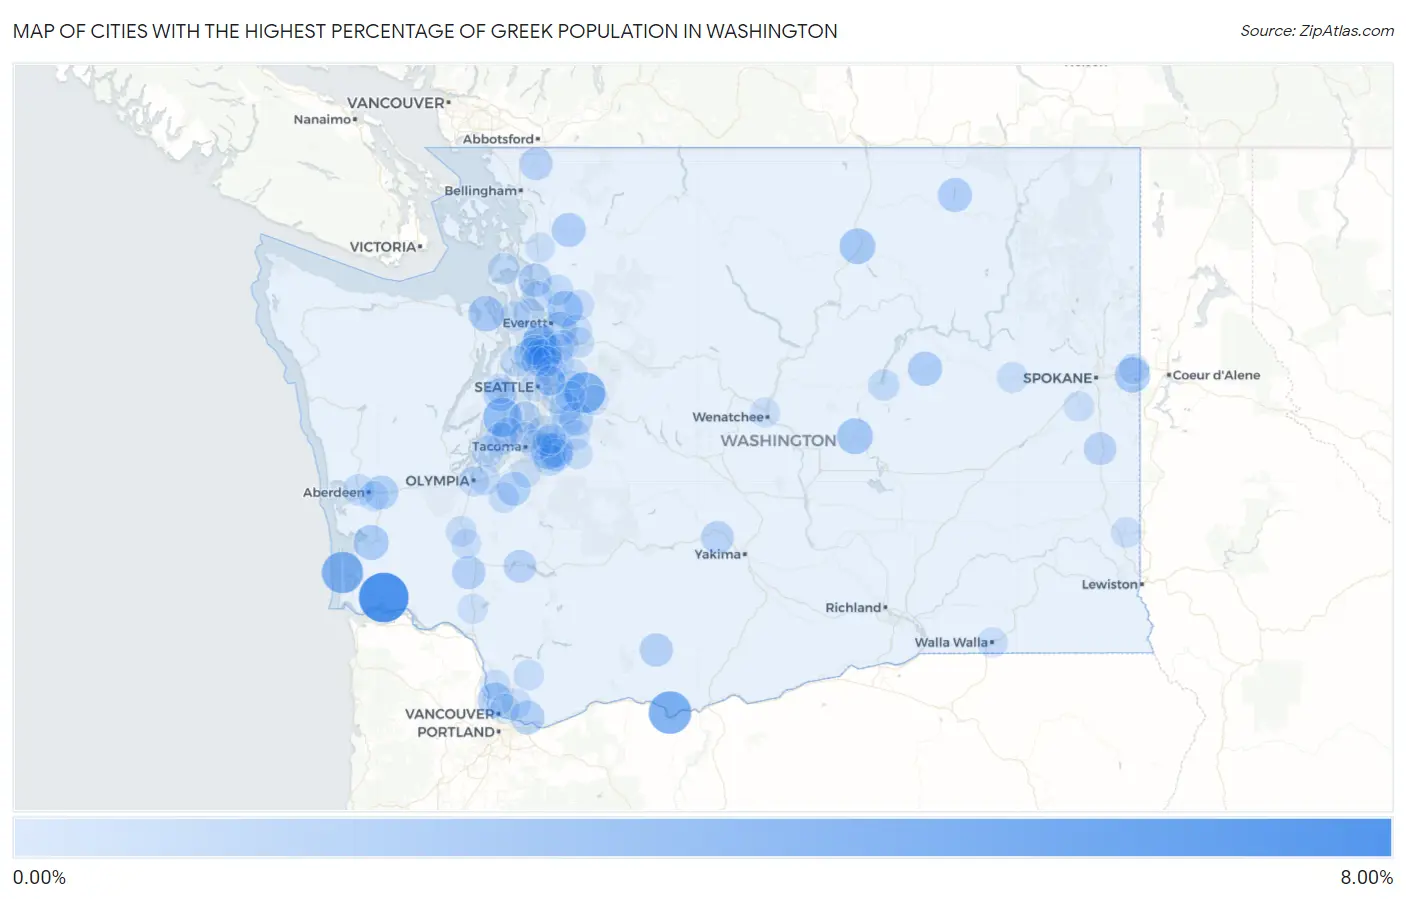
Cities with the Highest Percentage of Greek Population in Washington
| City | Greek | vs State | vs National | |
| 1. | Deep River | 6.29% | 0.32%(+5.96)#1 | 0.37%(+5.92)#103 |
| 2. | Dallesport | 4.14% | 0.32%(+3.81)#2 | 0.37%(+3.77)#255 |
| 3. | Ocean Park | 3.78% | 0.32%(+3.45)#3 | 0.37%(+3.41)#300 |
| 4. | Fall City | 3.52% | 0.32%(+3.19)#4 | 0.37%(+3.15)#339 |
| 5. | Burley | 2.92% | 0.32%(+2.60)#5 | 0.37%(+2.55)#464 |
| 6. | Clear Lake Cdp Skagit County | 2.14% | 0.32%(+1.82)#6 | 0.37%(+1.77)#770 |
| 7. | Sumner | 2.12% | 0.32%(+1.79)#7 | 0.37%(+1.74)#786 |
| 8. | Ephrata | 2.07% | 0.32%(+1.74)#8 | 0.37%(+1.70)#817 |
| 9. | Omak | 2.03% | 0.32%(+1.71)#9 | 0.37%(+1.66)#846 |
| 10. | Lake Cassidy | 2.01% | 0.32%(+1.69)#10 | 0.37%(+1.64)#859 |
| 11. | Port Hadlock Irondale | 1.98% | 0.32%(+1.66)#11 | 0.37%(+1.61)#881 |
| 12. | Liberty Lake | 1.92% | 0.32%(+1.60)#12 | 0.37%(+1.55)#921 |
| 13. | South Bend | 1.83% | 0.32%(+1.50)#13 | 0.37%(+1.46)#994 |
| 14. | Meadowdale | 1.80% | 0.32%(+1.48)#14 | 0.37%(+1.43)#1,019 |
| 15. | Felida | 1.80% | 0.32%(+1.47)#15 | 0.37%(+1.42)#1,026 |
| 16. | Almira | 1.65% | 0.32%(+1.33)#16 | 0.37%(+1.28)#1,148 |
| 17. | Alderwood Manor | 1.62% | 0.32%(+1.30)#17 | 0.37%(+1.25)#1,173 |
| 18. | Woodway | 1.61% | 0.32%(+1.29)#18 | 0.37%(+1.24)#1,186 |
| 19. | Lake Tapps | 1.60% | 0.32%(+1.27)#19 | 0.37%(+1.23)#1,198 |
| 20. | Lyman | 1.55% | 0.32%(+1.23)#20 | 0.37%(+1.18)#1,242 |
| 21. | Curlew Lake | 1.54% | 0.32%(+1.21)#21 | 0.37%(+1.17)#1,264 |
| 22. | Camas | 1.53% | 0.32%(+1.20)#22 | 0.37%(+1.16)#1,275 |
| 23. | Central Park | 1.52% | 0.32%(+1.20)#23 | 0.37%(+1.15)#1,282 |
| 24. | Fobes Hill | 1.52% | 0.32%(+1.20)#24 | 0.37%(+1.15)#1,283 |
| 25. | Roy | 1.52% | 0.32%(+1.20)#25 | 0.37%(+1.15)#1,284 |
| 26. | Winlock | 1.38% | 0.32%(+1.05)#26 | 0.37%(+1.01)#1,467 |
| 27. | Glenwood | 1.36% | 0.32%(+1.04)#27 | 0.37%(+0.992)#1,488 |
| 28. | Stanwood | 1.34% | 0.32%(+1.02)#28 | 0.37%(+0.970)#1,517 |
| 29. | Hobart | 1.33% | 0.32%(+1.00)#29 | 0.37%(+0.956)#1,537 |
| 30. | Picnic Point | 1.32% | 0.32%(+0.992)#30 | 0.37%(+0.945)#1,553 |
| 31. | Navy Yard City | 1.25% | 0.32%(+0.924)#31 | 0.37%(+0.877)#1,666 |
| 32. | Tieton | 1.23% | 0.32%(+0.904)#32 | 0.37%(+0.857)#1,697 |
| 33. | Everson | 1.22% | 0.32%(+0.891)#33 | 0.37%(+0.845)#1,717 |
| 34. | Mossyrock | 1.21% | 0.32%(+0.883)#34 | 0.37%(+0.836)#1,729 |
| 35. | Artondale | 1.19% | 0.32%(+0.865)#35 | 0.37%(+0.819)#1,752 |
| 36. | Rosalia | 1.17% | 0.32%(+0.844)#36 | 0.37%(+0.797)#1,791 |
| 37. | Bonney Lake | 1.13% | 0.32%(+0.808)#37 | 0.37%(+0.762)#1,853 |
| 38. | Brier | 1.12% | 0.32%(+0.792)#38 | 0.37%(+0.745)#1,887 |
| 39. | Lake Forest Park | 1.07% | 0.32%(+0.745)#39 | 0.37%(+0.698)#1,979 |
| 40. | Vashon | 0.93% | 0.32%(+0.608)#40 | 0.37%(+0.561)#2,291 |
| 41. | Kitsap Lake | 0.93% | 0.32%(+0.600)#41 | 0.37%(+0.553)#2,312 |
| 42. | Mountlake Terrace | 0.90% | 0.32%(+0.579)#42 | 0.37%(+0.532)#2,379 |
| 43. | Oak Harbor | 0.89% | 0.32%(+0.562)#43 | 0.37%(+0.516)#2,432 |
| 44. | Alderton | 0.86% | 0.32%(+0.531)#44 | 0.37%(+0.485)#2,513 |
| 45. | Hoquiam | 0.82% | 0.32%(+0.499)#45 | 0.37%(+0.452)#2,620 |
| 46. | Coulee City | 0.80% | 0.32%(+0.470)#46 | 0.37%(+0.424)#2,738 |
| 47. | Lakeland North | 0.77% | 0.32%(+0.444)#47 | 0.37%(+0.397)#2,843 |
| 48. | Longbranch | 0.76% | 0.32%(+0.435)#48 | 0.37%(+0.388)#2,876 |
| 49. | Sammamish | 0.73% | 0.32%(+0.404)#49 | 0.37%(+0.357)#2,978 |
| 50. | Shadow Lake | 0.71% | 0.32%(+0.384)#50 | 0.37%(+0.338)#3,051 |
| 51. | East Renton Highlands | 0.70% | 0.32%(+0.379)#51 | 0.37%(+0.332)#3,066 |
| 52. | Arlington | 0.69% | 0.32%(+0.361)#52 | 0.37%(+0.314)#3,143 |
| 53. | Indianola | 0.68% | 0.32%(+0.351)#53 | 0.37%(+0.304)#3,180 |
| 54. | Langley | 0.65% | 0.32%(+0.326)#54 | 0.37%(+0.279)#3,260 |
| 55. | Davenport | 0.65% | 0.32%(+0.324)#55 | 0.37%(+0.277)#3,272 |
| 56. | Three Lakes | 0.64% | 0.32%(+0.319)#56 | 0.37%(+0.272)#3,285 |
| 57. | Browns Point | 0.64% | 0.32%(+0.313)#57 | 0.37%(+0.267)#3,307 |
| 58. | Fife Heights | 0.64% | 0.32%(+0.311)#58 | 0.37%(+0.264)#3,325 |
| 59. | Seattle | 0.62% | 0.32%(+0.296)#59 | 0.37%(+0.249)#3,392 |
| 60. | Fords Prairie | 0.60% | 0.32%(+0.273)#60 | 0.37%(+0.227)#3,511 |
| 61. | Granite Falls | 0.59% | 0.32%(+0.266)#61 | 0.37%(+0.220)#3,555 |
| 62. | Algona | 0.58% | 0.32%(+0.257)#62 | 0.37%(+0.211)#3,600 |
| 63. | Monroe | 0.58% | 0.32%(+0.256)#63 | 0.37%(+0.209)#3,608 |
| 64. | Yacolt | 0.58% | 0.32%(+0.251)#64 | 0.37%(+0.204)#3,629 |
| 65. | Ridgefield | 0.57% | 0.32%(+0.250)#65 | 0.37%(+0.203)#3,638 |
| 66. | Yelm | 0.57% | 0.32%(+0.240)#66 | 0.37%(+0.194)#3,693 |
| 67. | Olympia | 0.55% | 0.32%(+0.230)#67 | 0.37%(+0.183)#3,755 |
| 68. | Woodinville | 0.54% | 0.32%(+0.216)#68 | 0.37%(+0.170)#3,833 |
| 69. | Pullman | 0.54% | 0.32%(+0.213)#69 | 0.37%(+0.166)#3,850 |
| 70. | Lacey | 0.54% | 0.32%(+0.212)#70 | 0.37%(+0.165)#3,863 |
| 71. | Cosmopolis | 0.53% | 0.32%(+0.207)#71 | 0.37%(+0.161)#3,884 |
| 72. | Otis Orchards East Farms | 0.53% | 0.32%(+0.202)#72 | 0.37%(+0.155)#3,918 |
| 73. | Gig Harbor | 0.52% | 0.32%(+0.195)#73 | 0.37%(+0.149)#3,956 |
| 74. | Rocky Point | 0.52% | 0.32%(+0.193)#74 | 0.37%(+0.146)#3,965 |
| 75. | Walla Walla | 0.51% | 0.32%(+0.189)#75 | 0.37%(+0.143)#3,990 |
| 76. | Kirkland | 0.51% | 0.32%(+0.189)#76 | 0.37%(+0.142)#3,992 |
| 77. | Union Hill Novelty Hill | 0.51% | 0.32%(+0.189)#77 | 0.37%(+0.142)#3,993 |
| 78. | Cheney | 0.50% | 0.32%(+0.173)#78 | 0.37%(+0.127)#4,103 |
| 79. | Black Diamond | 0.49% | 0.32%(+0.164)#79 | 0.37%(+0.118)#4,156 |
| 80. | Newcastle | 0.49% | 0.32%(+0.162)#80 | 0.37%(+0.116)#4,167 |
| 81. | Orchards | 0.49% | 0.32%(+0.161)#81 | 0.37%(+0.114)#4,173 |
| 82. | Kayak Point | 0.48% | 0.32%(+0.157)#82 | 0.37%(+0.110)#4,204 |
| 83. | Freeland | 0.48% | 0.32%(+0.150)#83 | 0.37%(+0.104)#4,253 |
| 84. | Cathcart | 0.48% | 0.32%(+0.150)#84 | 0.37%(+0.103)#4,254 |
| 85. | Yarrow Point | 0.47% | 0.32%(+0.144)#85 | 0.37%(+0.097)#4,297 |
| 86. | Enumclaw | 0.47% | 0.32%(+0.142)#86 | 0.37%(+0.096)#4,304 |
| 87. | Auburn | 0.47% | 0.32%(+0.141)#87 | 0.37%(+0.094)#4,313 |
| 88. | Castle Rock | 0.46% | 0.32%(+0.132)#88 | 0.37%(+0.086)#4,366 |
| 89. | Edmonds | 0.45% | 0.32%(+0.129)#89 | 0.37%(+0.083)#4,399 |
| 90. | Mount Vernon | 0.44% | 0.32%(+0.114)#90 | 0.37%(+0.067)#4,527 |
| 91. | Wenatchee | 0.43% | 0.32%(+0.108)#91 | 0.37%(+0.061)#4,564 |
| 92. | Spanaway | 0.43% | 0.32%(+0.107)#92 | 0.37%(+0.061)#4,570 |
| 93. | Snoqualmie | 0.43% | 0.32%(+0.104)#93 | 0.37%(+0.057)#4,603 |
| 94. | Issaquah | 0.43% | 0.32%(+0.102)#94 | 0.37%(+0.055)#4,622 |
| 95. | Clearview | 0.43% | 0.32%(+0.100)#95 | 0.37%(+0.054)#4,635 |
| 96. | Kenmore | 0.42% | 0.32%(+0.099)#96 | 0.37%(+0.052)#4,641 |
| 97. | Clyde Hill | 0.42% | 0.32%(+0.093)#97 | 0.37%(+0.047)#4,691 |
| 98. | Minnehaha | 0.41% | 0.32%(+0.090)#98 | 0.37%(+0.043)#4,720 |
| 99. | Chehalis | 0.41% | 0.32%(+0.088)#99 | 0.37%(+0.041)#4,734 |
| 100. | Shoreline | 0.41% | 0.32%(+0.086)#100 | 0.37%(+0.039)#4,752 |
Common Questions
What are the Top 10 Cities with the Highest Percentage of Greek Population in Washington?
Top 10 Cities with the Highest Percentage of Greek Population in Washington are:
#1
6.29%
#2
4.14%
#3
3.78%
#4
3.52%
#5
2.92%
#6
2.12%
#7
2.07%
#8
2.03%
#9
2.01%
#10
1.98%
What city has the Highest Percentage of Greek Population in Washington?
Deep River has the Highest Percentage of Greek Population in Washington with 6.29%.
What is the Percentage of Greek Population in the State of Washington?
Percentage of Greek Population in Washington is 0.32%.
What is the Percentage of Greek Population in the United States?
Percentage of Greek Population in the United States is 0.37%.