Mukilteo, WA
Mukilteo Map
Mukilteo Overview
21,365
TOTAL POPULATION
10,630
MALE POPULATION
10,735
FEMALE POPULATION
99.02
MALES / 100 FEMALES
100.99
FEMALES / 100 MALES
43.6
MEDIAN AGE
3.1
AVG FAMILY SIZE
2.6
AVG HOUSEHOLD SIZE
$62,514
PER CAPITA INCOME
$158,292
AVG FAMILY INCOME
$123,036
AVG HOUSEHOLD INCOME
40.2%
WAGE / INCOME GAP [ % ]
59.8¢/ $1
WAGE / INCOME GAP [ $ ]
0.41
INEQUALITY / GINI INDEX
11,422
LABOR FORCE [ PEOPLE ]
66.3%
PERCENT IN LABOR FORCE
2.5%
UNEMPLOYMENT RATE
Mukilteo Zip Codes
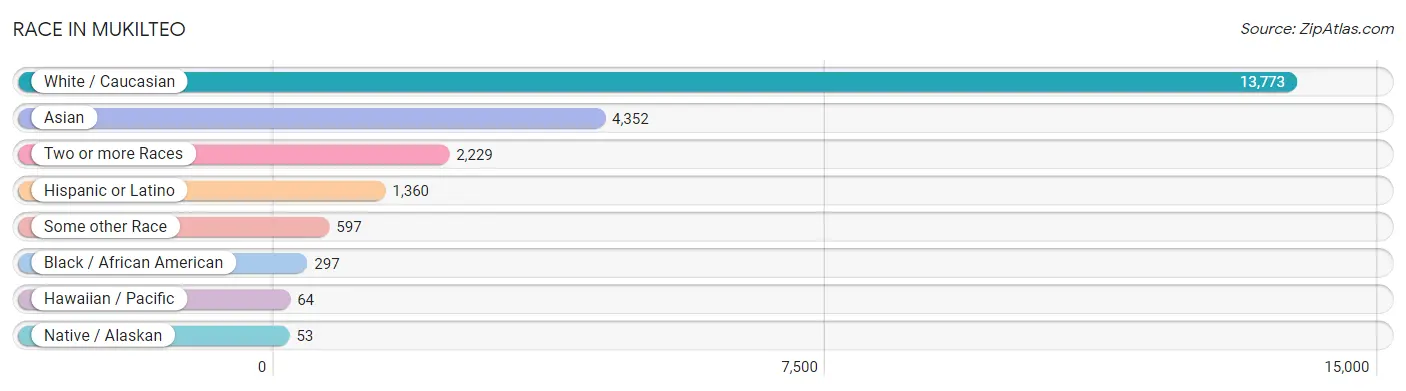
Race in Mukilteo
The most populous races in Mukilteo are White / Caucasian (13,773 | 64.5%), Asian (4,352 | 20.4%), and Two or more Races (2,229 | 10.4%).
| Race | # Population | % Population |
| Asian | 4,352 | 20.4% |
| Black / African American | 297 | 1.4% |
| Hawaiian / Pacific | 64 | 0.3% |
| Hispanic or Latino | 1,360 | 6.4% |
| Native / Alaskan | 53 | 0.3% |
| White / Caucasian | 13,773 | 64.5% |
| Two or more Races | 2,229 | 10.4% |
| Some other Race | 597 | 2.8% |
| Total | 21,365 | 100.0% |
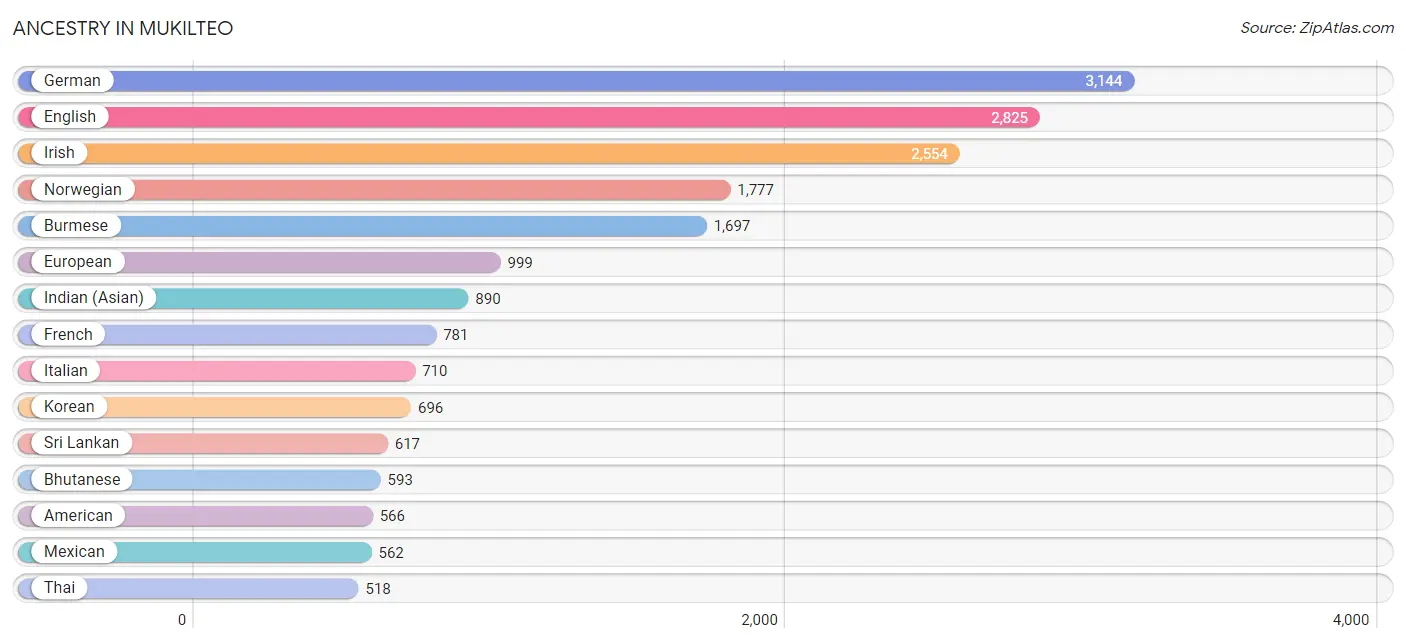
Ancestry in Mukilteo
The most populous ancestries reported in Mukilteo are German (3,144 | 14.7%), English (2,825 | 13.2%), Irish (2,554 | 11.9%), Norwegian (1,777 | 8.3%), and Burmese (1,697 | 7.9%), together accounting for 56.1% of all Mukilteo residents.
| Ancestry | # Population | % Population |
| African | 143 | 0.7% |
| Albanian | 26 | 0.1% |
| American | 566 | 2.6% |
| Armenian | 10 | 0.1% |
| Australian | 24 | 0.1% |
| Austrian | 3 | 0.0% |
| Bangladeshi | 62 | 0.3% |
| Basque | 12 | 0.1% |
| Bhutanese | 593 | 2.8% |
| Blackfeet | 18 | 0.1% |
| British | 190 | 0.9% |
| Burmese | 1,697 | 7.9% |
| Canadian | 279 | 1.3% |
| Celtic | 9 | 0.0% |
| Central American | 34 | 0.2% |
| Central American Indian | 10 | 0.1% |
| Cherokee | 56 | 0.3% |
| Chickasaw | 68 | 0.3% |
| Chippewa | 55 | 0.3% |
| Colombian | 319 | 1.5% |
| Creek | 11 | 0.1% |
| Croatian | 87 | 0.4% |
| Czech | 99 | 0.5% |
| Danish | 143 | 0.7% |
| Dutch | 319 | 1.5% |
| Eastern European | 23 | 0.1% |
| Ecuadorian | 19 | 0.1% |
| English | 2,825 | 13.2% |
| European | 999 | 4.7% |
| Filipino | 30 | 0.1% |
| Finnish | 57 | 0.3% |
| French | 781 | 3.7% |
| French Canadian | 197 | 0.9% |
| German | 3,144 | 14.7% |
| Greek | 71 | 0.3% |
| Guamanian / Chamorro | 119 | 0.6% |
| Hungarian | 40 | 0.2% |
| Icelander | 11 | 0.1% |
| Indian (Asian) | 890 | 4.2% |
| Indonesian | 33 | 0.2% |
| Iranian | 122 | 0.6% |
| Irish | 2,554 | 11.9% |
| Iroquois | 9 | 0.0% |
| Italian | 710 | 3.3% |
| Japanese | 268 | 1.3% |
| Kenyan | 22 | 0.1% |
| Korean | 696 | 3.3% |
| Laotian | 15 | 0.1% |
| Latvian | 21 | 0.1% |
| Lithuanian | 11 | 0.1% |
| Maltese | 23 | 0.1% |
| Mexican | 562 | 2.6% |
| Mexican American Indian | 52 | 0.2% |
| Mongolian | 24 | 0.1% |
| Native Hawaiian | 414 | 1.9% |
| Nigerian | 61 | 0.3% |
| Northern European | 68 | 0.3% |
| Norwegian | 1,777 | 8.3% |
| Okinawan | 45 | 0.2% |
| Pakistani | 36 | 0.2% |
| Panamanian | 10 | 0.1% |
| Pennsylvania German | 24 | 0.1% |
| Peruvian | 45 | 0.2% |
| Polish | 447 | 2.1% |
| Portuguese | 82 | 0.4% |
| Puerto Rican | 239 | 1.1% |
| Puget Sound Salish | 51 | 0.2% |
| Romanian | 126 | 0.6% |
| Russian | 251 | 1.2% |
| Salvadoran | 24 | 0.1% |
| Scandinavian | 413 | 1.9% |
| Scotch-Irish | 231 | 1.1% |
| Scottish | 417 | 1.9% |
| Slavic | 46 | 0.2% |
| Slovene | 102 | 0.5% |
| South African | 49 | 0.2% |
| South American | 383 | 1.8% |
| Spanish | 58 | 0.3% |
| Sri Lankan | 617 | 2.9% |
| Subsaharan African | 292 | 1.4% |
| Sudanese | 17 | 0.1% |
| Swedish | 436 | 2.0% |
| Swiss | 35 | 0.2% |
| Thai | 518 | 2.4% |
| Tlingit-Haida | 2 | 0.0% |
| Tongan | 44 | 0.2% |
| Tsimshian | 9 | 0.0% |
| Turkish | 74 | 0.4% |
| Ukrainian | 128 | 0.6% |
| Welsh | 170 | 0.8% |
| Yugoslavian | 9 | 0.0% | View All 91 Rows |
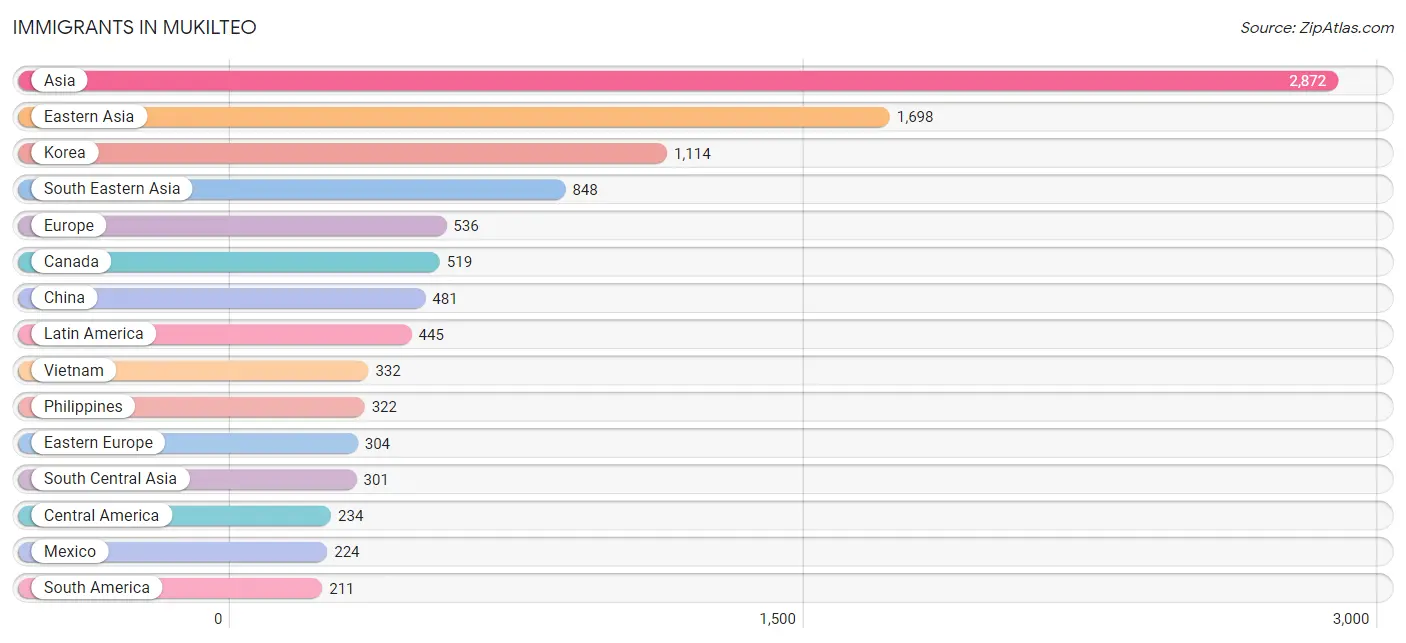
Immigrants in Mukilteo
The most numerous immigrant groups reported in Mukilteo came from Asia (2,872 | 13.4%), Eastern Asia (1,698 | 8.0%), Korea (1,114 | 5.2%), South Eastern Asia (848 | 4.0%), and Europe (536 | 2.5%), together accounting for 33.1% of all Mukilteo residents.
| Immigration Origin | # Population | % Population |
| Africa | 130 | 0.6% |
| Albania | 26 | 0.1% |
| Asia | 2,872 | 13.4% |
| Australia | 12 | 0.1% |
| Brazil | 71 | 0.3% |
| Cambodia | 44 | 0.2% |
| Canada | 519 | 2.4% |
| Central America | 234 | 1.1% |
| China | 481 | 2.2% |
| Colombia | 76 | 0.4% |
| Denmark | 26 | 0.1% |
| Eastern Africa | 52 | 0.2% |
| Eastern Asia | 1,698 | 8.0% |
| Eastern Europe | 304 | 1.4% |
| Ecuador | 19 | 0.1% |
| England | 51 | 0.2% |
| Europe | 536 | 2.5% |
| France | 11 | 0.1% |
| Germany | 20 | 0.1% |
| Hong Kong | 65 | 0.3% |
| India | 166 | 0.8% |
| Indonesia | 8 | 0.0% |
| Iran | 82 | 0.4% |
| Ireland | 12 | 0.1% |
| Italy | 42 | 0.2% |
| Japan | 103 | 0.5% |
| Kazakhstan | 10 | 0.1% |
| Korea | 1,114 | 5.2% |
| Latin America | 445 | 2.1% |
| Malaysia | 6 | 0.0% |
| Mexico | 224 | 1.1% |
| Morocco | 11 | 0.1% |
| Netherlands | 12 | 0.1% |
| Northern Africa | 42 | 0.2% |
| Northern Europe | 135 | 0.6% |
| Norway | 9 | 0.0% |
| Oceania | 12 | 0.1% |
| Pakistan | 24 | 0.1% |
| Panama | 10 | 0.1% |
| Peru | 45 | 0.2% |
| Philippines | 322 | 1.5% |
| Romania | 41 | 0.2% |
| Russia | 197 | 0.9% |
| Scotland | 6 | 0.0% |
| Singapore | 45 | 0.2% |
| South Africa | 36 | 0.2% |
| South America | 211 | 1.0% |
| South Central Asia | 301 | 1.4% |
| South Eastern Asia | 848 | 4.0% |
| Southern Europe | 54 | 0.3% |
| Spain | 12 | 0.1% |
| Sri Lanka | 19 | 0.1% |
| Sudan | 31 | 0.2% |
| Taiwan | 56 | 0.3% |
| Thailand | 58 | 0.3% |
| Turkey | 25 | 0.1% |
| Uganda | 51 | 0.2% |
| Ukraine | 40 | 0.2% |
| Vietnam | 332 | 1.5% |
| Western Asia | 25 | 0.1% |
| Western Europe | 43 | 0.2% |
| Zimbabwe | 1 | 0.0% | View All 62 Rows |
Sex and Age in Mukilteo
Sex and Age in Mukilteo
The most populous age groups in Mukilteo are 60 to 64 Years (971 | 9.1%) for men and 60 to 64 Years (1,067 | 9.9%) for women.
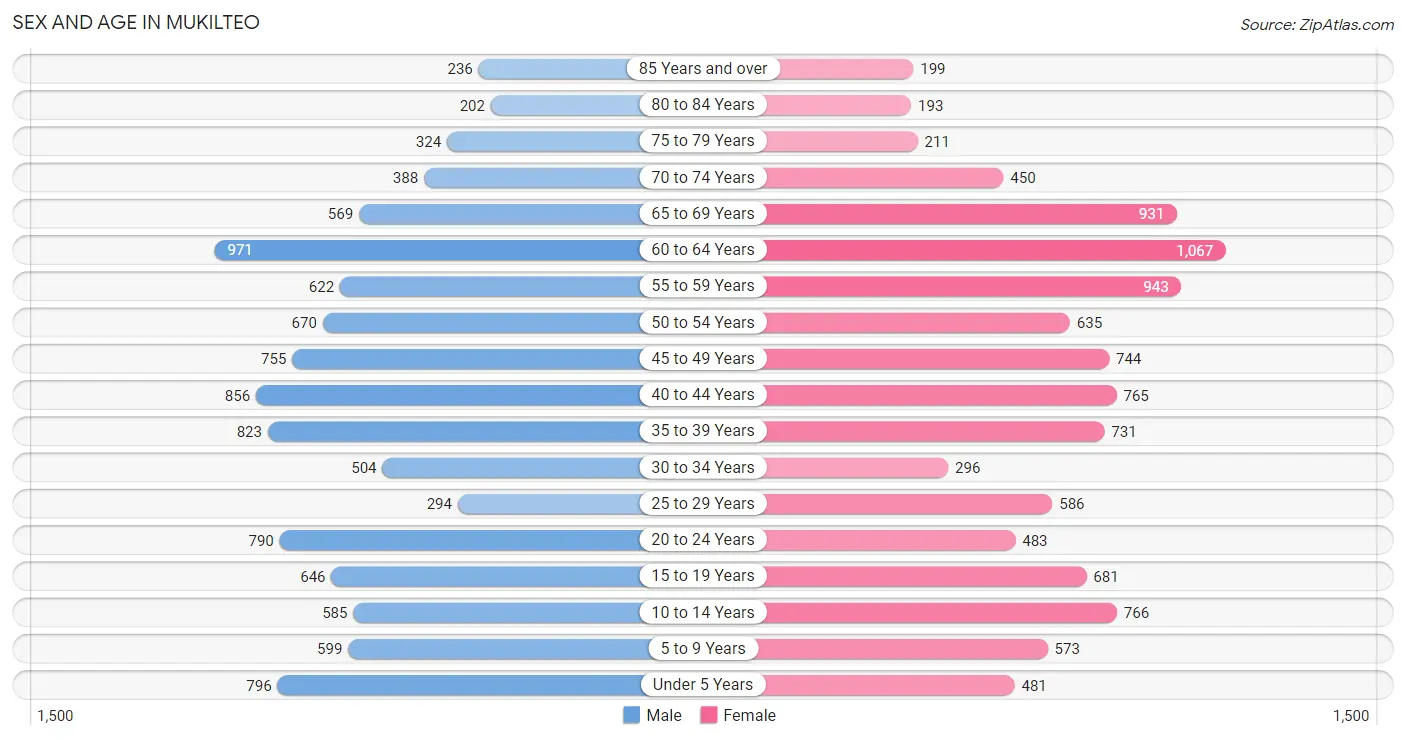
| Age Bracket | Male | Female |
| Under 5 Years | 796 (7.5%) | 481 (4.5%) |
| 5 to 9 Years | 599 (5.6%) | 573 (5.3%) |
| 10 to 14 Years | 585 (5.5%) | 766 (7.1%) |
| 15 to 19 Years | 646 (6.1%) | 681 (6.3%) |
| 20 to 24 Years | 790 (7.4%) | 483 (4.5%) |
| 25 to 29 Years | 294 (2.8%) | 586 (5.5%) |
| 30 to 34 Years | 504 (4.7%) | 296 (2.8%) |
| 35 to 39 Years | 823 (7.7%) | 731 (6.8%) |
| 40 to 44 Years | 856 (8.1%) | 765 (7.1%) |
| 45 to 49 Years | 755 (7.1%) | 744 (6.9%) |
| 50 to 54 Years | 670 (6.3%) | 635 (5.9%) |
| 55 to 59 Years | 622 (5.9%) | 943 (8.8%) |
| 60 to 64 Years | 971 (9.1%) | 1,067 (9.9%) |
| 65 to 69 Years | 569 (5.3%) | 931 (8.7%) |
| 70 to 74 Years | 388 (3.6%) | 450 (4.2%) |
| 75 to 79 Years | 324 (3.0%) | 211 (2.0%) |
| 80 to 84 Years | 202 (1.9%) | 193 (1.8%) |
| 85 Years and over | 236 (2.2%) | 199 (1.8%) |
| Total | 10,630 (100.0%) | 10,735 (100.0%) |
Families and Households in Mukilteo
Median Family Size in Mukilteo
The median family size in Mukilteo is 3.08 persons per family, with married-couple families (4,781 | 83.0%) accounting for the largest median family size of 3.13 persons per family. On the other hand, single male/father families (209 | 3.6%) represent the smallest median family size with 2.59 persons per family.
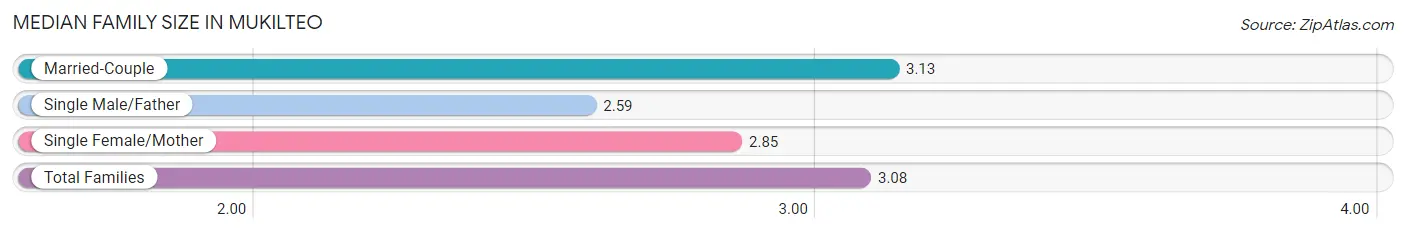
| Family Type | # Families | Family Size |
| Married-Couple | 4,781 (83.0%) | 3.13 |
| Single Male/Father | 209 (3.6%) | 2.59 |
| Single Female/Mother | 770 (13.4%) | 2.85 |
| Total Families | 5,760 (100.0%) | 3.08 |
Median Household Size in Mukilteo
The median household size in Mukilteo is 2.58 persons per household, with single female/mother households (770 | 9.3%) accounting for the largest median household size of 3.29 persons per household. non-family households (2,493 | 30.2%) represent the smallest median household size with 1.23 persons per household.
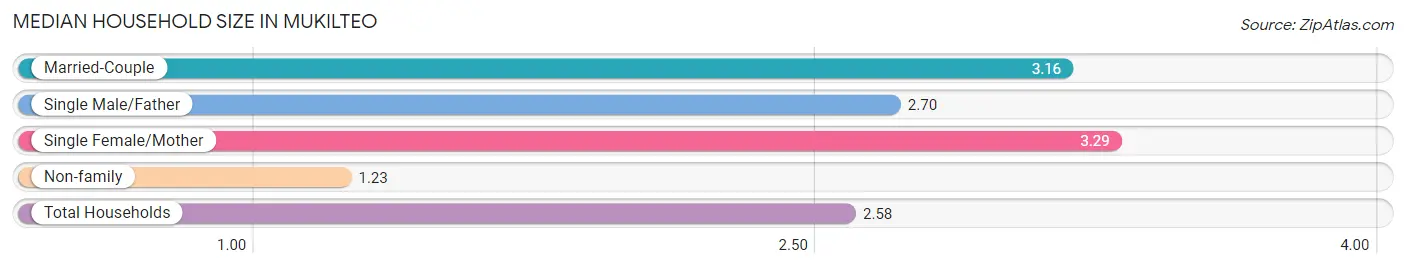
| Household Type | # Households | Household Size |
| Married-Couple | 4,781 (57.9%) | 3.16 |
| Single Male/Father | 209 (2.5%) | 2.70 |
| Single Female/Mother | 770 (9.3%) | 3.29 |
| Non-family | 2,493 (30.2%) | 1.23 |
| Total Households | 8,253 (100.0%) | 2.58 |
Household Size by Marriage Status in Mukilteo
Out of a total of 8,253 households in Mukilteo, 5,760 (69.8%) are family households, while 2,493 (30.2%) are nonfamily households. The most numerous type of family households are 2-person households, comprising 2,435, and the most common type of nonfamily households are 1-person households, comprising 1,972.
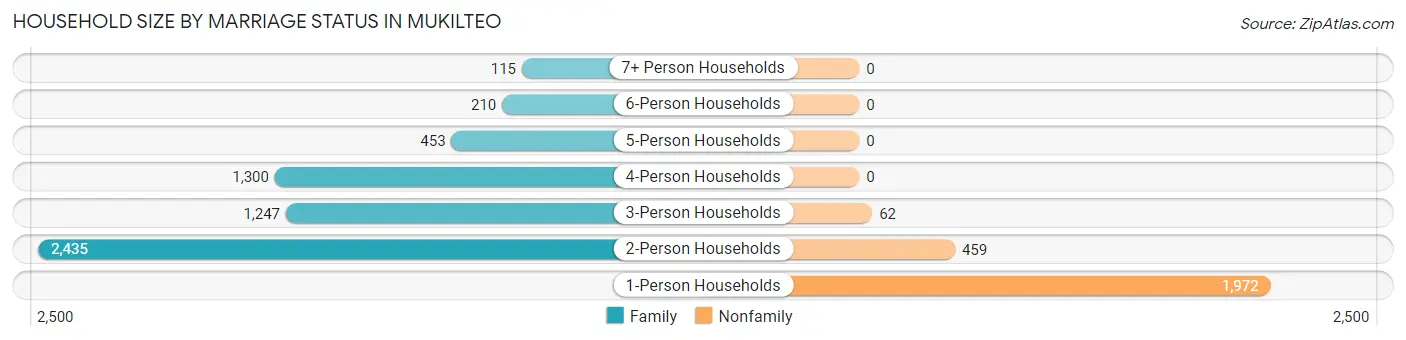
| Household Size | Family Households | Nonfamily Households |
| 1-Person Households | - | 1,972 (23.9%) |
| 2-Person Households | 2,435 (29.5%) | 459 (5.6%) |
| 3-Person Households | 1,247 (15.1%) | 62 (0.7%) |
| 4-Person Households | 1,300 (15.8%) | 0 (0.0%) |
| 5-Person Households | 453 (5.5%) | 0 (0.0%) |
| 6-Person Households | 210 (2.5%) | 0 (0.0%) |
| 7+ Person Households | 115 (1.4%) | 0 (0.0%) |
| Total | 5,760 (69.8%) | 2,493 (30.2%) |
Female Fertility in Mukilteo
Fertility by Age in Mukilteo
Average fertility rate in Mukilteo is 28.0 births per 1,000 women. Women in the age bracket of 35 to 50 years have the highest fertility rate with 52.0 births per 1,000 women. Women in the age bracket of 35 to 50 years acount for 100.0% of all women with births.
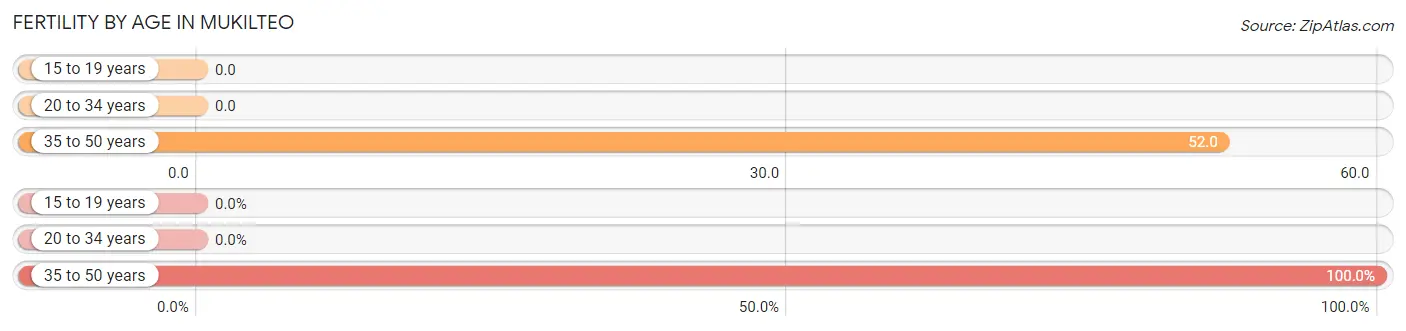
| Age Bracket | Women with Births | Births / 1,000 Women |
| 15 to 19 years | 0 (0.0%) | 0.0 |
| 20 to 34 years | 0 (0.0%) | 0.0 |
| 35 to 50 years | 120 (100.0%) | 52.0 |
| Total | 120 (100.0%) | 28.0 |
Fertility by Age by Marriage Status in Mukilteo
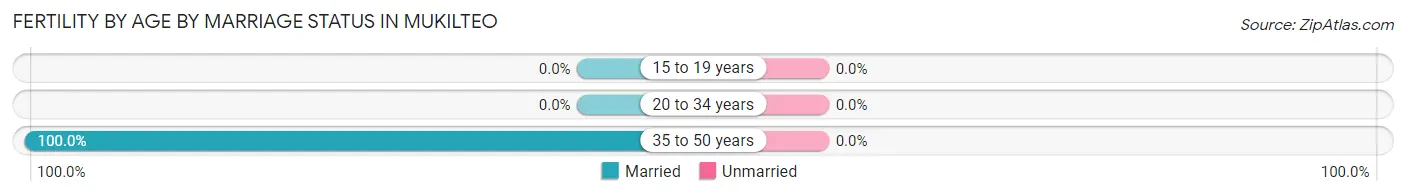
| Age Bracket | Married | Unmarried |
| 15 to 19 years | 0 (0.0%) | 0 (0.0%) |
| 20 to 34 years | 0 (0.0%) | 0 (0.0%) |
| 35 to 50 years | 120 (100.0%) | 0 (0.0%) |
| Total | 120 (100.0%) | 0 (0.0%) |
Fertility by Education in Mukilteo
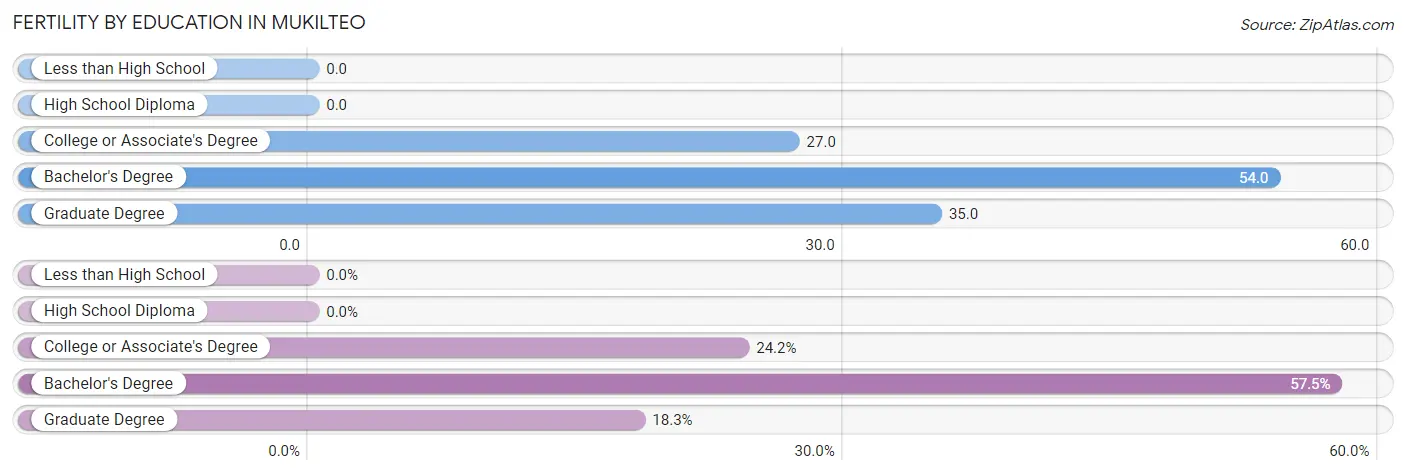
| Educational Attainment | Women with Births | Births / 1,000 Women |
| Less than High School | 0 (0.0%) | 0.0 |
| High School Diploma | 0 (0.0%) | 0.0 |
| College or Associate's Degree | 29 (24.2%) | 27.0 |
| Bachelor's Degree | 69 (57.5%) | 54.0 |
| Graduate Degree | 22 (18.3%) | 35.0 |
| Total | 120 (100.0%) | 28.0 |
Fertility by Education by Marriage Status in Mukilteo
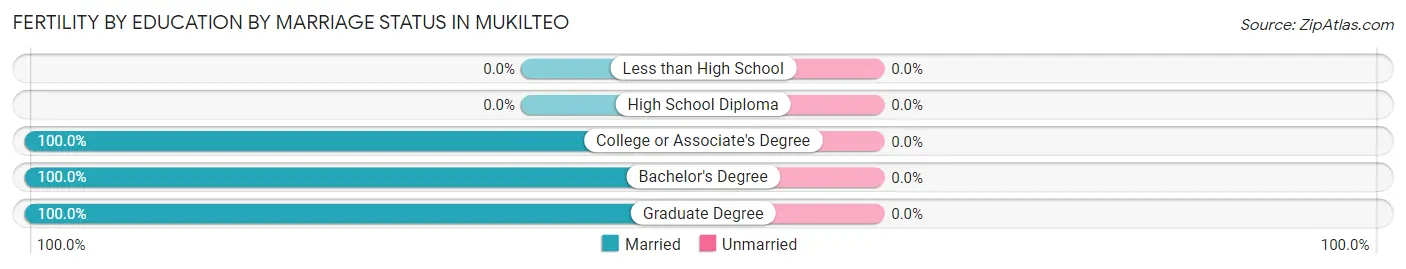
| Educational Attainment | Married | Unmarried |
| Less than High School | 0 (0.0%) | 0 (0.0%) |
| High School Diploma | 0 (0.0%) | 0 (0.0%) |
| College or Associate's Degree | 29 (100.0%) | 0 (0.0%) |
| Bachelor's Degree | 69 (100.0%) | 0 (0.0%) |
| Graduate Degree | 22 (100.0%) | 0 (0.0%) |
| Total | 120 (100.0%) | 0 (0.0%) |
Income in Mukilteo
Income Overview in Mukilteo
Per Capita Income in Mukilteo is $62,514, while median incomes of families and households are $158,292 and $123,036 respectively.
| Characteristic | Number | Measure |
| Per Capita Income | 21,365 | $62,514 |
| Median Family Income | 5,760 | $158,292 |
| Mean Family Income | 5,760 | $181,536 |
| Median Household Income | 8,253 | $123,036 |
| Mean Household Income | 8,253 | $158,253 |
| Income Deficit | 5,760 | $0 |
| Wage / Income Gap (%) | 21,365 | 40.18% |
| Wage / Income Gap ($) | 21,365 | 59.82¢ per $1 |
| Gini / Inequality Index | 21,365 | 0.41 |
Earnings by Sex in Mukilteo
Average Earnings in Mukilteo are $65,767, $86,025 for men and $51,463 for women, a difference of 40.2%.
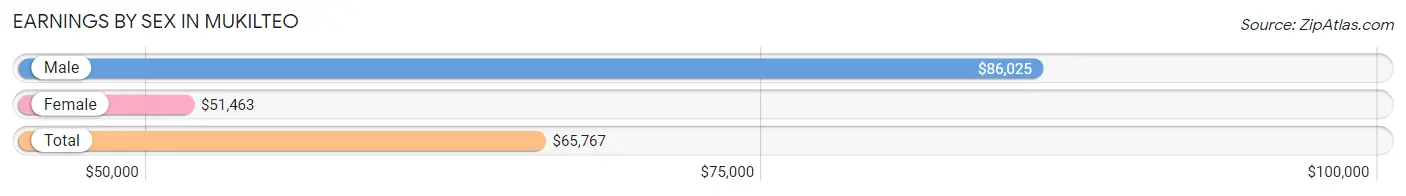
| Sex | Number | Average Earnings |
| Male | 6,328 (52.7%) | $86,025 |
| Female | 5,676 (47.3%) | $51,463 |
| Total | 12,004 (100.0%) | $65,767 |
Earnings by Sex by Income Bracket in Mukilteo
The most common earnings brackets in Mukilteo are $100,000+ for men (2,843 | 44.9%) and $100,000+ for women (1,054 | 18.6%).
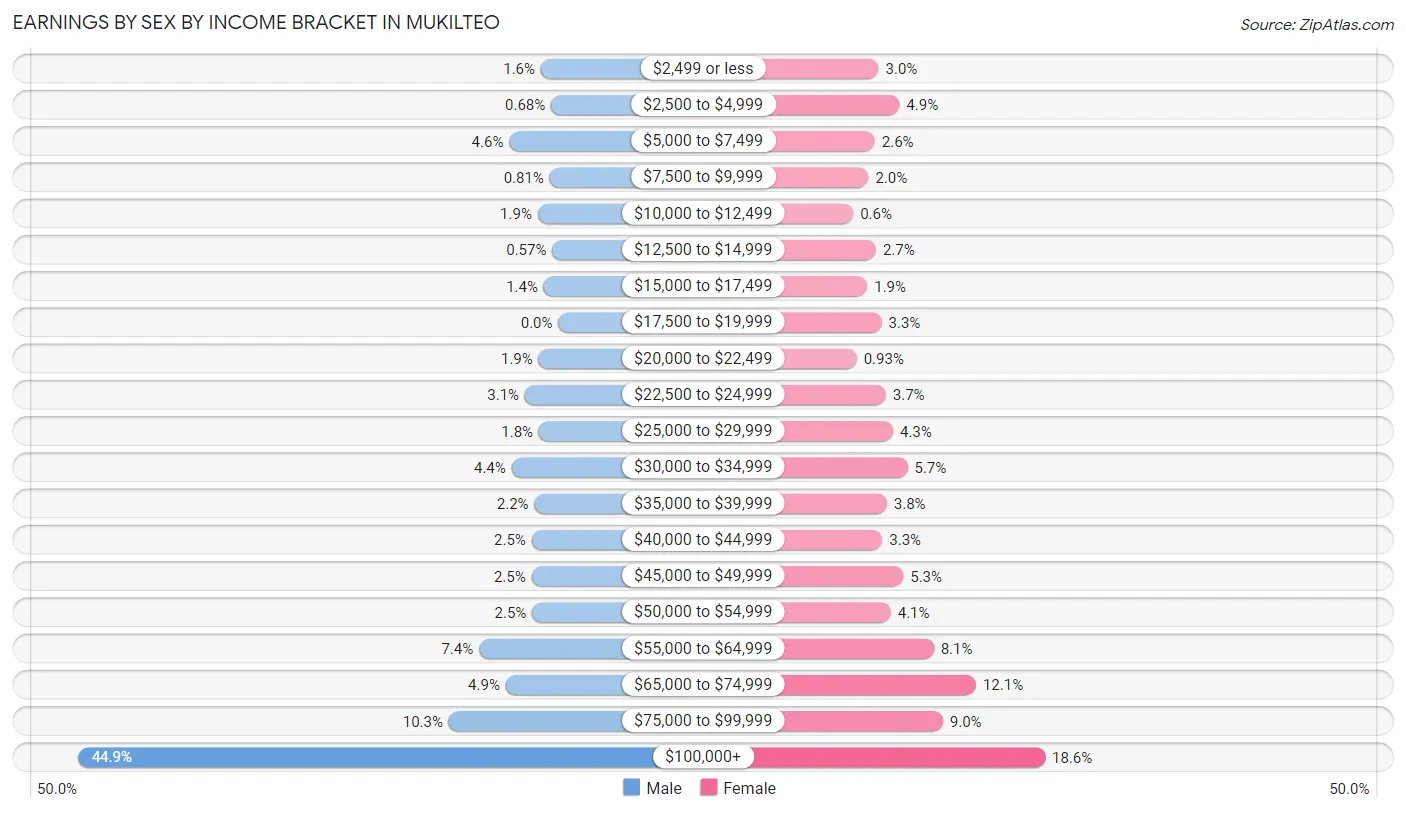
| Income | Male | Female |
| $2,499 or less | 104 (1.6%) | 169 (3.0%) |
| $2,500 to $4,999 | 43 (0.7%) | 280 (4.9%) |
| $5,000 to $7,499 | 291 (4.6%) | 149 (2.6%) |
| $7,500 to $9,999 | 51 (0.8%) | 115 (2.0%) |
| $10,000 to $12,499 | 122 (1.9%) | 34 (0.6%) |
| $12,500 to $14,999 | 36 (0.6%) | 155 (2.7%) |
| $15,000 to $17,499 | 86 (1.4%) | 109 (1.9%) |
| $17,500 to $19,999 | 0 (0.0%) | 185 (3.3%) |
| $20,000 to $22,499 | 117 (1.8%) | 53 (0.9%) |
| $22,500 to $24,999 | 198 (3.1%) | 208 (3.7%) |
| $25,000 to $29,999 | 115 (1.8%) | 246 (4.3%) |
| $30,000 to $34,999 | 277 (4.4%) | 323 (5.7%) |
| $35,000 to $39,999 | 142 (2.2%) | 213 (3.7%) |
| $40,000 to $44,999 | 158 (2.5%) | 189 (3.3%) |
| $45,000 to $49,999 | 159 (2.5%) | 300 (5.3%) |
| $50,000 to $54,999 | 155 (2.5%) | 234 (4.1%) |
| $55,000 to $64,999 | 470 (7.4%) | 462 (8.1%) |
| $65,000 to $74,999 | 312 (4.9%) | 687 (12.1%) |
| $75,000 to $99,999 | 649 (10.3%) | 511 (9.0%) |
| $100,000+ | 2,843 (44.9%) | 1,054 (18.6%) |
| Total | 6,328 (100.0%) | 5,676 (100.0%) |
Earnings by Sex by Educational Attainment in Mukilteo
Average earnings in Mukilteo are $100,610 for men and $57,055 for women, a difference of 43.3%. Men with an educational attainment of graduate degree enjoy the highest average annual earnings of $159,097, while those with less than high school education earn the least with $58,333. Women with an educational attainment of graduate degree earn the most with the average annual earnings of $106,116, while those with less than high school education have the smallest earnings of $33,388.
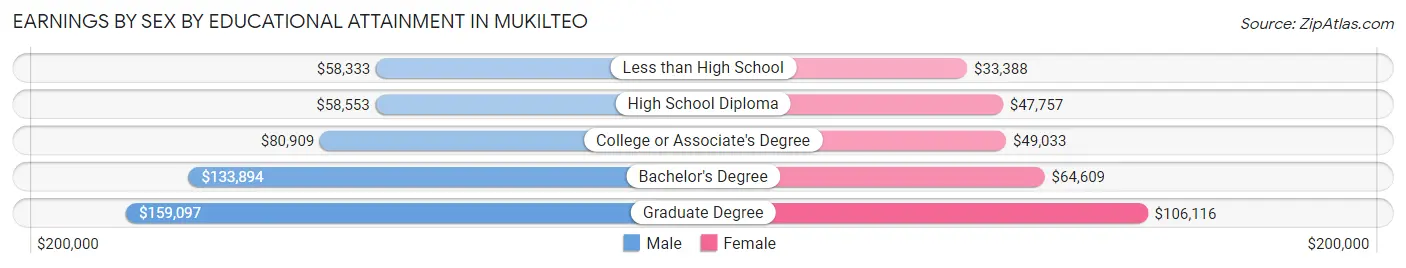
| Educational Attainment | Male Income | Female Income |
| Less than High School | $58,333 | $33,388 |
| High School Diploma | $58,553 | $47,757 |
| College or Associate's Degree | $80,909 | $49,033 |
| Bachelor's Degree | $133,894 | $64,609 |
| Graduate Degree | $159,097 | $106,116 |
| Total | $100,610 | $57,055 |
Family Income in Mukilteo
Family Income Brackets in Mukilteo
According to the Mukilteo family income data, there are 2,114 families falling into the $200,000+ income range, which is the most common income bracket and makes up 36.7% of all families.
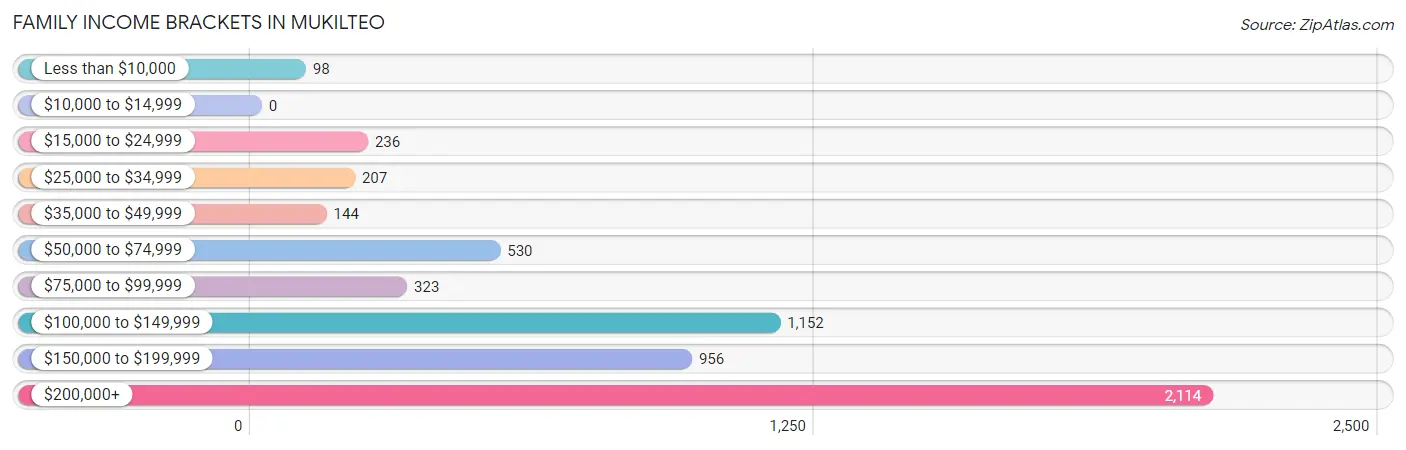
| Income Bracket | # Families | % Families |
| Less than $10,000 | 98 | 1.7% |
| $10,000 to $14,999 | 0 | 0.0% |
| $15,000 to $24,999 | 236 | 4.1% |
| $25,000 to $34,999 | 207 | 3.6% |
| $35,000 to $49,999 | 144 | 2.5% |
| $50,000 to $74,999 | 530 | 9.2% |
| $75,000 to $99,999 | 323 | 5.6% |
| $100,000 to $149,999 | 1,152 | 20.0% |
| $150,000 to $199,999 | 956 | 16.6% |
| $200,000+ | 2,114 | 36.7% |
Family Income by Famaliy Size in Mukilteo
6-person families (200 | 3.5%) account for the highest median family income in Mukilteo with $250,001 per family, while 2-person families (2,635 | 45.8%) have the highest median income of $60,746 per family member.
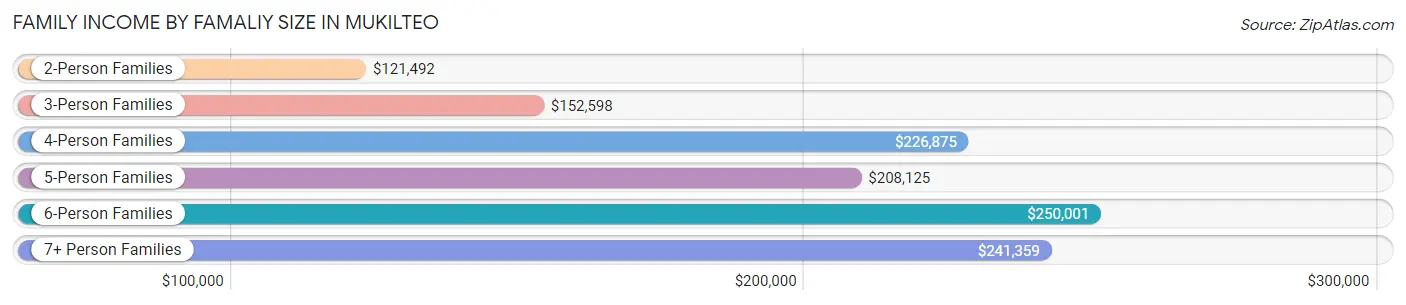
| Income Bracket | # Families | Median Income |
| 2-Person Families | 2,635 (45.8%) | $121,492 |
| 3-Person Families | 1,095 (19.0%) | $152,598 |
| 4-Person Families | 1,454 (25.2%) | $226,875 |
| 5-Person Families | 261 (4.5%) | $208,125 |
| 6-Person Families | 200 (3.5%) | $250,001 |
| 7+ Person Families | 115 (2.0%) | $241,359 |
| Total | 5,760 (100.0%) | $158,292 |
Family Income by Number of Earners in Mukilteo
The median family income in Mukilteo is $158,292, with families comprising 3+ earners (774) having the highest median family income of $216,667, while families with no earners (680) have the lowest median family income of $68,378, accounting for 13.4% and 11.8% of families, respectively.
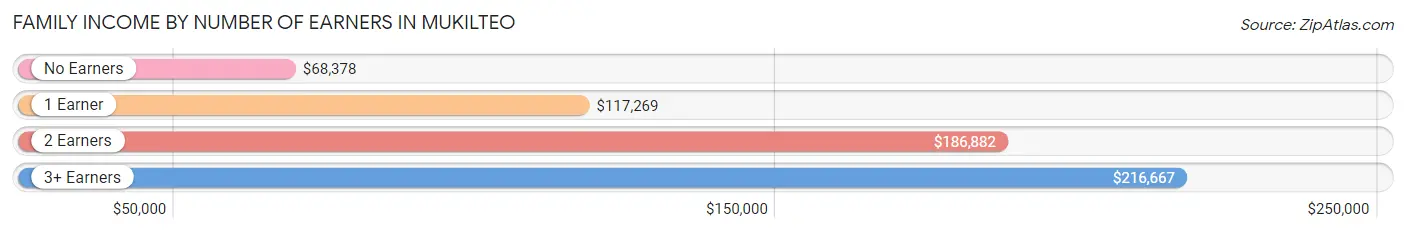
| Number of Earners | # Families | Median Income |
| No Earners | 680 (11.8%) | $68,378 |
| 1 Earner | 1,908 (33.1%) | $117,269 |
| 2 Earners | 2,398 (41.6%) | $186,882 |
| 3+ Earners | 774 (13.4%) | $216,667 |
| Total | 5,760 (100.0%) | $158,292 |
Household Income in Mukilteo
Household Income Brackets in Mukilteo
With 2,484 households falling in the category, the $200,000+ income range is the most frequent in Mukilteo, accounting for 30.1% of all households. In contrast, only 50 households (0.6%) fall into the $10,000 to $14,999 income bracket, making it the least populous group.
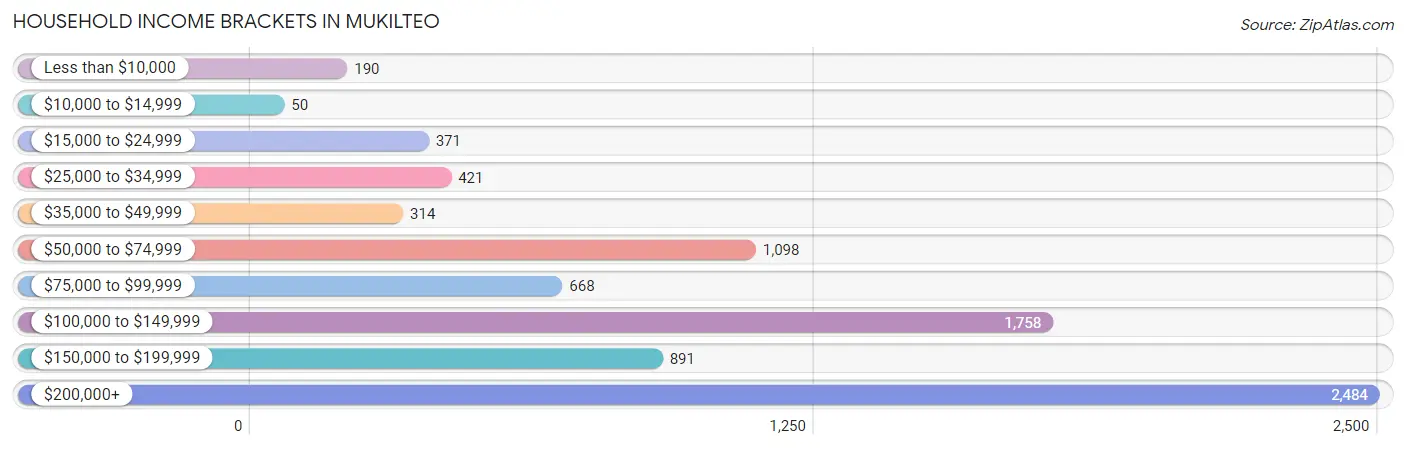
| Income Bracket | # Households | % Households |
| Less than $10,000 | 190 | 2.3% |
| $10,000 to $14,999 | 50 | 0.6% |
| $15,000 to $24,999 | 371 | 4.5% |
| $25,000 to $34,999 | 421 | 5.1% |
| $35,000 to $49,999 | 314 | 3.8% |
| $50,000 to $74,999 | 1,098 | 13.3% |
| $75,000 to $99,999 | 668 | 8.1% |
| $100,000 to $149,999 | 1,758 | 21.3% |
| $150,000 to $199,999 | 891 | 10.8% |
| $200,000+ | 2,484 | 30.1% |
Household Income by Householder Age in Mukilteo
The median household income in Mukilteo is $123,036, with the highest median household income of $149,943 found in the 45 to 64 years age bracket for the primary householder. A total of 3,566 households (43.2%) fall into this category. Meanwhile, the 15 to 24 years age bracket for the primary householder has the lowest median household income of $63,953, with 119 households (1.4%) in this group.
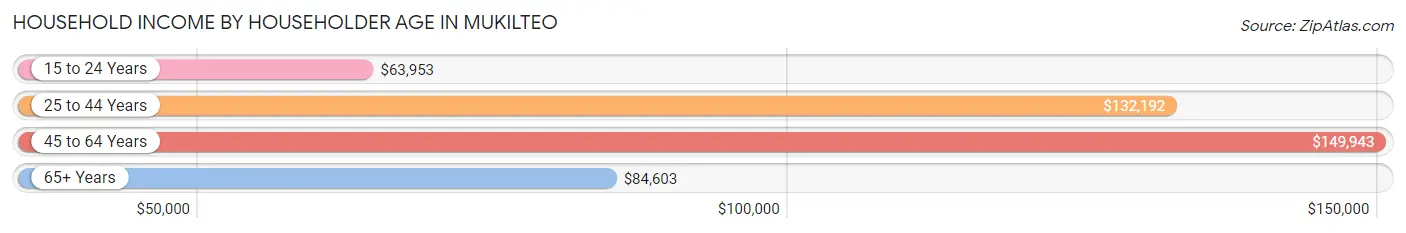
| Income Bracket | # Households | Median Income |
| 15 to 24 Years | 119 (1.4%) | $63,953 |
| 25 to 44 Years | 2,422 (29.3%) | $132,192 |
| 45 to 64 Years | 3,566 (43.2%) | $149,943 |
| 65+ Years | 2,146 (26.0%) | $84,603 |
| Total | 8,253 (100.0%) | $123,036 |
Poverty in Mukilteo
Income Below Poverty by Sex and Age in Mukilteo
With 6.5% poverty level for males and 4.7% for females among the residents of Mukilteo, under 5 year old males and 25 to 34 year old females are the most vulnerable to poverty, with 174 males (21.9%) and 138 females (15.7%) in their respective age groups living below the poverty level.
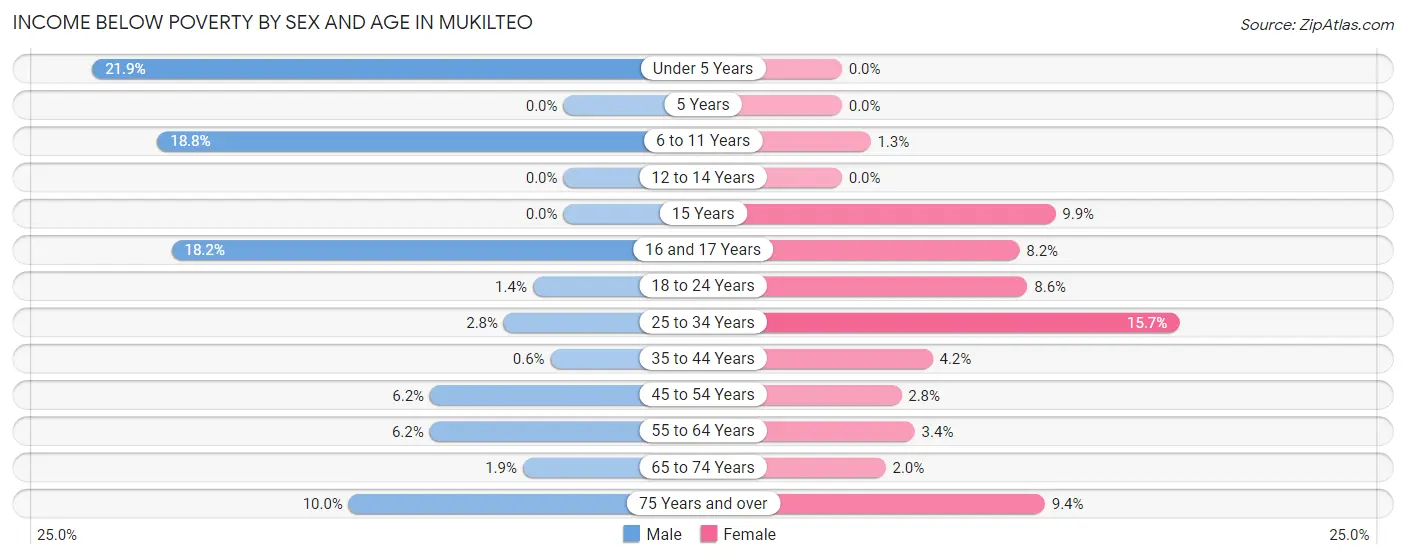
| Age Bracket | Male | Female |
| Under 5 Years | 174 (21.9%) | 0 (0.0%) |
| 5 Years | 0 (0.0%) | 0 (0.0%) |
| 6 to 11 Years | 146 (18.8%) | 10 (1.3%) |
| 12 to 14 Years | 0 (0.0%) | 0 (0.0%) |
| 15 Years | 0 (0.0%) | 21 (9.9%) |
| 16 and 17 Years | 46 (18.2%) | 21 (8.2%) |
| 18 to 24 Years | 15 (1.4%) | 60 (8.6%) |
| 25 to 34 Years | 22 (2.8%) | 138 (15.7%) |
| 35 to 44 Years | 10 (0.6%) | 63 (4.2%) |
| 45 to 54 Years | 88 (6.2%) | 38 (2.8%) |
| 55 to 64 Years | 99 (6.2%) | 68 (3.4%) |
| 65 to 74 Years | 18 (1.9%) | 28 (2.0%) |
| 75 Years and over | 74 (10.0%) | 55 (9.4%) |
| Total | 692 (6.5%) | 502 (4.7%) |
Income Above Poverty by Sex and Age in Mukilteo
According to the poverty statistics in Mukilteo, males aged 5 years and females aged under 5 years are the age groups that are most secure financially, with 100.0% of males and 100.0% of females in these age groups living above the poverty line.
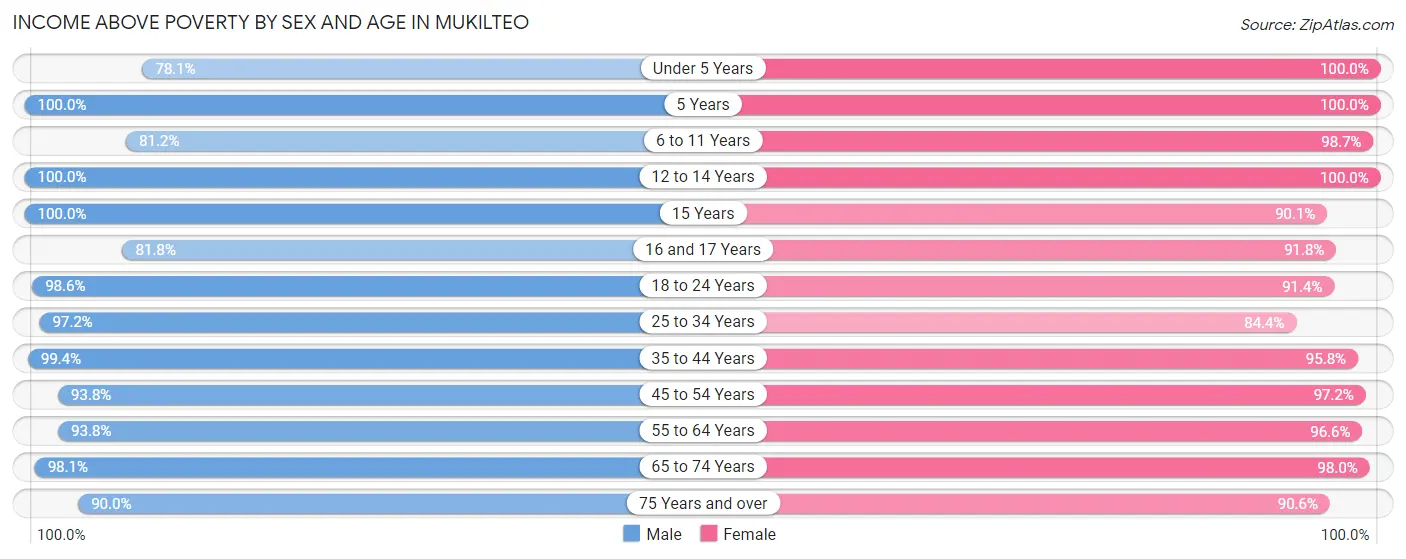
| Age Bracket | Male | Female |
| Under 5 Years | 622 (78.1%) | 481 (100.0%) |
| 5 Years | 66 (100.0%) | 17 (100.0%) |
| 6 to 11 Years | 629 (81.2%) | 740 (98.7%) |
| 12 to 14 Years | 343 (100.0%) | 572 (100.0%) |
| 15 Years | 126 (100.0%) | 191 (90.1%) |
| 16 and 17 Years | 207 (81.8%) | 234 (91.8%) |
| 18 to 24 Years | 1,042 (98.6%) | 637 (91.4%) |
| 25 to 34 Years | 776 (97.2%) | 744 (84.4%) |
| 35 to 44 Years | 1,669 (99.4%) | 1,433 (95.8%) |
| 45 to 54 Years | 1,334 (93.8%) | 1,341 (97.2%) |
| 55 to 64 Years | 1,494 (93.8%) | 1,942 (96.6%) |
| 65 to 74 Years | 939 (98.1%) | 1,353 (98.0%) |
| 75 Years and over | 669 (90.0%) | 529 (90.6%) |
| Total | 9,916 (93.5%) | 10,214 (95.3%) |
Income Below Poverty Among Married-Couple Families in Mukilteo
The poverty statistics for married-couple families in Mukilteo show that 2.2% or 106 of the total 4,781 families live below the poverty line. Families with 1 or 2 children have the highest poverty rate of 5.4%, comprising of 90 families. On the other hand, families with 5 or more children have the lowest poverty rate of 0.0%, which includes 0 families.
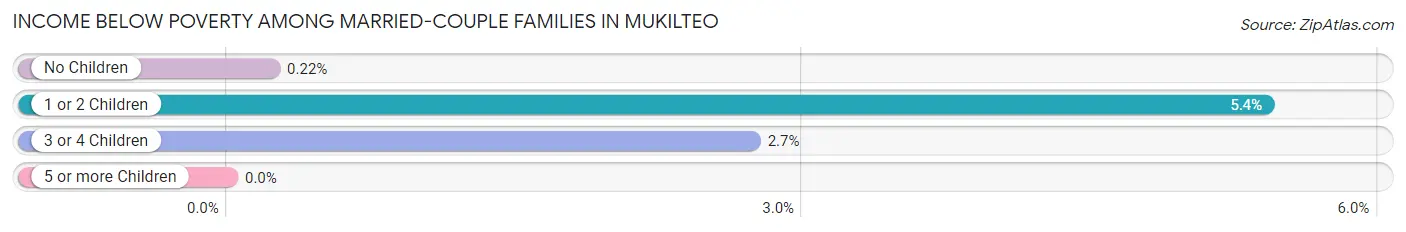
| Children | Above Poverty | Below Poverty |
| No Children | 2,725 (99.8%) | 6 (0.2%) |
| 1 or 2 Children | 1,574 (94.6%) | 90 (5.4%) |
| 3 or 4 Children | 356 (97.3%) | 10 (2.7%) |
| 5 or more Children | 20 (100.0%) | 0 (0.0%) |
| Total | 4,675 (97.8%) | 106 (2.2%) |
Income Below Poverty Among Single-Parent Households in Mukilteo
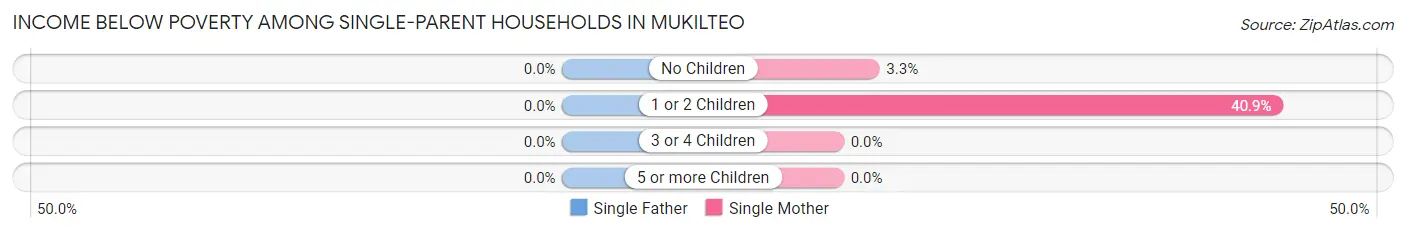
| Children | Single Father | Single Mother |
| No Children | 0 (0.0%) | 15 (3.3%) |
| 1 or 2 Children | 0 (0.0%) | 131 (40.9%) |
| 3 or 4 Children | 0 (0.0%) | 0 (0.0%) |
| 5 or more Children | 0 (0.0%) | 0 (0.0%) |
| Total | 0 (0.0%) | 146 (19.0%) |
Income Below Poverty Among Married-Couple vs Single-Parent Households in Mukilteo
The poverty data for Mukilteo shows that 106 of the married-couple family households (2.2%) and 146 of the single-parent households (14.9%) are living below the poverty level. Within the married-couple family households, those with 1 or 2 children have the highest poverty rate, with 90 households (5.4%) falling below the poverty line. Among the single-parent households, those with 1 or 2 children have the highest poverty rate, with 131 household (27.1%) living below poverty.
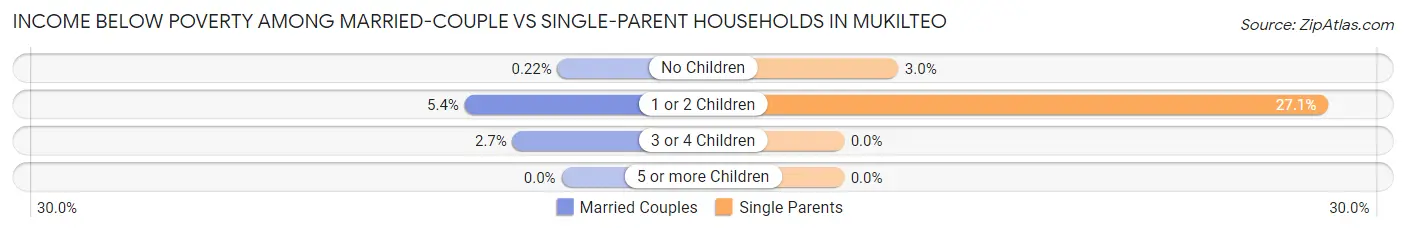
| Children | Married-Couple Families | Single-Parent Households |
| No Children | 6 (0.2%) | 15 (3.0%) |
| 1 or 2 Children | 90 (5.4%) | 131 (27.1%) |
| 3 or 4 Children | 10 (2.7%) | 0 (0.0%) |
| 5 or more Children | 0 (0.0%) | 0 (0.0%) |
| Total | 106 (2.2%) | 146 (14.9%) |
Employment Characteristics in Mukilteo
Employment by Class of Employer in Mukilteo
Among the 10,938 employed individuals in Mukilteo, private company employees (7,067 | 64.6%), not-for-profit organizations (880 | 8.1%), and local government employees (837 | 7.6%) make up the most common classes of employment.
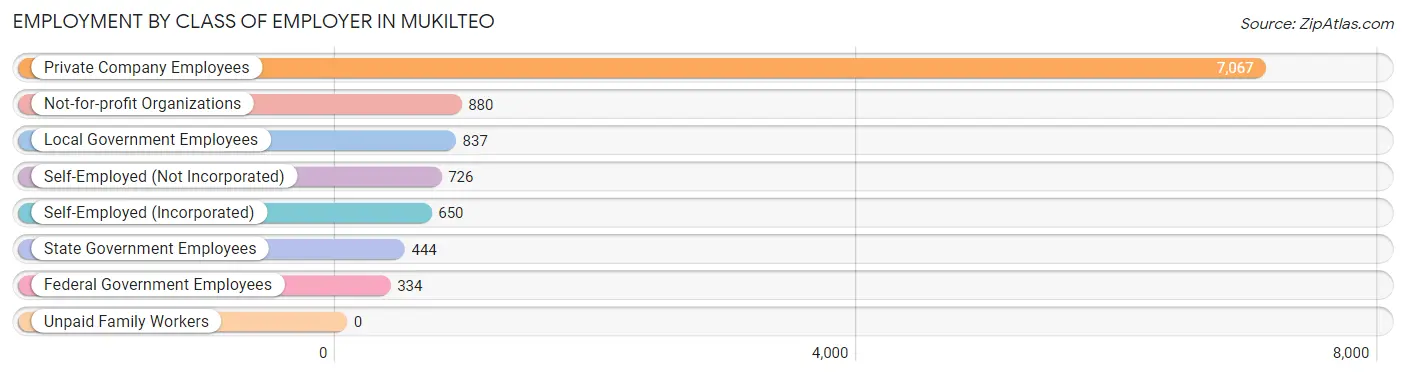
| Employer Class | # Employees | % Employees |
| Private Company Employees | 7,067 | 64.6% |
| Self-Employed (Incorporated) | 650 | 5.9% |
| Self-Employed (Not Incorporated) | 726 | 6.6% |
| Not-for-profit Organizations | 880 | 8.1% |
| Local Government Employees | 837 | 7.6% |
| State Government Employees | 444 | 4.1% |
| Federal Government Employees | 334 | 3.0% |
| Unpaid Family Workers | 0 | 0.0% |
| Total | 10,938 | 100.0% |
Employment Status by Age in Mukilteo
According to the labor force statistics for Mukilteo, out of the total population over 16 years of age (17,227), 66.3% or 11,422 individuals are in the labor force, with 2.5% or 286 of them unemployed. The age group with the highest labor force participation rate is 30 to 34 years, with 91.1% or 729 individuals in the labor force. Within the labor force, the 16 to 19 years age range has the highest percentage of unemployed individuals, with 8.4% or 24 of them being unemployed.
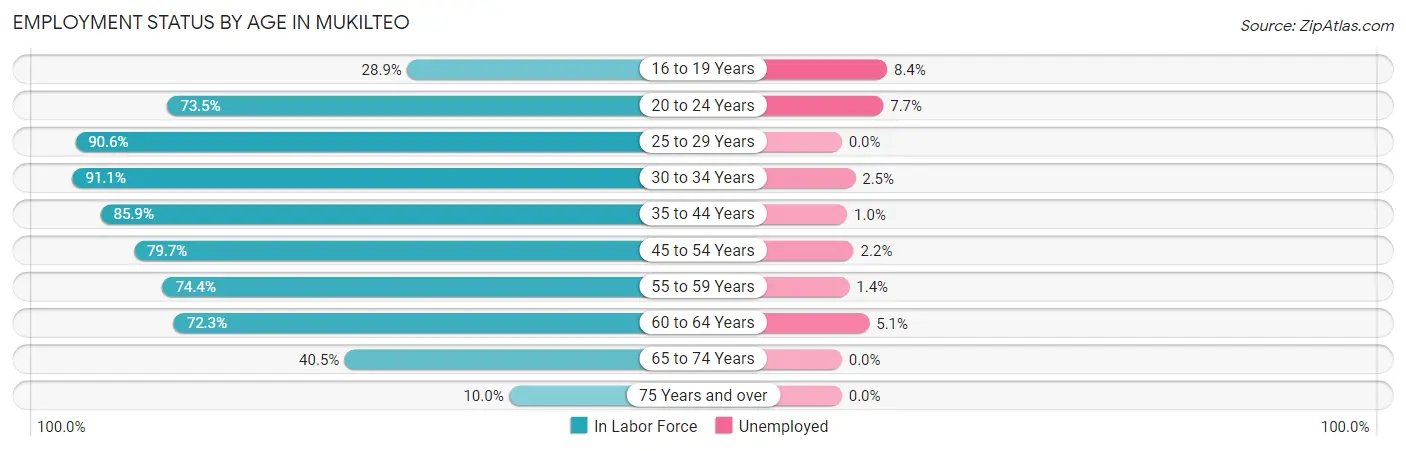
| Age Bracket | In Labor Force | Unemployed |
| 16 to 19 Years | 286 (28.9%) | 24 (8.4%) |
| 20 to 24 Years | 936 (73.5%) | 72 (7.7%) |
| 25 to 29 Years | 797 (90.6%) | 0 (0.0%) |
| 30 to 34 Years | 729 (91.1%) | 18 (2.5%) |
| 35 to 44 Years | 2,727 (85.9%) | 27 (1.0%) |
| 45 to 54 Years | 2,235 (79.7%) | 49 (2.2%) |
| 55 to 59 Years | 1,164 (74.4%) | 16 (1.4%) |
| 60 to 64 Years | 1,473 (72.3%) | 75 (5.1%) |
| 65 to 74 Years | 947 (40.5%) | 0 (0.0%) |
| 75 Years and over | 136 (10.0%) | 0 (0.0%) |
| Total | 11,422 (66.3%) | 286 (2.5%) |
Employment Status by Educational Attainment in Mukilteo
According to labor force statistics for Mukilteo, 81.0% of individuals (9,122) out of the total population between 25 and 64 years of age (11,262) are in the labor force, with 2.0% or 182 of them being unemployed. The group with the highest labor force participation rate are those with the educational attainment of bachelor's degree or higher, with 83.3% or 5,142 individuals in the labor force. Within the labor force, individuals with less than high school education have the highest percentage of unemployment, with 8.1% or 11 of them being unemployed.
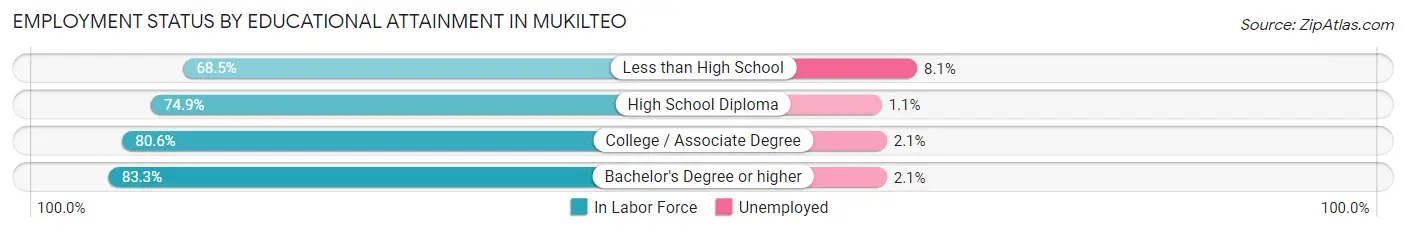
| Educational Attainment | In Labor Force | Unemployed |
| Less than High School | 135 (68.5%) | 16 (8.1%) |
| High School Diploma | 1,254 (74.9%) | 18 (1.1%) |
| College / Associate Degree | 2,594 (80.6%) | 68 (2.1%) |
| Bachelor's Degree or higher | 5,142 (83.3%) | 130 (2.1%) |
| Total | 9,122 (81.0%) | 225 (2.0%) |
Employment Occupations by Sex in Mukilteo
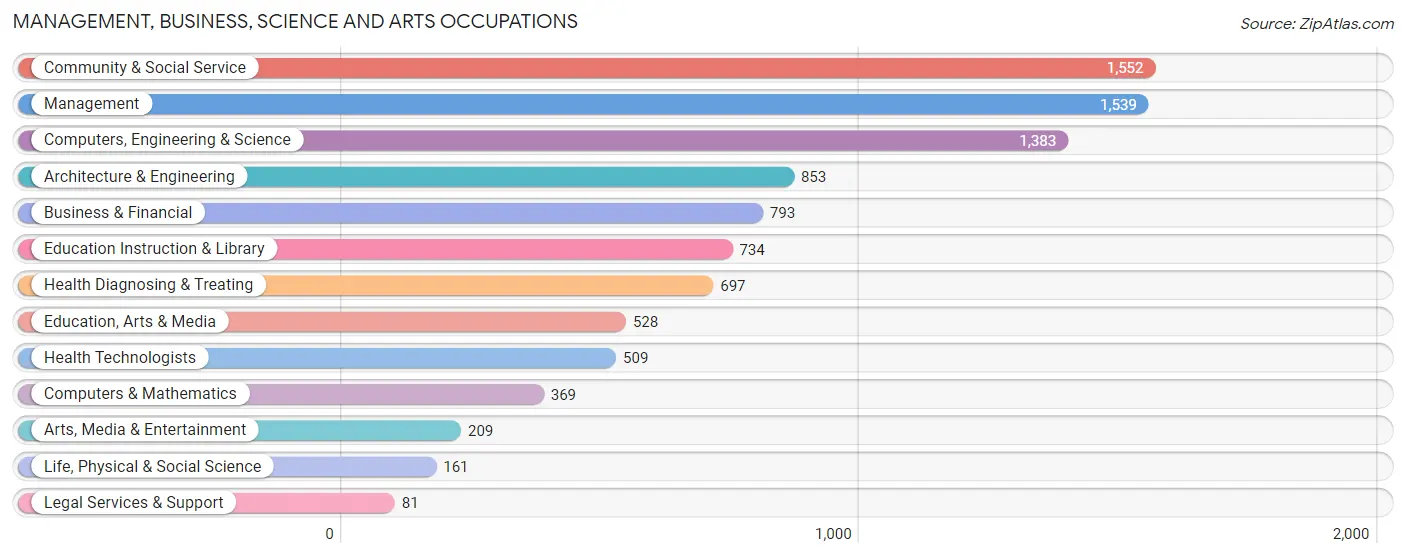
Management, Business, Science and Arts Occupations
The most common Management, Business, Science and Arts occupations in Mukilteo are Community & Social Service (1,552 | 13.9%), Management (1,539 | 13.8%), Computers, Engineering & Science (1,383 | 12.4%), Architecture & Engineering (853 | 7.7%), and Business & Financial (793 | 7.1%).
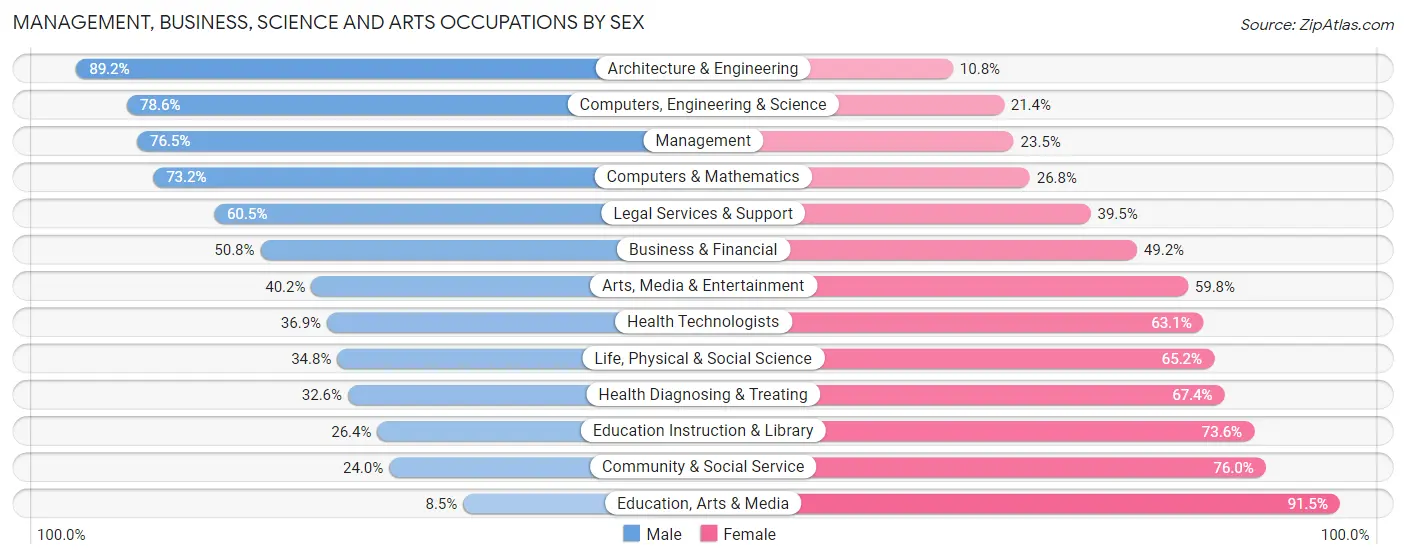
Management, Business, Science and Arts Occupations by Sex
Within the Management, Business, Science and Arts occupations in Mukilteo, the most male-oriented occupations are Architecture & Engineering (89.2%), Computers, Engineering & Science (78.6%), and Management (76.5%), while the most female-oriented occupations are Education, Arts & Media (91.5%), Community & Social Service (76.0%), and Education Instruction & Library (73.6%).
| Occupation | Male | Female |
| Management | 1,178 (76.5%) | 361 (23.5%) |
| Business & Financial | 403 (50.8%) | 390 (49.2%) |
| Computers, Engineering & Science | 1,087 (78.6%) | 296 (21.4%) |
| Computers & Mathematics | 270 (73.2%) | 99 (26.8%) |
| Architecture & Engineering | 761 (89.2%) | 92 (10.8%) |
| Life, Physical & Social Science | 56 (34.8%) | 105 (65.2%) |
| Community & Social Service | 372 (24.0%) | 1,180 (76.0%) |
| Education, Arts & Media | 45 (8.5%) | 483 (91.5%) |
| Legal Services & Support | 49 (60.5%) | 32 (39.5%) |
| Education Instruction & Library | 194 (26.4%) | 540 (73.6%) |
| Arts, Media & Entertainment | 84 (40.2%) | 125 (59.8%) |
| Health Diagnosing & Treating | 227 (32.6%) | 470 (67.4%) |
| Health Technologists | 188 (36.9%) | 321 (63.1%) |
| Total (Category) | 3,267 (54.8%) | 2,697 (45.2%) |
| Total (Overall) | 5,940 (53.3%) | 5,194 (46.7%) |
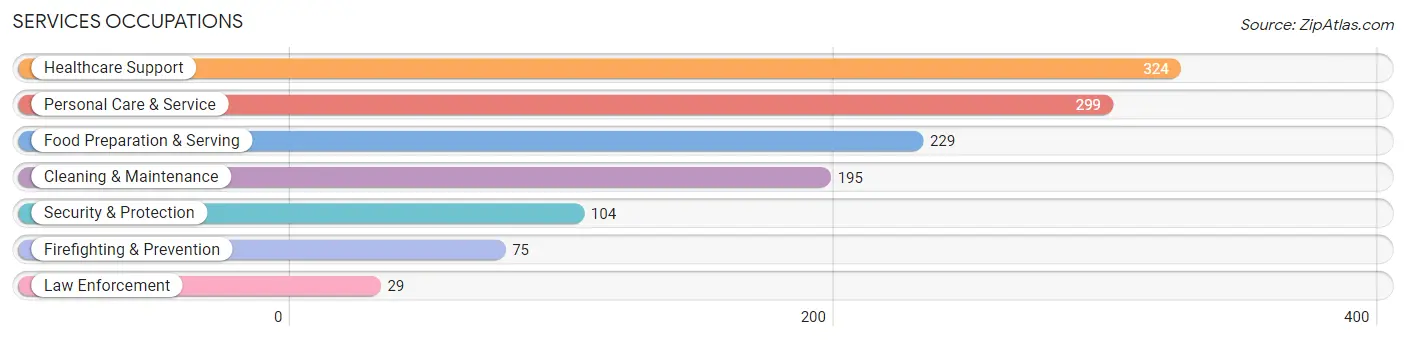
Services Occupations
The most common Services occupations in Mukilteo are Healthcare Support (324 | 2.9%), Personal Care & Service (299 | 2.7%), Food Preparation & Serving (229 | 2.1%), Cleaning & Maintenance (195 | 1.8%), and Security & Protection (104 | 0.9%).
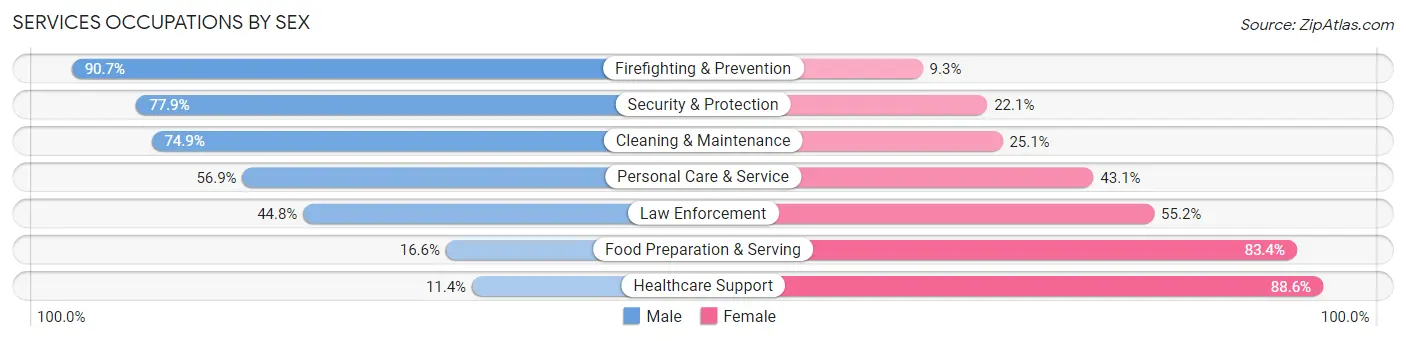
Services Occupations by Sex
Within the Services occupations in Mukilteo, the most male-oriented occupations are Firefighting & Prevention (90.7%), Security & Protection (77.9%), and Cleaning & Maintenance (74.9%), while the most female-oriented occupations are Healthcare Support (88.6%), Food Preparation & Serving (83.4%), and Law Enforcement (55.2%).
| Occupation | Male | Female |
| Healthcare Support | 37 (11.4%) | 287 (88.6%) |
| Security & Protection | 81 (77.9%) | 23 (22.1%) |
| Firefighting & Prevention | 68 (90.7%) | 7 (9.3%) |
| Law Enforcement | 13 (44.8%) | 16 (55.2%) |
| Food Preparation & Serving | 38 (16.6%) | 191 (83.4%) |
| Cleaning & Maintenance | 146 (74.9%) | 49 (25.1%) |
| Personal Care & Service | 170 (56.9%) | 129 (43.1%) |
| Total (Category) | 472 (41.0%) | 679 (59.0%) |
| Total (Overall) | 5,940 (53.3%) | 5,194 (46.7%) |
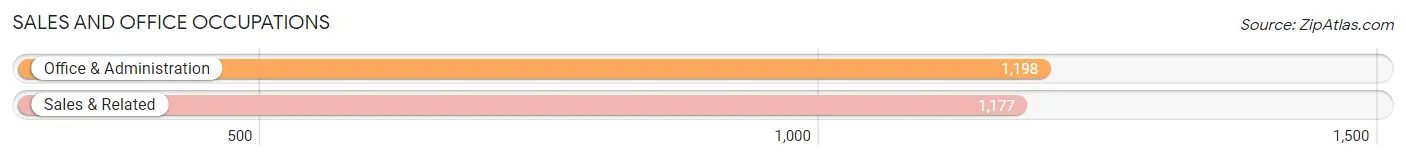
Sales and Office Occupations
The most common Sales and Office occupations in Mukilteo are Office & Administration (1,198 | 10.8%), and Sales & Related (1,177 | 10.6%).
Sales and Office Occupations by Sex
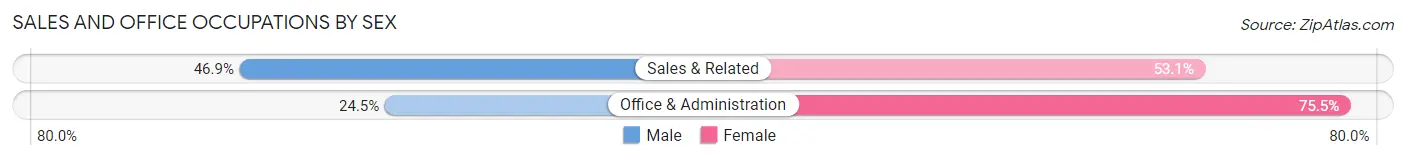
| Occupation | Male | Female |
| Sales & Related | 552 (46.9%) | 625 (53.1%) |
| Office & Administration | 294 (24.5%) | 904 (75.5%) |
| Total (Category) | 846 (35.6%) | 1,529 (64.4%) |
| Total (Overall) | 5,940 (53.3%) | 5,194 (46.7%) |
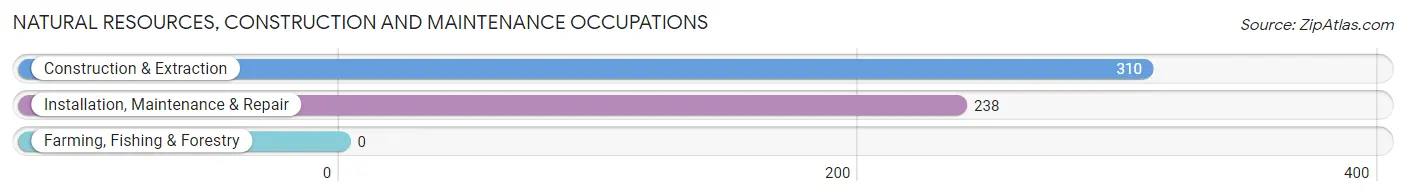
Natural Resources, Construction and Maintenance Occupations
The most common Natural Resources, Construction and Maintenance occupations in Mukilteo are Construction & Extraction (310 | 2.8%), and Installation, Maintenance & Repair (238 | 2.1%).
Natural Resources, Construction and Maintenance Occupations by Sex
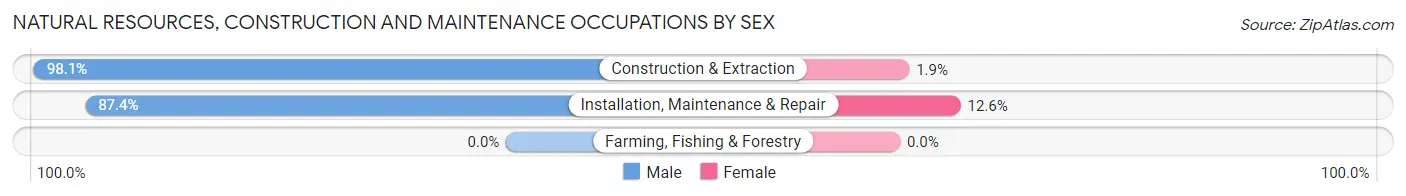
| Occupation | Male | Female |
| Farming, Fishing & Forestry | 0 (0.0%) | 0 (0.0%) |
| Construction & Extraction | 304 (98.1%) | 6 (1.9%) |
| Installation, Maintenance & Repair | 208 (87.4%) | 30 (12.6%) |
| Total (Category) | 512 (93.4%) | 36 (6.6%) |
| Total (Overall) | 5,940 (53.3%) | 5,194 (46.7%) |
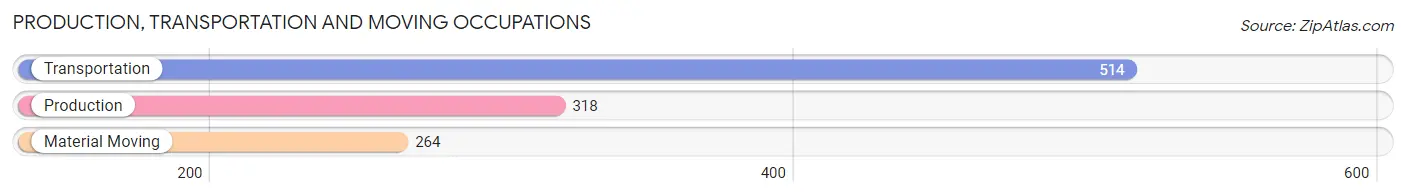
Production, Transportation and Moving Occupations
The most common Production, Transportation and Moving occupations in Mukilteo are Transportation (514 | 4.6%), Production (318 | 2.9%), and Material Moving (264 | 2.4%).
Production, Transportation and Moving Occupations by Sex
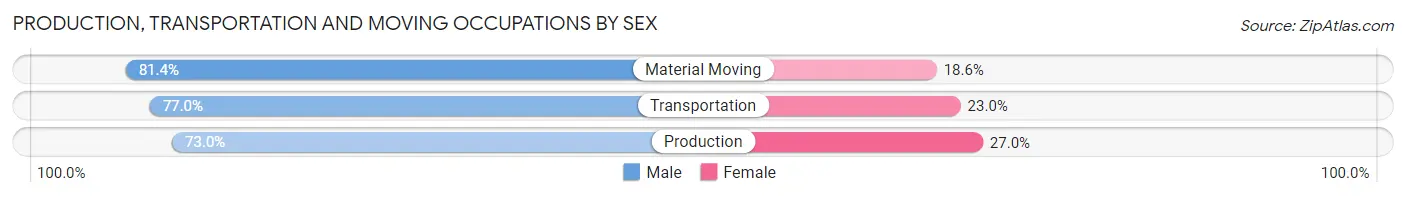
| Occupation | Male | Female |
| Production | 232 (73.0%) | 86 (27.0%) |
| Transportation | 396 (77.0%) | 118 (23.0%) |
| Material Moving | 215 (81.4%) | 49 (18.6%) |
| Total (Category) | 843 (76.9%) | 253 (23.1%) |
| Total (Overall) | 5,940 (53.3%) | 5,194 (46.7%) |
Employment Industries by Sex in Mukilteo
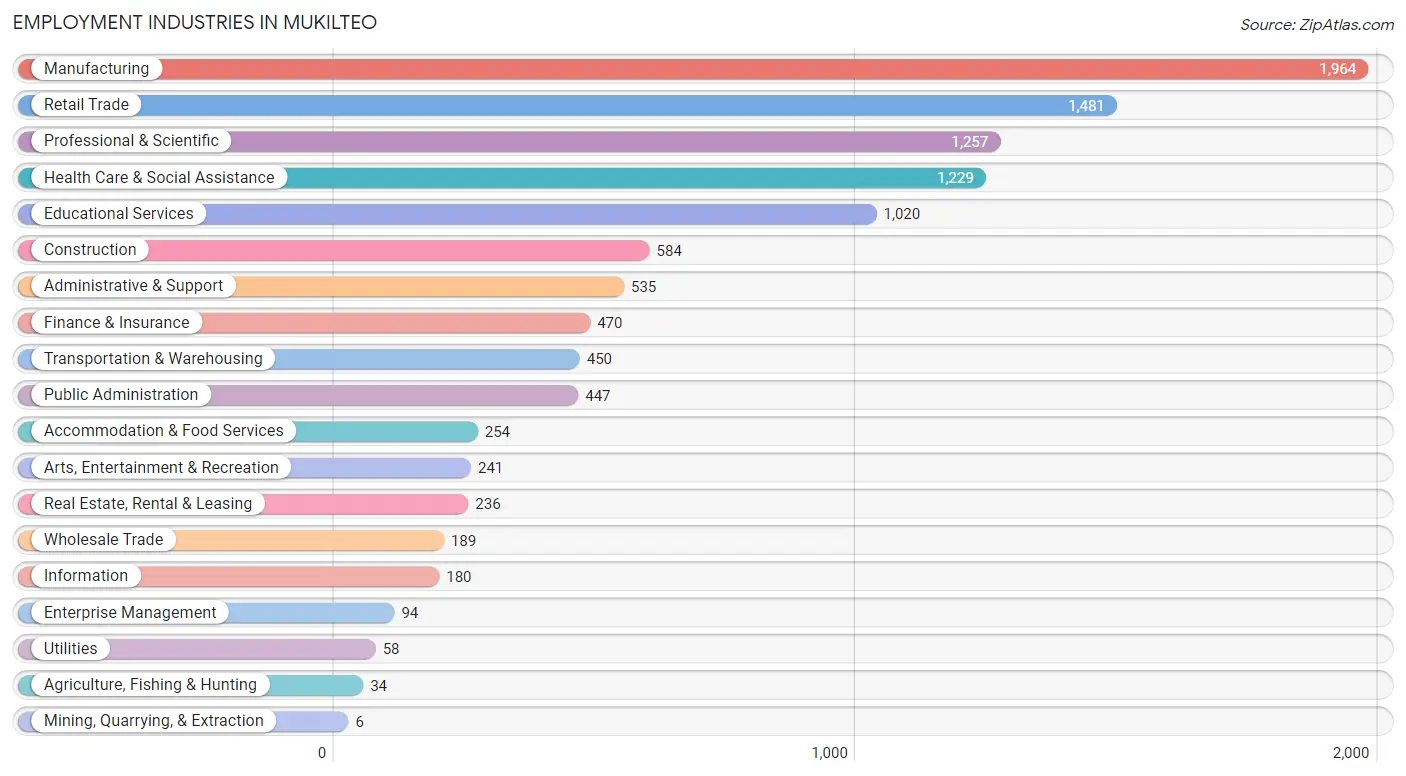
Employment Industries in Mukilteo
The major employment industries in Mukilteo include Manufacturing (1,964 | 17.6%), Retail Trade (1,481 | 13.3%), Professional & Scientific (1,257 | 11.3%), Health Care & Social Assistance (1,229 | 11.0%), and Educational Services (1,020 | 9.2%).
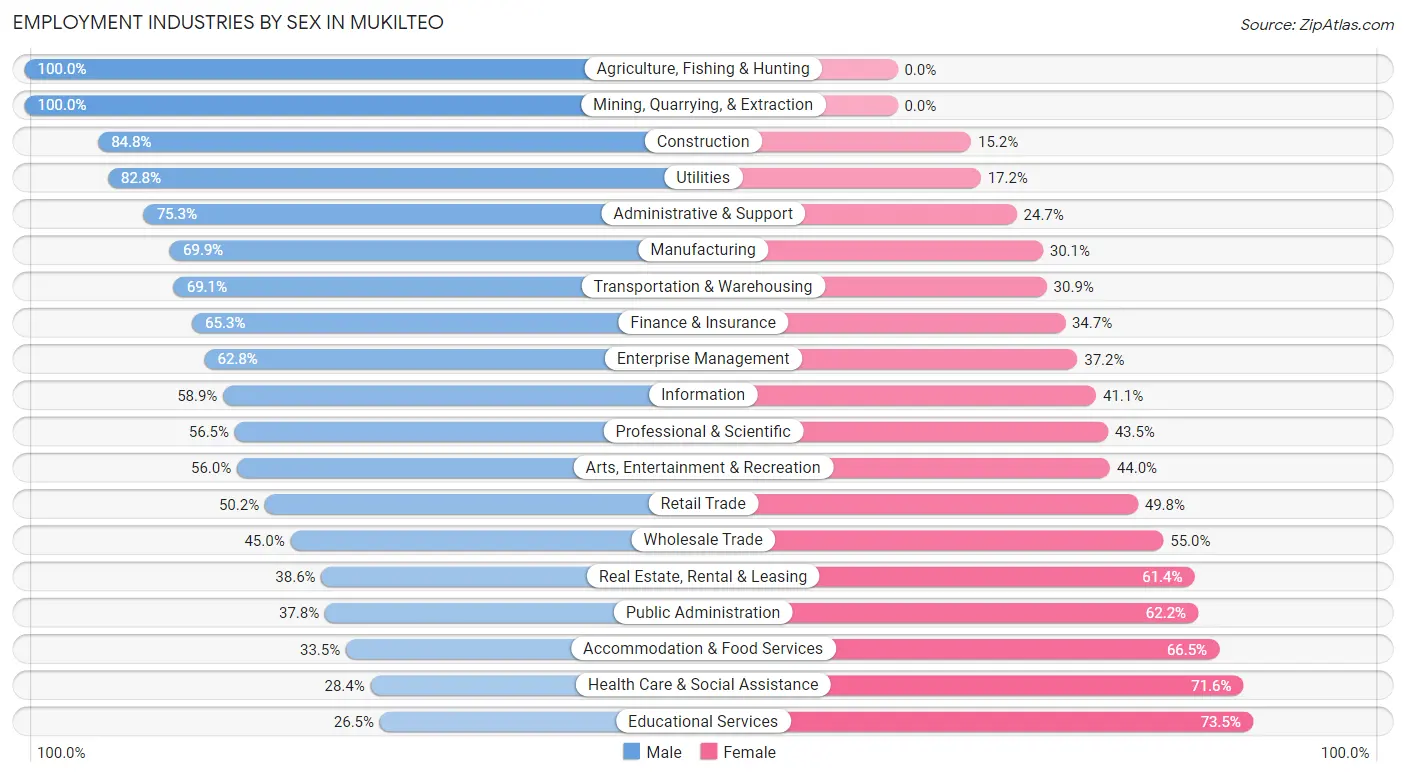
Employment Industries by Sex in Mukilteo
The Mukilteo industries that see more men than women are Agriculture, Fishing & Hunting (100.0%), Mining, Quarrying, & Extraction (100.0%), and Construction (84.8%), whereas the industries that tend to have a higher number of women are Educational Services (73.5%), Health Care & Social Assistance (71.6%), and Accommodation & Food Services (66.5%).
| Industry | Male | Female |
| Agriculture, Fishing & Hunting | 34 (100.0%) | 0 (0.0%) |
| Mining, Quarrying, & Extraction | 6 (100.0%) | 0 (0.0%) |
| Construction | 495 (84.8%) | 89 (15.2%) |
| Manufacturing | 1,373 (69.9%) | 591 (30.1%) |
| Wholesale Trade | 85 (45.0%) | 104 (55.0%) |
| Retail Trade | 744 (50.2%) | 737 (49.8%) |
| Transportation & Warehousing | 311 (69.1%) | 139 (30.9%) |
| Utilities | 48 (82.8%) | 10 (17.2%) |
| Information | 106 (58.9%) | 74 (41.1%) |
| Finance & Insurance | 307 (65.3%) | 163 (34.7%) |
| Real Estate, Rental & Leasing | 91 (38.6%) | 145 (61.4%) |
| Professional & Scientific | 710 (56.5%) | 547 (43.5%) |
| Enterprise Management | 59 (62.8%) | 35 (37.2%) |
| Administrative & Support | 403 (75.3%) | 132 (24.7%) |
| Educational Services | 270 (26.5%) | 750 (73.5%) |
| Health Care & Social Assistance | 349 (28.4%) | 880 (71.6%) |
| Arts, Entertainment & Recreation | 135 (56.0%) | 106 (44.0%) |
| Accommodation & Food Services | 85 (33.5%) | 169 (66.5%) |
| Public Administration | 169 (37.8%) | 278 (62.2%) |
| Total | 5,940 (53.3%) | 5,194 (46.7%) |
Education in Mukilteo
School Enrollment in Mukilteo
The most common levels of schooling among the 5,188 students in Mukilteo are college / undergraduate (1,224 | 23.6%), high school (1,058 | 20.4%), and elementary school (1,028 | 19.8%).
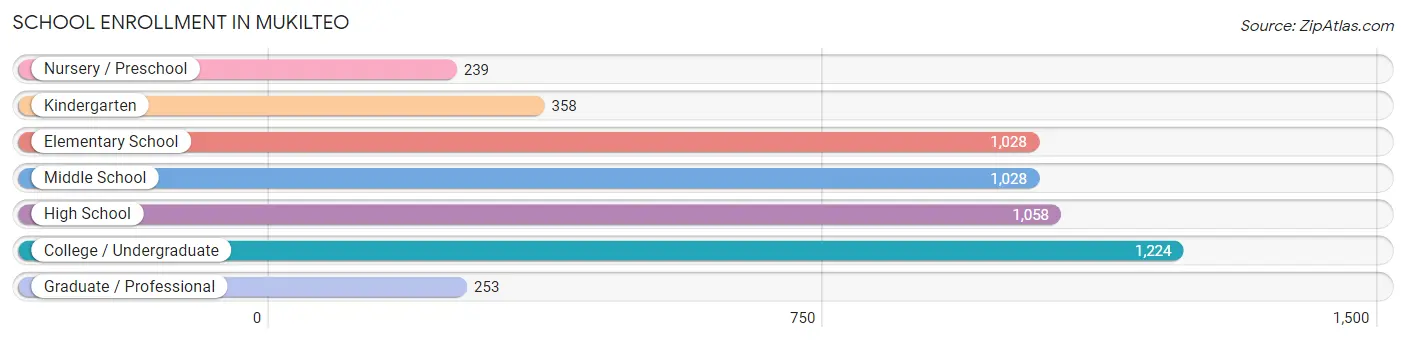
| School Level | # Students | % Students |
| Nursery / Preschool | 239 | 4.6% |
| Kindergarten | 358 | 6.9% |
| Elementary School | 1,028 | 19.8% |
| Middle School | 1,028 | 19.8% |
| High School | 1,058 | 20.4% |
| College / Undergraduate | 1,224 | 23.6% |
| Graduate / Professional | 253 | 4.9% |
| Total | 5,188 | 100.0% |
School Enrollment by Age by Funding Source in Mukilteo
Out of a total of 5,188 students who are enrolled in schools in Mukilteo, 1,069 (20.6%) attend a private institution, while the remaining 4,119 (79.4%) are enrolled in public schools. The age group of 25 to 34 year olds has the highest likelihood of being enrolled in private schools, with 184 (59.7% in the age bracket) enrolled. Conversely, the age group of 15 to 17 year olds has the lowest likelihood of being enrolled in a private school, with 770 (95.8% in the age bracket) attending a public institution.
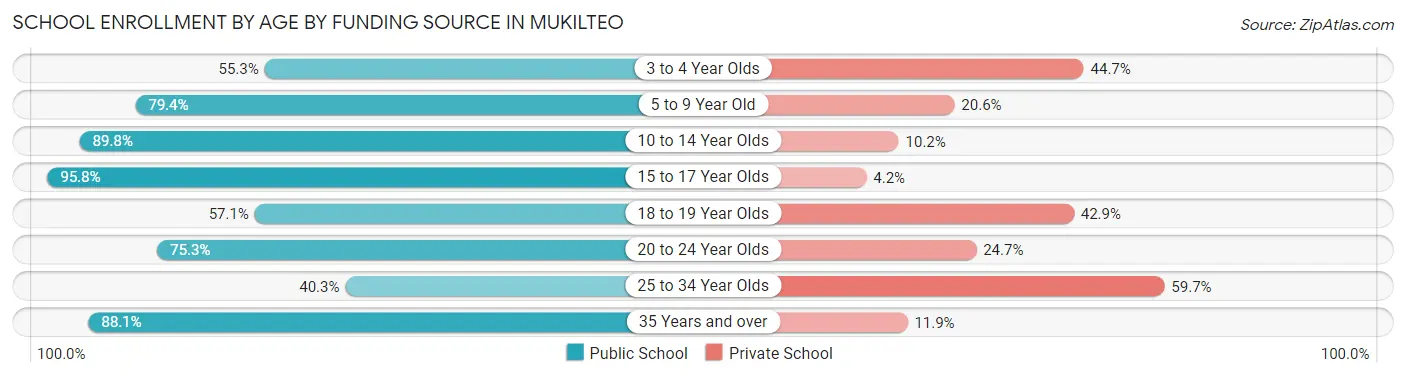
| Age Bracket | Public School | Private School |
| 3 to 4 Year Olds | 203 (55.3%) | 164 (44.7%) |
| 5 to 9 Year Old | 912 (79.4%) | 237 (20.6%) |
| 10 to 14 Year Olds | 1,193 (89.8%) | 136 (10.2%) |
| 15 to 17 Year Olds | 770 (95.8%) | 34 (4.2%) |
| 18 to 19 Year Olds | 140 (57.1%) | 105 (42.9%) |
| 20 to 24 Year Olds | 546 (75.3%) | 179 (24.7%) |
| 25 to 34 Year Olds | 124 (40.3%) | 184 (59.7%) |
| 35 Years and over | 230 (88.1%) | 31 (11.9%) |
| Total | 4,119 (79.4%) | 1,069 (20.6%) |
Educational Attainment by Field of Study in Mukilteo
Business (1,560 | 18.0%), engineering (1,380 | 15.9%), education (764 | 8.8%), social sciences (731 | 8.4%), and science & technology (661 | 7.6%) are the most common fields of study among 8,674 individuals in Mukilteo who have obtained a bachelor's degree or higher.
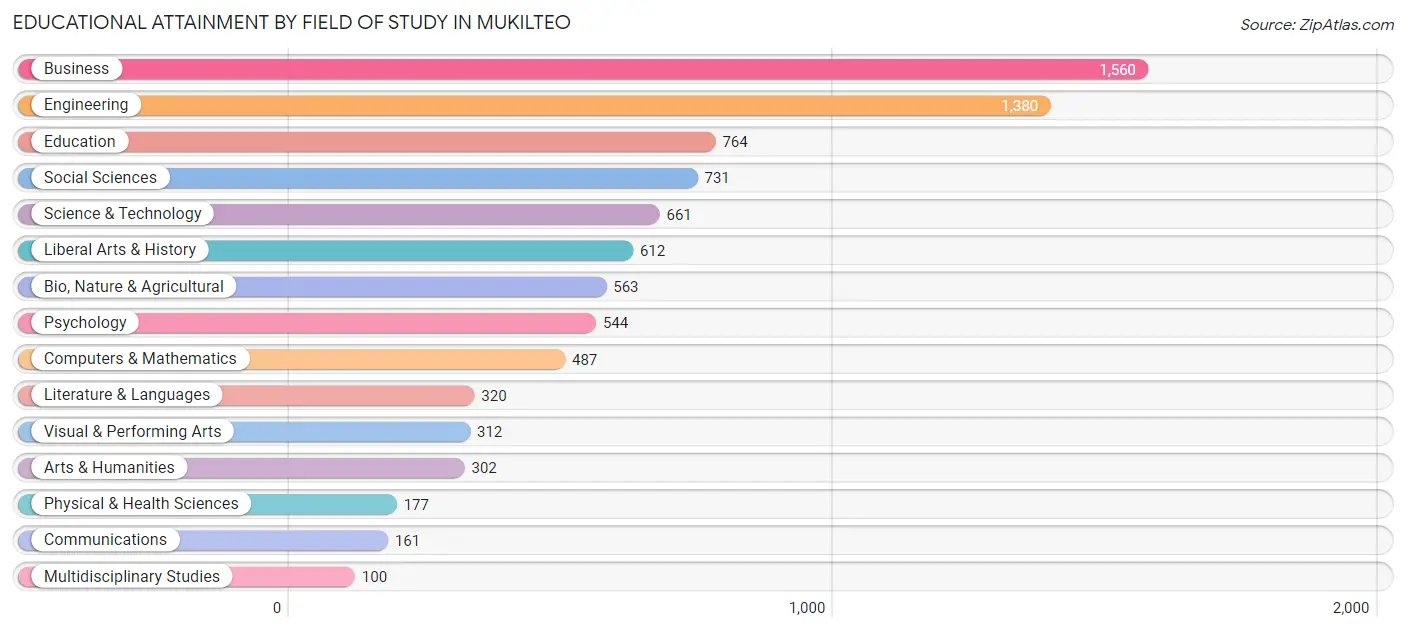
| Field of Study | # Graduates | % Graduates |
| Computers & Mathematics | 487 | 5.6% |
| Bio, Nature & Agricultural | 563 | 6.5% |
| Physical & Health Sciences | 177 | 2.0% |
| Psychology | 544 | 6.3% |
| Social Sciences | 731 | 8.4% |
| Engineering | 1,380 | 15.9% |
| Multidisciplinary Studies | 100 | 1.1% |
| Science & Technology | 661 | 7.6% |
| Business | 1,560 | 18.0% |
| Education | 764 | 8.8% |
| Literature & Languages | 320 | 3.7% |
| Liberal Arts & History | 612 | 7.1% |
| Visual & Performing Arts | 312 | 3.6% |
| Communications | 161 | 1.9% |
| Arts & Humanities | 302 | 3.5% |
| Total | 8,674 | 100.0% |
Transportation & Commute in Mukilteo
Vehicle Availability by Sex in Mukilteo
The most prevalent vehicle ownership categories in Mukilteo are males with 2 vehicles (2,849, accounting for 48.3%) and females with 2 vehicles (1,867, making up 56.5%).
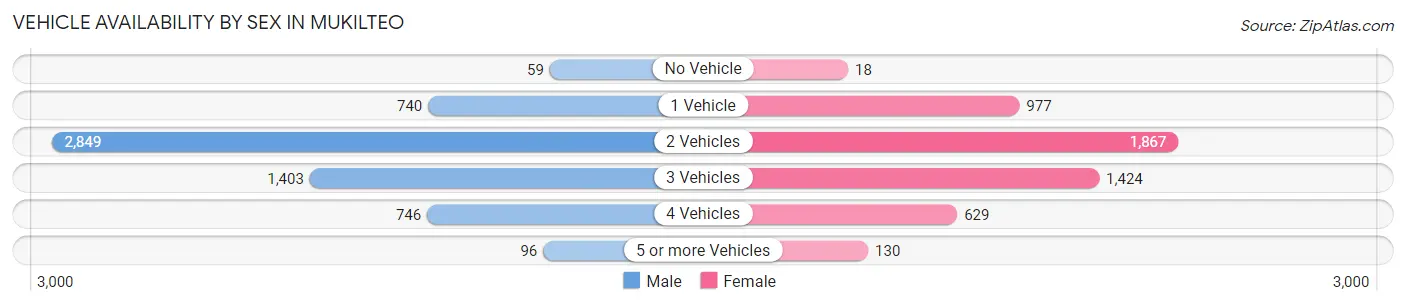
| Vehicles Available | Male | Female |
| No Vehicle | 59 (1.0%) | 18 (0.4%) |
| 1 Vehicle | 740 (12.6%) | 977 (19.4%) |
| 2 Vehicles | 2,849 (48.3%) | 1,867 (37.0%) |
| 3 Vehicles | 1,403 (23.8%) | 1,424 (28.2%) |
| 4 Vehicles | 746 (12.7%) | 629 (12.5%) |
| 5 or more Vehicles | 96 (1.6%) | 130 (2.6%) |
| Total | 5,893 (100.0%) | 5,045 (100.0%) |
Commute Time in Mukilteo
The most frequently occuring commute durations in Mukilteo are 20 to 24 minutes (1,344 commuters, 16.1%), 15 to 19 minutes (1,174 commuters, 14.1%), and 10 to 14 minutes (1,052 commuters, 12.6%).
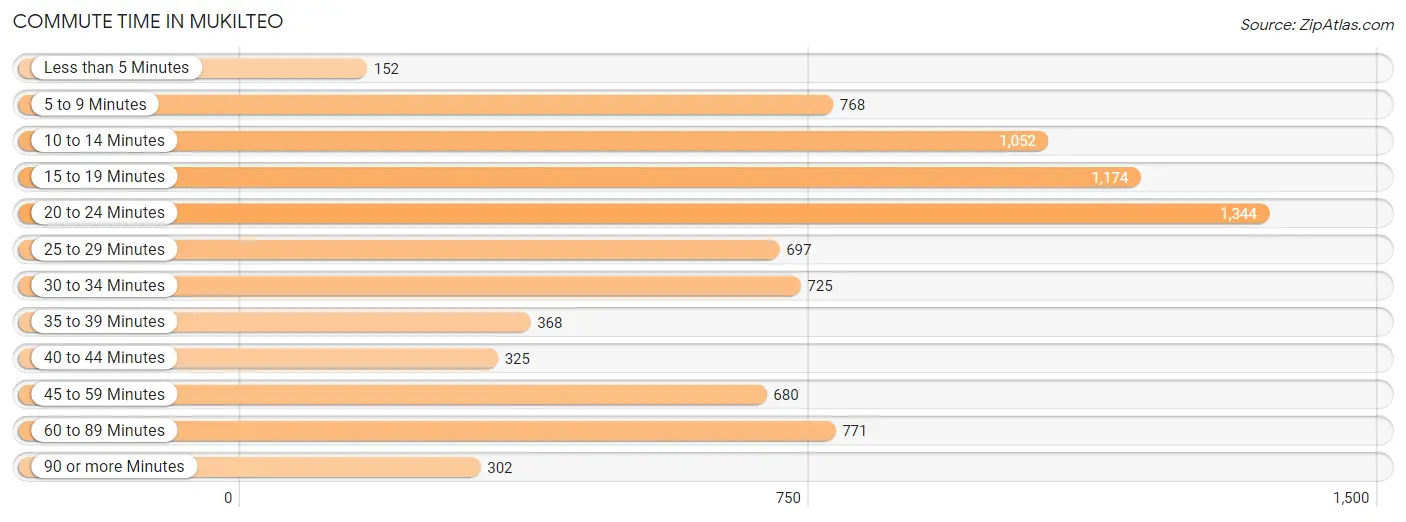
| Commute Time | # Commuters | % Commuters |
| Less than 5 Minutes | 152 | 1.8% |
| 5 to 9 Minutes | 768 | 9.2% |
| 10 to 14 Minutes | 1,052 | 12.6% |
| 15 to 19 Minutes | 1,174 | 14.1% |
| 20 to 24 Minutes | 1,344 | 16.1% |
| 25 to 29 Minutes | 697 | 8.3% |
| 30 to 34 Minutes | 725 | 8.7% |
| 35 to 39 Minutes | 368 | 4.4% |
| 40 to 44 Minutes | 325 | 3.9% |
| 45 to 59 Minutes | 680 | 8.1% |
| 60 to 89 Minutes | 771 | 9.2% |
| 90 or more Minutes | 302 | 3.6% |
Commute Time by Sex in Mukilteo
The most common commute times in Mukilteo are 15 to 19 minutes (882 commuters, 18.8%) for males and 20 to 24 minutes (661 commuters, 18.0%) for females.
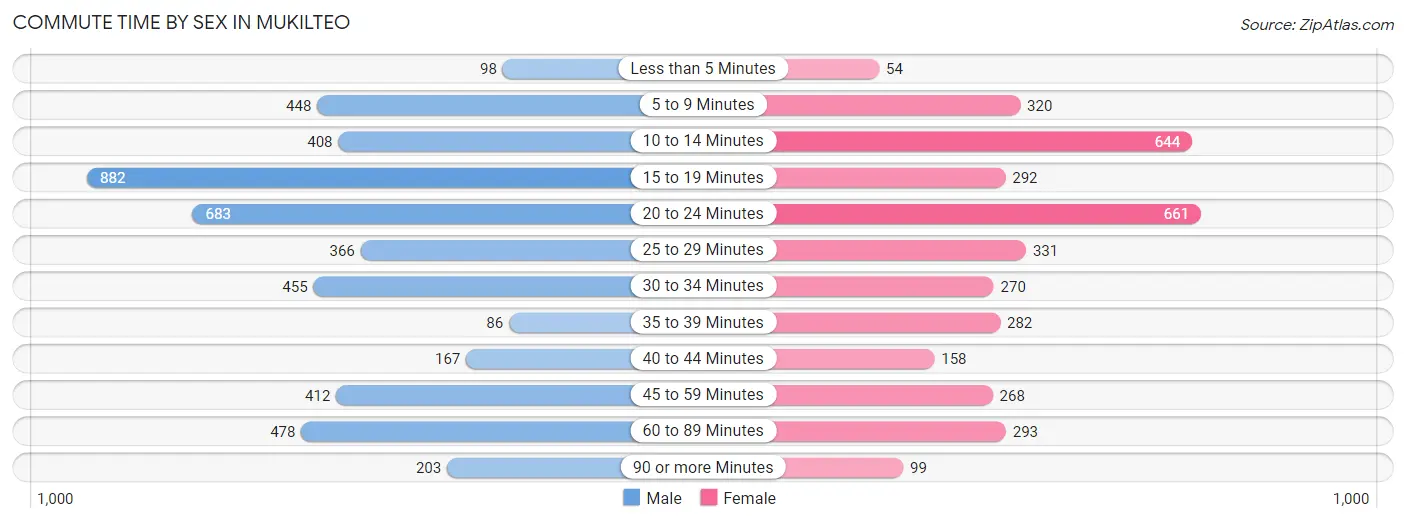
| Commute Time | Male | Female |
| Less than 5 Minutes | 98 (2.1%) | 54 (1.5%) |
| 5 to 9 Minutes | 448 (9.6%) | 320 (8.7%) |
| 10 to 14 Minutes | 408 (8.7%) | 644 (17.5%) |
| 15 to 19 Minutes | 882 (18.8%) | 292 (8.0%) |
| 20 to 24 Minutes | 683 (14.6%) | 661 (18.0%) |
| 25 to 29 Minutes | 366 (7.8%) | 331 (9.0%) |
| 30 to 34 Minutes | 455 (9.7%) | 270 (7.3%) |
| 35 to 39 Minutes | 86 (1.8%) | 282 (7.7%) |
| 40 to 44 Minutes | 167 (3.6%) | 158 (4.3%) |
| 45 to 59 Minutes | 412 (8.8%) | 268 (7.3%) |
| 60 to 89 Minutes | 478 (10.2%) | 293 (8.0%) |
| 90 or more Minutes | 203 (4.3%) | 99 (2.7%) |
Time of Departure to Work by Sex in Mukilteo
The most frequent times of departure to work in Mukilteo are 6:30 AM to 6:59 AM (737, 15.7%) for males and 6:30 AM to 6:59 AM (497, 13.5%) for females.
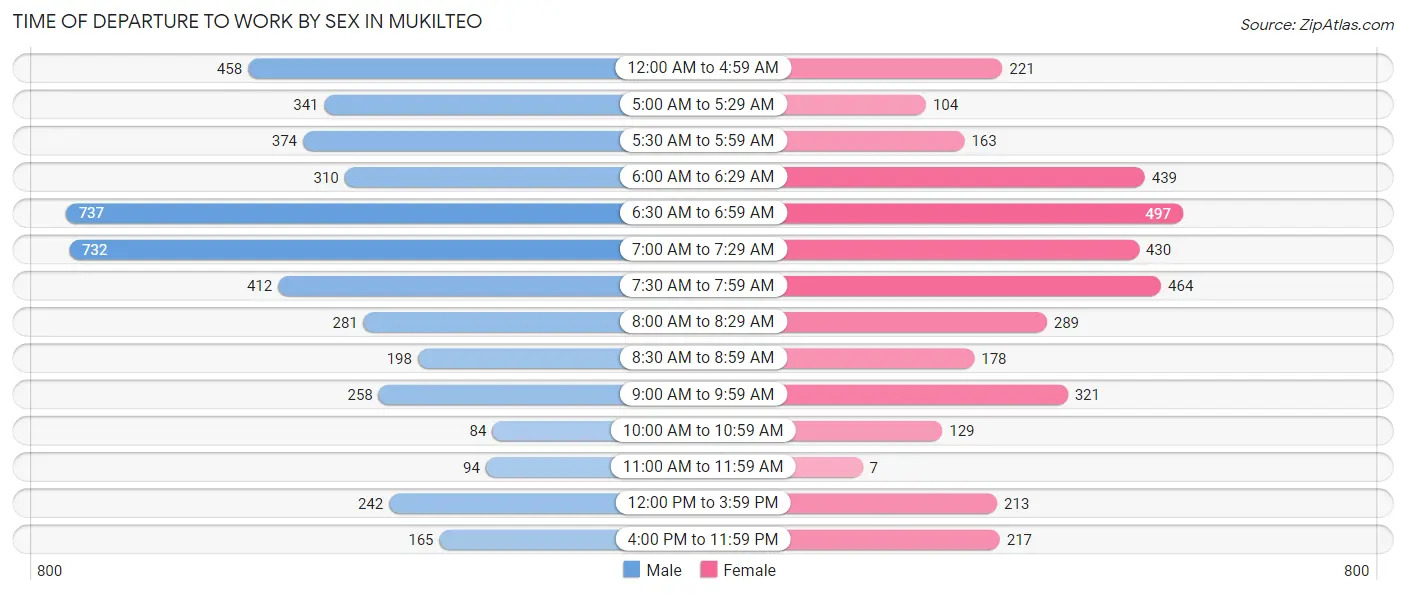
| Time of Departure | Male | Female |
| 12:00 AM to 4:59 AM | 458 (9.8%) | 221 (6.0%) |
| 5:00 AM to 5:29 AM | 341 (7.3%) | 104 (2.8%) |
| 5:30 AM to 5:59 AM | 374 (8.0%) | 163 (4.4%) |
| 6:00 AM to 6:29 AM | 310 (6.6%) | 439 (12.0%) |
| 6:30 AM to 6:59 AM | 737 (15.7%) | 497 (13.5%) |
| 7:00 AM to 7:29 AM | 732 (15.6%) | 430 (11.7%) |
| 7:30 AM to 7:59 AM | 412 (8.8%) | 464 (12.6%) |
| 8:00 AM to 8:29 AM | 281 (6.0%) | 289 (7.9%) |
| 8:30 AM to 8:59 AM | 198 (4.2%) | 178 (4.9%) |
| 9:00 AM to 9:59 AM | 258 (5.5%) | 321 (8.7%) |
| 10:00 AM to 10:59 AM | 84 (1.8%) | 129 (3.5%) |
| 11:00 AM to 11:59 AM | 94 (2.0%) | 7 (0.2%) |
| 12:00 PM to 3:59 PM | 242 (5.2%) | 213 (5.8%) |
| 4:00 PM to 11:59 PM | 165 (3.5%) | 217 (5.9%) |
| Total | 4,686 (100.0%) | 3,672 (100.0%) |
Housing Occupancy in Mukilteo
Occupancy by Ownership in Mukilteo
Of the total 8,253 dwellings in Mukilteo, owner-occupied units account for 5,761 (69.8%), while renter-occupied units make up 2,492 (30.2%).
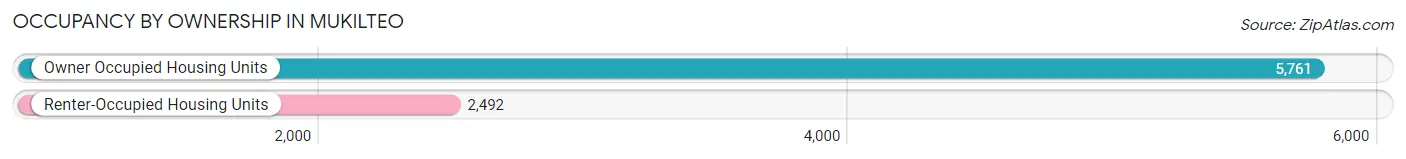
| Occupancy | # Housing Units | % Housing Units |
| Owner Occupied Housing Units | 5,761 | 69.8% |
| Renter-Occupied Housing Units | 2,492 | 30.2% |
| Total Occupied Housing Units | 8,253 | 100.0% |
Occupancy by Household Size in Mukilteo
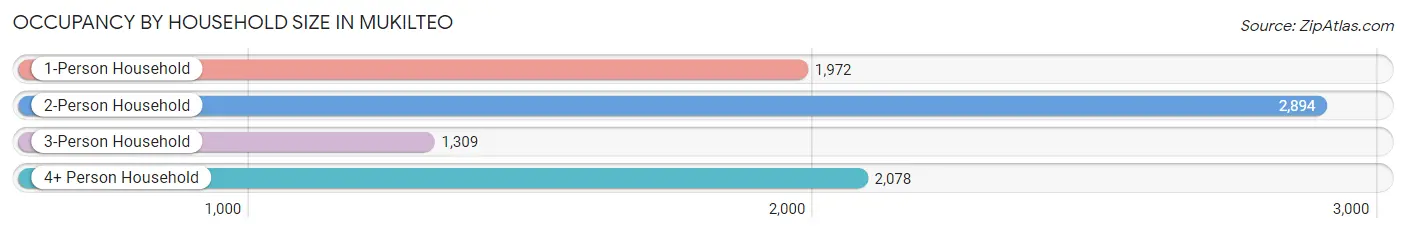
| Household Size | # Housing Units | % Housing Units |
| 1-Person Household | 1,972 | 23.9% |
| 2-Person Household | 2,894 | 35.1% |
| 3-Person Household | 1,309 | 15.9% |
| 4+ Person Household | 2,078 | 25.2% |
| Total Housing Units | 8,253 | 100.0% |
Occupancy by Ownership by Household Size in Mukilteo
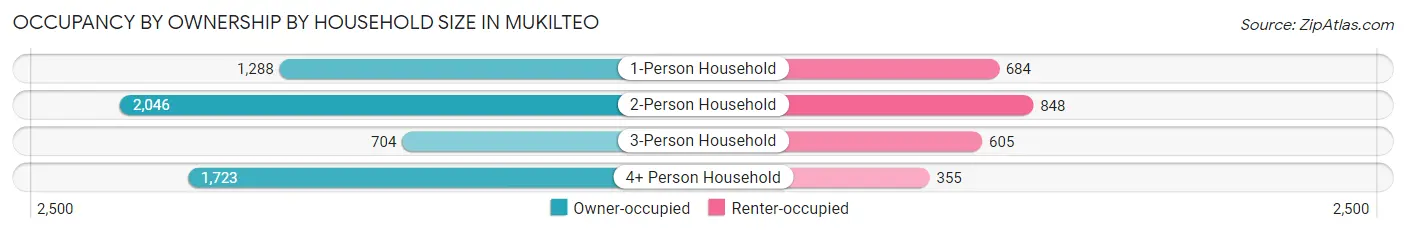
| Household Size | Owner-occupied | Renter-occupied |
| 1-Person Household | 1,288 (65.3%) | 684 (34.7%) |
| 2-Person Household | 2,046 (70.7%) | 848 (29.3%) |
| 3-Person Household | 704 (53.8%) | 605 (46.2%) |
| 4+ Person Household | 1,723 (82.9%) | 355 (17.1%) |
| Total Housing Units | 5,761 (69.8%) | 2,492 (30.2%) |
Occupancy by Educational Attainment in Mukilteo
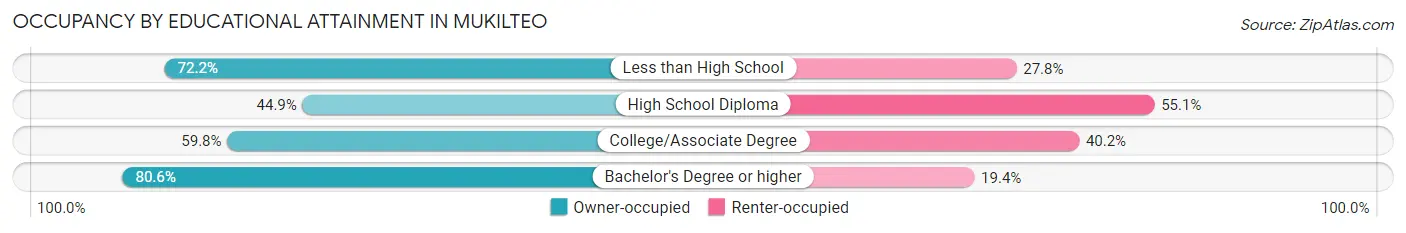
| Household Size | Owner-occupied | Renter-occupied |
| Less than High School | 104 (72.2%) | 40 (27.8%) |
| High School Diploma | 465 (44.9%) | 571 (55.1%) |
| College/Associate Degree | 1,459 (59.8%) | 981 (40.2%) |
| Bachelor's Degree or higher | 3,733 (80.6%) | 900 (19.4%) |
Occupancy by Age of Householder in Mukilteo
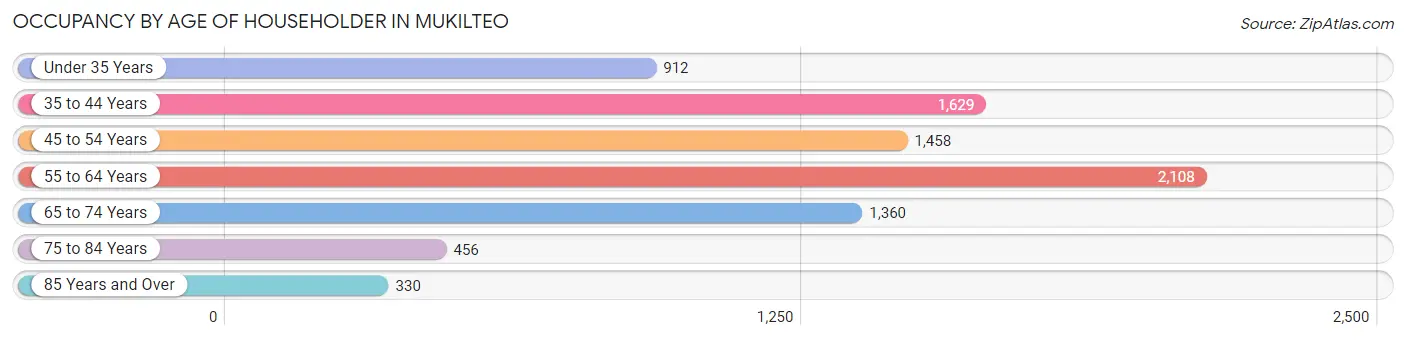
| Age Bracket | # Households | % Households |
| Under 35 Years | 912 | 11.1% |
| 35 to 44 Years | 1,629 | 19.7% |
| 45 to 54 Years | 1,458 | 17.7% |
| 55 to 64 Years | 2,108 | 25.5% |
| 65 to 74 Years | 1,360 | 16.5% |
| 75 to 84 Years | 456 | 5.5% |
| 85 Years and Over | 330 | 4.0% |
| Total | 8,253 | 100.0% |
Housing Finances in Mukilteo
Median Income by Occupancy in Mukilteo
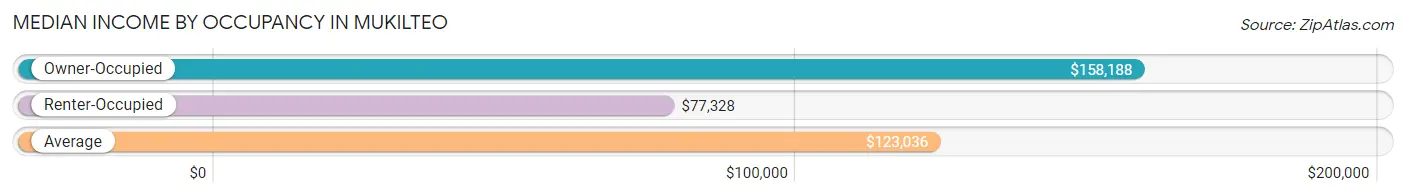
| Occupancy Type | # Households | Median Income |
| Owner-Occupied | 5,761 (69.8%) | $158,188 |
| Renter-Occupied | 2,492 (30.2%) | $77,328 |
| Average | 8,253 (100.0%) | $123,036 |
Occupancy by Householder Income Bracket in Mukilteo
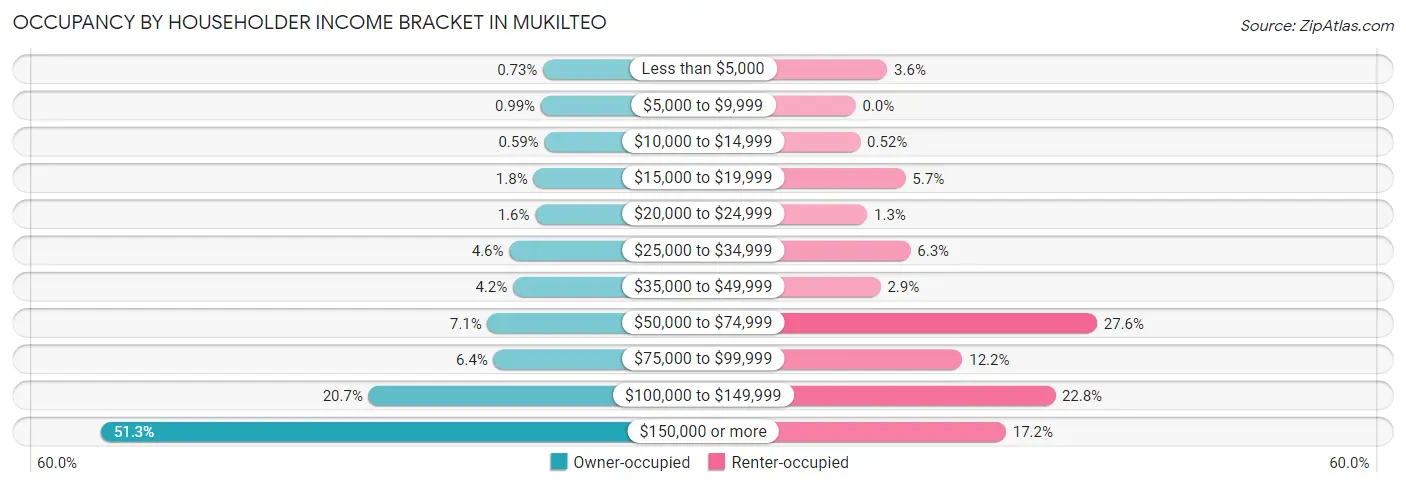
| Income Bracket | Owner-occupied | Renter-occupied |
| Less than $5,000 | 42 (0.7%) | 90 (3.6%) |
| $5,000 to $9,999 | 57 (1.0%) | 0 (0.0%) |
| $10,000 to $14,999 | 34 (0.6%) | 13 (0.5%) |
| $15,000 to $19,999 | 106 (1.8%) | 142 (5.7%) |
| $20,000 to $24,999 | 94 (1.6%) | 33 (1.3%) |
| $25,000 to $34,999 | 265 (4.6%) | 156 (6.3%) |
| $35,000 to $49,999 | 241 (4.2%) | 71 (2.9%) |
| $50,000 to $74,999 | 409 (7.1%) | 687 (27.6%) |
| $75,000 to $99,999 | 368 (6.4%) | 304 (12.2%) |
| $100,000 to $149,999 | 1,191 (20.7%) | 568 (22.8%) |
| $150,000 or more | 2,954 (51.3%) | 428 (17.2%) |
| Total | 5,761 (100.0%) | 2,492 (100.0%) |
Monthly Housing Cost Tiers in Mukilteo
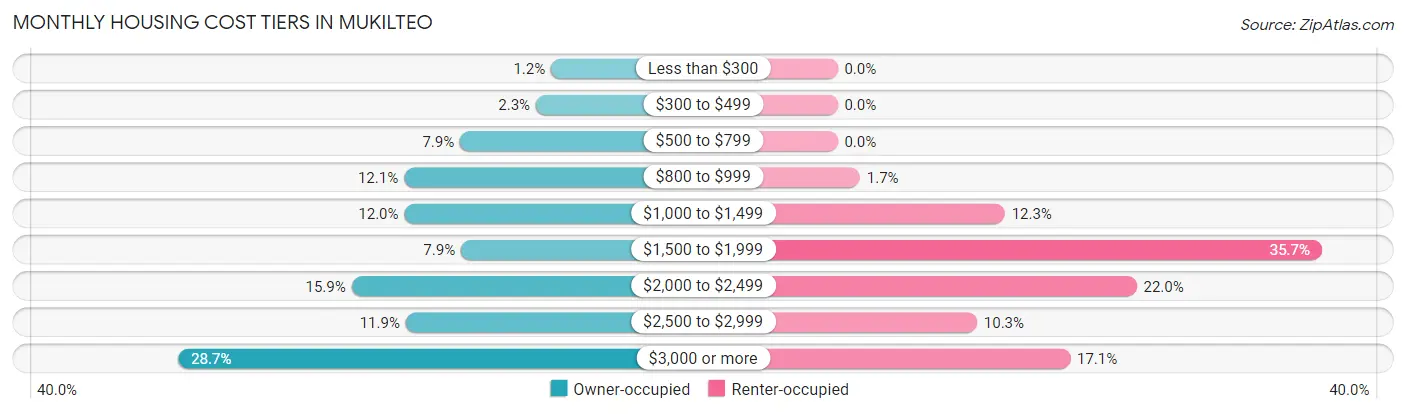
| Monthly Cost | Owner-occupied | Renter-occupied |
| Less than $300 | 71 (1.2%) | 0 (0.0%) |
| $300 to $499 | 135 (2.3%) | 0 (0.0%) |
| $500 to $799 | 457 (7.9%) | 0 (0.0%) |
| $800 to $999 | 695 (12.1%) | 41 (1.7%) |
| $1,000 to $1,499 | 693 (12.0%) | 307 (12.3%) |
| $1,500 to $1,999 | 453 (7.9%) | 889 (35.7%) |
| $2,000 to $2,499 | 917 (15.9%) | 549 (22.0%) |
| $2,500 to $2,999 | 687 (11.9%) | 256 (10.3%) |
| $3,000 or more | 1,653 (28.7%) | 427 (17.1%) |
| Total | 5,761 (100.0%) | 2,492 (100.0%) |
Physical Housing Characteristics in Mukilteo
Housing Structures in Mukilteo
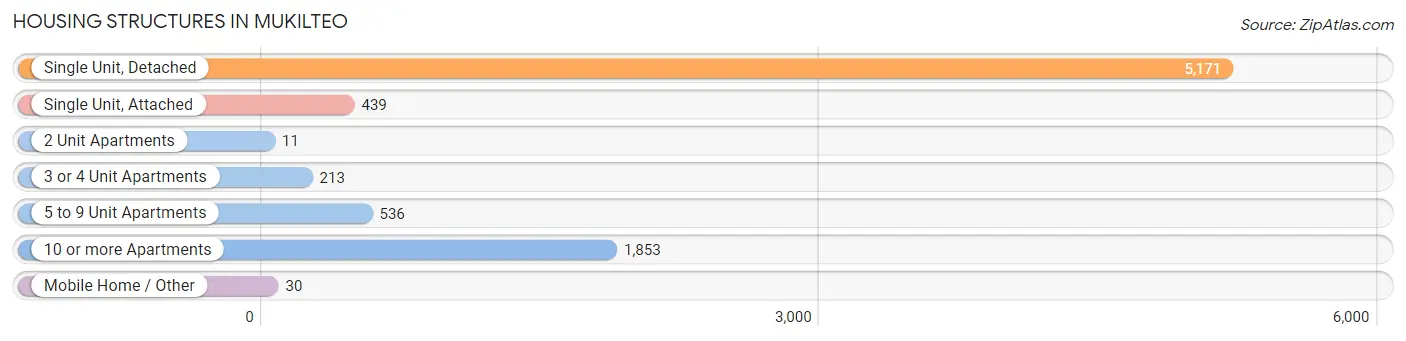
| Structure Type | # Housing Units | % Housing Units |
| Single Unit, Detached | 5,171 | 62.7% |
| Single Unit, Attached | 439 | 5.3% |
| 2 Unit Apartments | 11 | 0.1% |
| 3 or 4 Unit Apartments | 213 | 2.6% |
| 5 to 9 Unit Apartments | 536 | 6.5% |
| 10 or more Apartments | 1,853 | 22.5% |
| Mobile Home / Other | 30 | 0.4% |
| Total | 8,253 | 100.0% |
Housing Structures by Occupancy in Mukilteo
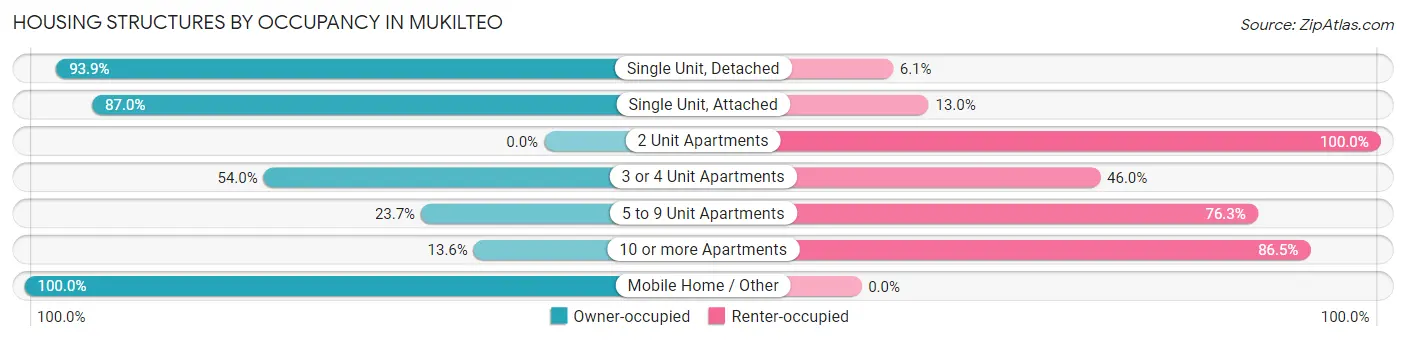
| Structure Type | Owner-occupied | Renter-occupied |
| Single Unit, Detached | 4,856 (93.9%) | 315 (6.1%) |
| Single Unit, Attached | 382 (87.0%) | 57 (13.0%) |
| 2 Unit Apartments | 0 (0.0%) | 11 (100.0%) |
| 3 or 4 Unit Apartments | 115 (54.0%) | 98 (46.0%) |
| 5 to 9 Unit Apartments | 127 (23.7%) | 409 (76.3%) |
| 10 or more Apartments | 251 (13.6%) | 1,602 (86.5%) |
| Mobile Home / Other | 30 (100.0%) | 0 (0.0%) |
| Total | 5,761 (69.8%) | 2,492 (30.2%) |
Housing Structures by Number of Rooms in Mukilteo
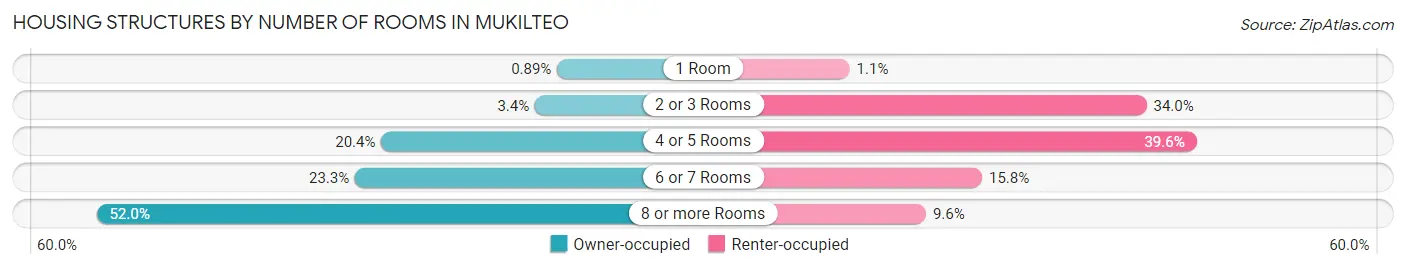
| Number of Rooms | Owner-occupied | Renter-occupied |
| 1 Room | 51 (0.9%) | 27 (1.1%) |
| 2 or 3 Rooms | 193 (3.4%) | 848 (34.0%) |
| 4 or 5 Rooms | 1,176 (20.4%) | 986 (39.6%) |
| 6 or 7 Rooms | 1,344 (23.3%) | 393 (15.8%) |
| 8 or more Rooms | 2,997 (52.0%) | 238 (9.6%) |
| Total | 5,761 (100.0%) | 2,492 (100.0%) |
Housing Structure by Heating Type in Mukilteo
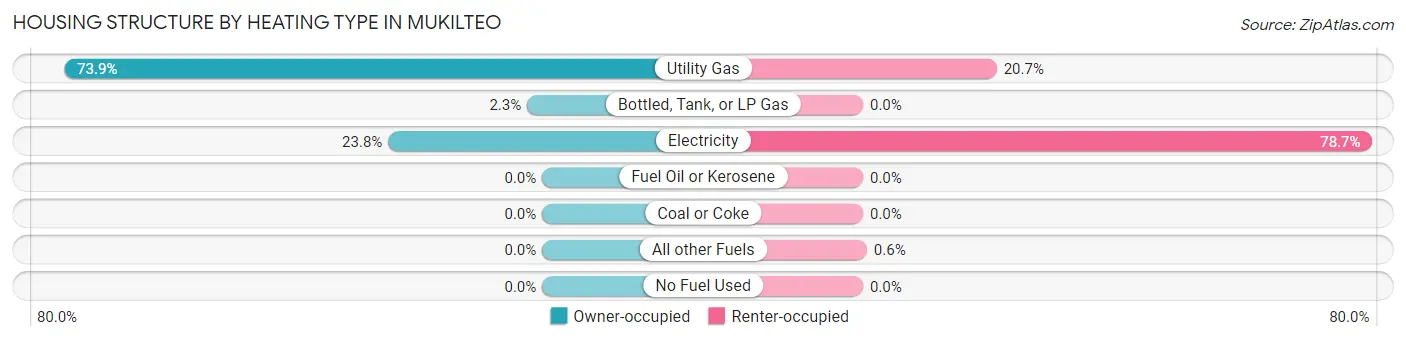
| Heating Type | Owner-occupied | Renter-occupied |
| Utility Gas | 4,256 (73.9%) | 515 (20.7%) |
| Bottled, Tank, or LP Gas | 134 (2.3%) | 0 (0.0%) |
| Electricity | 1,371 (23.8%) | 1,962 (78.7%) |
| Fuel Oil or Kerosene | 0 (0.0%) | 0 (0.0%) |
| Coal or Coke | 0 (0.0%) | 0 (0.0%) |
| All other Fuels | 0 (0.0%) | 15 (0.6%) |
| No Fuel Used | 0 (0.0%) | 0 (0.0%) |
| Total | 5,761 (100.0%) | 2,492 (100.0%) |
Household Vehicle Usage in Mukilteo
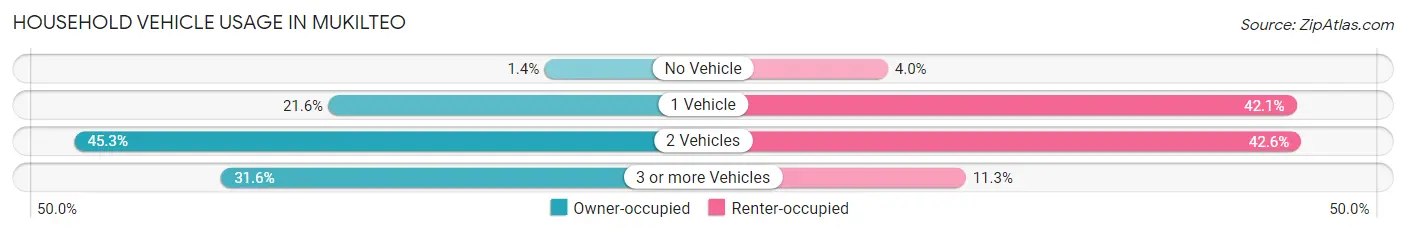
| Vehicles per Household | Owner-occupied | Renter-occupied |
| No Vehicle | 82 (1.4%) | 100 (4.0%) |
| 1 Vehicle | 1,244 (21.6%) | 1,050 (42.1%) |
| 2 Vehicles | 2,612 (45.3%) | 1,061 (42.6%) |
| 3 or more Vehicles | 1,823 (31.6%) | 281 (11.3%) |
| Total | 5,761 (100.0%) | 2,492 (100.0%) |
Real Estate & Mortgages in Mukilteo
Real Estate and Mortgage Overview in Mukilteo
| Characteristic | Without Mortgage | With Mortgage |
| Housing Units | 1,802 | 3,959 |
| Median Property Value | $770,400 | $757,000 |
| Median Household Income | $111,646 | $2,287 |
| Monthly Housing Costs | $889 | $1,653 |
| Real Estate Taxes | $5,639 | $27 |
Property Value by Mortgage Status in Mukilteo
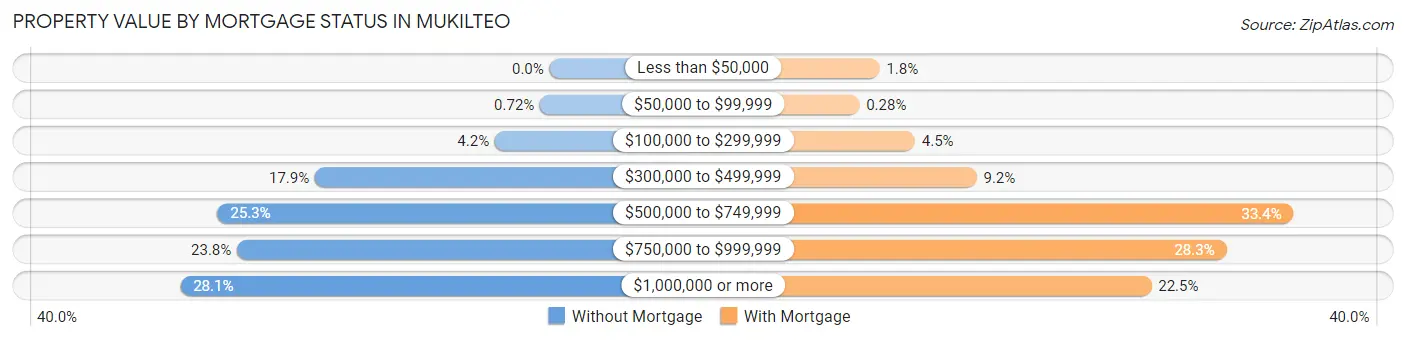
| Property Value | Without Mortgage | With Mortgage |
| Less than $50,000 | 0 (0.0%) | 72 (1.8%) |
| $50,000 to $99,999 | 13 (0.7%) | 11 (0.3%) |
| $100,000 to $299,999 | 75 (4.2%) | 179 (4.5%) |
| $300,000 to $499,999 | 322 (17.9%) | 365 (9.2%) |
| $500,000 to $749,999 | 456 (25.3%) | 1,321 (33.4%) |
| $750,000 to $999,999 | 429 (23.8%) | 1,119 (28.3%) |
| $1,000,000 or more | 507 (28.1%) | 892 (22.5%) |
| Total | 1,802 (100.0%) | 3,959 (100.0%) |
Household Income by Mortgage Status in Mukilteo
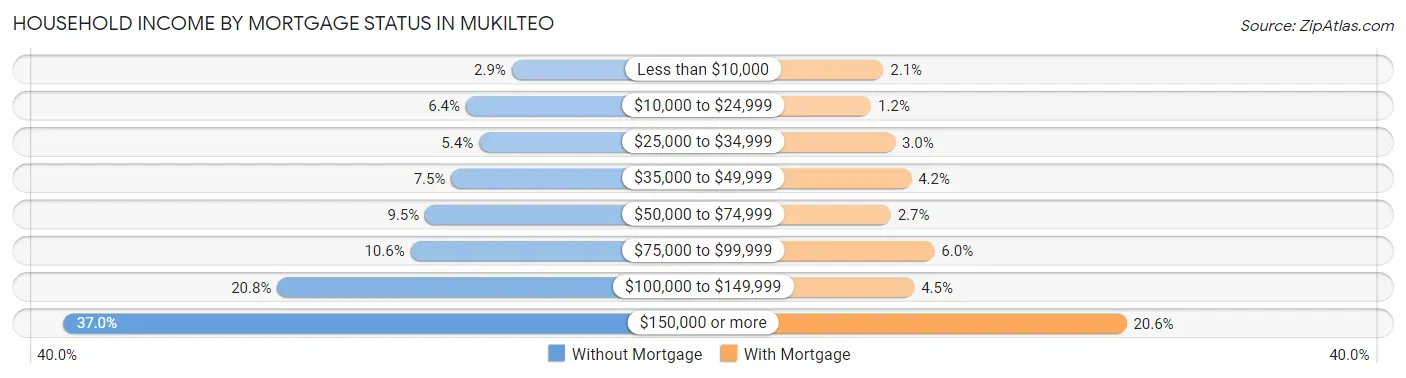
| Household Income | Without Mortgage | With Mortgage |
| Less than $10,000 | 52 (2.9%) | 84 (2.1%) |
| $10,000 to $24,999 | 115 (6.4%) | 47 (1.2%) |
| $25,000 to $34,999 | 97 (5.4%) | 119 (3.0%) |
| $35,000 to $49,999 | 135 (7.5%) | 168 (4.2%) |
| $50,000 to $74,999 | 171 (9.5%) | 106 (2.7%) |
| $75,000 to $99,999 | 191 (10.6%) | 238 (6.0%) |
| $100,000 to $149,999 | 374 (20.7%) | 177 (4.5%) |
| $150,000 or more | 667 (37.0%) | 817 (20.6%) |
| Total | 1,802 (100.0%) | 3,959 (100.0%) |
Property Value to Household Income Ratio in Mukilteo

| Value-to-Income Ratio | Without Mortgage | With Mortgage |
| Less than 2.0x | 79 (4.4%) | 188,688 (4,766.0%) |
| 2.0x to 2.9x | 184 (10.2%) | 294 (7.4%) |
| 3.0x to 3.9x | 270 (15.0%) | 901 (22.8%) |
| 4.0x or more | 1,253 (69.5%) | 710 (17.9%) |
| Total | 1,802 (100.0%) | 3,959 (100.0%) |
Real Estate Taxes by Mortgage Status in Mukilteo
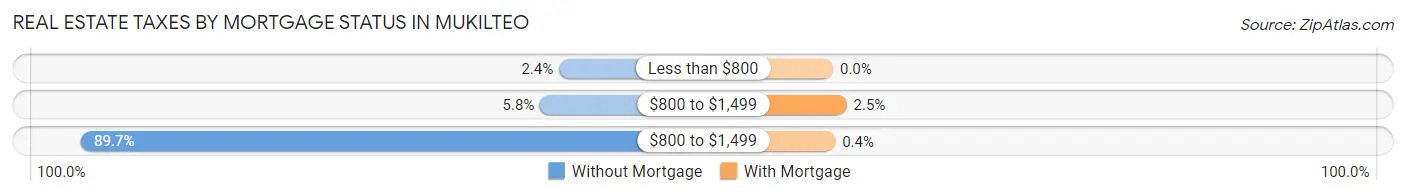
| Property Taxes | Without Mortgage | With Mortgage |
| Less than $800 | 43 (2.4%) | 0 (0.0%) |
| $800 to $1,499 | 105 (5.8%) | 98 (2.5%) |
| $800 to $1,499 | 1,616 (89.7%) | 16 (0.4%) |
| Total | 1,802 (100.0%) | 3,959 (100.0%) |
Health & Disability in Mukilteo
Health Insurance Coverage by Age in Mukilteo
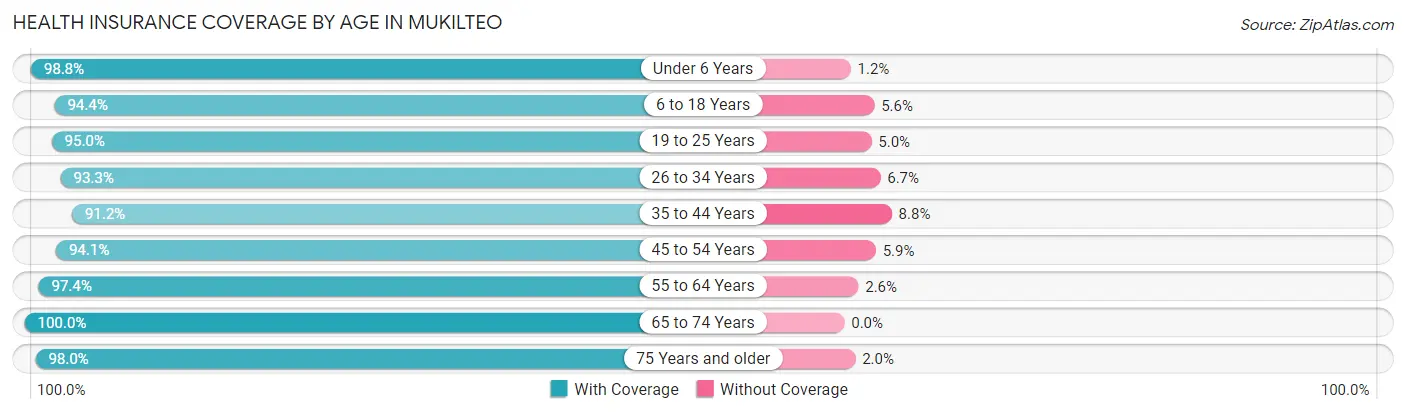
| Age Bracket | With Coverage | Without Coverage |
| Under 6 Years | 1,344 (98.8%) | 16 (1.2%) |
| 6 to 18 Years | 3,230 (94.4%) | 191 (5.6%) |
| 19 to 25 Years | 1,676 (95.0%) | 89 (5.0%) |
| 26 to 34 Years | 1,431 (93.3%) | 103 (6.7%) |
| 35 to 44 Years | 2,881 (91.2%) | 279 (8.8%) |
| 45 to 54 Years | 2,637 (94.1%) | 164 (5.9%) |
| 55 to 64 Years | 3,509 (97.4%) | 94 (2.6%) |
| 65 to 74 Years | 2,338 (100.0%) | 0 (0.0%) |
| 75 Years and older | 1,300 (98.0%) | 27 (2.0%) |
| Total | 20,346 (95.5%) | 963 (4.5%) |
Health Insurance Coverage by Citizenship Status in Mukilteo
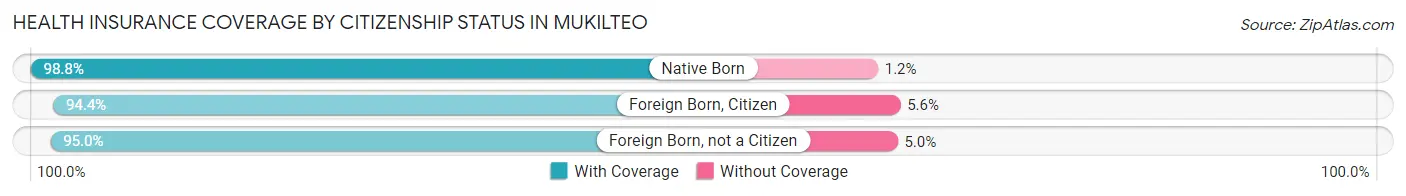
| Citizenship Status | With Coverage | Without Coverage |
| Native Born | 1,344 (98.8%) | 16 (1.2%) |
| Foreign Born, Citizen | 3,230 (94.4%) | 191 (5.6%) |
| Foreign Born, not a Citizen | 1,676 (95.0%) | 89 (5.0%) |
Health Insurance Coverage by Household Income in Mukilteo
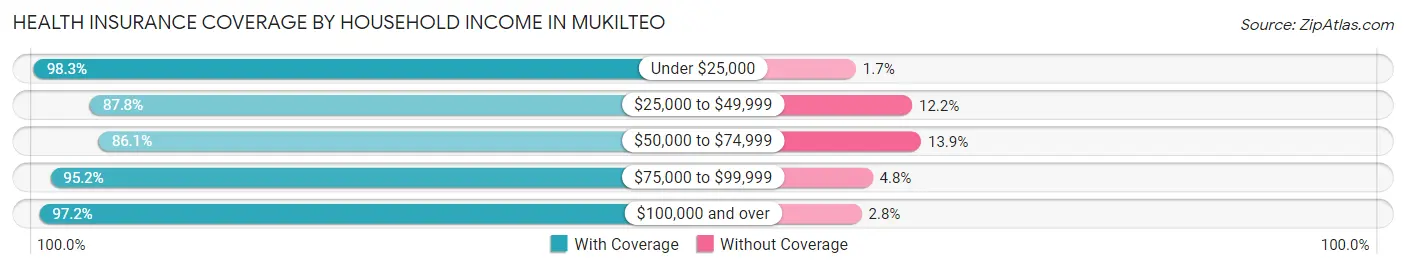
| Household Income | With Coverage | Without Coverage |
| Under $25,000 | 1,207 (98.3%) | 21 (1.7%) |
| $25,000 to $49,999 | 1,134 (87.8%) | 158 (12.2%) |
| $50,000 to $74,999 | 1,838 (86.1%) | 297 (13.9%) |
| $75,000 to $99,999 | 1,142 (95.2%) | 58 (4.8%) |
| $100,000 and over | 15,002 (97.2%) | 429 (2.8%) |
Public vs Private Health Insurance Coverage by Age in Mukilteo
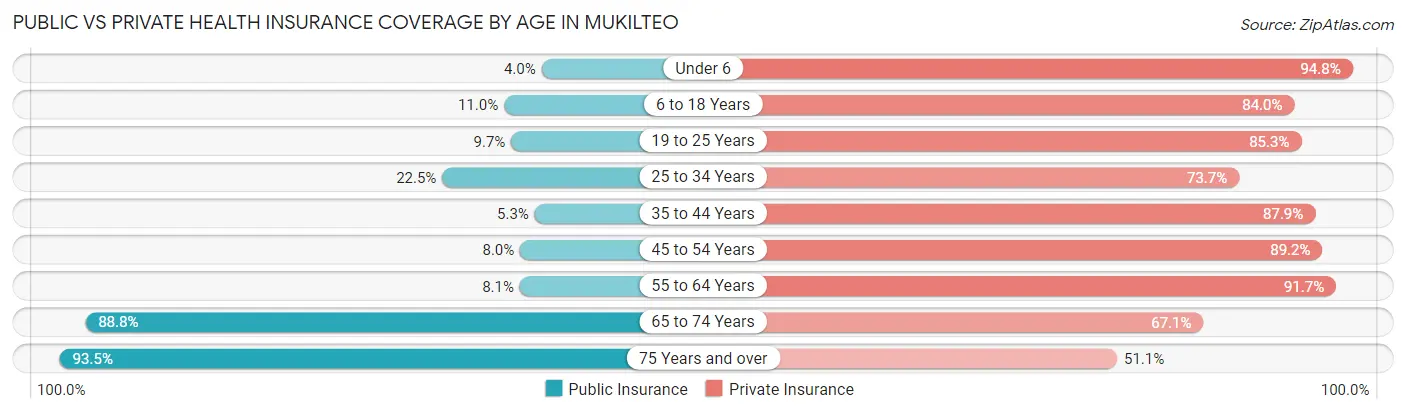
| Age Bracket | Public Insurance | Private Insurance |
| Under 6 | 55 (4.0%) | 1,289 (94.8%) |
| 6 to 18 Years | 377 (11.0%) | 2,873 (84.0%) |
| 19 to 25 Years | 171 (9.7%) | 1,505 (85.3%) |
| 25 to 34 Years | 345 (22.5%) | 1,131 (73.7%) |
| 35 to 44 Years | 168 (5.3%) | 2,776 (87.8%) |
| 45 to 54 Years | 225 (8.0%) | 2,498 (89.2%) |
| 55 to 64 Years | 291 (8.1%) | 3,305 (91.7%) |
| 65 to 74 Years | 2,075 (88.7%) | 1,569 (67.1%) |
| 75 Years and over | 1,241 (93.5%) | 678 (51.1%) |
| Total | 4,948 (23.2%) | 17,624 (82.7%) |
Disability Status by Sex by Age in Mukilteo
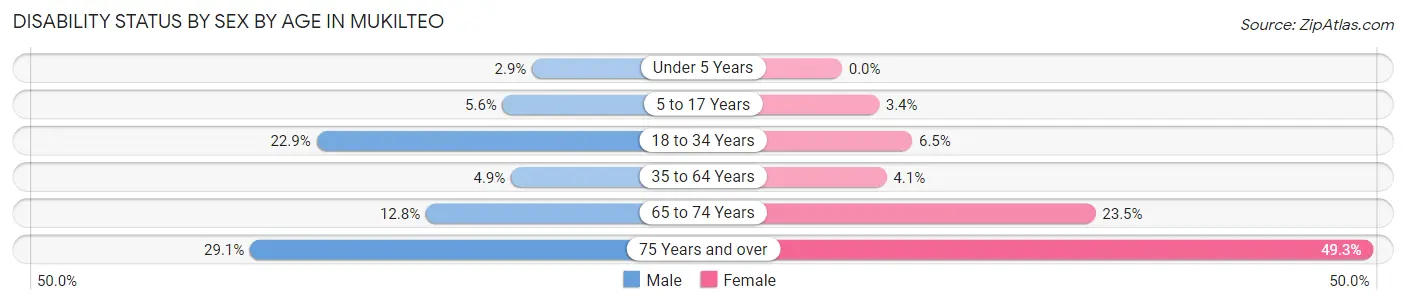
| Age Bracket | Male | Female |
| Under 5 Years | 23 (2.9%) | 0 (0.0%) |
| 5 to 17 Years | 88 (5.6%) | 62 (3.4%) |
| 18 to 34 Years | 425 (22.9%) | 103 (6.5%) |
| 35 to 64 Years | 227 (4.9%) | 202 (4.1%) |
| 65 to 74 Years | 122 (12.8%) | 325 (23.5%) |
| 75 Years and over | 216 (29.1%) | 288 (49.3%) |
Disability Class by Sex by Age in Mukilteo
Disability Class: Hearing Difficulty
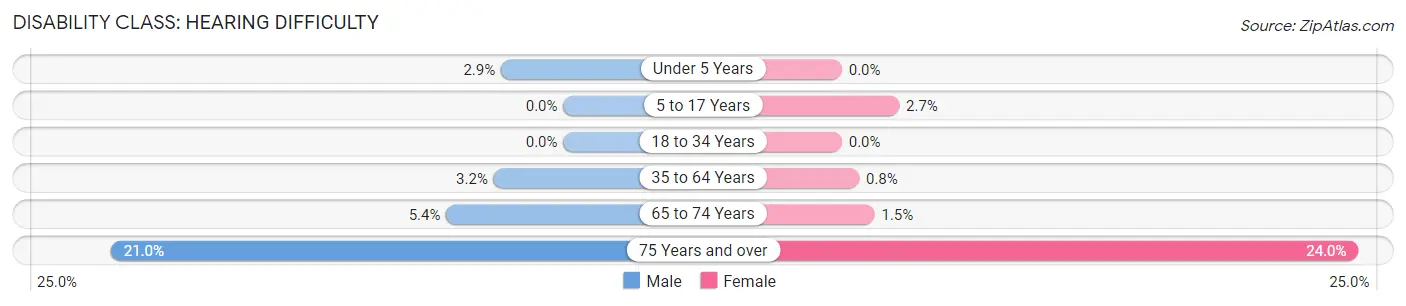
| Age Bracket | Male | Female |
| Under 5 Years | 23 (2.9%) | 0 (0.0%) |
| 5 to 17 Years | 0 (0.0%) | 48 (2.7%) |
| 18 to 34 Years | 0 (0.0%) | 0 (0.0%) |
| 35 to 64 Years | 151 (3.2%) | 39 (0.8%) |
| 65 to 74 Years | 52 (5.4%) | 21 (1.5%) |
| 75 Years and over | 156 (21.0%) | 140 (24.0%) |
Disability Class: Vision Difficulty
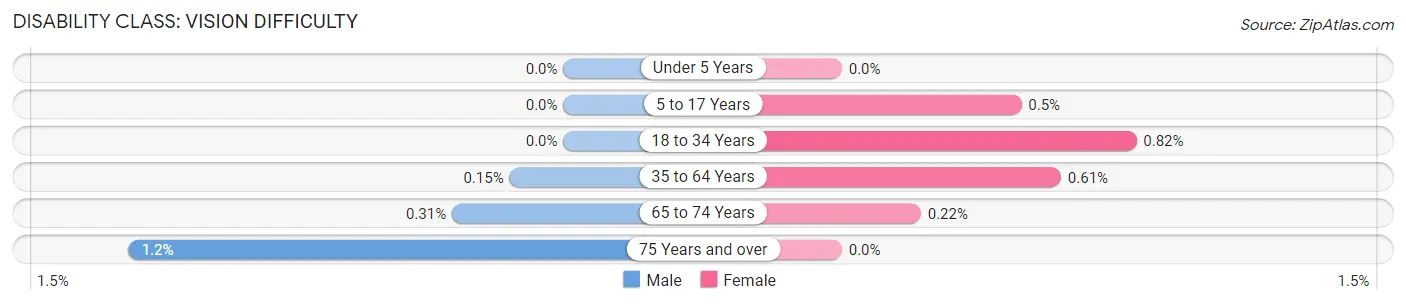
| Age Bracket | Male | Female |
| Under 5 Years | 0 (0.0%) | 0 (0.0%) |
| 5 to 17 Years | 0 (0.0%) | 9 (0.5%) |
| 18 to 34 Years | 0 (0.0%) | 13 (0.8%) |
| 35 to 64 Years | 7 (0.2%) | 30 (0.6%) |
| 65 to 74 Years | 3 (0.3%) | 3 (0.2%) |
| 75 Years and over | 9 (1.2%) | 0 (0.0%) |
Disability Class: Cognitive Difficulty
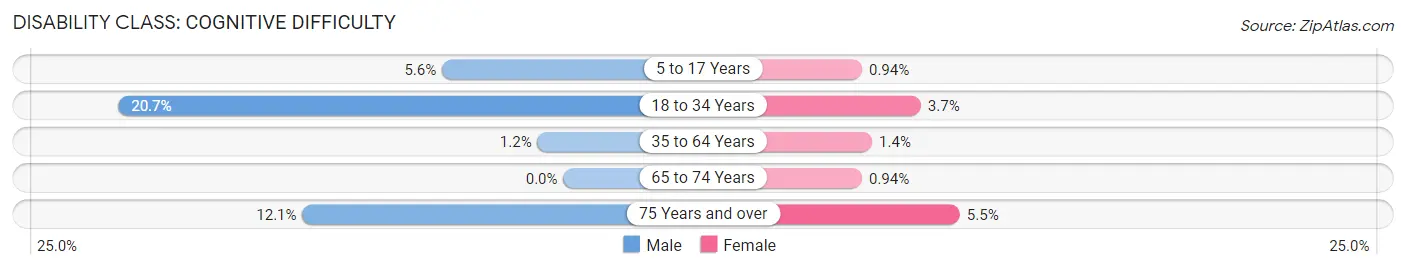
| Age Bracket | Male | Female |
| 5 to 17 Years | 88 (5.6%) | 17 (0.9%) |
| 18 to 34 Years | 383 (20.6%) | 58 (3.7%) |
| 35 to 64 Years | 56 (1.2%) | 69 (1.4%) |
| 65 to 74 Years | 0 (0.0%) | 13 (0.9%) |
| 75 Years and over | 90 (12.1%) | 32 (5.5%) |
Disability Class: Ambulatory Difficulty
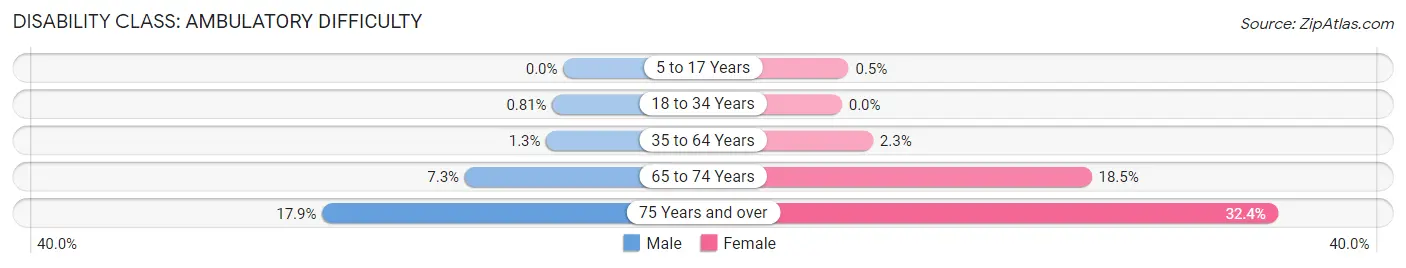
| Age Bracket | Male | Female |
| 5 to 17 Years | 0 (0.0%) | 9 (0.5%) |
| 18 to 34 Years | 15 (0.8%) | 0 (0.0%) |
| 35 to 64 Years | 59 (1.3%) | 113 (2.3%) |
| 65 to 74 Years | 70 (7.3%) | 256 (18.5%) |
| 75 Years and over | 133 (17.9%) | 189 (32.4%) |
Disability Class: Self-Care Difficulty
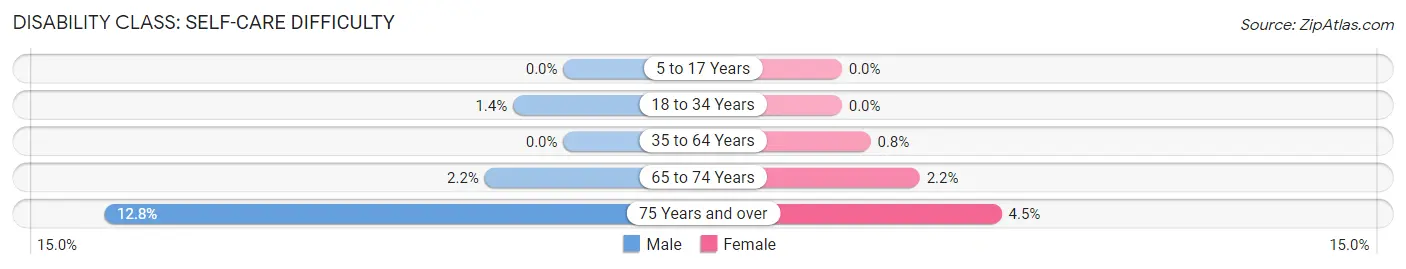
| Age Bracket | Male | Female |
| 5 to 17 Years | 0 (0.0%) | 0 (0.0%) |
| 18 to 34 Years | 26 (1.4%) | 0 (0.0%) |
| 35 to 64 Years | 0 (0.0%) | 39 (0.8%) |
| 65 to 74 Years | 21 (2.2%) | 30 (2.2%) |
| 75 Years and over | 95 (12.8%) | 26 (4.4%) |
Technology Access in Mukilteo
Computing Device Access in Mukilteo
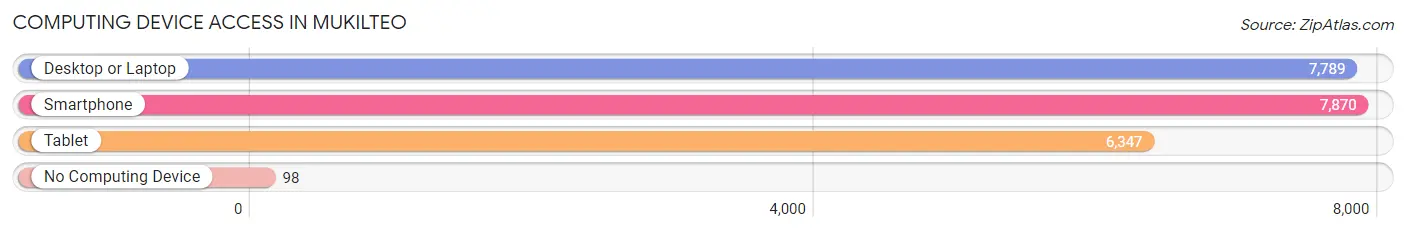
| Device Type | # Households | % Households |
| Desktop or Laptop | 7,789 | 94.4% |
| Smartphone | 7,870 | 95.4% |
| Tablet | 6,347 | 76.9% |
| No Computing Device | 98 | 1.2% |
| Total | 8,253 | 100.0% |
Internet Access in Mukilteo
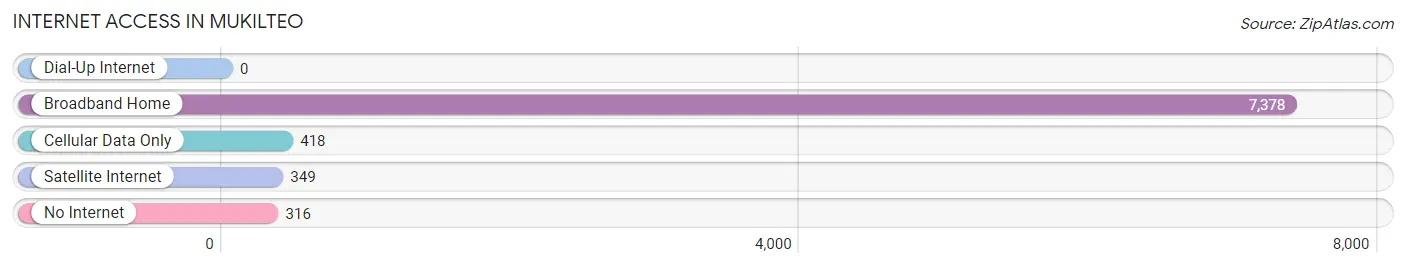
| Internet Type | # Households | % Households |
| Dial-Up Internet | 0 | 0.0% |
| Broadband Home | 7,378 | 89.4% |
| Cellular Data Only | 418 | 5.1% |
| Satellite Internet | 349 | 4.2% |
| No Internet | 316 | 3.8% |
| Total | 8,253 | 100.0% |
Mukilteo Summary
Mukilteo is a city located in Snohomish County, Washington, United States. It is situated on the Puget Sound, approximately 25 miles north of Seattle. The population was 20,254 at the 2010 census.
History
Mukilteo was first inhabited by the Snohomish people, who lived in the area for thousands of years before the arrival of European settlers. The first recorded European exploration of the area was in 1792, when George Vancouver sailed into the Puget Sound. The first permanent settlement was established in 1858 by Charles C. Terry, who named the area Mukilteo, which is derived from the Lushootseed word muckl-te-oh, meaning “good camping ground.”
In the late 19th century, Mukilteo became a popular destination for tourists, who came to enjoy the area’s natural beauty and recreational opportunities. The town was incorporated in 1947, and has since grown to become a thriving community.
Geography
Mukilteo is located at 47°54′N 122°19′W (47.9000, -122.3167). According to the United States Census Bureau, the city has a total area of 8.7 square miles, of which, 8.3 square miles is land and 0.4 square miles is water.
The city is situated on the Puget Sound, and is bordered by the cities of Everett to the east, Lynnwood to the south, and Edmonds to the west. The city is also home to the Mukilteo Lighthouse, which is listed on the National Register of Historic Places.
Economy
Mukilteo’s economy is largely based on the aerospace industry, with Boeing and other aerospace companies having a significant presence in the city. Other major employers include the Mukilteo School District, the Mukilteo Fire Department, and the Mukilteo Police Department.
The city is also home to several retail and commercial businesses, including the Harbour Pointe Shopping Center, which is the largest shopping center in the city.
Demographics
As of the 2010 census, there were 20,254 people, 8,093 households, and 5,541 families residing in the city. The population density was 2,420.3 people per square mile. The racial makeup of the city was 77.2% White, 8.2% Asian, 6.2% African American, 0.7% Native American, 0.2% Pacific Islander, 4.2% from other races, and 3.3% from two or more races. Hispanic or Latino of any race were 8.7% of the population.
The median income for a household in the city was $71,845, and the median income for a family was $86,945. The per capita income for the city was $35,945. About 4.2% of families and 6.2% of the population were below the poverty line, including 8.2% of those under age 18 and 4.2% of those age 65 or over.
Common Questions
What is the Total Population of Mukilteo?
Total Population of Mukilteo is 21,365.
What is the Total Male Population of Mukilteo?
Total Male Population of Mukilteo is 10,630.
What is the Total Female Population of Mukilteo?
Total Female Population of Mukilteo is 10,735.
What is the Ratio of Males per 100 Females in Mukilteo?
There are 99.02 Males per 100 Females in Mukilteo.
What is the Ratio of Females per 100 Males in Mukilteo?
There are 100.99 Females per 100 Males in Mukilteo.
What is the Median Population Age in Mukilteo?
Median Population Age in Mukilteo is 43.6 Years.
What is the Average Family Size in Mukilteo
Average Family Size in Mukilteo is 3.1 People.
What is the Average Household Size in Mukilteo
Average Household Size in Mukilteo is 2.6 People.
What is Per Capita Income in Mukilteo?
Per Capita income in Mukilteo is $62,514.
What is the Median Family Income in Mukilteo?
Median Family Income in Mukilteo is $158,292.
What is the Median Household income in Mukilteo?
Median Household Income in Mukilteo is $123,036.
What is Income or Wage Gap in Mukilteo?
Income or Wage Gap in Mukilteo is 40.2%.
Women in Mukilteo earn 59.8 cents for every dollar earned by a man.
What is Inequality or Gini Index in Mukilteo?
Inequality or Gini Index in Mukilteo is 0.41.
How Large is the Labor Force in Mukilteo?
There are 11,422 People in the Labor Forcein in Mukilteo.
What is the Percentage of People in the Labor Force in Mukilteo?
66.3% of People are in the Labor Force in Mukilteo.
What is the Unemployment Rate in Mukilteo?
Unemployment Rate in Mukilteo is 2.5%.