Cities with the Highest Percentage of Welsh Population in Washington
RELATED REPORTS & OPTIONS
Welsh
Washington
Compare Cities
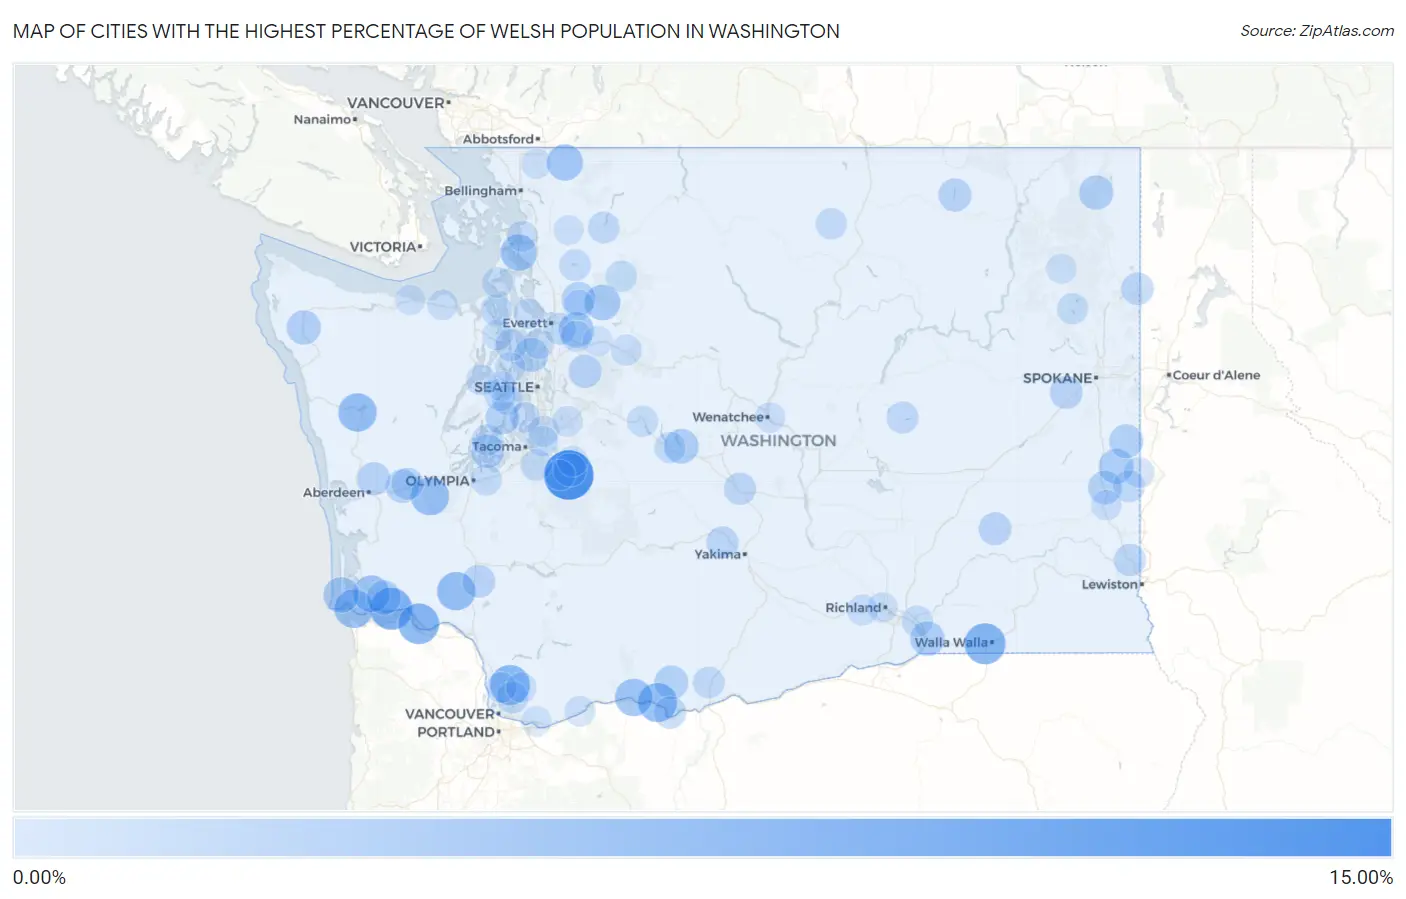
Map of Cities with the Highest Percentage of Welsh Population in Washington
0.00%
15.00%
Cities with the Highest Percentage of Welsh Population in Washington
| City | Welsh | vs State | vs National | |
| 1. | Carbonado | 14.55% | 0.85%(+13.7)#1 | 0.52%(+14.0)#73 |
| 2. | Altoona | 9.43% | 0.85%(+8.58)#2 | 0.52%(+8.91)#162 |
| 3. | Garrett | 8.76% | 0.85%(+7.91)#3 | 0.52%(+8.23)#182 |
| 4. | Puget Island | 8.61% | 0.85%(+7.76)#4 | 0.52%(+8.08)#188 |
| 5. | Cherry Grove | 8.11% | 0.85%(+7.26)#5 | 0.52%(+7.59)#200 |
| 6. | Lyle | 7.48% | 0.85%(+6.63)#6 | 0.52%(+6.96)#242 |
| 7. | Chinook | 7.16% | 0.85%(+6.31)#7 | 0.52%(+6.63)#264 |
| 8. | Ryderwood | 7.06% | 0.85%(+6.21)#8 | 0.52%(+6.53)#276 |
| 9. | Amanda Park | 7.04% | 0.85%(+6.19)#9 | 0.52%(+6.52)#279 |
| 10. | Porter | 6.85% | 0.85%(+6.00)#10 | 0.52%(+6.32)#295 |
| 11. | White Salmon | 6.43% | 0.85%(+5.58)#11 | 0.52%(+5.90)#322 |
| 12. | Naselle | 6.04% | 0.85%(+5.19)#12 | 0.52%(+5.52)#358 |
| 13. | La Conner | 5.70% | 0.85%(+4.85)#13 | 0.52%(+5.18)#385 |
| 14. | Maple Falls | 5.63% | 0.85%(+4.78)#14 | 0.52%(+5.10)#398 |
| 15. | Bow | 5.32% | 0.85%(+4.47)#15 | 0.52%(+4.80)#446 |
| 16. | Long Beach | 5.24% | 0.85%(+4.39)#16 | 0.52%(+4.72)#459 |
| 17. | Verlot | 5.17% | 0.85%(+4.32)#17 | 0.52%(+4.64)#479 |
| 18. | Three Lakes | 5.04% | 0.85%(+4.19)#18 | 0.52%(+4.52)#498 |
| 19. | Oakesdale | 4.68% | 0.85%(+3.83)#19 | 0.52%(+4.16)#578 |
| 20. | Roslyn | 4.59% | 0.85%(+3.74)#20 | 0.52%(+4.07)#594 |
| 21. | Sunland Estates | 4.55% | 0.85%(+3.69)#21 | 0.52%(+4.02)#605 |
| 22. | Wallula | 4.55% | 0.85%(+3.69)#22 | 0.52%(+4.02)#606 |
| 23. | Deep River | 4.40% | 0.85%(+3.55)#23 | 0.52%(+3.88)#635 |
| 24. | Ione | 4.39% | 0.85%(+3.54)#24 | 0.52%(+3.86)#637 |
| 25. | Forks | 4.32% | 0.85%(+3.47)#25 | 0.52%(+3.80)#646 |
| 26. | Klickitat | 4.18% | 0.85%(+3.33)#26 | 0.52%(+3.65)#691 |
| 27. | Latah | 4.17% | 0.85%(+3.32)#27 | 0.52%(+3.64)#695 |
| 28. | Woodway | 4.11% | 0.85%(+3.26)#28 | 0.52%(+3.59)#712 |
| 29. | Canyon Creek | 4.09% | 0.85%(+3.24)#29 | 0.52%(+3.56)#717 |
| 30. | Steptoe | 4.00% | 0.85%(+3.15)#30 | 0.52%(+3.48)#744 |
| 31. | Burley | 3.99% | 0.85%(+3.14)#31 | 0.52%(+3.46)#747 |
| 32. | Brady | 3.95% | 0.85%(+3.10)#32 | 0.52%(+3.43)#762 |
| 33. | Longbranch | 3.68% | 0.85%(+2.83)#33 | 0.52%(+3.15)#852 |
| 34. | Wilkeson | 3.67% | 0.85%(+2.82)#34 | 0.52%(+3.15)#856 |
| 35. | Aberdeen Gardens | 3.66% | 0.85%(+2.81)#35 | 0.52%(+3.14)#863 |
| 36. | Lake Marcel Stillwater | 3.65% | 0.85%(+2.80)#36 | 0.52%(+3.13)#872 |
| 37. | Curlew Lake | 3.59% | 0.85%(+2.74)#37 | 0.52%(+3.07)#900 |
| 38. | Toledo | 3.44% | 0.85%(+2.59)#38 | 0.52%(+2.92)#980 |
| 39. | Washtucna | 3.41% | 0.85%(+2.56)#39 | 0.52%(+2.88)#995 |
| 40. | Medical Lake | 3.40% | 0.85%(+2.55)#40 | 0.52%(+2.88)#997 |
| 41. | Newport | 3.23% | 0.85%(+2.38)#41 | 0.52%(+2.71)#1,090 |
| 42. | Clear Lake Cdp Skagit County | 3.21% | 0.85%(+2.36)#42 | 0.52%(+2.69)#1,104 |
| 43. | Cowiche | 3.15% | 0.85%(+2.30)#43 | 0.52%(+2.62)#1,137 |
| 44. | Ellensburg | 3.13% | 0.85%(+2.28)#44 | 0.52%(+2.61)#1,142 |
| 45. | Fairwood Cdp Spokane County | 3.10% | 0.85%(+2.25)#45 | 0.52%(+2.57)#1,151 |
| 46. | Dallesport | 3.09% | 0.85%(+2.23)#46 | 0.52%(+2.56)#1,165 |
| 47. | Satsop | 2.99% | 0.85%(+2.14)#47 | 0.52%(+2.47)#1,208 |
| 48. | Port Gamble Tribal Community | 2.94% | 0.85%(+2.09)#48 | 0.52%(+2.42)#1,240 |
| 49. | Colton | 2.94% | 0.85%(+2.09)#49 | 0.52%(+2.42)#1,242 |
| 50. | Garfield | 2.90% | 0.85%(+2.05)#50 | 0.52%(+2.38)#1,264 |
| 51. | Fobes Hill | 2.87% | 0.85%(+2.02)#51 | 0.52%(+2.35)#1,283 |
| 52. | Wilson Creek | 2.87% | 0.85%(+2.02)#52 | 0.52%(+2.35)#1,284 |
| 53. | Brush Prairie | 2.78% | 0.85%(+1.93)#53 | 0.52%(+2.26)#1,358 |
| 54. | Concrete | 2.78% | 0.85%(+1.93)#54 | 0.52%(+2.25)#1,363 |
| 55. | Goldendale | 2.76% | 0.85%(+1.90)#55 | 0.52%(+2.23)#1,382 |
| 56. | Navy Yard City | 2.65% | 0.85%(+1.80)#56 | 0.52%(+2.12)#1,473 |
| 57. | Lake Cavanaugh | 2.64% | 0.85%(+1.79)#57 | 0.52%(+2.11)#1,483 |
| 58. | Marrowstone | 2.61% | 0.85%(+1.76)#58 | 0.52%(+2.08)#1,521 |
| 59. | Home | 2.60% | 0.85%(+1.75)#59 | 0.52%(+2.08)#1,526 |
| 60. | Summit View | 2.55% | 0.85%(+1.70)#60 | 0.52%(+2.02)#1,589 |
| 61. | Conconully | 2.51% | 0.85%(+1.66)#61 | 0.52%(+1.99)#1,625 |
| 62. | Burbank | 2.48% | 0.85%(+1.63)#62 | 0.52%(+1.96)#1,652 |
| 63. | Easton | 2.44% | 0.85%(+1.59)#63 | 0.52%(+1.91)#1,696 |
| 64. | Loon Lake | 2.42% | 0.85%(+1.57)#64 | 0.52%(+1.90)#1,713 |
| 65. | Tanglewilde | 2.42% | 0.85%(+1.57)#65 | 0.52%(+1.89)#1,718 |
| 66. | Chain Lake | 2.40% | 0.85%(+1.55)#66 | 0.52%(+1.88)#1,742 |
| 67. | Snoqualmie Pass | 2.38% | 0.85%(+1.53)#67 | 0.52%(+1.86)#1,766 |
| 68. | Darrington | 2.35% | 0.85%(+1.50)#68 | 0.52%(+1.83)#1,804 |
| 69. | Lakeland North | 2.31% | 0.85%(+1.46)#69 | 0.52%(+1.78)#1,846 |
| 70. | Index | 2.27% | 0.85%(+1.42)#70 | 0.52%(+1.75)#1,880 |
| 71. | Buckley | 2.22% | 0.85%(+1.36)#71 | 0.52%(+1.69)#1,958 |
| 72. | Bay View | 2.20% | 0.85%(+1.35)#72 | 0.52%(+1.68)#1,973 |
| 73. | Parkwood | 2.20% | 0.85%(+1.35)#73 | 0.52%(+1.68)#1,974 |
| 74. | Benton City | 2.14% | 0.85%(+1.29)#74 | 0.52%(+1.62)#2,038 |
| 75. | Seabeck | 2.12% | 0.85%(+1.27)#75 | 0.52%(+1.59)#2,077 |
| 76. | Coupeville | 2.11% | 0.85%(+1.26)#76 | 0.52%(+1.58)#2,084 |
| 77. | Duluth | 2.09% | 0.85%(+1.24)#77 | 0.52%(+1.56)#2,116 |
| 78. | Farmington | 2.08% | 0.85%(+1.23)#78 | 0.52%(+1.56)#2,123 |
| 79. | Lakeland South | 2.08% | 0.85%(+1.23)#79 | 0.52%(+1.55)#2,125 |
| 80. | Port Ludlow | 2.07% | 0.85%(+1.22)#80 | 0.52%(+1.54)#2,138 |
| 81. | Langley | 2.04% | 0.85%(+1.19)#81 | 0.52%(+1.52)#2,170 |
| 82. | Shadow Lake | 2.03% | 0.85%(+1.18)#82 | 0.52%(+1.51)#2,194 |
| 83. | East Wenatchee | 2.01% | 0.85%(+1.16)#83 | 0.52%(+1.49)#2,233 |
| 84. | Vashon | 2.01% | 0.85%(+1.16)#84 | 0.52%(+1.49)#2,236 |
| 85. | North Bonneville | 2.01% | 0.85%(+1.16)#85 | 0.52%(+1.48)#2,244 |
| 86. | Meadowdale | 2.00% | 0.85%(+1.15)#86 | 0.52%(+1.48)#2,254 |
| 87. | Carlsborg | 1.93% | 0.85%(+1.08)#87 | 0.52%(+1.41)#2,390 |
| 88. | Suquamish | 1.92% | 0.85%(+1.07)#88 | 0.52%(+1.39)#2,412 |
| 89. | Granite Falls | 1.90% | 0.85%(+1.05)#89 | 0.52%(+1.38)#2,427 |
| 90. | Colfax | 1.89% | 0.85%(+1.04)#90 | 0.52%(+1.37)#2,443 |
| 91. | Crocker | 1.89% | 0.85%(+1.04)#91 | 0.52%(+1.36)#2,448 |
| 92. | Venersborg | 1.88% | 0.85%(+1.03)#92 | 0.52%(+1.35)#2,477 |
| 93. | Richland | 1.85% | 0.85%(+1.00)#93 | 0.52%(+1.33)#2,520 |
| 94. | Lyman | 1.81% | 0.85%(+0.963)#94 | 0.52%(+1.29)#2,586 |
| 95. | Tracyton | 1.80% | 0.85%(+0.949)#95 | 0.52%(+1.27)#2,607 |
| 96. | Sultan | 1.79% | 0.85%(+0.944)#96 | 0.52%(+1.27)#2,616 |
| 97. | Washougal | 1.77% | 0.85%(+0.920)#97 | 0.52%(+1.25)#2,663 |
| 98. | Everson | 1.76% | 0.85%(+0.906)#98 | 0.52%(+1.23)#2,693 |
| 99. | Port Angeles | 1.75% | 0.85%(+0.904)#99 | 0.52%(+1.23)#2,697 |
| 100. | Chewelah | 1.75% | 0.85%(+0.904)#100 | 0.52%(+1.23)#2,698 |
Common Questions
What are the Top 10 Cities with the Highest Percentage of Welsh Population in Washington?
Top 10 Cities with the Highest Percentage of Welsh Population in Washington are:
#1
14.55%
#2
9.43%
#3
8.76%
#4
8.61%
#5
8.11%
#6
7.48%
#7
7.16%
#8
7.06%
#9
7.04%
#10
6.85%
What city has the Highest Percentage of Welsh Population in Washington?
Carbonado has the Highest Percentage of Welsh Population in Washington with 14.55%.
What is the Percentage of Welsh Population in the State of Washington?
Percentage of Welsh Population in Washington is 0.85%.
What is the Percentage of Welsh Population in the United States?
Percentage of Welsh Population in the United States is 0.52%.