Cities with the Highest Percentage of Nicaraguan Population in Washington
RELATED REPORTS & OPTIONS
Nicaraguan
Washington
Compare Cities
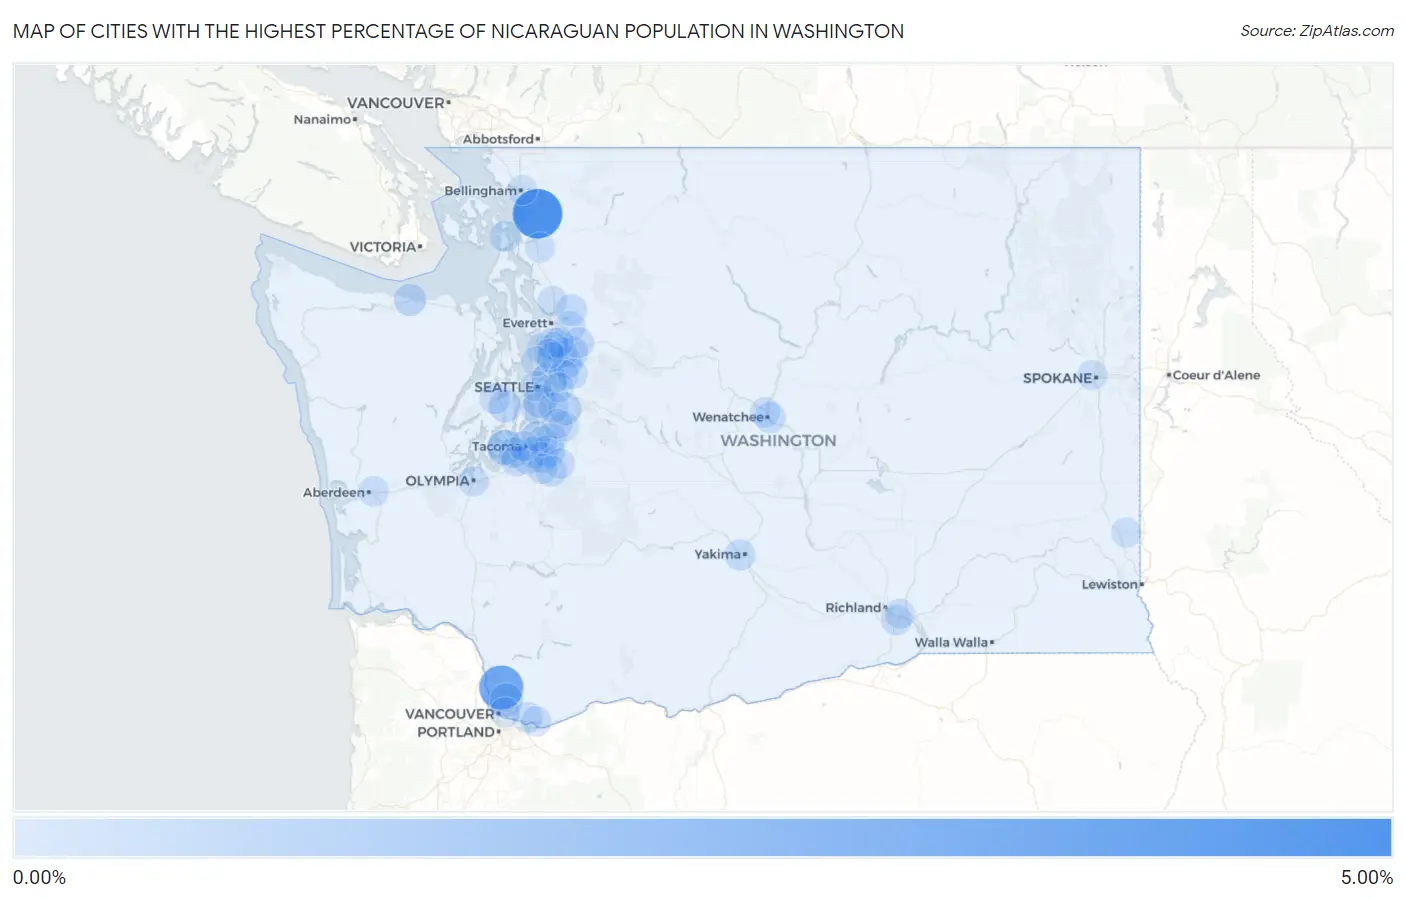
Map of Cities with the Highest Percentage of Nicaraguan Population in Washington
0.00%
5.00%
Cities with the Highest Percentage of Nicaraguan Population in Washington
| City | Nicaraguan | vs State | vs National | |
| 1. | Alger | 4.12% | 0.047%(+4.07)#1 | 0.13%(+3.99)#54 |
| 2. | Duluth | 2.96% | 0.047%(+2.91)#2 | 0.13%(+2.82)#91 |
| 3. | Fox Island | 1.04% | 0.047%(+0.996)#3 | 0.13%(+0.910)#308 |
| 4. | Hunts Point | 0.93% | 0.047%(+0.882)#4 | 0.13%(+0.795)#342 |
| 5. | Boulevard Park | 0.63% | 0.047%(+0.588)#5 | 0.13%(+0.501)#490 |
| 6. | Barberton | 0.63% | 0.047%(+0.582)#6 | 0.13%(+0.496)#494 |
| 7. | East Renton Highlands | 0.52% | 0.047%(+0.475)#7 | 0.13%(+0.388)#578 |
| 8. | Bethel | 0.47% | 0.047%(+0.427)#8 | 0.13%(+0.341)#627 |
| 9. | Port Angeles | 0.41% | 0.047%(+0.368)#9 | 0.13%(+0.282)#684 |
| 10. | Cottage Lake | 0.41% | 0.047%(+0.362)#10 | 0.13%(+0.276)#694 |
| 11. | Sumner | 0.40% | 0.047%(+0.350)#11 | 0.13%(+0.263)#708 |
| 12. | High Bridge | 0.38% | 0.047%(+0.336)#12 | 0.13%(+0.250)#723 |
| 13. | Mill Creek | 0.37% | 0.047%(+0.319)#13 | 0.13%(+0.232)#746 |
| 14. | Fairwood Cdp King County | 0.36% | 0.047%(+0.313)#14 | 0.13%(+0.227)#753 |
| 15. | Lochsloy | 0.26% | 0.047%(+0.214)#15 | 0.13%(+0.128)#953 |
| 16. | Midland | 0.25% | 0.047%(+0.206)#16 | 0.13%(+0.120)#972 |
| 17. | East Wenatchee | 0.24% | 0.047%(+0.195)#17 | 0.13%(+0.108)#1,004 |
| 18. | Waller | 0.24% | 0.047%(+0.191)#18 | 0.13%(+0.104)#1,015 |
| 19. | Anacortes | 0.23% | 0.047%(+0.185)#19 | 0.13%(+0.099)#1,031 |
| 20. | Orting | 0.20% | 0.047%(+0.155)#20 | 0.13%(+0.069)#1,123 |
| 21. | Yakima | 0.20% | 0.047%(+0.155)#21 | 0.13%(+0.068)#1,127 |
| 22. | Auburn | 0.18% | 0.047%(+0.138)#22 | 0.13%(+0.051)#1,189 |
| 23. | Puyallup | 0.17% | 0.047%(+0.122)#23 | 0.13%(+0.036)#1,237 |
| 24. | Burien | 0.16% | 0.047%(+0.108)#24 | 0.13%(+0.022)#1,295 |
| 25. | Everett | 0.16% | 0.047%(+0.108)#25 | 0.13%(+0.022)#1,296 |
| 26. | Bremerton | 0.14% | 0.047%(+0.096)#26 | 0.13%(+0.010)#1,336 |
| 27. | Monroe | 0.14% | 0.047%(+0.091)#27 | 0.13%(+0.004)#1,360 |
| 28. | Camas | 0.13% | 0.047%(+0.082)#28 | 0.13%(-0.004)#1,394 |
| 29. | Mill Creek East | 0.13% | 0.047%(+0.080)#29 | 0.13%(-0.007)#1,404 |
| 30. | Kennewick | 0.13% | 0.047%(+0.078)#30 | 0.13%(-0.008)#1,408 |
| 31. | Covington | 0.11% | 0.047%(+0.064)#31 | 0.13%(-0.023)#1,485 |
| 32. | University Place | 0.11% | 0.047%(+0.063)#32 | 0.13%(-0.024)#1,490 |
| 33. | Bothell | 0.11% | 0.047%(+0.062)#33 | 0.13%(-0.025)#1,497 |
| 34. | Lynnwood | 0.095% | 0.047%(+0.048)#34 | 0.13%(-0.038)#1,566 |
| 35. | Wenatchee | 0.090% | 0.047%(+0.044)#35 | 0.13%(-0.043)#1,599 |
| 36. | Maltby | 0.088% | 0.047%(+0.041)#36 | 0.13%(-0.045)#1,612 |
| 37. | Lakeland South | 0.087% | 0.047%(+0.040)#37 | 0.13%(-0.046)#1,617 |
| 38. | Union Hill Novelty Hill | 0.082% | 0.047%(+0.035)#38 | 0.13%(-0.051)#1,652 |
| 39. | Prairie Ridge | 0.080% | 0.047%(+0.033)#39 | 0.13%(-0.053)#1,668 |
| 40. | Redmond | 0.079% | 0.047%(+0.032)#40 | 0.13%(-0.055)#1,677 |
| 41. | Olympia | 0.076% | 0.047%(+0.029)#41 | 0.13%(-0.057)#1,698 |
| 42. | Lakewood | 0.073% | 0.047%(+0.026)#42 | 0.13%(-0.060)#1,725 |
| 43. | Washougal | 0.071% | 0.047%(+0.024)#43 | 0.13%(-0.062)#1,736 |
| 44. | Seattle | 0.066% | 0.047%(+0.019)#44 | 0.13%(-0.067)#1,780 |
| 45. | Vancouver | 0.058% | 0.047%(+0.011)#45 | 0.13%(-0.076)#1,849 |
| 46. | South Hill | 0.057% | 0.047%(+0.011)#46 | 0.13%(-0.076)#1,853 |
| 47. | Federal Way | 0.056% | 0.047%(+0.009)#47 | 0.13%(-0.077)#1,863 |
| 48. | Aberdeen | 0.053% | 0.047%(+0.006)#48 | 0.13%(-0.080)#1,895 |
| 49. | Tacoma | 0.052% | 0.047%(+0.006)#49 | 0.13%(-0.081)#1,902 |
| 50. | Renton | 0.042% | 0.047%(-0.005)#50 | 0.13%(-0.092)#1,991 |
| 51. | Silver Firs | 0.040% | 0.047%(-0.006)#51 | 0.13%(-0.093)#2,006 |
| 52. | Pasco | 0.035% | 0.047%(-0.012)#52 | 0.13%(-0.098)#2,051 |
| 53. | Marysville | 0.032% | 0.047%(-0.014)#53 | 0.13%(-0.101)#2,076 |
| 54. | Mount Vernon | 0.031% | 0.047%(-0.016)#54 | 0.13%(-0.102)#2,088 |
| 55. | Pullman | 0.028% | 0.047%(-0.019)#55 | 0.13%(-0.105)#2,109 |
| 56. | Bothell West | 0.024% | 0.047%(-0.023)#56 | 0.13%(-0.109)#2,140 |
| 57. | Bellevue | 0.023% | 0.047%(-0.024)#57 | 0.13%(-0.110)#2,149 |
| 58. | Kent | 0.022% | 0.047%(-0.025)#58 | 0.13%(-0.111)#2,164 |
| 59. | Spokane | 0.021% | 0.047%(-0.026)#59 | 0.13%(-0.112)#2,175 |
| 60. | Bellingham | 0.0099% | 0.047%(-0.037)#60 | 0.13%(-0.123)#2,279 |
| 61. | Shoreline | 0.0085% | 0.047%(-0.038)#61 | 0.13%(-0.125)#2,291 |
Common Questions
What are the Top 10 Cities with the Highest Percentage of Nicaraguan Population in Washington?
Top 10 Cities with the Highest Percentage of Nicaraguan Population in Washington are:
#1
4.12%
#2
2.96%
#3
1.04%
#4
0.93%
#5
0.63%
#6
0.63%
#7
0.52%
#8
0.47%
#9
0.41%
#10
0.41%
What city has the Highest Percentage of Nicaraguan Population in Washington?
Alger has the Highest Percentage of Nicaraguan Population in Washington with 4.12%.
What is the Percentage of Nicaraguan Population in the State of Washington?
Percentage of Nicaraguan Population in Washington is 0.047%.
What is the Percentage of Nicaraguan Population in the United States?
Percentage of Nicaraguan Population in the United States is 0.13%.