Pullman, WA
Pullman Map
Pullman Overview
31,972
TOTAL POPULATION
16,263
MALE POPULATION
15,709
FEMALE POPULATION
103.53
MALES / 100 FEMALES
96.59
FEMALES / 100 MALES
22.8
MEDIAN AGE
2.9
AVG FAMILY SIZE
2.2
AVG HOUSEHOLD SIZE
$27,431
PER CAPITA INCOME
$88,297
AVG FAMILY INCOME
$41,479
AVG HOUSEHOLD INCOME
46.4%
WAGE / INCOME GAP [ % ]
53.6¢/ $1
WAGE / INCOME GAP [ $ ]
0.57
INEQUALITY / GINI INDEX
17,443
LABOR FORCE [ PEOPLE ]
61.4%
PERCENT IN LABOR FORCE
7.8%
UNEMPLOYMENT RATE
Pullman Zip Codes
Pullman Area Codes
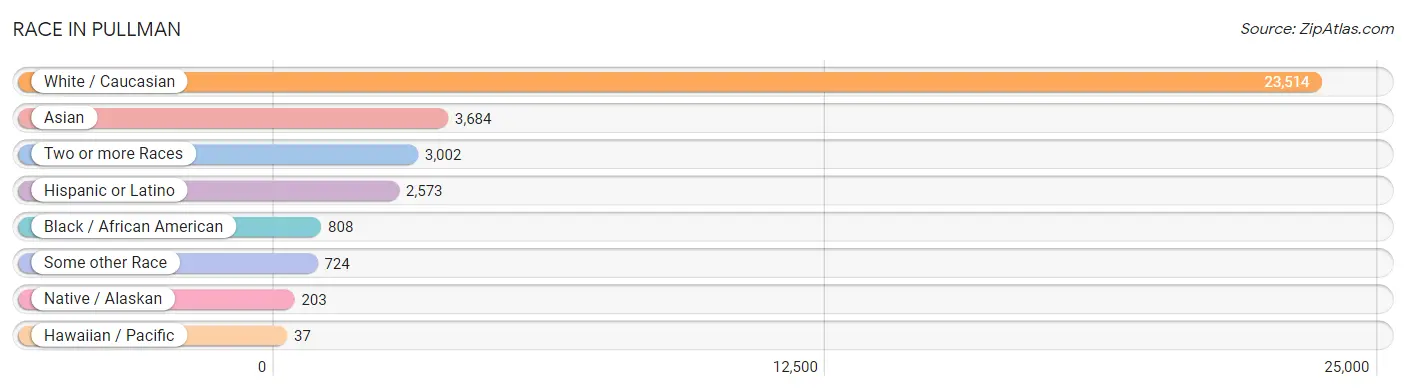
Race in Pullman
The most populous races in Pullman are White / Caucasian (23,514 | 73.6%), Asian (3,684 | 11.5%), and Two or more Races (3,002 | 9.4%).
| Race | # Population | % Population |
| Asian | 3,684 | 11.5% |
| Black / African American | 808 | 2.5% |
| Hawaiian / Pacific | 37 | 0.1% |
| Hispanic or Latino | 2,573 | 8.1% |
| Native / Alaskan | 203 | 0.6% |
| White / Caucasian | 23,514 | 73.6% |
| Two or more Races | 3,002 | 9.4% |
| Some other Race | 724 | 2.3% |
| Total | 31,972 | 100.0% |
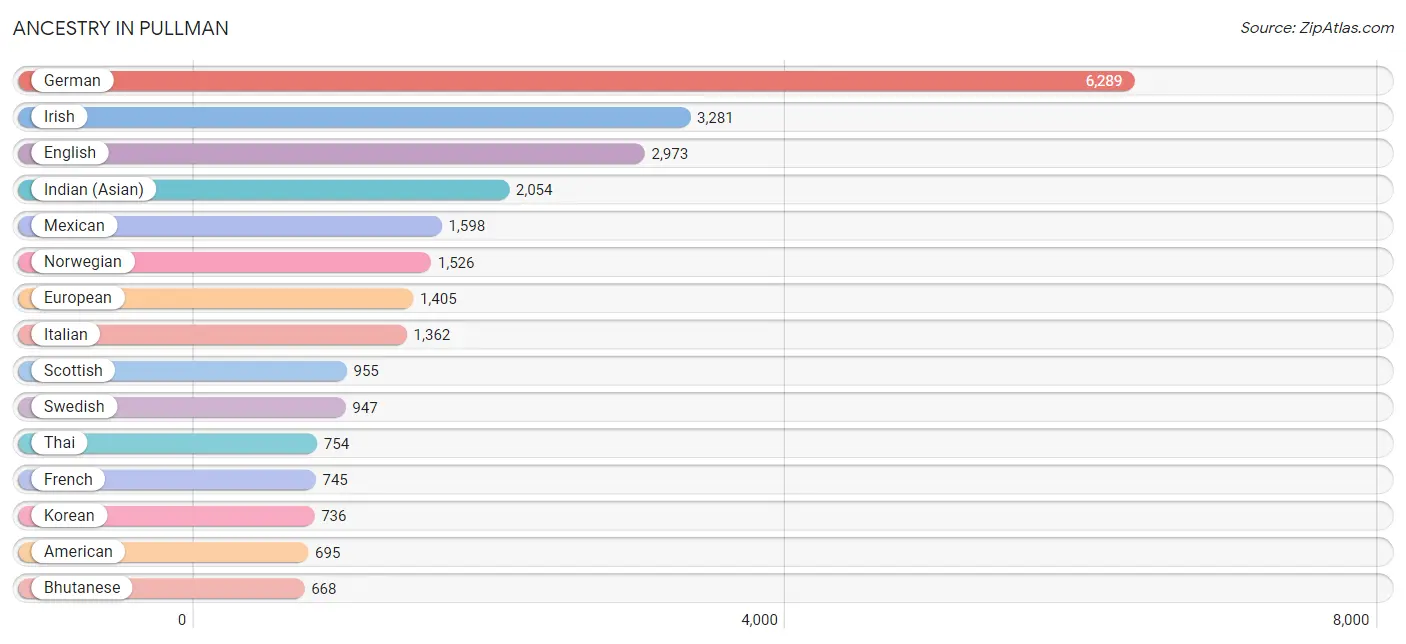
Ancestry in Pullman
The most populous ancestries reported in Pullman are German (6,289 | 19.7%), Irish (3,281 | 10.3%), English (2,973 | 9.3%), Indian (Asian) (2,054 | 6.4%), and Mexican (1,598 | 5.0%), together accounting for 50.6% of all Pullman residents.
| Ancestry | # Population | % Population |
| African | 104 | 0.3% |
| Albanian | 19 | 0.1% |
| Aleut | 3 | 0.0% |
| Alsatian | 13 | 0.0% |
| American | 695 | 2.2% |
| Apache | 57 | 0.2% |
| Arab | 198 | 0.6% |
| Argentinean | 28 | 0.1% |
| Armenian | 156 | 0.5% |
| Australian | 32 | 0.1% |
| Austrian | 95 | 0.3% |
| Bangladeshi | 28 | 0.1% |
| Basque | 54 | 0.2% |
| Belgian | 28 | 0.1% |
| Bhutanese | 668 | 2.1% |
| Blackfeet | 37 | 0.1% |
| Bolivian | 11 | 0.0% |
| Brazilian | 97 | 0.3% |
| British | 366 | 1.1% |
| Bulgarian | 10 | 0.0% |
| Burmese | 364 | 1.1% |
| Cajun | 7 | 0.0% |
| Canadian | 99 | 0.3% |
| Celtic | 13 | 0.0% |
| Central American | 185 | 0.6% |
| Cherokee | 63 | 0.2% |
| Chilean | 51 | 0.2% |
| Choctaw | 18 | 0.1% |
| Colombian | 10 | 0.0% |
| Colville | 24 | 0.1% |
| Croatian | 9 | 0.0% |
| Cuban | 18 | 0.1% |
| Cypriot | 24 | 0.1% |
| Czech | 239 | 0.7% |
| Czechoslovakian | 15 | 0.1% |
| Danish | 256 | 0.8% |
| Dominican | 11 | 0.0% |
| Dutch | 468 | 1.5% |
| Eastern European | 87 | 0.3% |
| Ecuadorian | 94 | 0.3% |
| Egyptian | 15 | 0.1% |
| English | 2,973 | 9.3% |
| Ethiopian | 11 | 0.0% |
| European | 1,405 | 4.4% |
| Filipino | 56 | 0.2% |
| Finnish | 78 | 0.2% |
| French | 745 | 2.3% |
| French American Indian | 3 | 0.0% |
| French Canadian | 359 | 1.1% |
| German | 6,289 | 19.7% |
| Greek | 172 | 0.5% |
| Guamanian / Chamorro | 16 | 0.1% |
| Guatemalan | 114 | 0.4% |
| Guyanese | 13 | 0.0% |
| Haitian | 27 | 0.1% |
| Honduran | 48 | 0.2% |
| Hungarian | 178 | 0.6% |
| Indian (Asian) | 2,054 | 6.4% |
| Inupiat | 9 | 0.0% |
| Iranian | 159 | 0.5% |
| Irish | 3,281 | 10.3% |
| Italian | 1,362 | 4.3% |
| Japanese | 19 | 0.1% |
| Kenyan | 97 | 0.3% |
| Korean | 736 | 2.3% |
| Laotian | 67 | 0.2% |
| Latvian | 32 | 0.1% |
| Lebanese | 42 | 0.1% |
| Lithuanian | 45 | 0.1% |
| Mexican | 1,598 | 5.0% |
| Mexican American Indian | 30 | 0.1% |
| Native Hawaiian | 318 | 1.0% |
| Nicaraguan | 9 | 0.0% |
| Nigerian | 50 | 0.2% |
| Northern European | 254 | 0.8% |
| Norwegian | 1,526 | 4.8% |
| Pakistani | 131 | 0.4% |
| Palestinian | 23 | 0.1% |
| Panamanian | 14 | 0.0% |
| Pennsylvania German | 15 | 0.1% |
| Peruvian | 43 | 0.1% |
| Polish | 471 | 1.5% |
| Portuguese | 110 | 0.3% |
| Pueblo | 34 | 0.1% |
| Puerto Rican | 163 | 0.5% |
| Puget Sound Salish | 19 | 0.1% |
| Romanian | 31 | 0.1% |
| Russian | 327 | 1.0% |
| Scandinavian | 140 | 0.4% |
| Scotch-Irish | 115 | 0.4% |
| Scottish | 955 | 3.0% |
| Serbian | 7 | 0.0% |
| Slovak | 119 | 0.4% |
| Slovene | 8 | 0.0% |
| Somali | 27 | 0.1% |
| South African | 13 | 0.0% |
| South American | 237 | 0.7% |
| Spaniard | 266 | 0.8% |
| Spanish | 41 | 0.1% |
| Sri Lankan | 204 | 0.6% |
| Subsaharan African | 325 | 1.0% |
| Swedish | 947 | 3.0% |
| Swiss | 130 | 0.4% |
| Thai | 754 | 2.4% |
| Tlingit-Haida | 32 | 0.1% |
| Tsimshian | 12 | 0.0% |
| Turkish | 22 | 0.1% |
| Ukrainian | 55 | 0.2% |
| Vietnamese | 51 | 0.2% |
| Welsh | 233 | 0.7% |
| West Indian | 9 | 0.0% |
| Yugoslavian | 31 | 0.1% | View All 112 Rows |
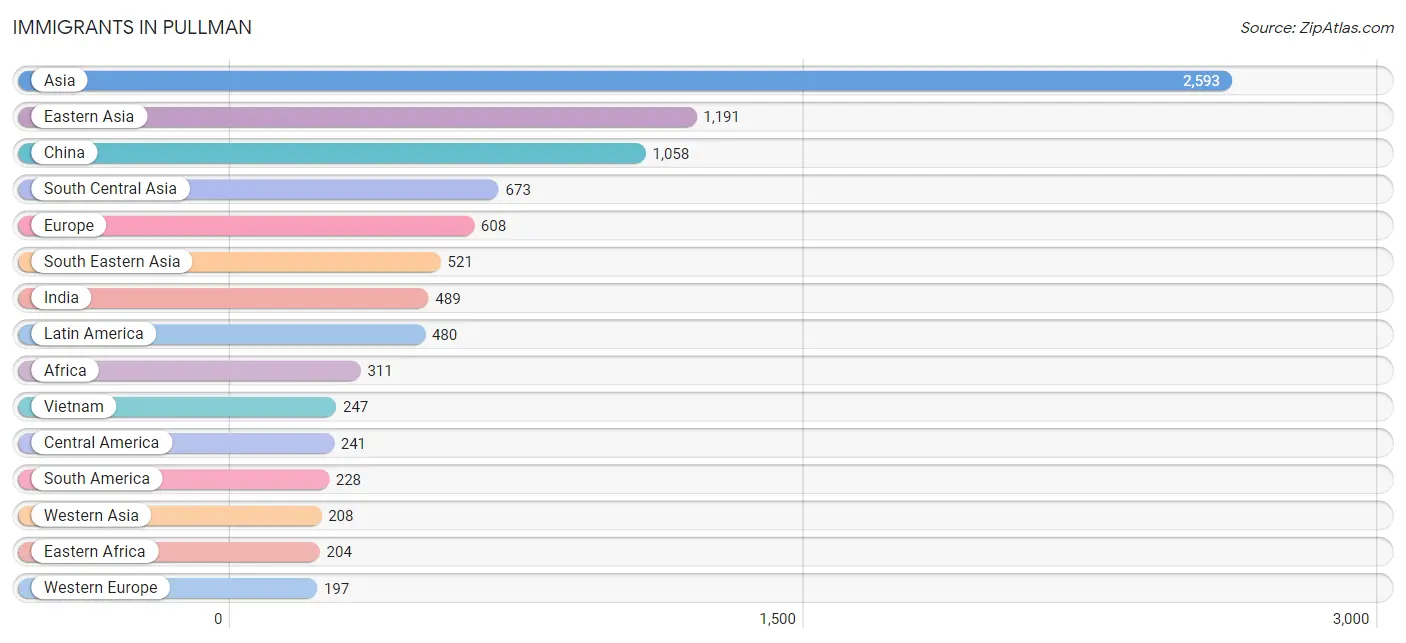
Immigrants in Pullman
The most numerous immigrant groups reported in Pullman came from Asia (2,593 | 8.1%), Eastern Asia (1,191 | 3.7%), China (1,058 | 3.3%), South Central Asia (673 | 2.1%), and Europe (608 | 1.9%), together accounting for 19.1% of all Pullman residents.
| Immigration Origin | # Population | % Population |
| Africa | 311 | 1.0% |
| Argentina | 7 | 0.0% |
| Asia | 2,593 | 8.1% |
| Austria | 9 | 0.0% |
| Bangladesh | 51 | 0.2% |
| Belarus | 21 | 0.1% |
| Brazil | 104 | 0.3% |
| Canada | 143 | 0.4% |
| Caribbean | 11 | 0.0% |
| Central America | 241 | 0.7% |
| China | 1,058 | 3.3% |
| Dominican Republic | 11 | 0.0% |
| Eastern Africa | 204 | 0.6% |
| Eastern Asia | 1,191 | 3.7% |
| Eastern Europe | 121 | 0.4% |
| Egypt | 15 | 0.1% |
| England | 10 | 0.0% |
| Ethiopia | 11 | 0.0% |
| Europe | 608 | 1.9% |
| France | 42 | 0.1% |
| Germany | 146 | 0.5% |
| Honduras | 48 | 0.2% |
| Hong Kong | 7 | 0.0% |
| India | 489 | 1.5% |
| Indonesia | 51 | 0.2% |
| Iran | 100 | 0.3% |
| Ireland | 3 | 0.0% |
| Israel | 30 | 0.1% |
| Japan | 8 | 0.0% |
| Kenya | 128 | 0.4% |
| Korea | 125 | 0.4% |
| Latin America | 480 | 1.5% |
| Mexico | 179 | 0.6% |
| Nepal | 17 | 0.1% |
| Nigeria | 12 | 0.0% |
| Northern Africa | 15 | 0.1% |
| Northern Europe | 187 | 0.6% |
| Panama | 14 | 0.0% |
| Peru | 43 | 0.1% |
| Philippines | 105 | 0.3% |
| Portugal | 13 | 0.0% |
| Russia | 100 | 0.3% |
| Saudi Arabia | 125 | 0.4% |
| Scotland | 17 | 0.1% |
| Singapore | 9 | 0.0% |
| South America | 228 | 0.7% |
| South Central Asia | 673 | 2.1% |
| South Eastern Asia | 521 | 1.6% |
| Southern Europe | 103 | 0.3% |
| Spain | 90 | 0.3% |
| Sweden | 12 | 0.0% |
| Taiwan | 112 | 0.4% |
| Thailand | 98 | 0.3% |
| Turkey | 22 | 0.1% |
| Uganda | 65 | 0.2% |
| Uruguay | 13 | 0.0% |
| Venezuela | 61 | 0.2% |
| Vietnam | 247 | 0.8% |
| Western Africa | 92 | 0.3% |
| Western Asia | 208 | 0.6% |
| Western Europe | 197 | 0.6% | View All 61 Rows |
Sex and Age in Pullman
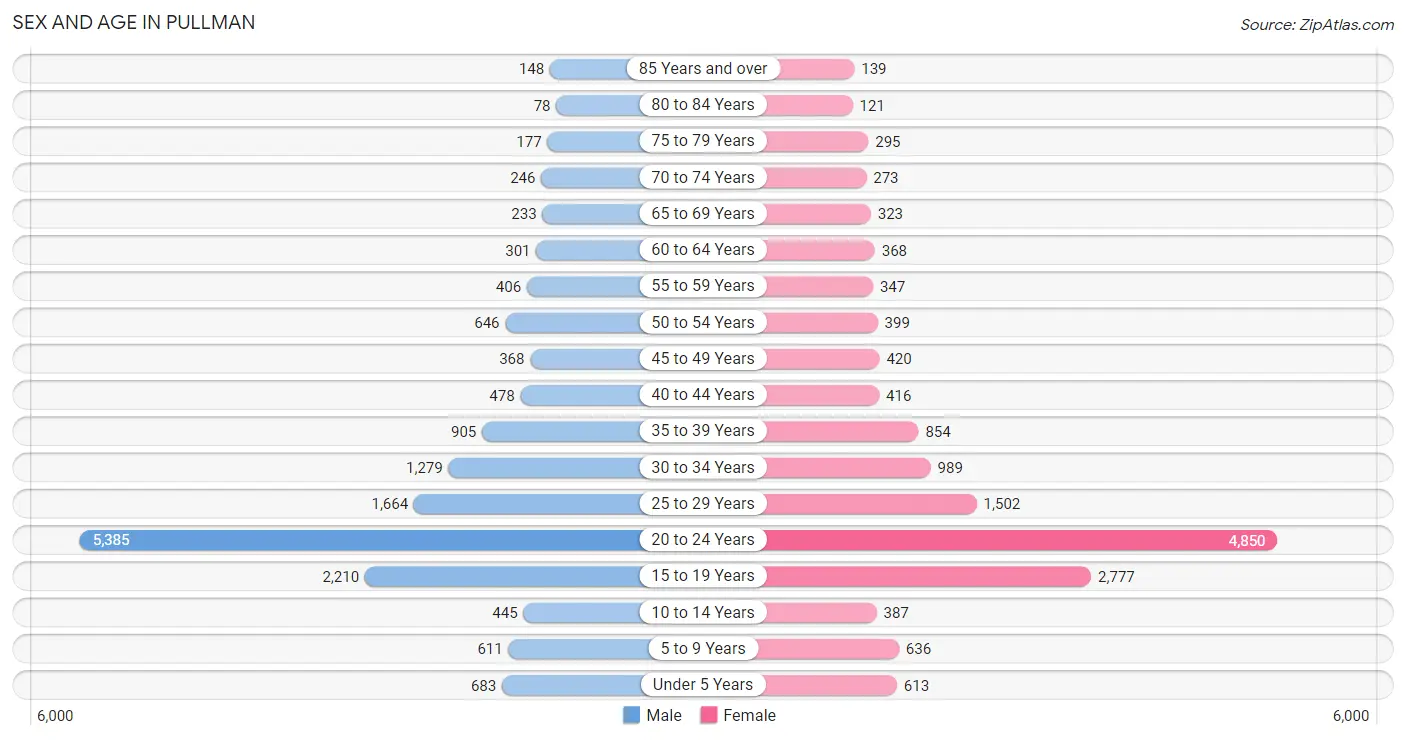
Sex and Age in Pullman
The most populous age groups in Pullman are 20 to 24 Years (5,385 | 33.1%) for men and 20 to 24 Years (4,850 | 30.9%) for women.
| Age Bracket | Male | Female |
| Under 5 Years | 683 (4.2%) | 613 (3.9%) |
| 5 to 9 Years | 611 (3.8%) | 636 (4.1%) |
| 10 to 14 Years | 445 (2.7%) | 387 (2.5%) |
| 15 to 19 Years | 2,210 (13.6%) | 2,777 (17.7%) |
| 20 to 24 Years | 5,385 (33.1%) | 4,850 (30.9%) |
| 25 to 29 Years | 1,664 (10.2%) | 1,502 (9.6%) |
| 30 to 34 Years | 1,279 (7.9%) | 989 (6.3%) |
| 35 to 39 Years | 905 (5.6%) | 854 (5.4%) |
| 40 to 44 Years | 478 (2.9%) | 416 (2.6%) |
| 45 to 49 Years | 368 (2.3%) | 420 (2.7%) |
| 50 to 54 Years | 646 (4.0%) | 399 (2.5%) |
| 55 to 59 Years | 406 (2.5%) | 347 (2.2%) |
| 60 to 64 Years | 301 (1.8%) | 368 (2.3%) |
| 65 to 69 Years | 233 (1.4%) | 323 (2.1%) |
| 70 to 74 Years | 246 (1.5%) | 273 (1.7%) |
| 75 to 79 Years | 177 (1.1%) | 295 (1.9%) |
| 80 to 84 Years | 78 (0.5%) | 121 (0.8%) |
| 85 Years and over | 148 (0.9%) | 139 (0.9%) |
| Total | 16,263 (100.0%) | 15,709 (100.0%) |
Families and Households in Pullman
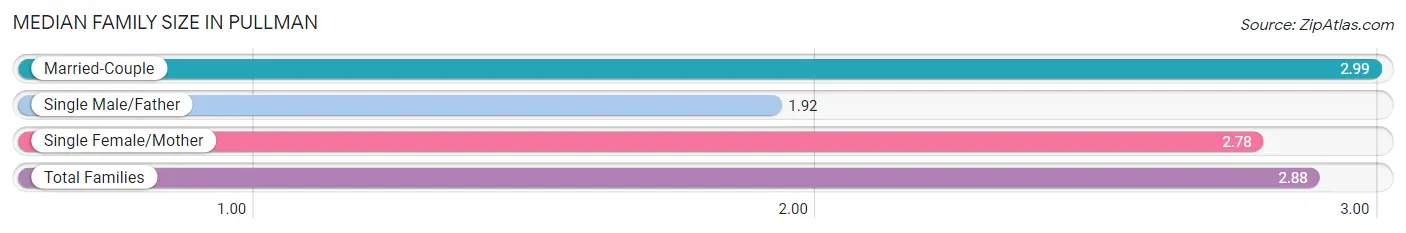
Median Family Size in Pullman
The median family size in Pullman is 2.88 persons per family, with married-couple families (3,740 | 80.1%) accounting for the largest median family size of 2.99 persons per family. On the other hand, single male/father families (358 | 7.7%) represent the smallest median family size with 1.92 persons per family.
| Family Type | # Families | Family Size |
| Married-Couple | 3,740 (80.1%) | 2.99 |
| Single Male/Father | 358 (7.7%) | 1.92 |
| Single Female/Mother | 569 (12.2%) | 2.78 |
| Total Families | 4,667 (100.0%) | 2.88 |
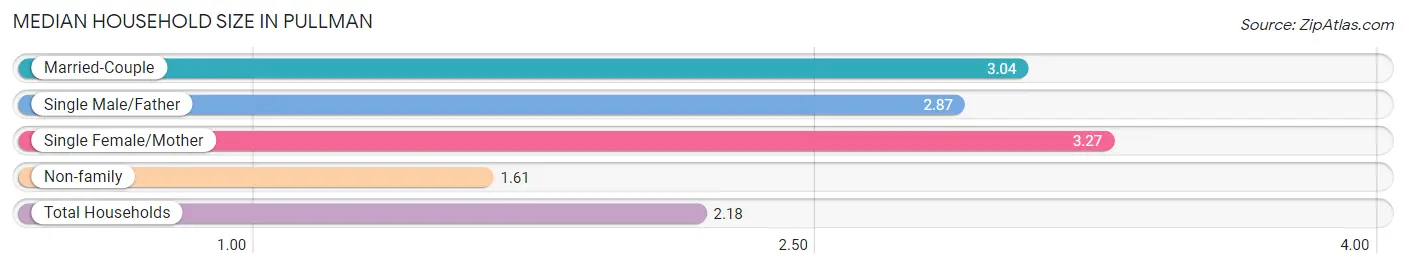
Median Household Size in Pullman
The median household size in Pullman is 2.18 persons per household, with single female/mother households (569 | 4.8%) accounting for the largest median household size of 3.27 persons per household. non-family households (7,305 | 61.0%) represent the smallest median household size with 1.61 persons per household.
| Household Type | # Households | Household Size |
| Married-Couple | 3,740 (31.2%) | 3.04 |
| Single Male/Father | 358 (3.0%) | 2.87 |
| Single Female/Mother | 569 (4.8%) | 3.27 |
| Non-family | 7,305 (61.0%) | 1.61 |
| Total Households | 11,972 (100.0%) | 2.18 |
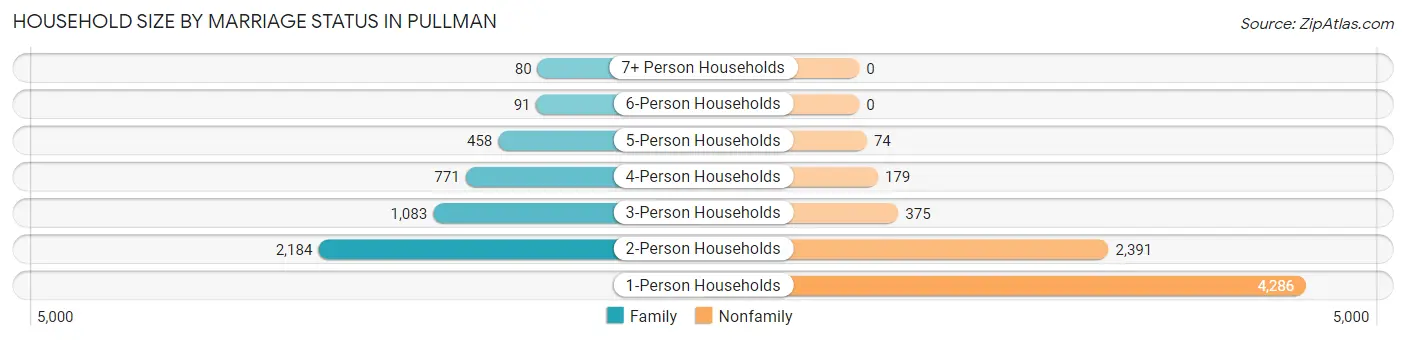
Household Size by Marriage Status in Pullman
Out of a total of 11,972 households in Pullman, 4,667 (39.0%) are family households, while 7,305 (61.0%) are nonfamily households. The most numerous type of family households are 2-person households, comprising 2,184, and the most common type of nonfamily households are 1-person households, comprising 4,286.
| Household Size | Family Households | Nonfamily Households |
| 1-Person Households | - | 4,286 (35.8%) |
| 2-Person Households | 2,184 (18.2%) | 2,391 (20.0%) |
| 3-Person Households | 1,083 (9.0%) | 375 (3.1%) |
| 4-Person Households | 771 (6.4%) | 179 (1.5%) |
| 5-Person Households | 458 (3.8%) | 74 (0.6%) |
| 6-Person Households | 91 (0.8%) | 0 (0.0%) |
| 7+ Person Households | 80 (0.7%) | 0 (0.0%) |
| Total | 4,667 (39.0%) | 7,305 (61.0%) |
Female Fertility in Pullman
Fertility by Age in Pullman
Average fertility rate in Pullman is 21.0 births per 1,000 women. Women in the age bracket of 35 to 50 years have the highest fertility rate with 40.0 births per 1,000 women. Women in the age bracket of 20 to 34 years acount for 71.7% of all women with births.
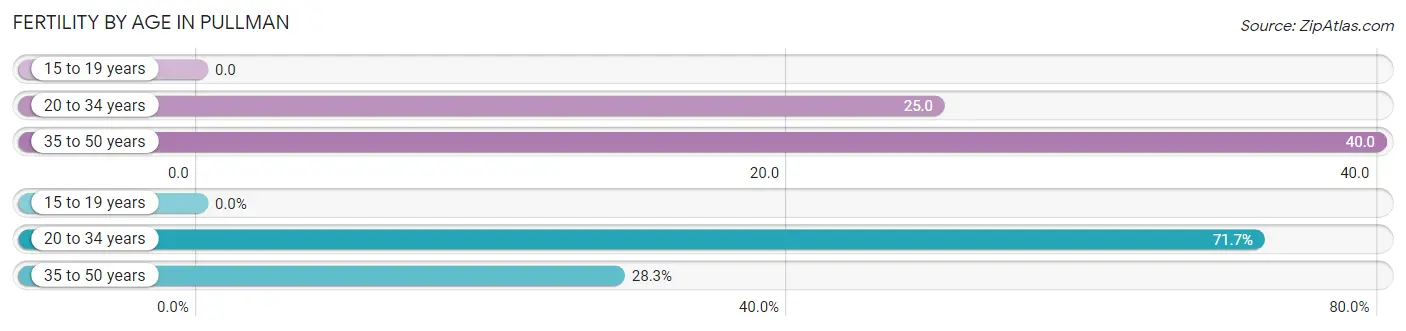
| Age Bracket | Women with Births | Births / 1,000 Women |
| 15 to 19 years | 0 (0.0%) | 0.0 |
| 20 to 34 years | 180 (71.7%) | 25.0 |
| 35 to 50 years | 71 (28.3%) | 40.0 |
| Total | 251 (100.0%) | 21.0 |
Fertility by Age by Marriage Status in Pullman
86.9% of women with births (251) in Pullman are married. The highest percentage of unmarried women with births falls into 35 to 50 years age bracket with 29.6% of them unmarried at the time of birth, while the lowest percentage of unmarried women with births belong to 20 to 34 years age bracket with 6.7% of them unmarried.
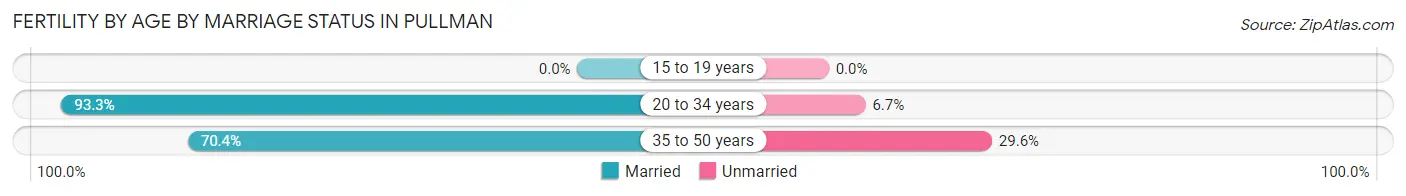
| Age Bracket | Married | Unmarried |
| 15 to 19 years | 0 (0.0%) | 0 (0.0%) |
| 20 to 34 years | 168 (93.3%) | 12 (6.7%) |
| 35 to 50 years | 50 (70.4%) | 21 (29.6%) |
| Total | 218 (86.9%) | 33 (13.2%) |
Fertility by Education in Pullman
Average fertility rate in Pullman is 21.0 births per 1,000 women. Women with the education attainment of graduate degree have the highest fertility rate of 60.0 births per 1,000 women, while women with the education attainment of college or associate's degree have the lowest fertility at 7.0 births per 1,000 women. Women with the education attainment of bachelor's degree represent 36.2% of all women with births.
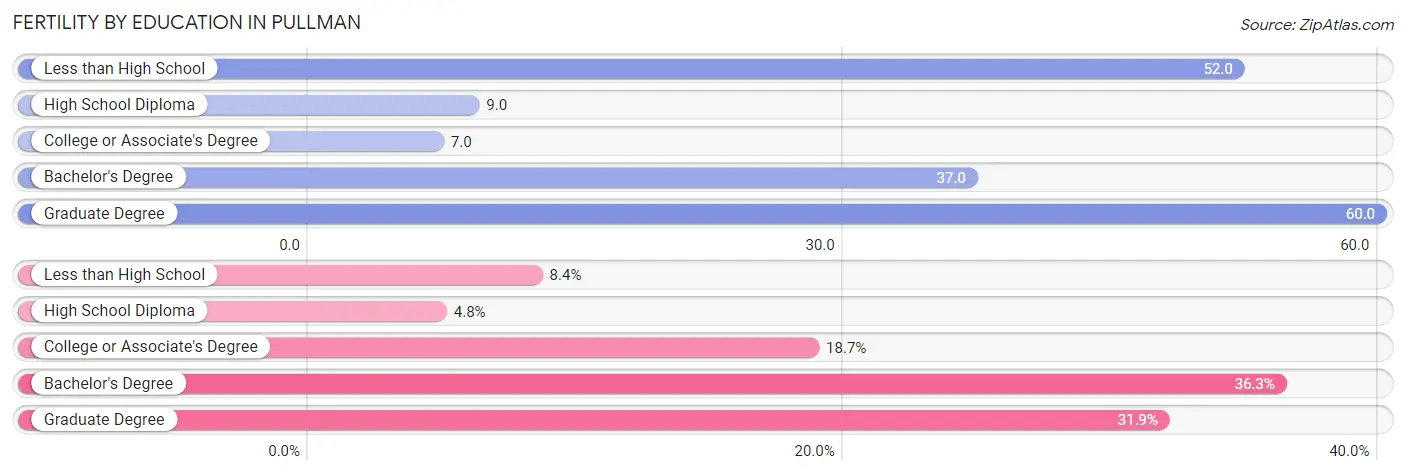
| Educational Attainment | Women with Births | Births / 1,000 Women |
| Less than High School | 21 (8.4%) | 52.0 |
| High School Diploma | 12 (4.8%) | 9.0 |
| College or Associate's Degree | 47 (18.7%) | 7.0 |
| Bachelor's Degree | 91 (36.2%) | 37.0 |
| Graduate Degree | 80 (31.9%) | 60.0 |
| Total | 251 (100.0%) | 21.0 |
Fertility by Education by Marriage Status in Pullman
13.2% of women with births in Pullman are unmarried. Women with the educational attainment of college or associate's degree are most likely to be married with 100.0% of them married at childbirth, while women with the educational attainment of less than high school are least likely to be married with 100.0% of them unmarried at childbirth.
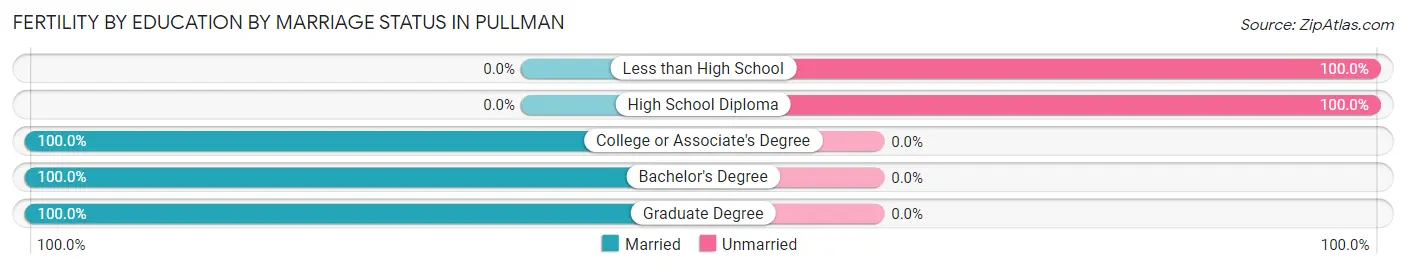
| Educational Attainment | Married | Unmarried |
| Less than High School | 0 (0.0%) | 21 (100.0%) |
| High School Diploma | 0 (0.0%) | 12 (100.0%) |
| College or Associate's Degree | 47 (100.0%) | 0 (0.0%) |
| Bachelor's Degree | 91 (100.0%) | 0 (0.0%) |
| Graduate Degree | 80 (100.0%) | 0 (0.0%) |
| Total | 218 (86.9%) | 33 (13.2%) |
Income in Pullman
Income Overview in Pullman
Per Capita Income in Pullman is $27,431, while median incomes of families and households are $88,297 and $41,479 respectively.
| Characteristic | Number | Measure |
| Per Capita Income | 31,972 | $27,431 |
| Median Family Income | 4,667 | $88,297 |
| Mean Family Income | 4,667 | $114,541 |
| Median Household Income | 11,972 | $41,479 |
| Mean Household Income | 11,972 | $69,507 |
| Income Deficit | 4,667 | $0 |
| Wage / Income Gap (%) | 31,972 | 46.36% |
| Wage / Income Gap ($) | 31,972 | 53.64¢ per $1 |
| Gini / Inequality Index | 31,972 | 0.57 |
Earnings by Sex in Pullman
Average Earnings in Pullman are $16,655, $22,808 for men and $12,234 for women, a difference of 46.4%.
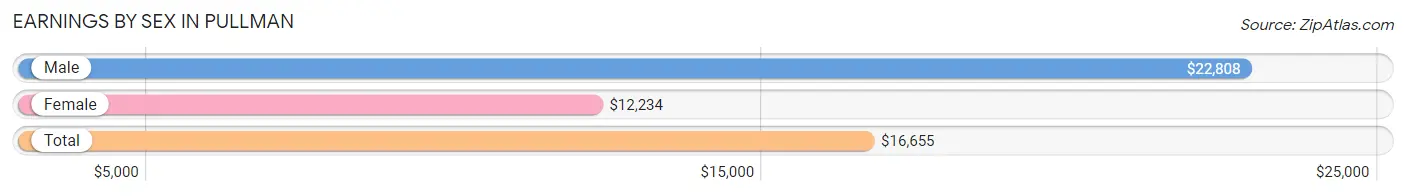
| Sex | Number | Average Earnings |
| Male | 11,281 (52.8%) | $22,808 |
| Female | 10,093 (47.2%) | $12,234 |
| Total | 21,374 (100.0%) | $16,655 |
Earnings by Sex by Income Bracket in Pullman
The most common earnings brackets in Pullman are $100,000+ for men (1,229 | 10.9%) and $2,500 to $4,999 for women (1,513 | 15.0%).
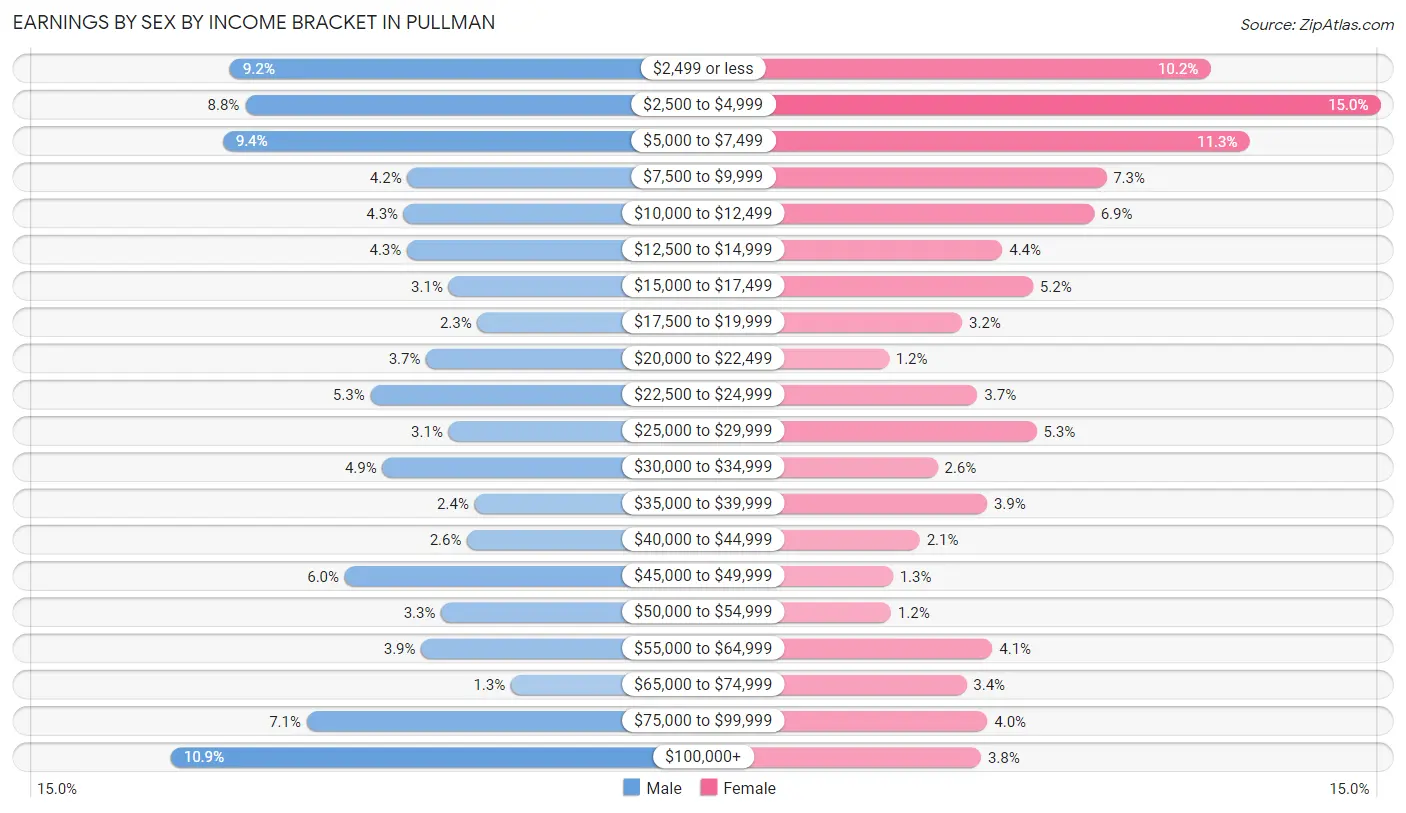
| Income | Male | Female |
| $2,499 or less | 1,041 (9.2%) | 1,030 (10.2%) |
| $2,500 to $4,999 | 993 (8.8%) | 1,513 (15.0%) |
| $5,000 to $7,499 | 1,064 (9.4%) | 1,142 (11.3%) |
| $7,500 to $9,999 | 478 (4.2%) | 736 (7.3%) |
| $10,000 to $12,499 | 490 (4.3%) | 700 (6.9%) |
| $12,500 to $14,999 | 479 (4.3%) | 441 (4.4%) |
| $15,000 to $17,499 | 348 (3.1%) | 528 (5.2%) |
| $17,500 to $19,999 | 256 (2.3%) | 327 (3.2%) |
| $20,000 to $22,499 | 418 (3.7%) | 119 (1.2%) |
| $22,500 to $24,999 | 596 (5.3%) | 370 (3.7%) |
| $25,000 to $29,999 | 348 (3.1%) | 538 (5.3%) |
| $30,000 to $34,999 | 557 (4.9%) | 257 (2.5%) |
| $35,000 to $39,999 | 265 (2.4%) | 398 (3.9%) |
| $40,000 to $44,999 | 289 (2.6%) | 207 (2.1%) |
| $45,000 to $49,999 | 677 (6.0%) | 130 (1.3%) |
| $50,000 to $54,999 | 371 (3.3%) | 125 (1.2%) |
| $55,000 to $64,999 | 434 (3.8%) | 413 (4.1%) |
| $65,000 to $74,999 | 150 (1.3%) | 339 (3.4%) |
| $75,000 to $99,999 | 798 (7.1%) | 399 (4.0%) |
| $100,000+ | 1,229 (10.9%) | 381 (3.8%) |
| Total | 11,281 (100.0%) | 10,093 (100.0%) |
Earnings by Sex by Educational Attainment in Pullman
Average earnings in Pullman are $49,825 for men and $34,730 for women, a difference of 30.3%. Men with an educational attainment of graduate degree enjoy the highest average annual earnings of $75,753, while those with high school diploma education earn the least with $40,150. Women with an educational attainment of graduate degree earn the most with the average annual earnings of $49,403, while those with college or associate's degree education have the smallest earnings of $24,101.
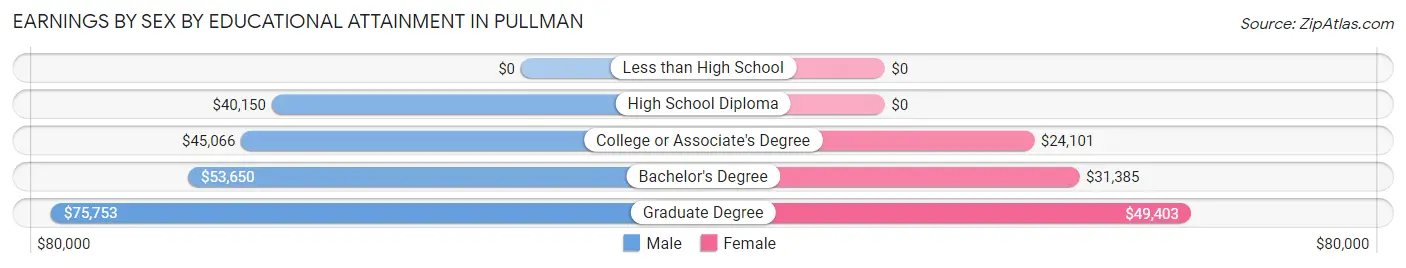
| Educational Attainment | Male Income | Female Income |
| Less than High School | - | - |
| High School Diploma | $40,150 | $0 |
| College or Associate's Degree | $45,066 | $24,101 |
| Bachelor's Degree | $53,650 | $31,385 |
| Graduate Degree | $75,753 | $49,403 |
| Total | $49,825 | $34,730 |
Family Income in Pullman
Family Income Brackets in Pullman
According to the Pullman family income data, there are 980 families falling into the $75,000 to $99,999 income range, which is the most common income bracket and makes up 21.0% of all families. Conversely, the $10,000 to $14,999 income bracket is the least frequent group with only 75 families (1.6%) belonging to this category.
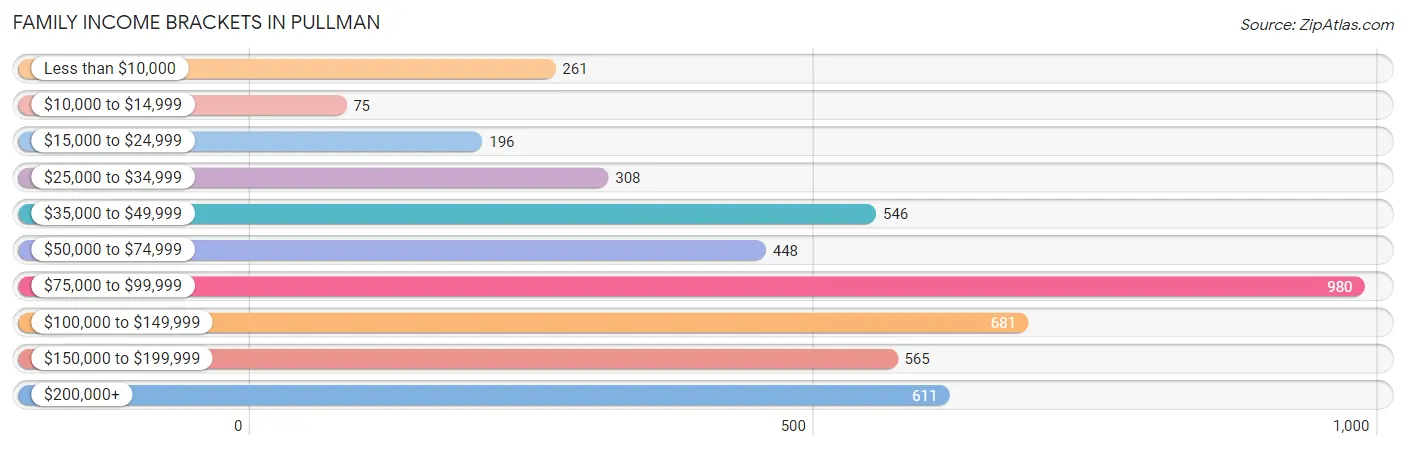
| Income Bracket | # Families | % Families |
| Less than $10,000 | 261 | 5.6% |
| $10,000 to $14,999 | 75 | 1.6% |
| $15,000 to $24,999 | 196 | 4.2% |
| $25,000 to $34,999 | 308 | 6.6% |
| $35,000 to $49,999 | 546 | 11.7% |
| $50,000 to $74,999 | 448 | 9.6% |
| $75,000 to $99,999 | 980 | 21.0% |
| $100,000 to $149,999 | 681 | 14.6% |
| $150,000 to $199,999 | 565 | 12.1% |
| $200,000+ | 611 | 13.1% |
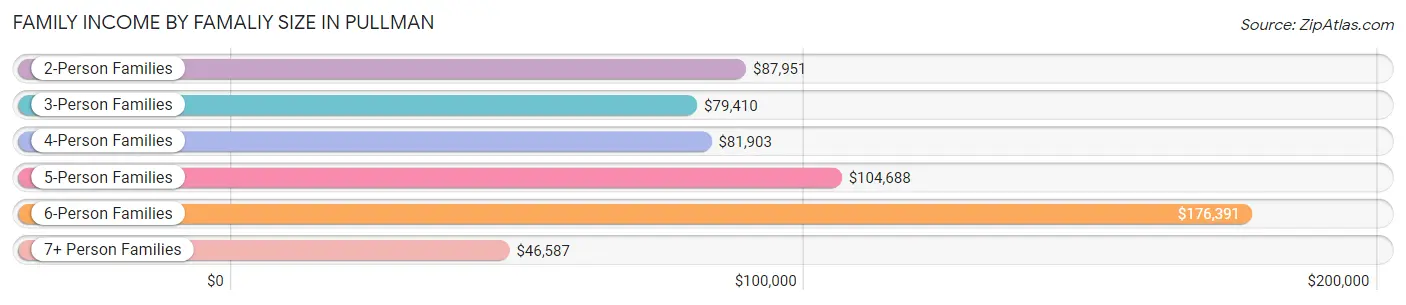
Family Income by Famaliy Size in Pullman
6-person families (91 | 1.9%) account for the highest median family income in Pullman with $176,391 per family, while 2-person families (2,585 | 55.4%) have the highest median income of $43,976 per family member.
| Income Bracket | # Families | Median Income |
| 2-Person Families | 2,585 (55.4%) | $87,951 |
| 3-Person Families | 862 (18.5%) | $79,410 |
| 4-Person Families | 672 (14.4%) | $81,903 |
| 5-Person Families | 377 (8.1%) | $104,688 |
| 6-Person Families | 91 (1.9%) | $176,391 |
| 7+ Person Families | 80 (1.7%) | $46,587 |
| Total | 4,667 (100.0%) | $88,297 |
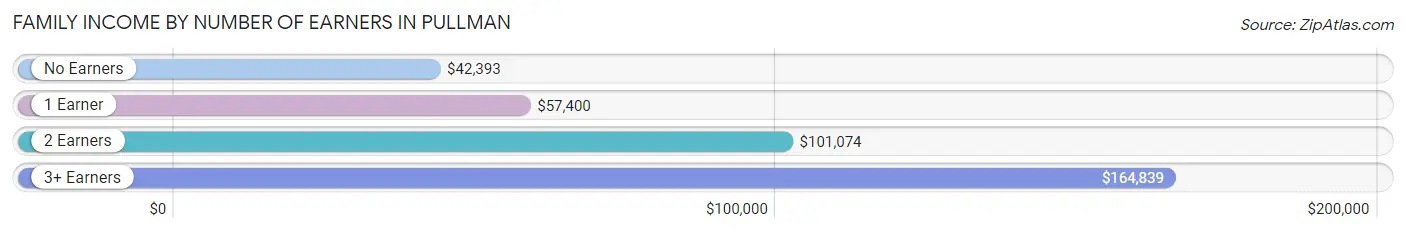
Family Income by Number of Earners in Pullman
The median family income in Pullman is $88,297, with families comprising 3+ earners (349) having the highest median family income of $164,839, while families with no earners (481) have the lowest median family income of $42,393, accounting for 7.5% and 10.3% of families, respectively.
| Number of Earners | # Families | Median Income |
| No Earners | 481 (10.3%) | $42,393 |
| 1 Earner | 1,428 (30.6%) | $57,400 |
| 2 Earners | 2,409 (51.6%) | $101,074 |
| 3+ Earners | 349 (7.5%) | $164,839 |
| Total | 4,667 (100.0%) | $88,297 |
Household Income in Pullman
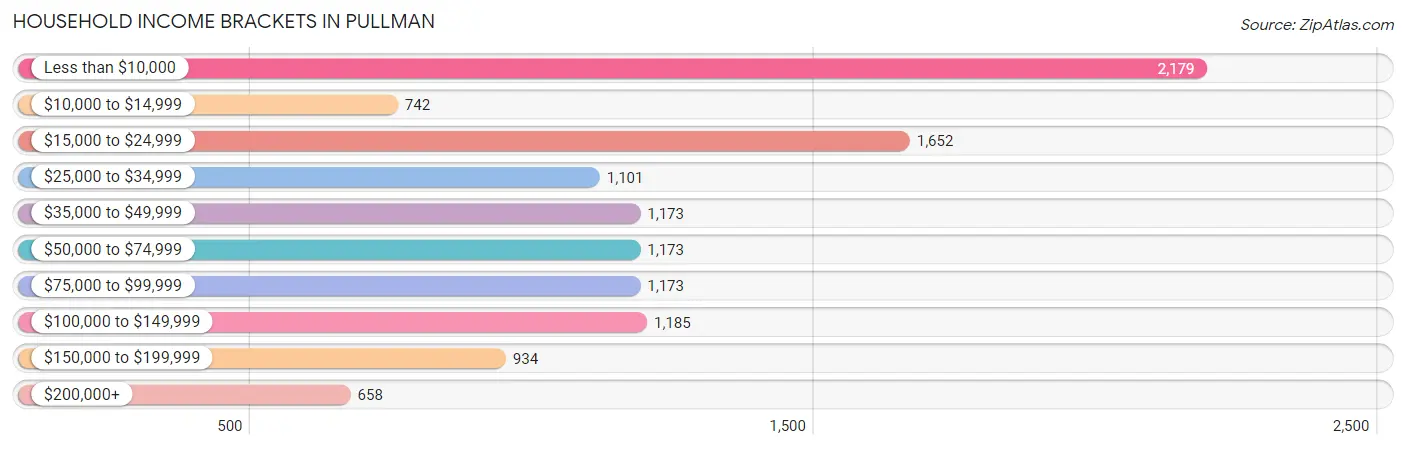
Household Income Brackets in Pullman
With 2,179 households falling in the category, the less than $10,000 income range is the most frequent in Pullman, accounting for 18.2% of all households. In contrast, only 658 households (5.5%) fall into the $200,000+ income bracket, making it the least populous group.
| Income Bracket | # Households | % Households |
| Less than $10,000 | 2,179 | 18.2% |
| $10,000 to $14,999 | 742 | 6.2% |
| $15,000 to $24,999 | 1,652 | 13.8% |
| $25,000 to $34,999 | 1,101 | 9.2% |
| $35,000 to $49,999 | 1,173 | 9.8% |
| $50,000 to $74,999 | 1,173 | 9.8% |
| $75,000 to $99,999 | 1,173 | 9.8% |
| $100,000 to $149,999 | 1,185 | 9.9% |
| $150,000 to $199,999 | 934 | 7.8% |
| $200,000+ | 658 | 5.5% |
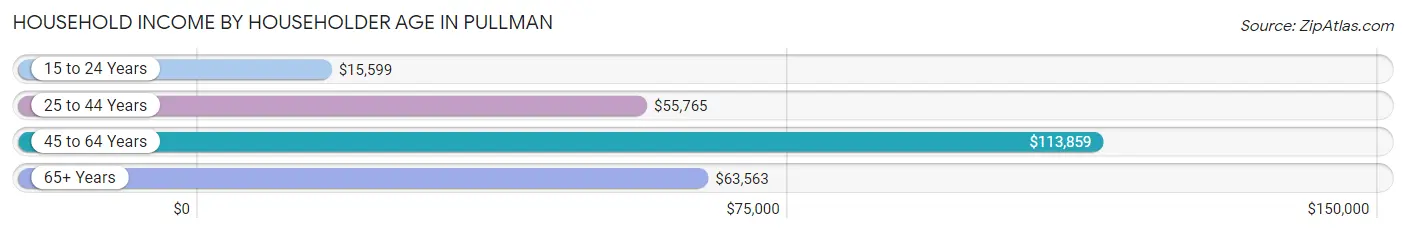
Household Income by Householder Age in Pullman
The median household income in Pullman is $41,479, with the highest median household income of $113,859 found in the 45 to 64 years age bracket for the primary householder. A total of 1,997 households (16.7%) fall into this category. Meanwhile, the 15 to 24 years age bracket for the primary householder has the lowest median household income of $15,599, with 4,255 households (35.5%) in this group.
| Income Bracket | # Households | Median Income |
| 15 to 24 Years | 4,255 (35.5%) | $15,599 |
| 25 to 44 Years | 4,490 (37.5%) | $55,765 |
| 45 to 64 Years | 1,997 (16.7%) | $113,859 |
| 65+ Years | 1,230 (10.3%) | $63,563 |
| Total | 11,972 (100.0%) | $41,479 |
Poverty in Pullman
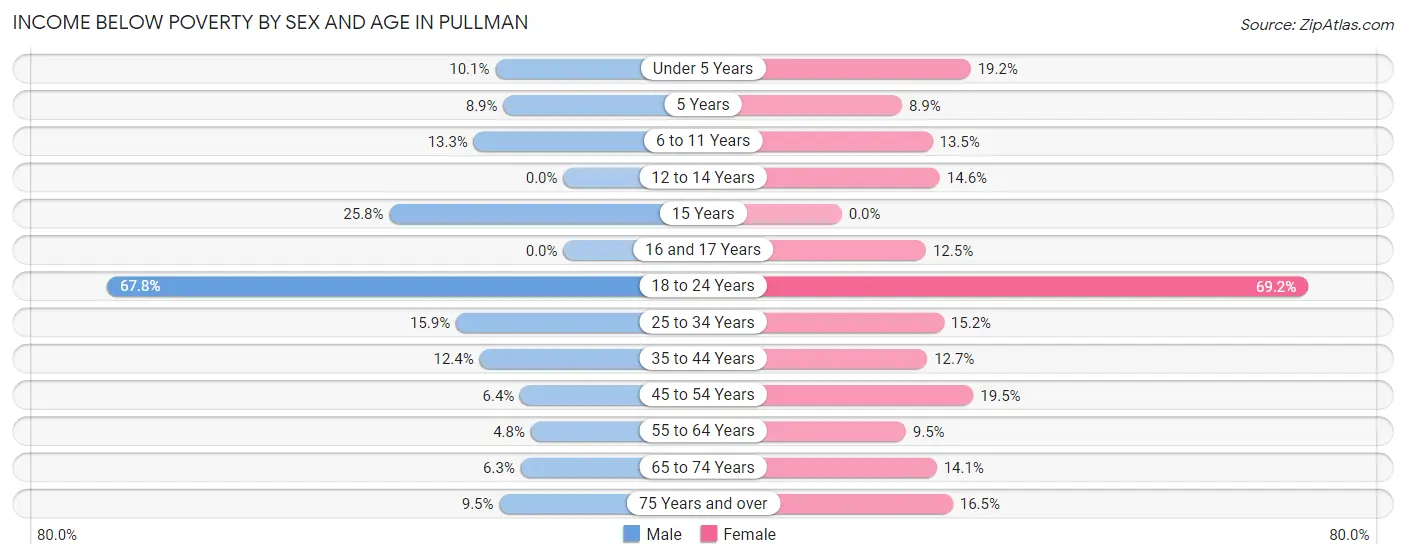
Income Below Poverty by Sex and Age in Pullman
With 31.5% poverty level for males and 33.4% for females among the residents of Pullman, 18 to 24 year old males and 18 to 24 year old females are the most vulnerable to poverty, with 3,283 males (67.7%) and 2,971 females (69.2%) in their respective age groups living below the poverty level.
| Age Bracket | Male | Female |
| Under 5 Years | 69 (10.1%) | 113 (19.2%) |
| 5 Years | 9 (8.9%) | 5 (8.9%) |
| 6 to 11 Years | 94 (13.3%) | 110 (13.5%) |
| 12 to 14 Years | 0 (0.0%) | 22 (14.6%) |
| 15 Years | 23 (25.8%) | 0 (0.0%) |
| 16 and 17 Years | 0 (0.0%) | 23 (12.5%) |
| 18 to 24 Years | 3,283 (67.7%) | 2,971 (69.2%) |
| 25 to 34 Years | 461 (15.9%) | 358 (15.2%) |
| 35 to 44 Years | 172 (12.4%) | 161 (12.7%) |
| 45 to 54 Years | 65 (6.4%) | 160 (19.5%) |
| 55 to 64 Years | 34 (4.8%) | 68 (9.5%) |
| 65 to 74 Years | 30 (6.3%) | 84 (14.1%) |
| 75 Years and over | 34 (9.5%) | 86 (16.5%) |
| Total | 4,274 (31.5%) | 4,161 (33.4%) |
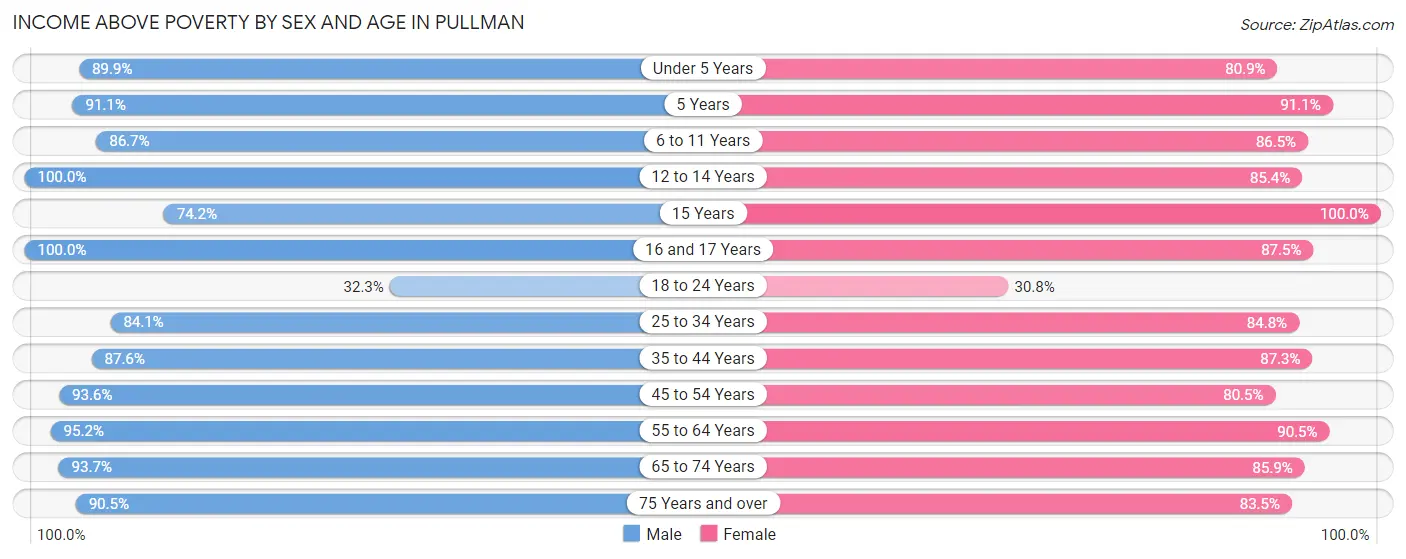
Income Above Poverty by Sex and Age in Pullman
According to the poverty statistics in Pullman, males aged 12 to 14 years and females aged 15 years are the age groups that are most secure financially, with 100.0% of males and 100.0% of females in these age groups living above the poverty line.
| Age Bracket | Male | Female |
| Under 5 Years | 614 (89.9%) | 477 (80.8%) |
| 5 Years | 92 (91.1%) | 51 (91.1%) |
| 6 to 11 Years | 612 (86.7%) | 706 (86.5%) |
| 12 to 14 Years | 205 (100.0%) | 129 (85.4%) |
| 15 Years | 66 (74.2%) | 99 (100.0%) |
| 16 and 17 Years | 123 (100.0%) | 161 (87.5%) |
| 18 to 24 Years | 1,563 (32.3%) | 1,320 (30.8%) |
| 25 to 34 Years | 2,432 (84.1%) | 2,003 (84.8%) |
| 35 to 44 Years | 1,211 (87.6%) | 1,109 (87.3%) |
| 45 to 54 Years | 949 (93.6%) | 659 (80.5%) |
| 55 to 64 Years | 668 (95.2%) | 647 (90.5%) |
| 65 to 74 Years | 444 (93.7%) | 512 (85.9%) |
| 75 Years and over | 324 (90.5%) | 436 (83.5%) |
| Total | 9,303 (68.5%) | 8,309 (66.6%) |
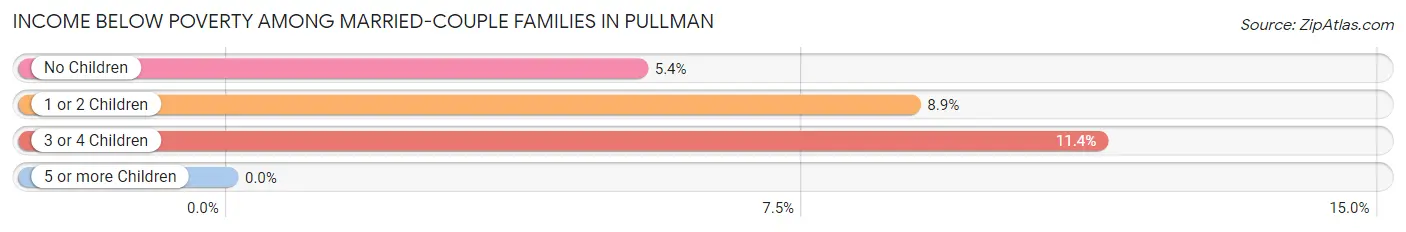
Income Below Poverty Among Married-Couple Families in Pullman
The poverty statistics for married-couple families in Pullman show that 6.8% or 254 of the total 3,740 families live below the poverty line. Families with 3 or 4 children have the highest poverty rate of 11.4%, comprising of 30 families. On the other hand, families with 5 or more children have the lowest poverty rate of 0.0%, which includes 0 families.
| Children | Above Poverty | Below Poverty |
| No Children | 2,088 (94.7%) | 118 (5.3%) |
| 1 or 2 Children | 1,084 (91.1%) | 106 (8.9%) |
| 3 or 4 Children | 234 (88.6%) | 30 (11.4%) |
| 5 or more Children | 80 (100.0%) | 0 (0.0%) |
| Total | 3,486 (93.2%) | 254 (6.8%) |
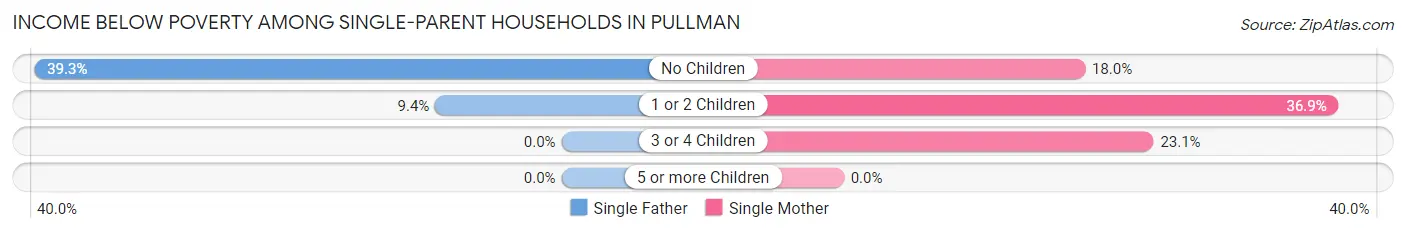
Income Below Poverty Among Single-Parent Households in Pullman
According to the poverty data in Pullman, 13.7% or 49 single-father households and 29.7% or 169 single-mother households are living below the poverty line. Among single-father households, those with no children have the highest poverty rate, with 22 households (39.3%) experiencing poverty. Likewise, among single-mother households, those with 1 or 2 children have the highest poverty rate, with 125 households (36.9%) falling below the poverty line.
| Children | Single Father | Single Mother |
| No Children | 22 (39.3%) | 32 (18.0%) |
| 1 or 2 Children | 27 (9.4%) | 125 (36.9%) |
| 3 or 4 Children | 0 (0.0%) | 12 (23.1%) |
| 5 or more Children | 0 (0.0%) | 0 (0.0%) |
| Total | 49 (13.7%) | 169 (29.7%) |
Income Below Poverty Among Married-Couple vs Single-Parent Households in Pullman
The poverty data for Pullman shows that 254 of the married-couple family households (6.8%) and 218 of the single-parent households (23.5%) are living below the poverty level. Within the married-couple family households, those with 3 or 4 children have the highest poverty rate, with 30 households (11.4%) falling below the poverty line. Among the single-parent households, those with 1 or 2 children have the highest poverty rate, with 152 household (24.3%) living below poverty.
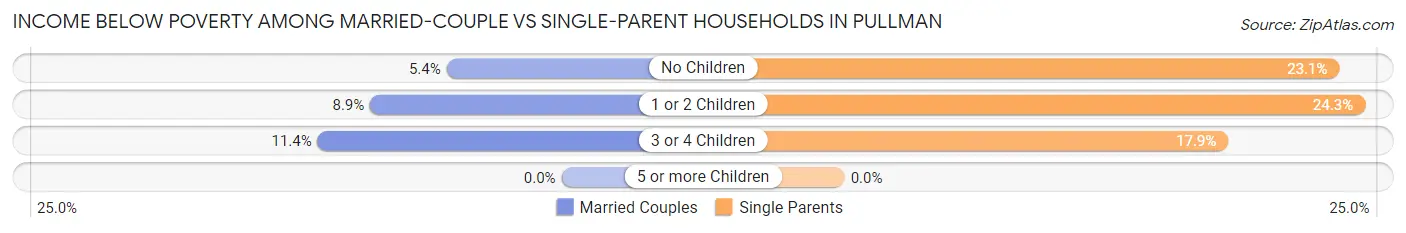
| Children | Married-Couple Families | Single-Parent Households |
| No Children | 118 (5.3%) | 54 (23.1%) |
| 1 or 2 Children | 106 (8.9%) | 152 (24.3%) |
| 3 or 4 Children | 30 (11.4%) | 12 (17.9%) |
| 5 or more Children | 0 (0.0%) | 0 (0.0%) |
| Total | 254 (6.8%) | 218 (23.5%) |
Employment Characteristics in Pullman
Employment by Class of Employer in Pullman
Among the 15,644 employed individuals in Pullman, private company employees (7,644 | 48.9%), state government employees (5,197 | 33.2%), and not-for-profit organizations (980 | 6.3%) make up the most common classes of employment.
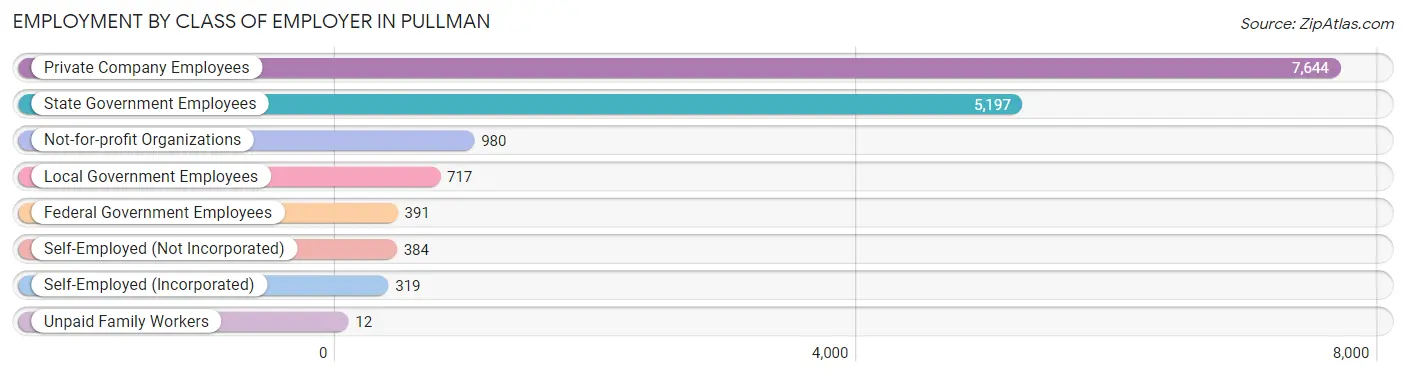
| Employer Class | # Employees | % Employees |
| Private Company Employees | 7,644 | 48.9% |
| Self-Employed (Incorporated) | 319 | 2.0% |
| Self-Employed (Not Incorporated) | 384 | 2.5% |
| Not-for-profit Organizations | 980 | 6.3% |
| Local Government Employees | 717 | 4.6% |
| State Government Employees | 5,197 | 33.2% |
| Federal Government Employees | 391 | 2.5% |
| Unpaid Family Workers | 12 | 0.1% |
| Total | 15,644 | 100.0% |
Employment Status by Age in Pullman
According to the labor force statistics for Pullman, out of the total population over 16 years of age (28,409), 61.4% or 17,443 individuals are in the labor force, with 7.8% or 1,361 of them unemployed. The age group with the highest labor force participation rate is 55 to 59 years, with 86.3% or 650 individuals in the labor force. Within the labor force, the 16 to 19 years age range has the highest percentage of unemployed individuals, with 23.6% or 411 of them being unemployed.
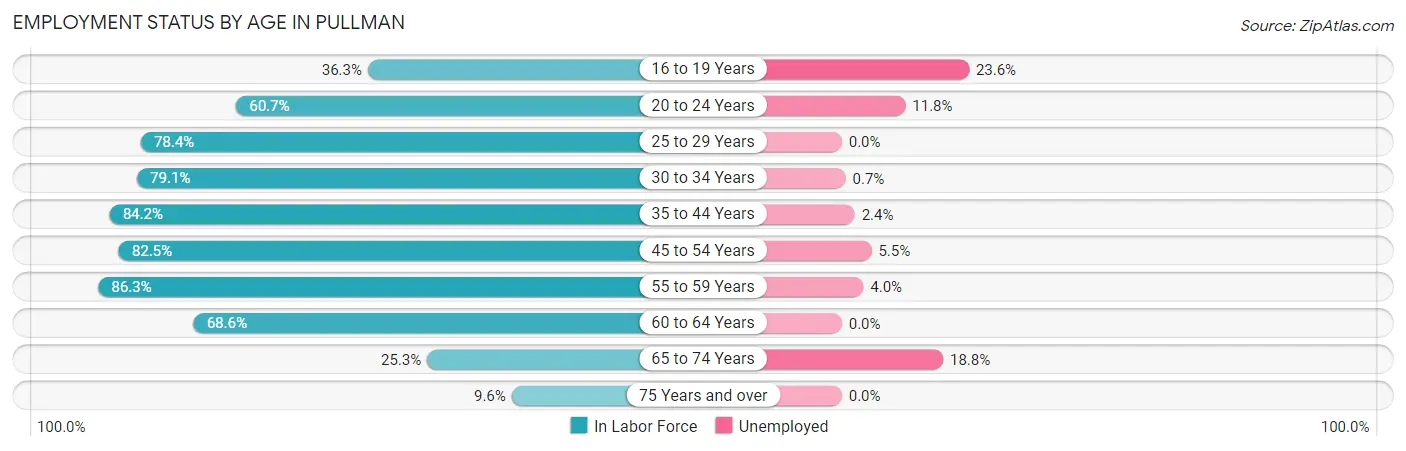
| Age Bracket | In Labor Force | Unemployed |
| 16 to 19 Years | 1,742 (36.3%) | 411 (23.6%) |
| 20 to 24 Years | 6,213 (60.7%) | 733 (11.8%) |
| 25 to 29 Years | 2,482 (78.4%) | 0 (0.0%) |
| 30 to 34 Years | 1,794 (79.1%) | 13 (0.7%) |
| 35 to 44 Years | 2,234 (84.2%) | 54 (2.4%) |
| 45 to 54 Years | 1,512 (82.5%) | 83 (5.5%) |
| 55 to 59 Years | 650 (86.3%) | 26 (4.0%) |
| 60 to 64 Years | 459 (68.6%) | 0 (0.0%) |
| 65 to 74 Years | 272 (25.3%) | 51 (18.8%) |
| 75 Years and over | 92 (9.6%) | 0 (0.0%) |
| Total | 17,443 (61.4%) | 1,361 (7.8%) |
Employment Status by Educational Attainment in Pullman
According to labor force statistics for Pullman, 80.5% of individuals (9,130) out of the total population between 25 and 64 years of age (11,342) are in the labor force, with 1.9% or 173 of them being unemployed. The group with the highest labor force participation rate are those with the educational attainment of high school diploma, with 90.1% or 707 individuals in the labor force. Within the labor force, individuals with less than high school education have the highest percentage of unemployment, with 33.3% or 29 of them being unemployed.
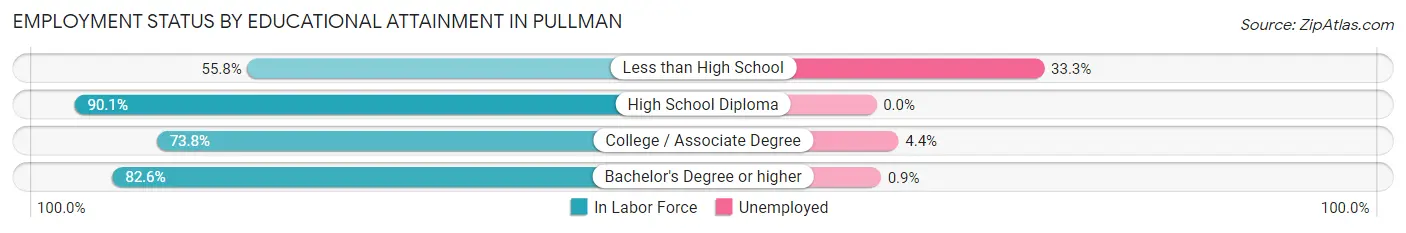
| Educational Attainment | In Labor Force | Unemployed |
| Less than High School | 87 (55.8%) | 52 (33.3%) |
| High School Diploma | 707 (90.1%) | 0 (0.0%) |
| College / Associate Degree | 2,092 (73.8%) | 125 (4.4%) |
| Bachelor's Degree or higher | 6,250 (82.6%) | 68 (0.9%) |
| Total | 9,130 (80.5%) | 215 (1.9%) |
Employment Occupations by Sex in Pullman
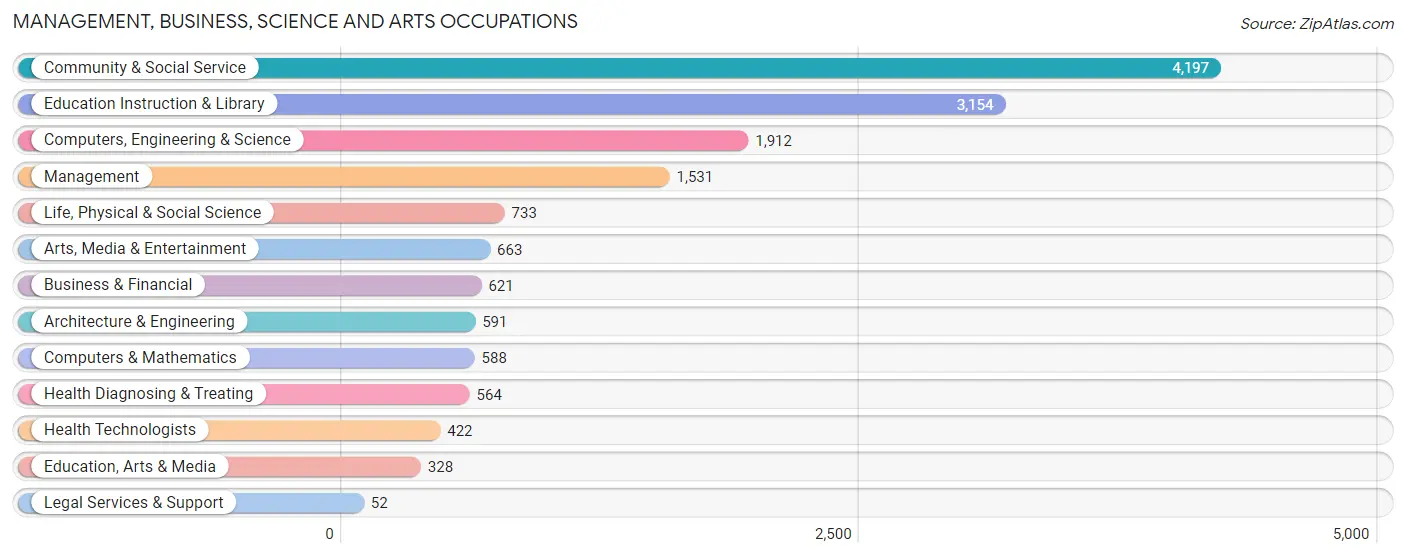
Management, Business, Science and Arts Occupations
The most common Management, Business, Science and Arts occupations in Pullman are Community & Social Service (4,197 | 26.2%), Education Instruction & Library (3,154 | 19.7%), Computers, Engineering & Science (1,912 | 12.0%), Management (1,531 | 9.6%), and Life, Physical & Social Science (733 | 4.6%).
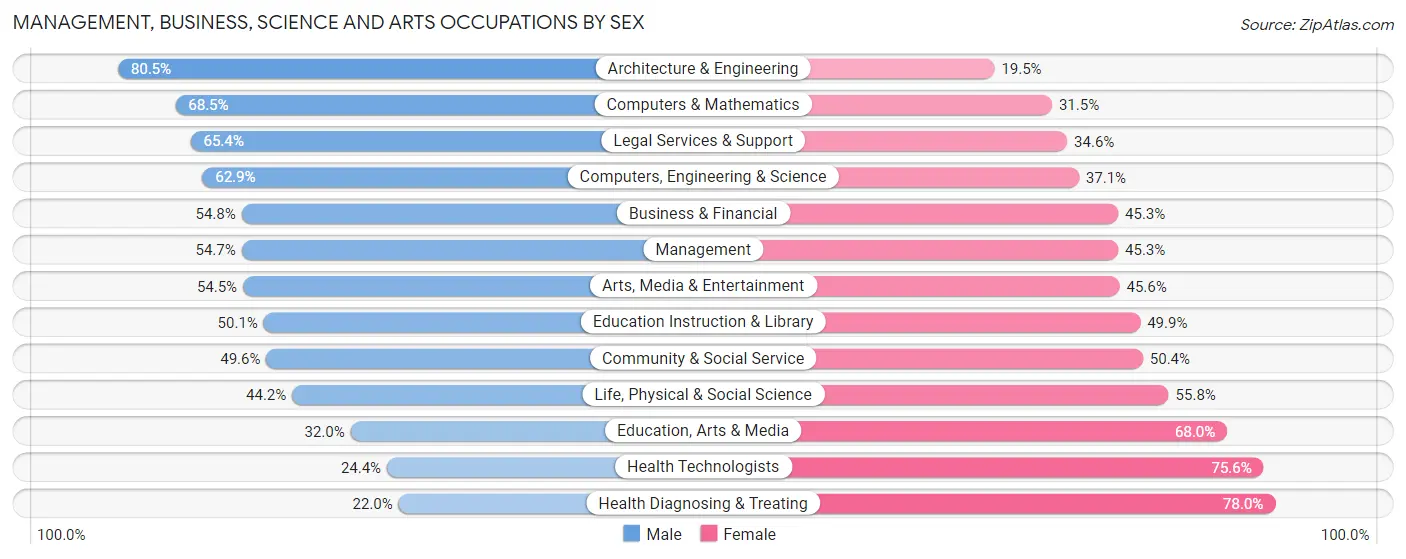
Management, Business, Science and Arts Occupations by Sex
Within the Management, Business, Science and Arts occupations in Pullman, the most male-oriented occupations are Architecture & Engineering (80.5%), Computers & Mathematics (68.5%), and Legal Services & Support (65.4%), while the most female-oriented occupations are Health Diagnosing & Treating (78.0%), Health Technologists (75.6%), and Education, Arts & Media (68.0%).
| Occupation | Male | Female |
| Management | 838 (54.7%) | 693 (45.3%) |
| Business & Financial | 340 (54.7%) | 281 (45.3%) |
| Computers, Engineering & Science | 1,203 (62.9%) | 709 (37.1%) |
| Computers & Mathematics | 403 (68.5%) | 185 (31.5%) |
| Architecture & Engineering | 476 (80.5%) | 115 (19.5%) |
| Life, Physical & Social Science | 324 (44.2%) | 409 (55.8%) |
| Community & Social Service | 2,081 (49.6%) | 2,116 (50.4%) |
| Education, Arts & Media | 105 (32.0%) | 223 (68.0%) |
| Legal Services & Support | 34 (65.4%) | 18 (34.6%) |
| Education Instruction & Library | 1,581 (50.1%) | 1,573 (49.9%) |
| Arts, Media & Entertainment | 361 (54.4%) | 302 (45.6%) |
| Health Diagnosing & Treating | 124 (22.0%) | 440 (78.0%) |
| Health Technologists | 103 (24.4%) | 319 (75.6%) |
| Total (Category) | 4,586 (52.0%) | 4,239 (48.0%) |
| Total (Overall) | 8,470 (53.0%) | 7,523 (47.0%) |
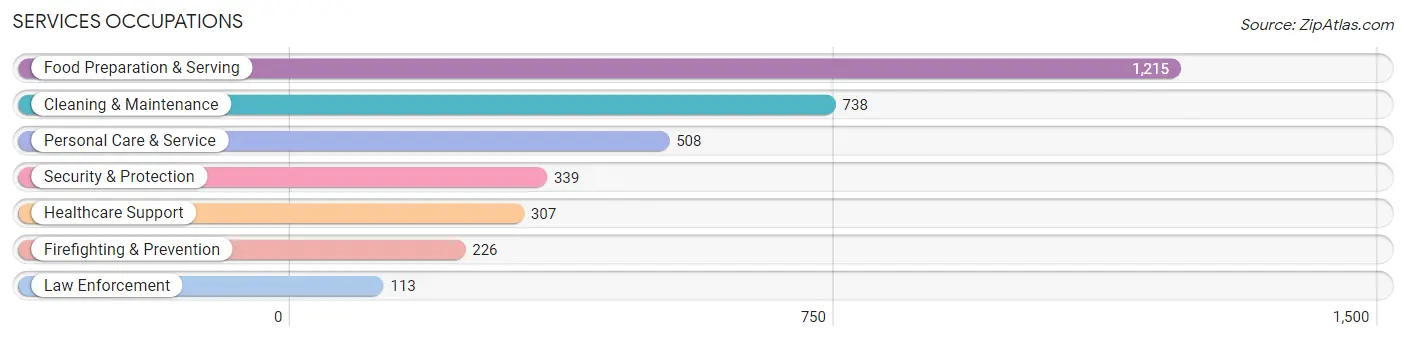
Services Occupations
The most common Services occupations in Pullman are Food Preparation & Serving (1,215 | 7.6%), Cleaning & Maintenance (738 | 4.6%), Personal Care & Service (508 | 3.2%), Security & Protection (339 | 2.1%), and Healthcare Support (307 | 1.9%).
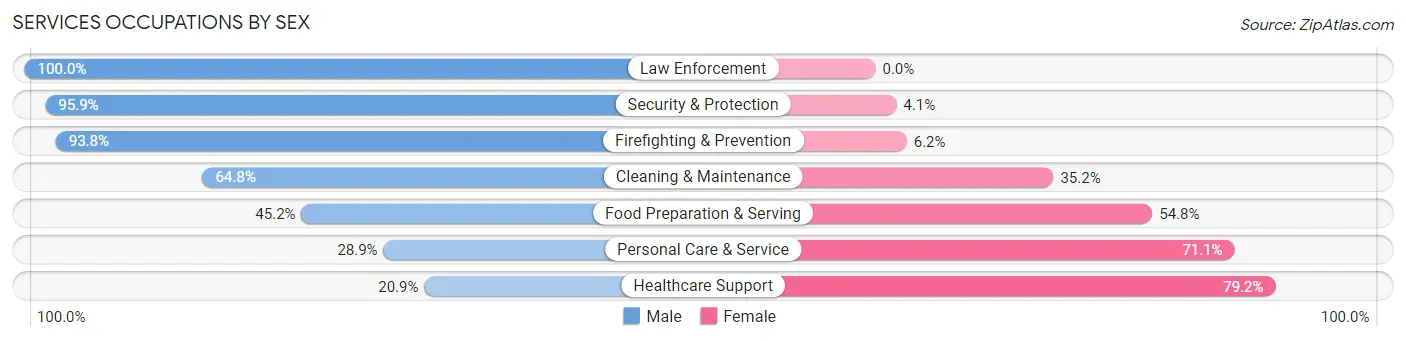
Services Occupations by Sex
Within the Services occupations in Pullman, the most male-oriented occupations are Law Enforcement (100.0%), Security & Protection (95.9%), and Firefighting & Prevention (93.8%), while the most female-oriented occupations are Healthcare Support (79.1%), Personal Care & Service (71.1%), and Food Preparation & Serving (54.8%).
| Occupation | Male | Female |
| Healthcare Support | 64 (20.8%) | 243 (79.1%) |
| Security & Protection | 325 (95.9%) | 14 (4.1%) |
| Firefighting & Prevention | 212 (93.8%) | 14 (6.2%) |
| Law Enforcement | 113 (100.0%) | 0 (0.0%) |
| Food Preparation & Serving | 549 (45.2%) | 666 (54.8%) |
| Cleaning & Maintenance | 478 (64.8%) | 260 (35.2%) |
| Personal Care & Service | 147 (28.9%) | 361 (71.1%) |
| Total (Category) | 1,563 (50.3%) | 1,544 (49.7%) |
| Total (Overall) | 8,470 (53.0%) | 7,523 (47.0%) |
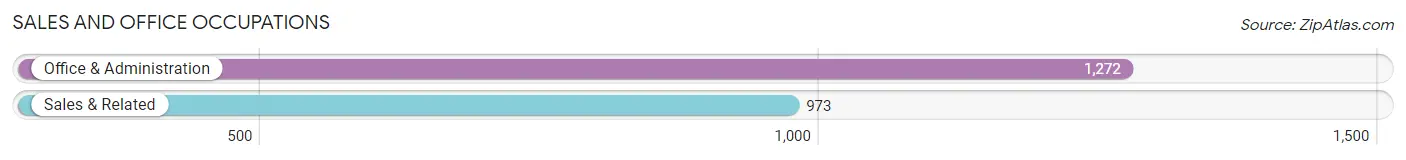
Sales and Office Occupations
The most common Sales and Office occupations in Pullman are Office & Administration (1,272 | 8.0%), and Sales & Related (973 | 6.1%).
Sales and Office Occupations by Sex
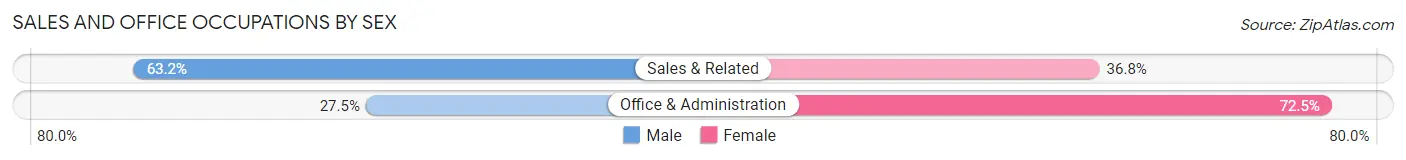
| Occupation | Male | Female |
| Sales & Related | 615 (63.2%) | 358 (36.8%) |
| Office & Administration | 350 (27.5%) | 922 (72.5%) |
| Total (Category) | 965 (43.0%) | 1,280 (57.0%) |
| Total (Overall) | 8,470 (53.0%) | 7,523 (47.0%) |
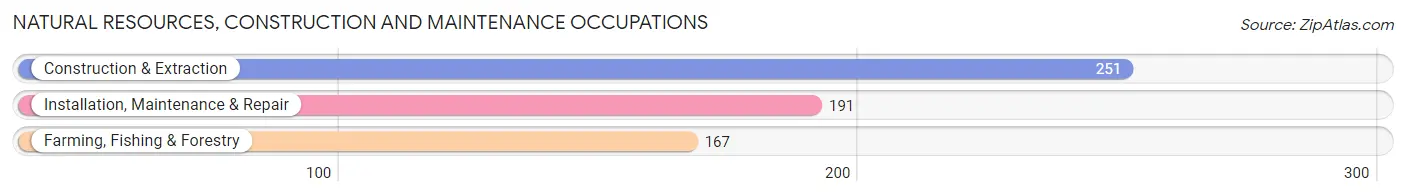
Natural Resources, Construction and Maintenance Occupations
The most common Natural Resources, Construction and Maintenance occupations in Pullman are Construction & Extraction (251 | 1.6%), Installation, Maintenance & Repair (191 | 1.2%), and Farming, Fishing & Forestry (167 | 1.0%).
Natural Resources, Construction and Maintenance Occupations by Sex
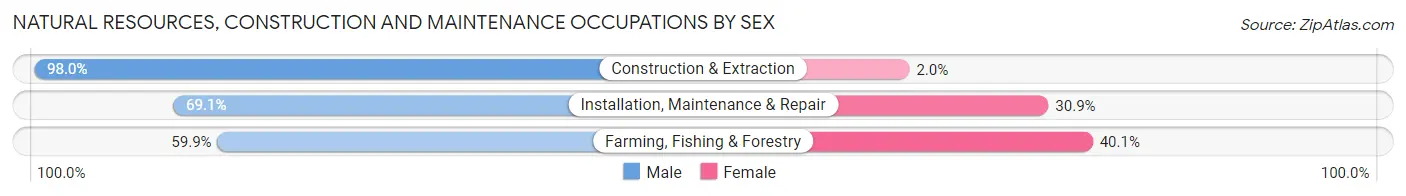
| Occupation | Male | Female |
| Farming, Fishing & Forestry | 100 (59.9%) | 67 (40.1%) |
| Construction & Extraction | 246 (98.0%) | 5 (2.0%) |
| Installation, Maintenance & Repair | 132 (69.1%) | 59 (30.9%) |
| Total (Category) | 478 (78.5%) | 131 (21.5%) |
| Total (Overall) | 8,470 (53.0%) | 7,523 (47.0%) |
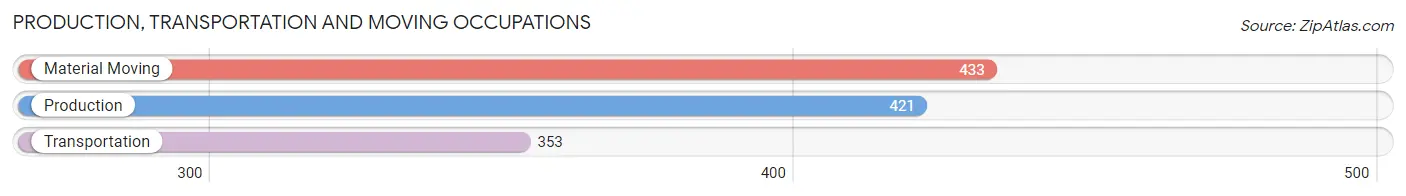
Production, Transportation and Moving Occupations
The most common Production, Transportation and Moving occupations in Pullman are Material Moving (433 | 2.7%), Production (421 | 2.6%), and Transportation (353 | 2.2%).
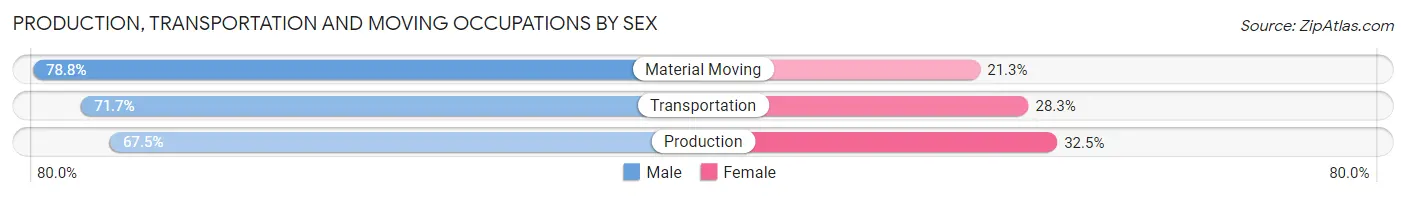
Production, Transportation and Moving Occupations by Sex
| Occupation | Male | Female |
| Production | 284 (67.5%) | 137 (32.5%) |
| Transportation | 253 (71.7%) | 100 (28.3%) |
| Material Moving | 341 (78.7%) | 92 (21.2%) |
| Total (Category) | 878 (72.7%) | 329 (27.3%) |
| Total (Overall) | 8,470 (53.0%) | 7,523 (47.0%) |
Employment Industries by Sex in Pullman
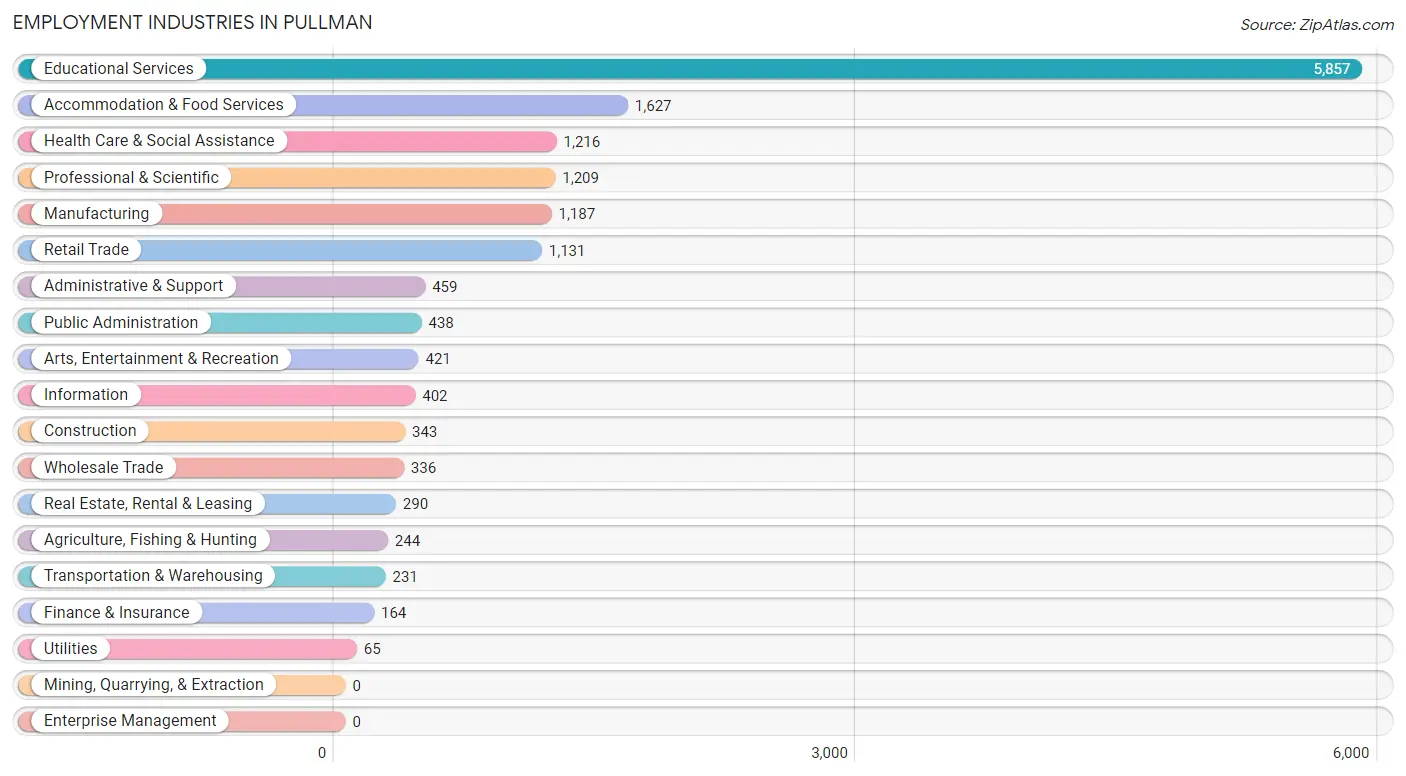
Employment Industries in Pullman
The major employment industries in Pullman include Educational Services (5,857 | 36.6%), Accommodation & Food Services (1,627 | 10.2%), Health Care & Social Assistance (1,216 | 7.6%), Professional & Scientific (1,209 | 7.6%), and Manufacturing (1,187 | 7.4%).
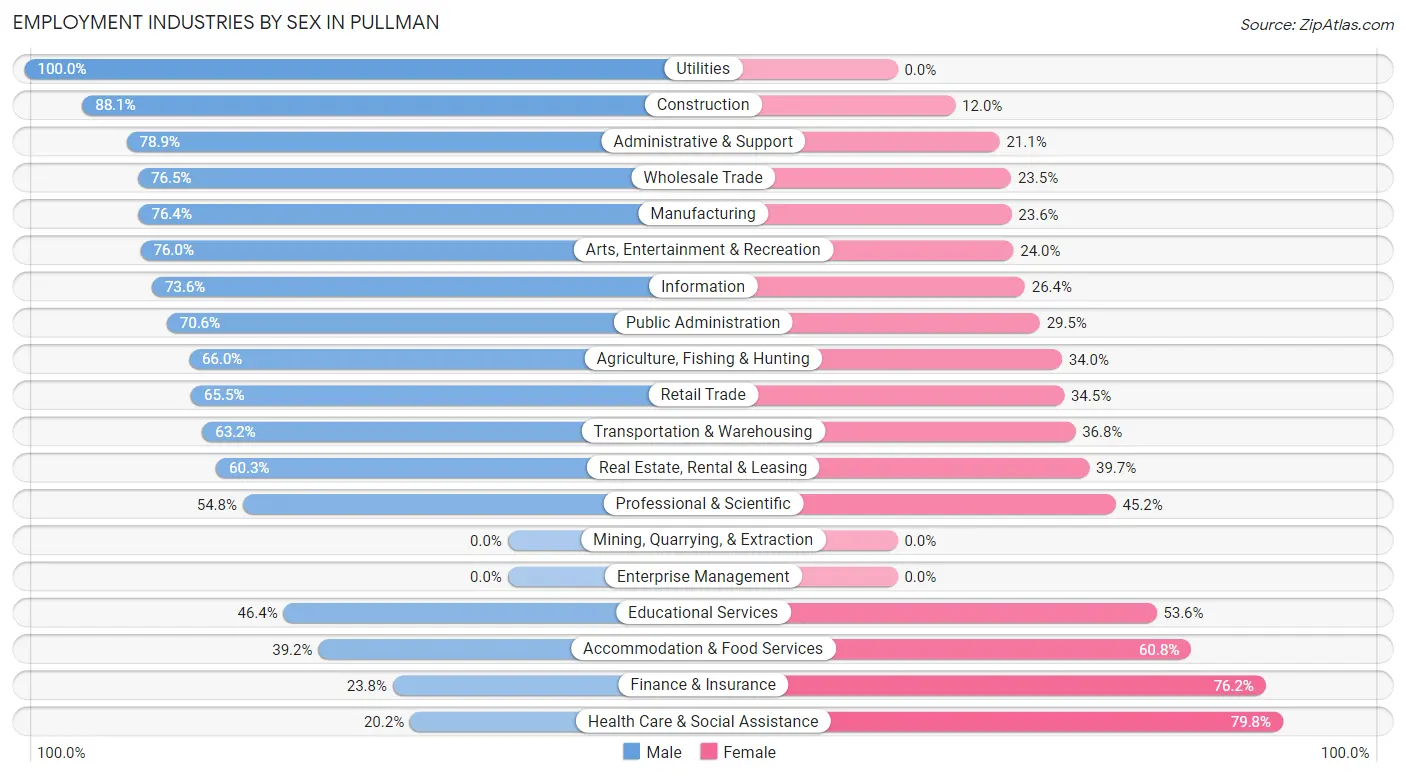
Employment Industries by Sex in Pullman
The Pullman industries that see more men than women are Utilities (100.0%), Construction (88.0%), and Administrative & Support (78.9%), whereas the industries that tend to have a higher number of women are Health Care & Social Assistance (79.8%), Finance & Insurance (76.2%), and Accommodation & Food Services (60.8%).
| Industry | Male | Female |
| Agriculture, Fishing & Hunting | 161 (66.0%) | 83 (34.0%) |
| Mining, Quarrying, & Extraction | 0 (0.0%) | 0 (0.0%) |
| Construction | 302 (88.0%) | 41 (11.9%) |
| Manufacturing | 907 (76.4%) | 280 (23.6%) |
| Wholesale Trade | 257 (76.5%) | 79 (23.5%) |
| Retail Trade | 741 (65.5%) | 390 (34.5%) |
| Transportation & Warehousing | 146 (63.2%) | 85 (36.8%) |
| Utilities | 65 (100.0%) | 0 (0.0%) |
| Information | 296 (73.6%) | 106 (26.4%) |
| Finance & Insurance | 39 (23.8%) | 125 (76.2%) |
| Real Estate, Rental & Leasing | 175 (60.3%) | 115 (39.7%) |
| Professional & Scientific | 663 (54.8%) | 546 (45.2%) |
| Enterprise Management | 0 (0.0%) | 0 (0.0%) |
| Administrative & Support | 362 (78.9%) | 97 (21.1%) |
| Educational Services | 2,718 (46.4%) | 3,139 (53.6%) |
| Health Care & Social Assistance | 246 (20.2%) | 970 (79.8%) |
| Arts, Entertainment & Recreation | 320 (76.0%) | 101 (24.0%) |
| Accommodation & Food Services | 638 (39.2%) | 989 (60.8%) |
| Public Administration | 309 (70.6%) | 129 (29.4%) |
| Total | 8,470 (53.0%) | 7,523 (47.0%) |
Education in Pullman
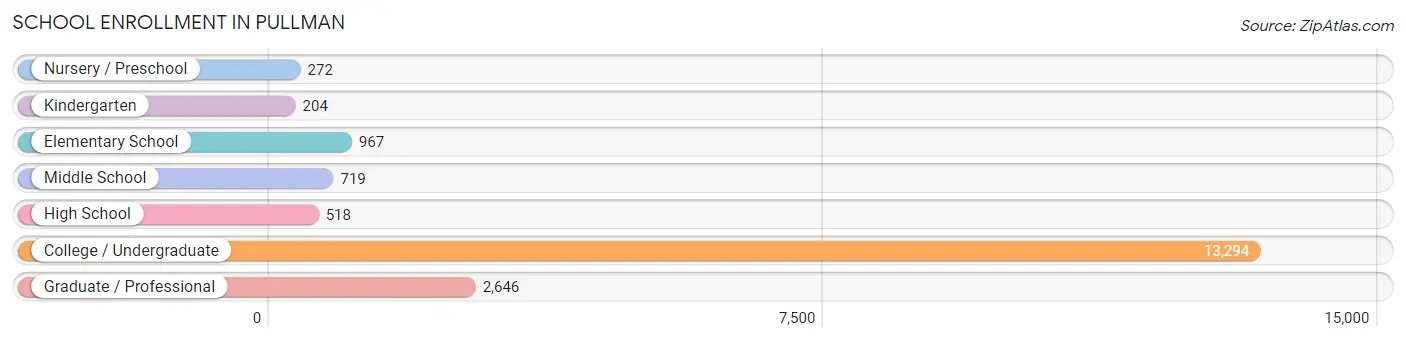
School Enrollment in Pullman
The most common levels of schooling among the 18,620 students in Pullman are college / undergraduate (13,294 | 71.4%), graduate / professional (2,646 | 14.2%), and elementary school (967 | 5.2%).
| School Level | # Students | % Students |
| Nursery / Preschool | 272 | 1.5% |
| Kindergarten | 204 | 1.1% |
| Elementary School | 967 | 5.2% |
| Middle School | 719 | 3.9% |
| High School | 518 | 2.8% |
| College / Undergraduate | 13,294 | 71.4% |
| Graduate / Professional | 2,646 | 14.2% |
| Total | 18,620 | 100.0% |
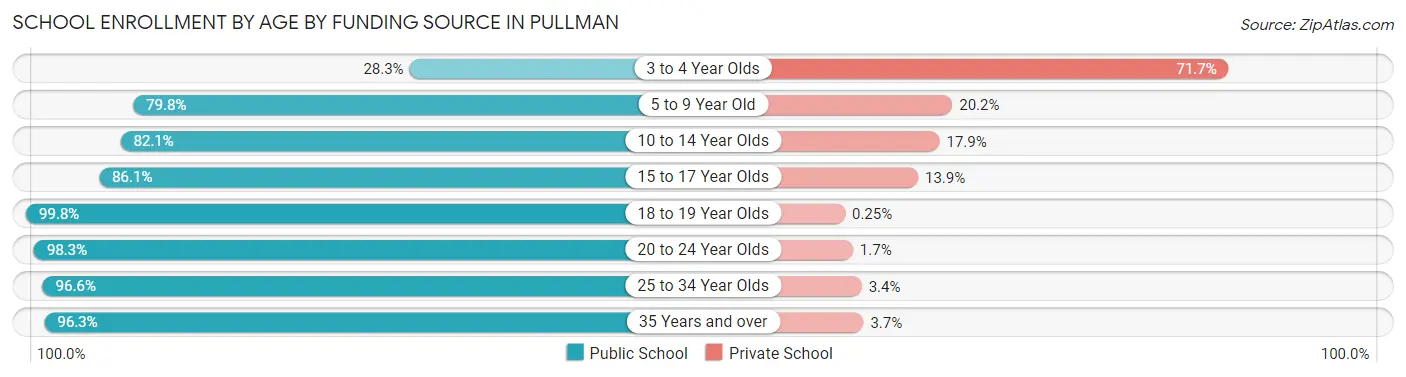
School Enrollment by Age by Funding Source in Pullman
Out of a total of 18,620 students who are enrolled in schools in Pullman, 857 (4.6%) attend a private institution, while the remaining 17,763 (95.4%) are enrolled in public schools. The age group of 3 to 4 year olds has the highest likelihood of being enrolled in private schools, with 162 (71.7% in the age bracket) enrolled. Conversely, the age group of 18 to 19 year olds has the lowest likelihood of being enrolled in a private school, with 4,346 (99.8% in the age bracket) attending a public institution.
| Age Bracket | Public School | Private School |
| 3 to 4 Year Olds | 64 (28.3%) | 162 (71.7%) |
| 5 to 9 Year Old | 891 (79.8%) | 226 (20.2%) |
| 10 to 14 Year Olds | 653 (82.1%) | 142 (17.9%) |
| 15 to 17 Year Olds | 435 (86.1%) | 70 (13.9%) |
| 18 to 19 Year Olds | 4,346 (99.8%) | 11 (0.3%) |
| 20 to 24 Year Olds | 8,775 (98.3%) | 154 (1.7%) |
| 25 to 34 Year Olds | 2,129 (96.6%) | 74 (3.4%) |
| 35 Years and over | 470 (96.3%) | 18 (3.7%) |
| Total | 17,763 (95.4%) | 857 (4.6%) |
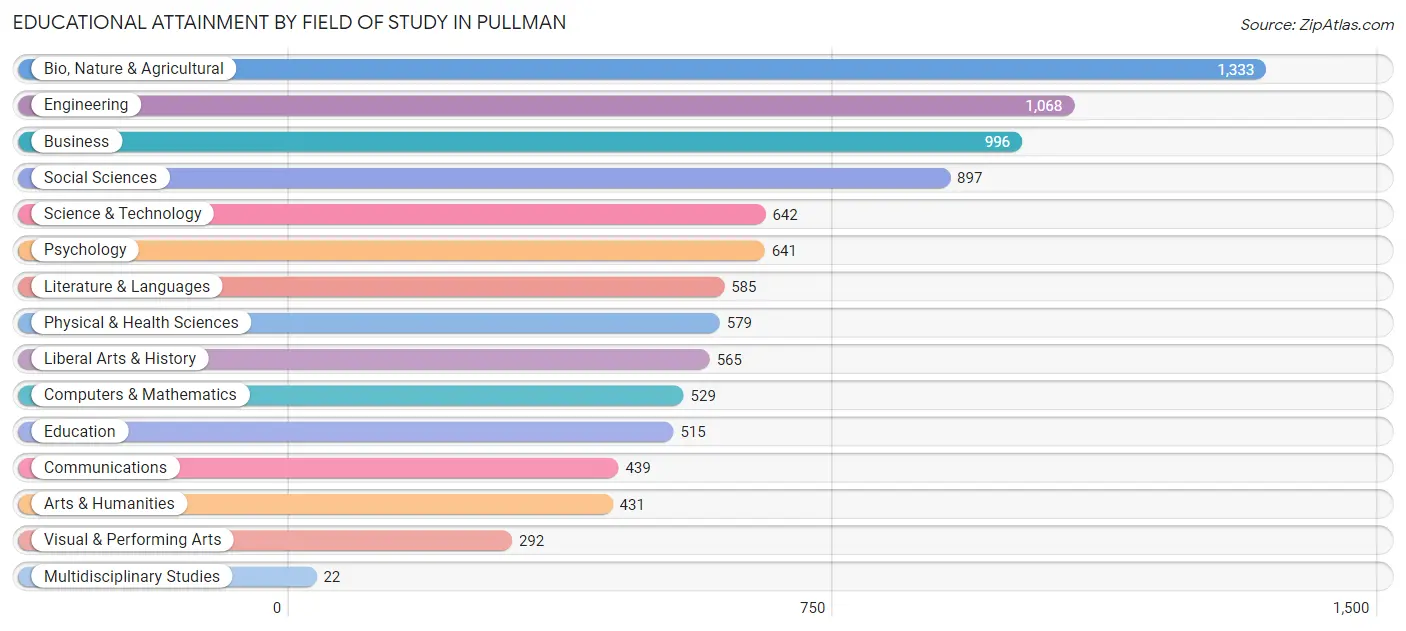
Educational Attainment by Field of Study in Pullman
Bio, nature & agricultural (1,333 | 14.0%), engineering (1,068 | 11.2%), business (996 | 10.4%), social sciences (897 | 9.4%), and science & technology (642 | 6.7%) are the most common fields of study among 9,534 individuals in Pullman who have obtained a bachelor's degree or higher.
| Field of Study | # Graduates | % Graduates |
| Computers & Mathematics | 529 | 5.6% |
| Bio, Nature & Agricultural | 1,333 | 14.0% |
| Physical & Health Sciences | 579 | 6.1% |
| Psychology | 641 | 6.7% |
| Social Sciences | 897 | 9.4% |
| Engineering | 1,068 | 11.2% |
| Multidisciplinary Studies | 22 | 0.2% |
| Science & Technology | 642 | 6.7% |
| Business | 996 | 10.4% |
| Education | 515 | 5.4% |
| Literature & Languages | 585 | 6.1% |
| Liberal Arts & History | 565 | 5.9% |
| Visual & Performing Arts | 292 | 3.1% |
| Communications | 439 | 4.6% |
| Arts & Humanities | 431 | 4.5% |
| Total | 9,534 | 100.0% |
Transportation & Commute in Pullman
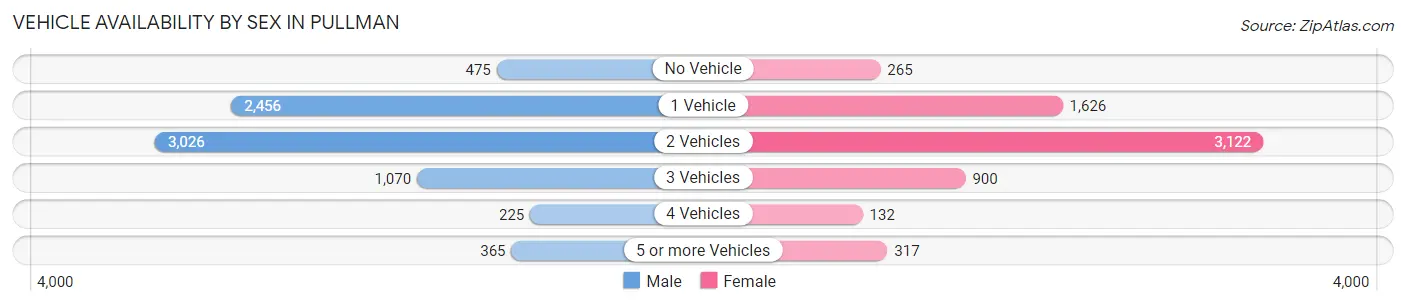
Vehicle Availability by Sex in Pullman
The most prevalent vehicle ownership categories in Pullman are males with 2 vehicles (3,026, accounting for 39.7%) and females with 2 vehicles (3,122, making up 47.6%).
| Vehicles Available | Male | Female |
| No Vehicle | 475 (6.2%) | 265 (4.2%) |
| 1 Vehicle | 2,456 (32.2%) | 1,626 (25.6%) |
| 2 Vehicles | 3,026 (39.7%) | 3,122 (49.1%) |
| 3 Vehicles | 1,070 (14.1%) | 900 (14.1%) |
| 4 Vehicles | 225 (2.9%) | 132 (2.1%) |
| 5 or more Vehicles | 365 (4.8%) | 317 (5.0%) |
| Total | 7,617 (100.0%) | 6,362 (100.0%) |
Commute Time in Pullman
The most frequently occuring commute durations in Pullman are 10 to 14 minutes (4,105 commuters, 29.0%), 5 to 9 minutes (3,464 commuters, 24.5%), and 15 to 19 minutes (2,746 commuters, 19.4%).
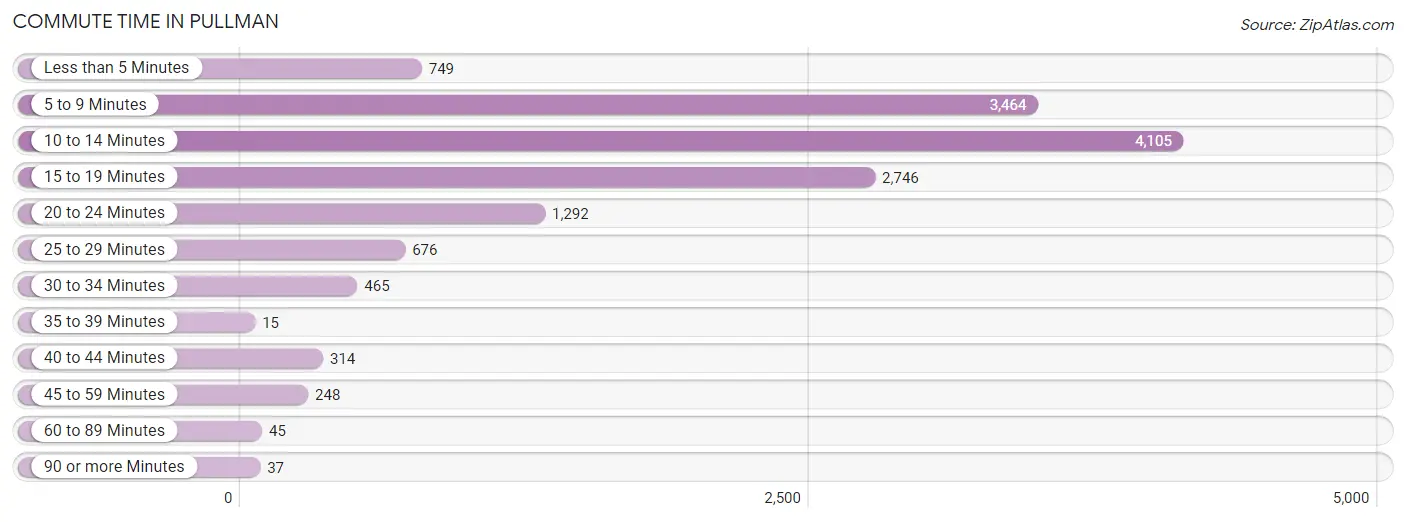
| Commute Time | # Commuters | % Commuters |
| Less than 5 Minutes | 749 | 5.3% |
| 5 to 9 Minutes | 3,464 | 24.5% |
| 10 to 14 Minutes | 4,105 | 29.0% |
| 15 to 19 Minutes | 2,746 | 19.4% |
| 20 to 24 Minutes | 1,292 | 9.1% |
| 25 to 29 Minutes | 676 | 4.8% |
| 30 to 34 Minutes | 465 | 3.3% |
| 35 to 39 Minutes | 15 | 0.1% |
| 40 to 44 Minutes | 314 | 2.2% |
| 45 to 59 Minutes | 248 | 1.8% |
| 60 to 89 Minutes | 45 | 0.3% |
| 90 or more Minutes | 37 | 0.3% |
Commute Time by Sex in Pullman
The most common commute times in Pullman are 10 to 14 minutes (2,273 commuters, 30.1%) for males and 10 to 14 minutes (1,832 commuters, 27.7%) for females.
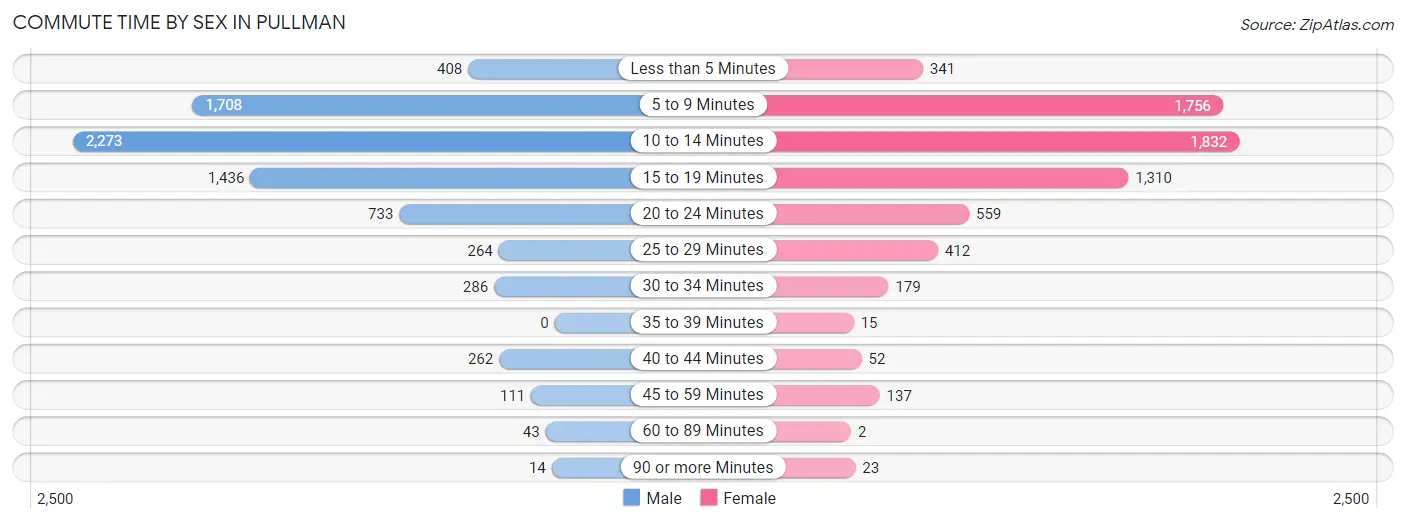
| Commute Time | Male | Female |
| Less than 5 Minutes | 408 (5.4%) | 341 (5.1%) |
| 5 to 9 Minutes | 1,708 (22.7%) | 1,756 (26.5%) |
| 10 to 14 Minutes | 2,273 (30.1%) | 1,832 (27.7%) |
| 15 to 19 Minutes | 1,436 (19.1%) | 1,310 (19.8%) |
| 20 to 24 Minutes | 733 (9.7%) | 559 (8.5%) |
| 25 to 29 Minutes | 264 (3.5%) | 412 (6.2%) |
| 30 to 34 Minutes | 286 (3.8%) | 179 (2.7%) |
| 35 to 39 Minutes | 0 (0.0%) | 15 (0.2%) |
| 40 to 44 Minutes | 262 (3.5%) | 52 (0.8%) |
| 45 to 59 Minutes | 111 (1.5%) | 137 (2.1%) |
| 60 to 89 Minutes | 43 (0.6%) | 2 (0.0%) |
| 90 or more Minutes | 14 (0.2%) | 23 (0.4%) |
Time of Departure to Work by Sex in Pullman
The most frequent times of departure to work in Pullman are 7:30 AM to 7:59 AM (1,439, 19.1%) for males and 7:30 AM to 7:59 AM (1,017, 15.4%) for females.
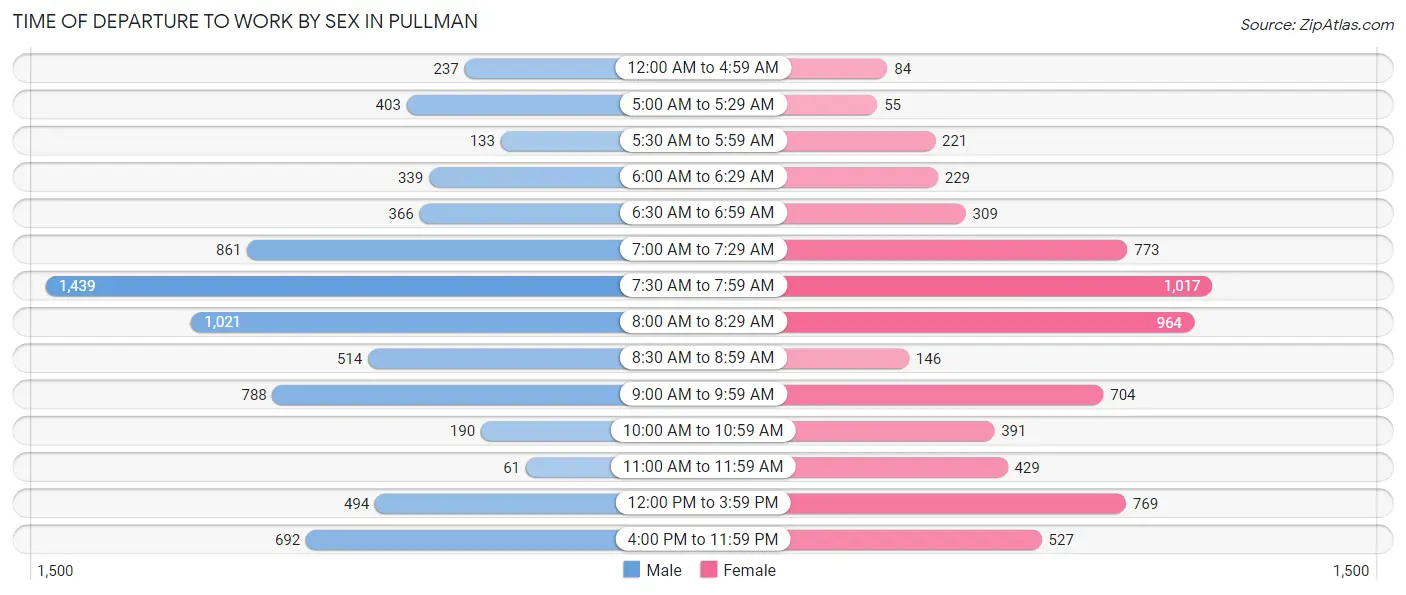
| Time of Departure | Male | Female |
| 12:00 AM to 4:59 AM | 237 (3.1%) | 84 (1.3%) |
| 5:00 AM to 5:29 AM | 403 (5.3%) | 55 (0.8%) |
| 5:30 AM to 5:59 AM | 133 (1.8%) | 221 (3.3%) |
| 6:00 AM to 6:29 AM | 339 (4.5%) | 229 (3.5%) |
| 6:30 AM to 6:59 AM | 366 (4.9%) | 309 (4.7%) |
| 7:00 AM to 7:29 AM | 861 (11.4%) | 773 (11.7%) |
| 7:30 AM to 7:59 AM | 1,439 (19.1%) | 1,017 (15.4%) |
| 8:00 AM to 8:29 AM | 1,021 (13.5%) | 964 (14.6%) |
| 8:30 AM to 8:59 AM | 514 (6.8%) | 146 (2.2%) |
| 9:00 AM to 9:59 AM | 788 (10.4%) | 704 (10.6%) |
| 10:00 AM to 10:59 AM | 190 (2.5%) | 391 (5.9%) |
| 11:00 AM to 11:59 AM | 61 (0.8%) | 429 (6.5%) |
| 12:00 PM to 3:59 PM | 494 (6.6%) | 769 (11.6%) |
| 4:00 PM to 11:59 PM | 692 (9.2%) | 527 (8.0%) |
| Total | 7,538 (100.0%) | 6,618 (100.0%) |
Housing Occupancy in Pullman
Occupancy by Ownership in Pullman
Of the total 11,972 dwellings in Pullman, owner-occupied units account for 3,491 (29.2%), while renter-occupied units make up 8,481 (70.8%).
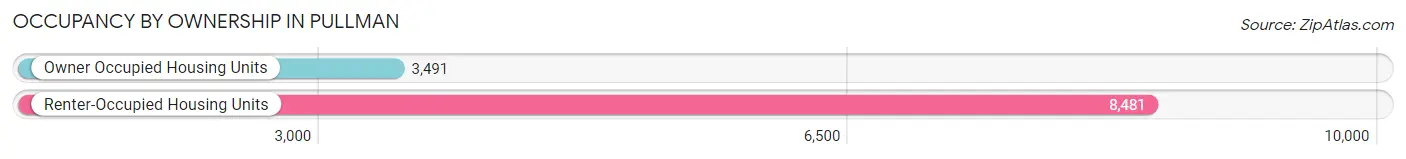
| Occupancy | # Housing Units | % Housing Units |
| Owner Occupied Housing Units | 3,491 | 29.2% |
| Renter-Occupied Housing Units | 8,481 | 70.8% |
| Total Occupied Housing Units | 11,972 | 100.0% |
Occupancy by Household Size in Pullman
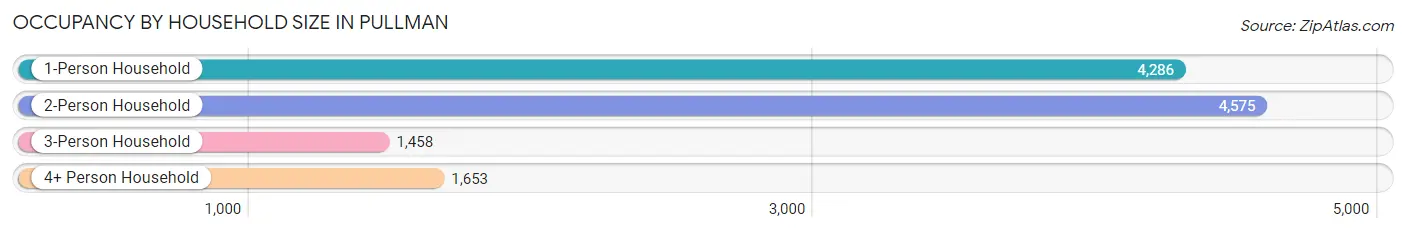
| Household Size | # Housing Units | % Housing Units |
| 1-Person Household | 4,286 | 35.8% |
| 2-Person Household | 4,575 | 38.2% |
| 3-Person Household | 1,458 | 12.2% |
| 4+ Person Household | 1,653 | 13.8% |
| Total Housing Units | 11,972 | 100.0% |
Occupancy by Ownership by Household Size in Pullman
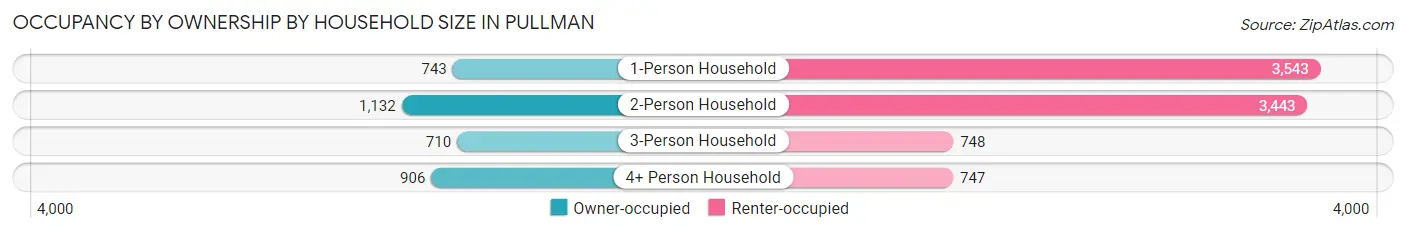
| Household Size | Owner-occupied | Renter-occupied |
| 1-Person Household | 743 (17.3%) | 3,543 (82.7%) |
| 2-Person Household | 1,132 (24.7%) | 3,443 (75.3%) |
| 3-Person Household | 710 (48.7%) | 748 (51.3%) |
| 4+ Person Household | 906 (54.8%) | 747 (45.2%) |
| Total Housing Units | 3,491 (29.2%) | 8,481 (70.8%) |
Occupancy by Educational Attainment in Pullman
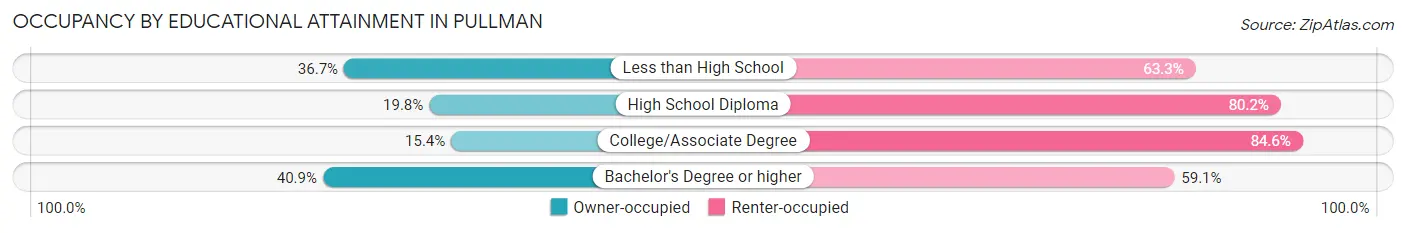
| Household Size | Owner-occupied | Renter-occupied |
| Less than High School | 51 (36.7%) | 88 (63.3%) |
| High School Diploma | 232 (19.8%) | 940 (80.2%) |
| College/Associate Degree | 698 (15.4%) | 3,823 (84.6%) |
| Bachelor's Degree or higher | 2,510 (40.9%) | 3,630 (59.1%) |
Occupancy by Age of Householder in Pullman
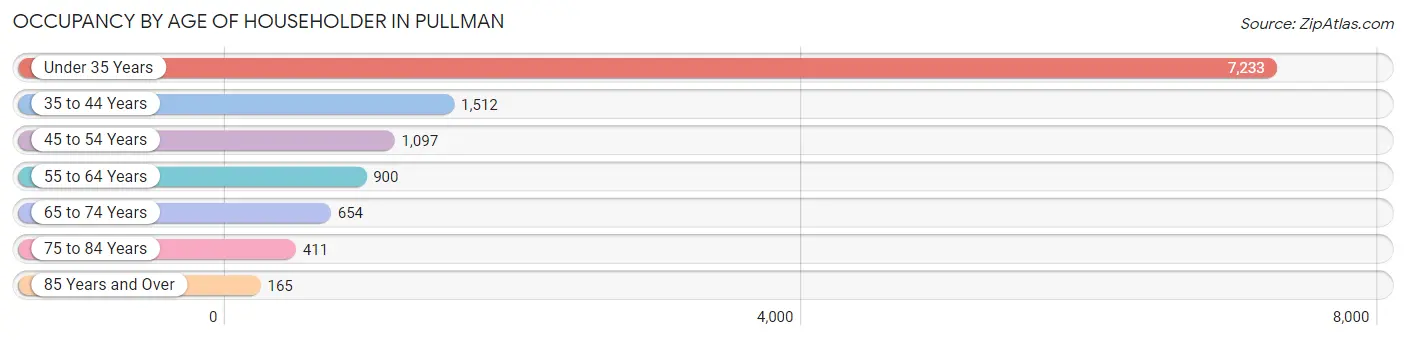
| Age Bracket | # Households | % Households |
| Under 35 Years | 7,233 | 60.4% |
| 35 to 44 Years | 1,512 | 12.6% |
| 45 to 54 Years | 1,097 | 9.2% |
| 55 to 64 Years | 900 | 7.5% |
| 65 to 74 Years | 654 | 5.5% |
| 75 to 84 Years | 411 | 3.4% |
| 85 Years and Over | 165 | 1.4% |
| Total | 11,972 | 100.0% |
Housing Finances in Pullman
Median Income by Occupancy in Pullman
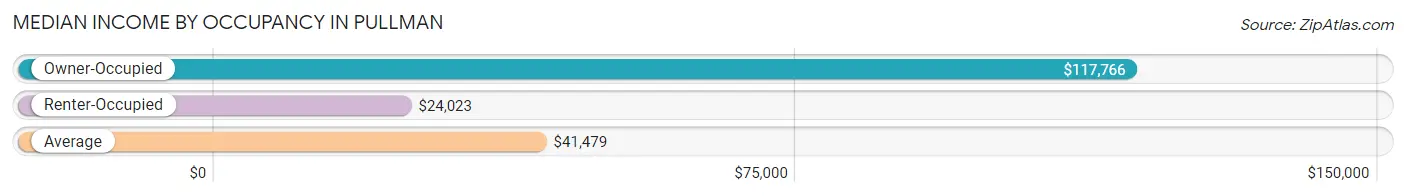
| Occupancy Type | # Households | Median Income |
| Owner-Occupied | 3,491 (29.2%) | $117,766 |
| Renter-Occupied | 8,481 (70.8%) | $24,023 |
| Average | 11,972 (100.0%) | $41,479 |
Occupancy by Householder Income Bracket in Pullman
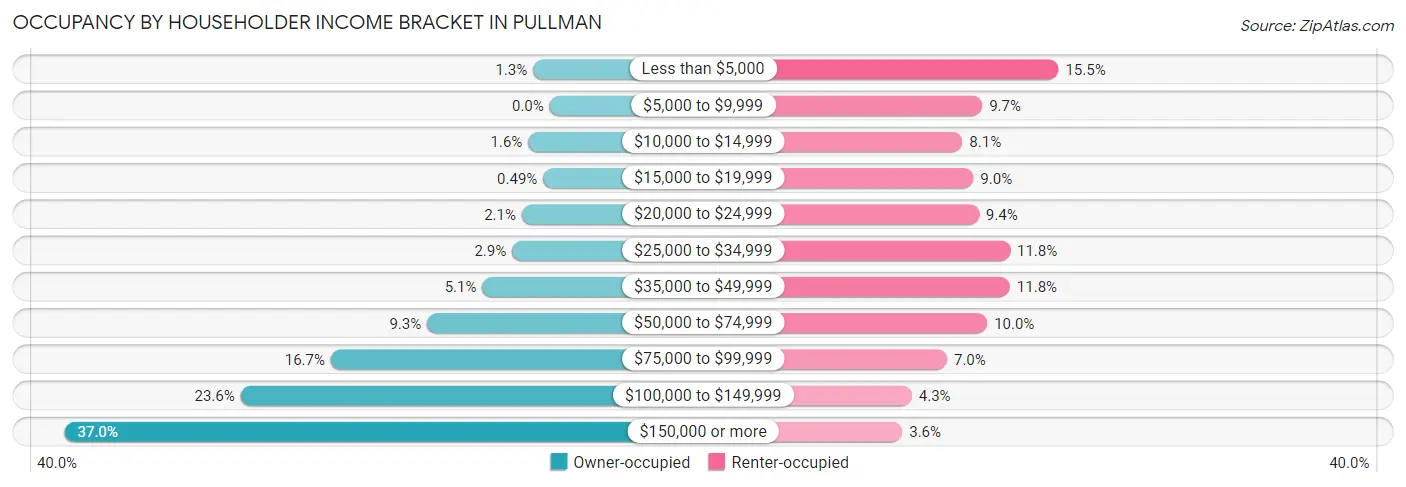
| Income Bracket | Owner-occupied | Renter-occupied |
| Less than $5,000 | 44 (1.3%) | 1,311 (15.5%) |
| $5,000 to $9,999 | 0 (0.0%) | 818 (9.7%) |
| $10,000 to $14,999 | 57 (1.6%) | 690 (8.1%) |
| $15,000 to $19,999 | 17 (0.5%) | 762 (9.0%) |
| $20,000 to $24,999 | 74 (2.1%) | 797 (9.4%) |
| $25,000 to $34,999 | 100 (2.9%) | 998 (11.8%) |
| $35,000 to $49,999 | 179 (5.1%) | 997 (11.8%) |
| $50,000 to $74,999 | 326 (9.3%) | 851 (10.0%) |
| $75,000 to $99,999 | 582 (16.7%) | 591 (7.0%) |
| $100,000 to $149,999 | 822 (23.5%) | 364 (4.3%) |
| $150,000 or more | 1,290 (36.9%) | 302 (3.6%) |
| Total | 3,491 (100.0%) | 8,481 (100.0%) |
Monthly Housing Cost Tiers in Pullman
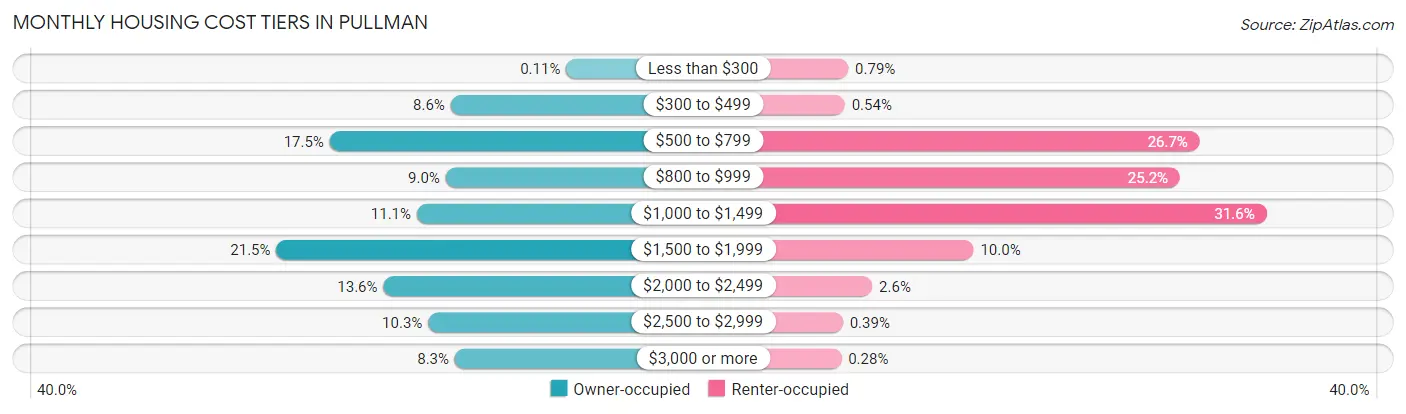
| Monthly Cost | Owner-occupied | Renter-occupied |
| Less than $300 | 4 (0.1%) | 67 (0.8%) |
| $300 to $499 | 301 (8.6%) | 46 (0.5%) |
| $500 to $799 | 612 (17.5%) | 2,263 (26.7%) |
| $800 to $999 | 314 (9.0%) | 2,139 (25.2%) |
| $1,000 to $1,499 | 388 (11.1%) | 2,680 (31.6%) |
| $1,500 to $1,999 | 749 (21.5%) | 850 (10.0%) |
| $2,000 to $2,499 | 474 (13.6%) | 217 (2.6%) |
| $2,500 to $2,999 | 359 (10.3%) | 33 (0.4%) |
| $3,000 or more | 290 (8.3%) | 24 (0.3%) |
| Total | 3,491 (100.0%) | 8,481 (100.0%) |
Physical Housing Characteristics in Pullman
Housing Structures in Pullman
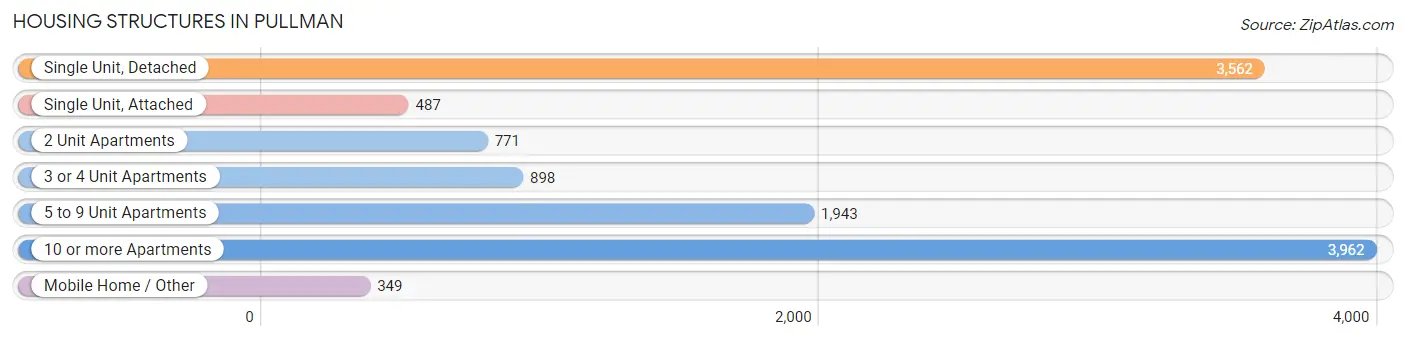
| Structure Type | # Housing Units | % Housing Units |
| Single Unit, Detached | 3,562 | 29.7% |
| Single Unit, Attached | 487 | 4.1% |
| 2 Unit Apartments | 771 | 6.4% |
| 3 or 4 Unit Apartments | 898 | 7.5% |
| 5 to 9 Unit Apartments | 1,943 | 16.2% |
| 10 or more Apartments | 3,962 | 33.1% |
| Mobile Home / Other | 349 | 2.9% |
| Total | 11,972 | 100.0% |
Housing Structures by Occupancy in Pullman
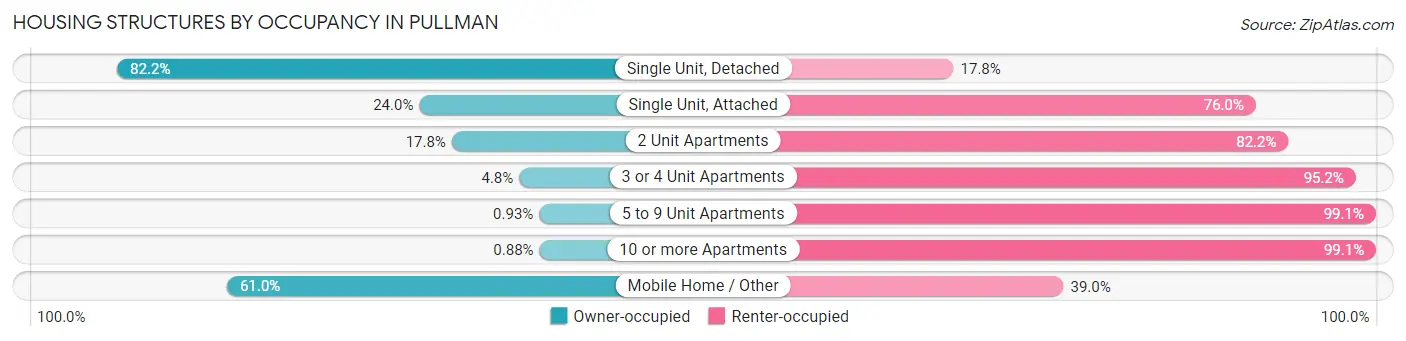
| Structure Type | Owner-occupied | Renter-occupied |
| Single Unit, Detached | 2,928 (82.2%) | 634 (17.8%) |
| Single Unit, Attached | 117 (24.0%) | 370 (76.0%) |
| 2 Unit Apartments | 137 (17.8%) | 634 (82.2%) |
| 3 or 4 Unit Apartments | 43 (4.8%) | 855 (95.2%) |
| 5 to 9 Unit Apartments | 18 (0.9%) | 1,925 (99.1%) |
| 10 or more Apartments | 35 (0.9%) | 3,927 (99.1%) |
| Mobile Home / Other | 213 (61.0%) | 136 (39.0%) |
| Total | 3,491 (29.2%) | 8,481 (70.8%) |
Housing Structures by Number of Rooms in Pullman
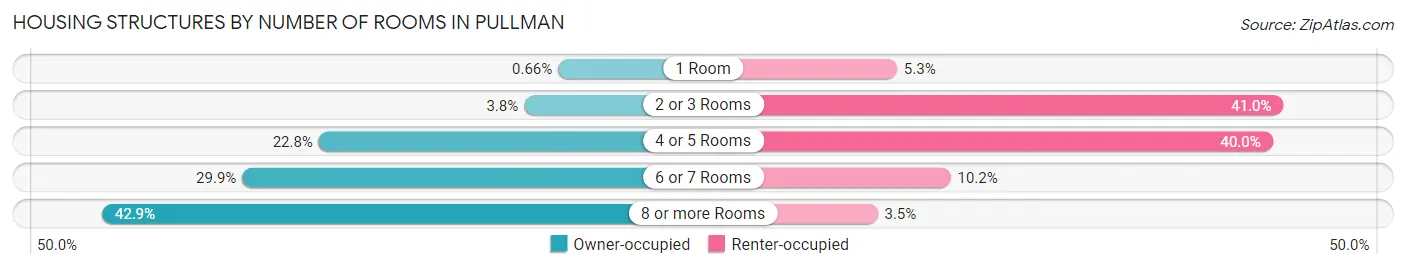
| Number of Rooms | Owner-occupied | Renter-occupied |
| 1 Room | 23 (0.7%) | 447 (5.3%) |
| 2 or 3 Rooms | 133 (3.8%) | 3,478 (41.0%) |
| 4 or 5 Rooms | 796 (22.8%) | 3,393 (40.0%) |
| 6 or 7 Rooms | 1,043 (29.9%) | 868 (10.2%) |
| 8 or more Rooms | 1,496 (42.8%) | 295 (3.5%) |
| Total | 3,491 (100.0%) | 8,481 (100.0%) |
Housing Structure by Heating Type in Pullman
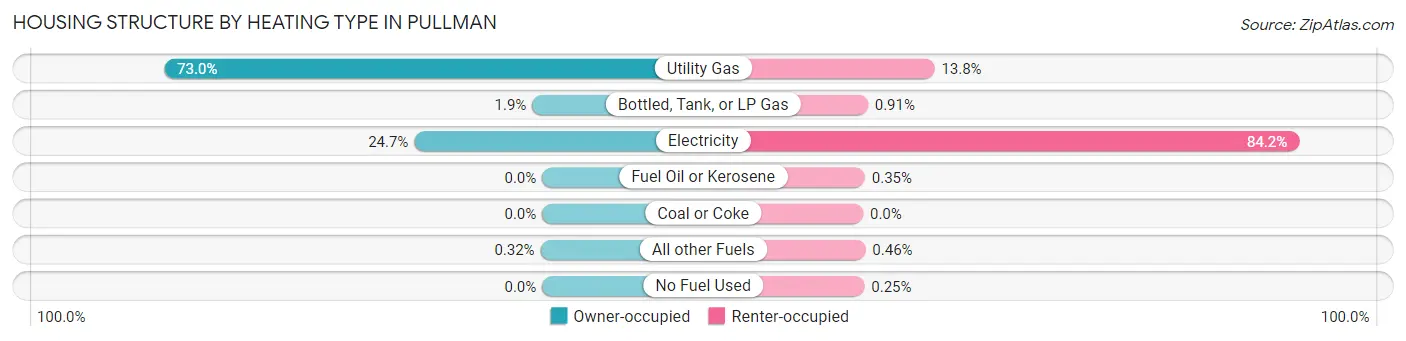
| Heating Type | Owner-occupied | Renter-occupied |
| Utility Gas | 2,550 (73.0%) | 1,170 (13.8%) |
| Bottled, Tank, or LP Gas | 67 (1.9%) | 77 (0.9%) |
| Electricity | 863 (24.7%) | 7,144 (84.2%) |
| Fuel Oil or Kerosene | 0 (0.0%) | 30 (0.4%) |
| Coal or Coke | 0 (0.0%) | 0 (0.0%) |
| All other Fuels | 11 (0.3%) | 39 (0.5%) |
| No Fuel Used | 0 (0.0%) | 21 (0.3%) |
| Total | 3,491 (100.0%) | 8,481 (100.0%) |
Household Vehicle Usage in Pullman
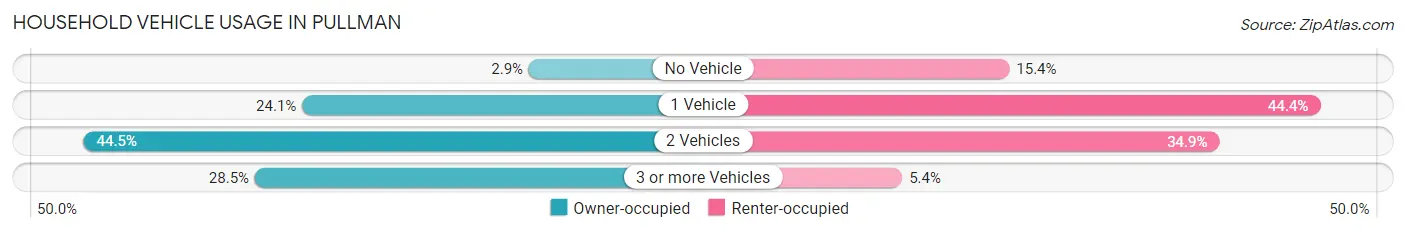
| Vehicles per Household | Owner-occupied | Renter-occupied |
| No Vehicle | 102 (2.9%) | 1,302 (15.3%) |
| 1 Vehicle | 841 (24.1%) | 3,762 (44.4%) |
| 2 Vehicles | 1,553 (44.5%) | 2,963 (34.9%) |
| 3 or more Vehicles | 995 (28.5%) | 454 (5.3%) |
| Total | 3,491 (100.0%) | 8,481 (100.0%) |
Real Estate & Mortgages in Pullman
Real Estate and Mortgage Overview in Pullman
| Characteristic | Without Mortgage | With Mortgage |
| Housing Units | 1,190 | 2,301 |
| Median Property Value | $357,000 | $387,200 |
| Median Household Income | $102,258 | $952 |
| Monthly Housing Costs | $661 | $290 |
| Real Estate Taxes | $3,444 | $28 |
Property Value by Mortgage Status in Pullman
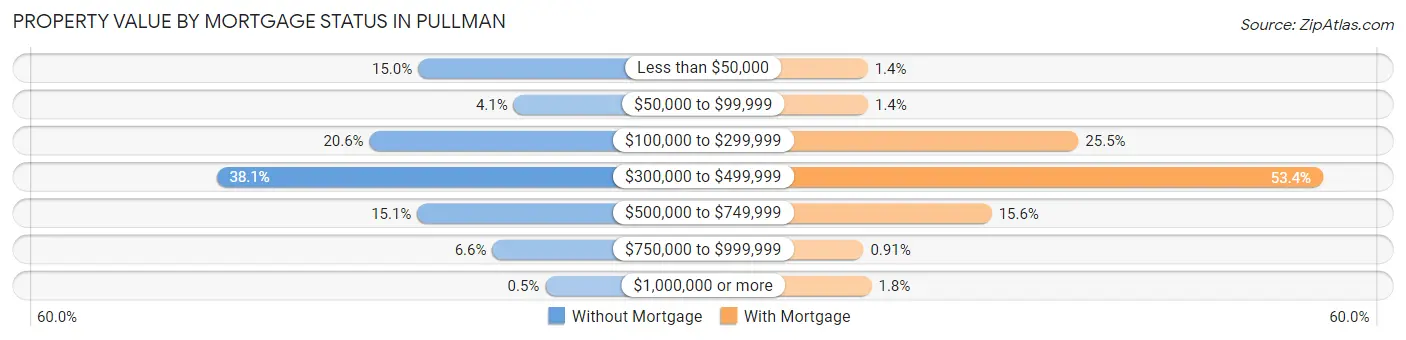
| Property Value | Without Mortgage | With Mortgage |
| Less than $50,000 | 179 (15.0%) | 32 (1.4%) |
| $50,000 to $99,999 | 49 (4.1%) | 33 (1.4%) |
| $100,000 to $299,999 | 245 (20.6%) | 586 (25.5%) |
| $300,000 to $499,999 | 453 (38.1%) | 1,229 (53.4%) |
| $500,000 to $749,999 | 180 (15.1%) | 358 (15.6%) |
| $750,000 to $999,999 | 78 (6.6%) | 21 (0.9%) |
| $1,000,000 or more | 6 (0.5%) | 42 (1.8%) |
| Total | 1,190 (100.0%) | 2,301 (100.0%) |
Household Income by Mortgage Status in Pullman
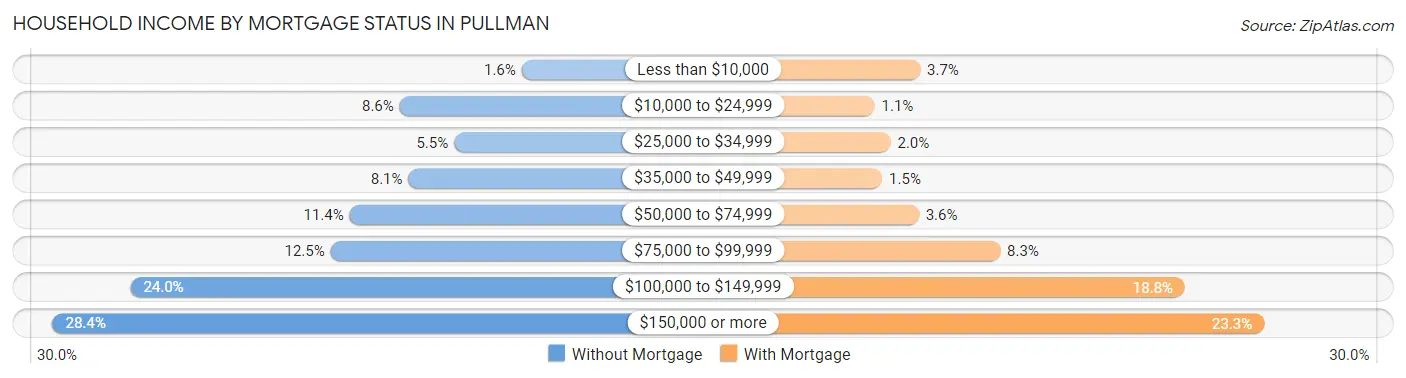
| Household Income | Without Mortgage | With Mortgage |
| Less than $10,000 | 19 (1.6%) | 85 (3.7%) |
| $10,000 to $24,999 | 102 (8.6%) | 25 (1.1%) |
| $25,000 to $34,999 | 65 (5.5%) | 46 (2.0%) |
| $35,000 to $49,999 | 96 (8.1%) | 35 (1.5%) |
| $50,000 to $74,999 | 136 (11.4%) | 83 (3.6%) |
| $75,000 to $99,999 | 149 (12.5%) | 190 (8.3%) |
| $100,000 to $149,999 | 285 (23.9%) | 433 (18.8%) |
| $150,000 or more | 338 (28.4%) | 537 (23.3%) |
| Total | 1,190 (100.0%) | 2,301 (100.0%) |
Property Value to Household Income Ratio in Pullman
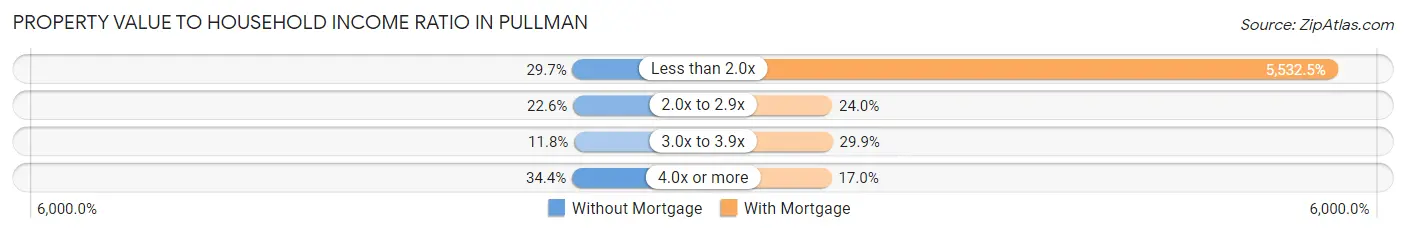
| Value-to-Income Ratio | Without Mortgage | With Mortgage |
| Less than 2.0x | 353 (29.7%) | 127,303 (5,532.5%) |
| 2.0x to 2.9x | 269 (22.6%) | 552 (24.0%) |
| 3.0x to 3.9x | 140 (11.8%) | 689 (29.9%) |
| 4.0x or more | 409 (34.4%) | 390 (17.0%) |
| Total | 1,190 (100.0%) | 2,301 (100.0%) |
Real Estate Taxes by Mortgage Status in Pullman
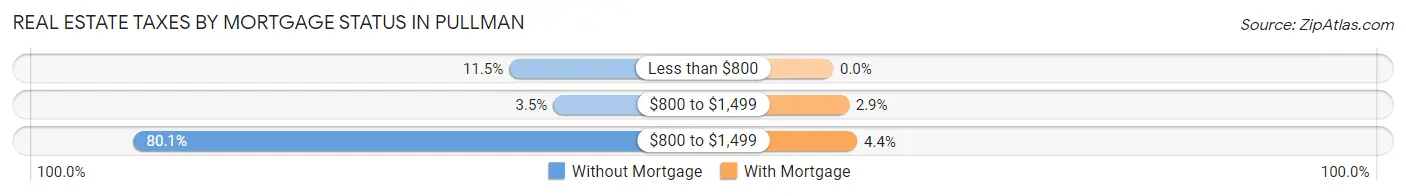
| Property Taxes | Without Mortgage | With Mortgage |
| Less than $800 | 137 (11.5%) | 0 (0.0%) |
| $800 to $1,499 | 41 (3.5%) | 66 (2.9%) |
| $800 to $1,499 | 953 (80.1%) | 101 (4.4%) |
| Total | 1,190 (100.0%) | 2,301 (100.0%) |
Health & Disability in Pullman
Health Insurance Coverage by Age in Pullman
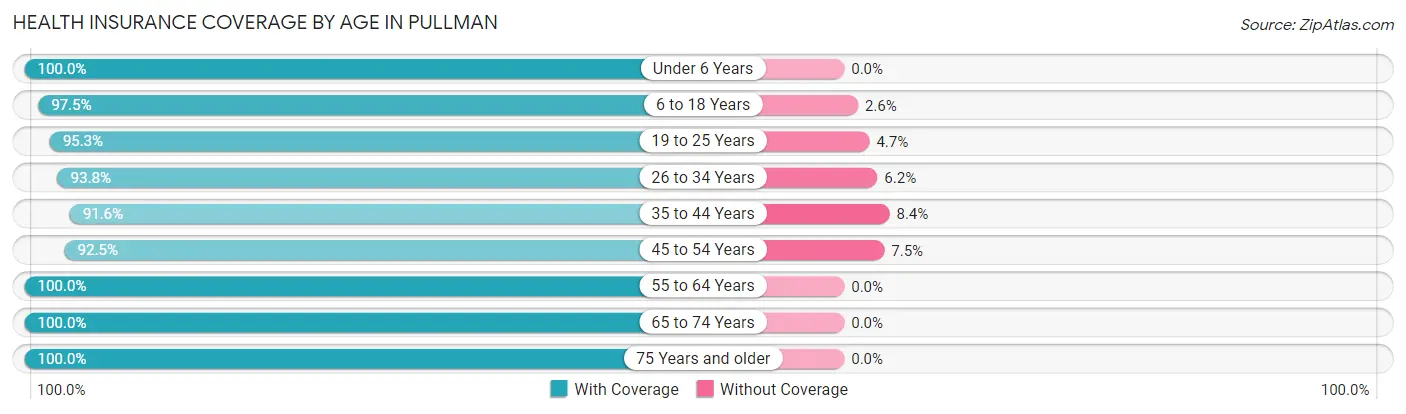
| Age Bracket | With Coverage | Without Coverage |
| Under 6 Years | 1,453 (100.0%) | 0 (0.0%) |
| 6 to 18 Years | 4,095 (97.5%) | 107 (2.5%) |
| 19 to 25 Years | 12,916 (95.3%) | 636 (4.7%) |
| 26 to 34 Years | 4,438 (93.8%) | 292 (6.2%) |
| 35 to 44 Years | 2,429 (91.6%) | 224 (8.4%) |
| 45 to 54 Years | 1,696 (92.5%) | 137 (7.5%) |
| 55 to 64 Years | 1,417 (100.0%) | 0 (0.0%) |
| 65 to 74 Years | 1,070 (100.0%) | 0 (0.0%) |
| 75 Years and older | 880 (100.0%) | 0 (0.0%) |
| Total | 30,394 (95.6%) | 1,396 (4.4%) |
Health Insurance Coverage by Citizenship Status in Pullman
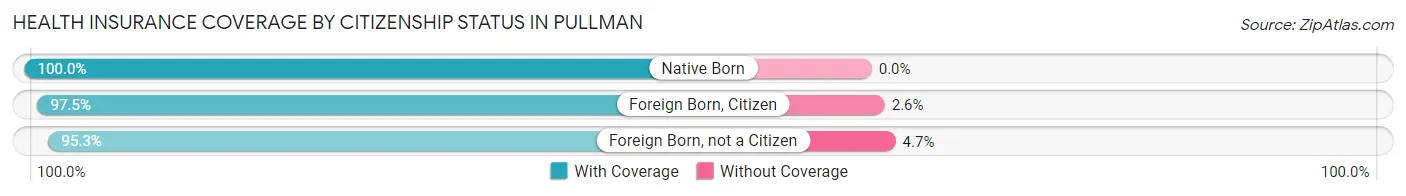
| Citizenship Status | With Coverage | Without Coverage |
| Native Born | 1,453 (100.0%) | 0 (0.0%) |
| Foreign Born, Citizen | 4,095 (97.5%) | 107 (2.5%) |
| Foreign Born, not a Citizen | 12,916 (95.3%) | 636 (4.7%) |
Health Insurance Coverage by Household Income in Pullman
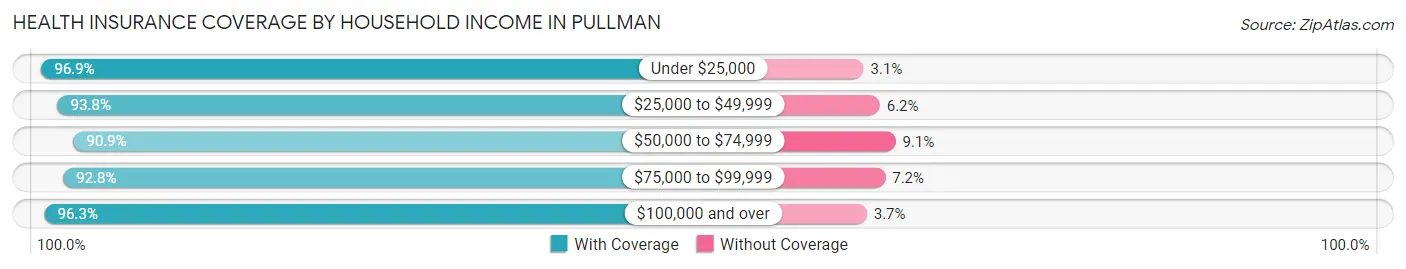
| Household Income | With Coverage | Without Coverage |
| Under $25,000 | 7,566 (96.9%) | 245 (3.1%) |
| $25,000 to $49,999 | 4,695 (93.8%) | 309 (6.2%) |
| $50,000 to $74,999 | 2,246 (90.9%) | 226 (9.1%) |
| $75,000 to $99,999 | 2,663 (92.8%) | 207 (7.2%) |
| $100,000 and over | 7,499 (96.3%) | 291 (3.7%) |
Public vs Private Health Insurance Coverage by Age in Pullman
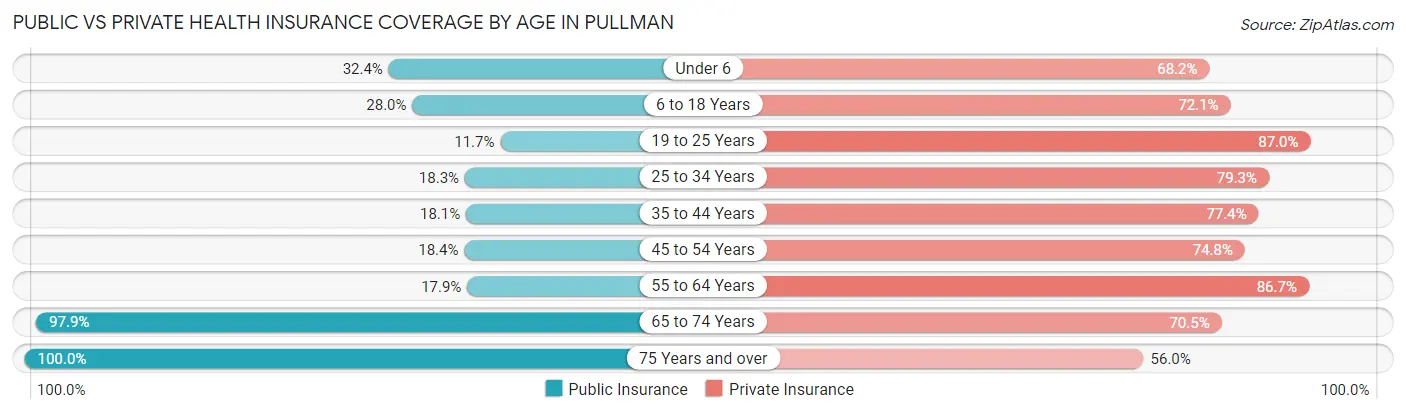
| Age Bracket | Public Insurance | Private Insurance |
| Under 6 | 471 (32.4%) | 991 (68.2%) |
| 6 to 18 Years | 1,178 (28.0%) | 3,031 (72.1%) |
| 19 to 25 Years | 1,586 (11.7%) | 11,784 (87.0%) |
| 25 to 34 Years | 864 (18.3%) | 3,749 (79.3%) |
| 35 to 44 Years | 479 (18.1%) | 2,052 (77.3%) |
| 45 to 54 Years | 337 (18.4%) | 1,371 (74.8%) |
| 55 to 64 Years | 253 (17.8%) | 1,228 (86.7%) |
| 65 to 74 Years | 1,047 (97.9%) | 754 (70.5%) |
| 75 Years and over | 880 (100.0%) | 493 (56.0%) |
| Total | 7,095 (22.3%) | 25,453 (80.1%) |
Disability Status by Sex by Age in Pullman
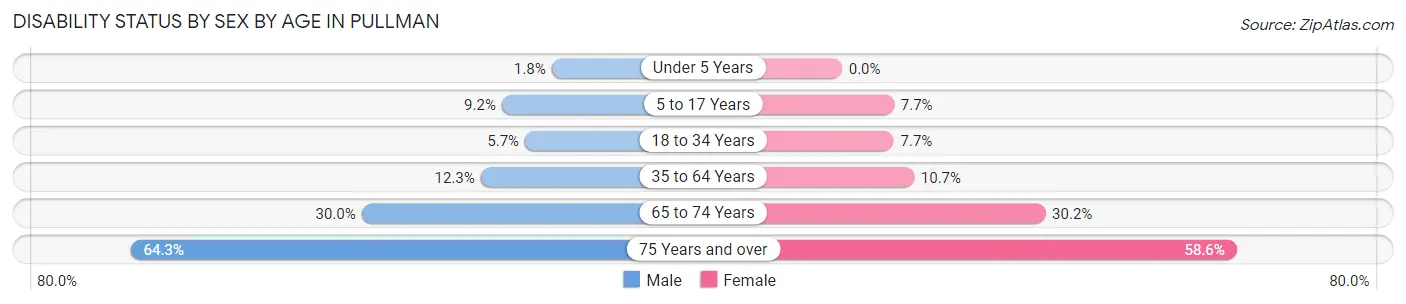
| Age Bracket | Male | Female |
| Under 5 Years | 12 (1.8%) | 0 (0.0%) |
| 5 to 17 Years | 117 (9.1%) | 101 (7.7%) |
| 18 to 34 Years | 584 (5.7%) | 754 (7.7%) |
| 35 to 64 Years | 381 (12.3%) | 300 (10.7%) |
| 65 to 74 Years | 142 (30.0%) | 180 (30.2%) |
| 75 Years and over | 230 (64.2%) | 306 (58.6%) |
Disability Class by Sex by Age in Pullman
Disability Class: Hearing Difficulty
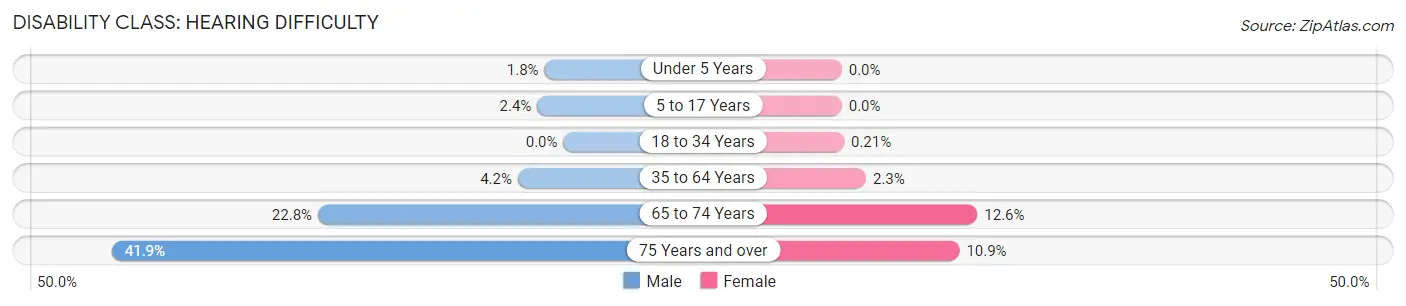
| Age Bracket | Male | Female |
| Under 5 Years | 12 (1.8%) | 0 (0.0%) |
| 5 to 17 Years | 31 (2.4%) | 0 (0.0%) |
| 18 to 34 Years | 0 (0.0%) | 21 (0.2%) |
| 35 to 64 Years | 131 (4.2%) | 63 (2.2%) |
| 65 to 74 Years | 108 (22.8%) | 75 (12.6%) |
| 75 Years and over | 150 (41.9%) | 57 (10.9%) |
Disability Class: Vision Difficulty
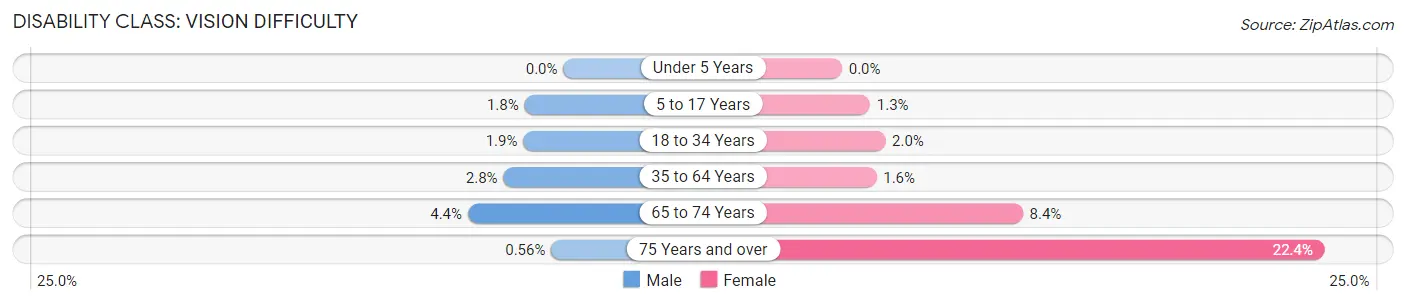
| Age Bracket | Male | Female |
| Under 5 Years | 0 (0.0%) | 0 (0.0%) |
| 5 to 17 Years | 23 (1.8%) | 17 (1.3%) |
| 18 to 34 Years | 191 (1.9%) | 197 (2.0%) |
| 35 to 64 Years | 86 (2.8%) | 45 (1.6%) |
| 65 to 74 Years | 21 (4.4%) | 50 (8.4%) |
| 75 Years and over | 2 (0.6%) | 117 (22.4%) |
Disability Class: Cognitive Difficulty
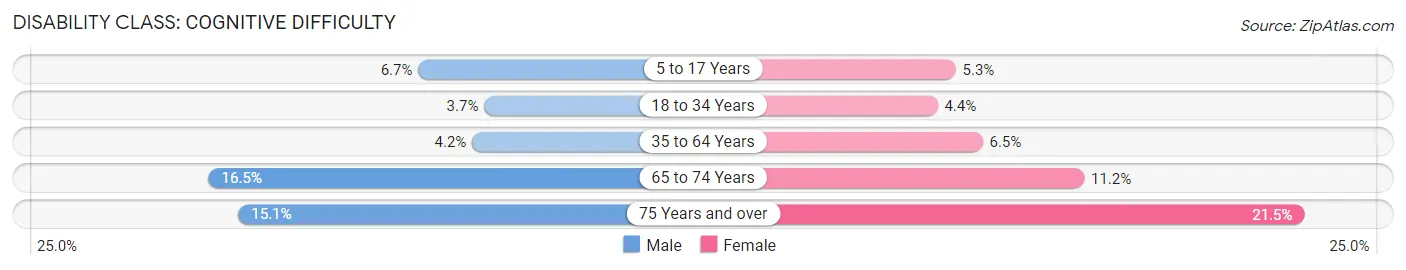
| Age Bracket | Male | Female |
| 5 to 17 Years | 86 (6.7%) | 69 (5.3%) |
| 18 to 34 Years | 376 (3.7%) | 435 (4.4%) |
| 35 to 64 Years | 131 (4.2%) | 183 (6.5%) |
| 65 to 74 Years | 78 (16.5%) | 67 (11.2%) |
| 75 Years and over | 54 (15.1%) | 112 (21.5%) |
Disability Class: Ambulatory Difficulty
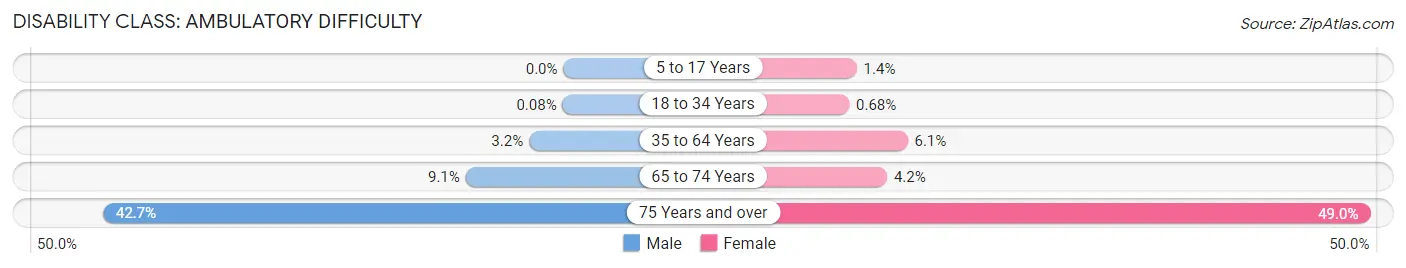
| Age Bracket | Male | Female |
| 5 to 17 Years | 0 (0.0%) | 18 (1.4%) |
| 18 to 34 Years | 8 (0.1%) | 67 (0.7%) |
| 35 to 64 Years | 99 (3.2%) | 171 (6.1%) |
| 65 to 74 Years | 43 (9.1%) | 25 (4.2%) |
| 75 Years and over | 153 (42.7%) | 256 (49.0%) |
Disability Class: Self-Care Difficulty
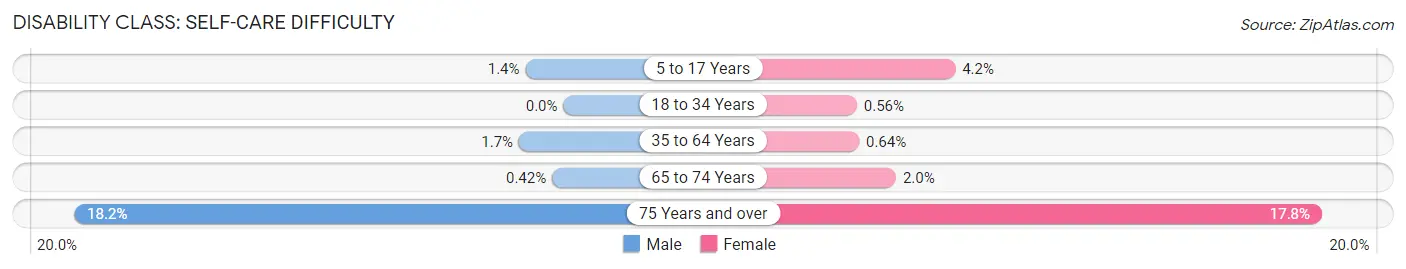
| Age Bracket | Male | Female |
| 5 to 17 Years | 18 (1.4%) | 55 (4.2%) |
| 18 to 34 Years | 0 (0.0%) | 55 (0.6%) |
| 35 to 64 Years | 51 (1.7%) | 18 (0.6%) |
| 65 to 74 Years | 2 (0.4%) | 12 (2.0%) |
| 75 Years and over | 65 (18.2%) | 93 (17.8%) |
Technology Access in Pullman
Computing Device Access in Pullman
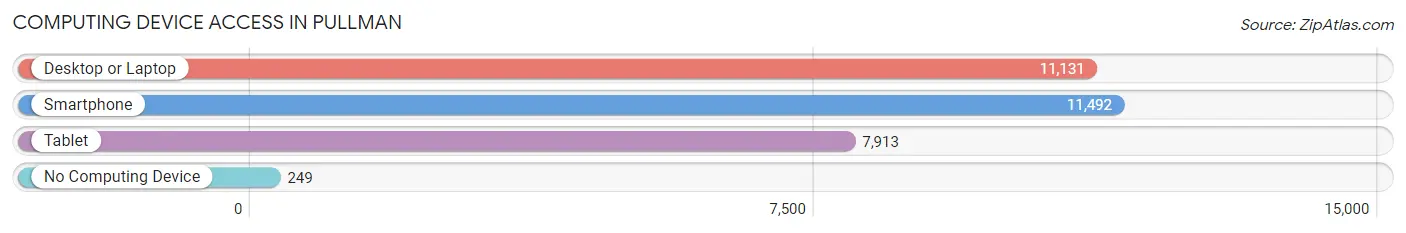
| Device Type | # Households | % Households |
| Desktop or Laptop | 11,131 | 93.0% |
| Smartphone | 11,492 | 96.0% |
| Tablet | 7,913 | 66.1% |
| No Computing Device | 249 | 2.1% |
| Total | 11,972 | 100.0% |
Internet Access in Pullman
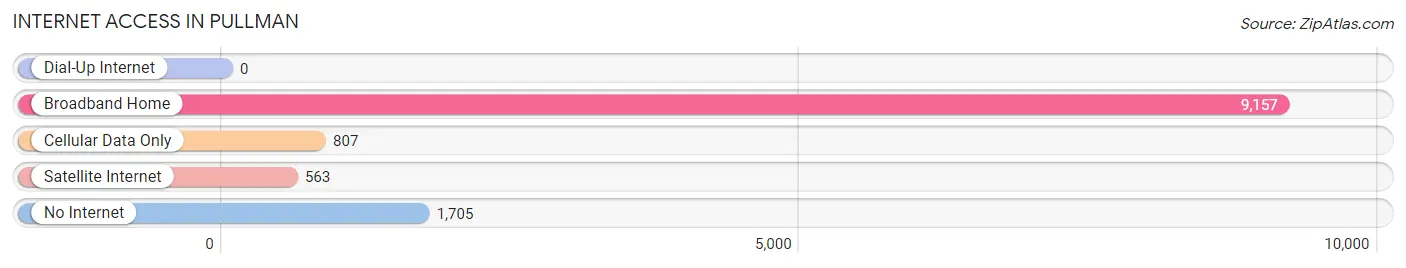
| Internet Type | # Households | % Households |
| Dial-Up Internet | 0 | 0.0% |
| Broadband Home | 9,157 | 76.5% |
| Cellular Data Only | 807 | 6.7% |
| Satellite Internet | 563 | 4.7% |
| No Internet | 1,705 | 14.2% |
| Total | 11,972 | 100.0% |
Pullman Summary
Pullman, Washington is a city located in Whitman County in the Palouse region of the Pacific Northwest. It is the home of Washington State University and is the largest city in the county. The city was founded in 1888 and has a population of approximately 30,000 people.
Geography
Pullman is located in the southeastern corner of Washington State, approximately 30 miles south of Spokane and 90 miles east of Seattle. The city is situated in the Palouse region of the Pacific Northwest, which is characterized by rolling hills and fertile soil. The city is bordered by the Snake River to the east and the Palouse River to the west. The city is also located near the Palouse Falls State Park, which is a popular tourist destination.
Climate
Pullman has a semi-arid climate, with hot summers and cold winters. The average high temperature in the summer is around 85 degrees Fahrenheit, while the average low temperature in the winter is around 20 degrees Fahrenheit. The city receives an average of 16 inches of precipitation per year, with most of it falling in the winter months.
Economy
Pullman’s economy is largely driven by Washington State University, which is the largest employer in the city. Other major employers include Schweitzer Engineering Laboratories, Schweitzer Hospital, and the Pullman School District. The city also has a thriving agricultural industry, with wheat, barley, and lentils being the primary crops.
Demographics
As of the 2010 census, the population of Pullman was 29,799. The racial makeup of the city was 87.3% White, 4.2% Asian, 2.7% African American, 0.7% Native American, and 4.1% from other races. The median household income was $37,837, and the median family income was $50,945.
Education
Pullman is home to Washington State University, which is a public research university. The university has an enrollment of over 25,000 students and offers a variety of undergraduate and graduate degree programs. The city also has several public and private schools, including Pullman High School, Lincoln Middle School, and Franklin Elementary School.
Conclusion
Pullman, Washington is a city located in Whitman County in the Palouse region of the Pacific Northwest. It is the home of Washington State University and is the largest city in the county. The city has a semi-arid climate, with hot summers and cold winters. The economy is largely driven by Washington State University, and the city also has a thriving agricultural industry. The population of Pullman was 29,799 as of the 2010 census, and the median household income was $37,837. Pullman is home to Washington State University, as well as several public and private schools.
Common Questions
What is the Total Population of Pullman?
Total Population of Pullman is 31,972.
What is the Total Male Population of Pullman?
Total Male Population of Pullman is 16,263.
What is the Total Female Population of Pullman?
Total Female Population of Pullman is 15,709.
What is the Ratio of Males per 100 Females in Pullman?
There are 103.53 Males per 100 Females in Pullman.
What is the Ratio of Females per 100 Males in Pullman?
There are 96.59 Females per 100 Males in Pullman.
What is the Median Population Age in Pullman?
Median Population Age in Pullman is 22.8 Years.
What is the Average Family Size in Pullman
Average Family Size in Pullman is 2.9 People.
What is the Average Household Size in Pullman
Average Household Size in Pullman is 2.2 People.
What is Per Capita Income in Pullman?
Per Capita income in Pullman is $27,431.
What is the Median Family Income in Pullman?
Median Family Income in Pullman is $88,297.
What is the Median Household income in Pullman?
Median Household Income in Pullman is $41,479.
What is Income or Wage Gap in Pullman?
Income or Wage Gap in Pullman is 46.4%.
Women in Pullman earn 53.6 cents for every dollar earned by a man.
What is Inequality or Gini Index in Pullman?
Inequality or Gini Index in Pullman is 0.57.
How Large is the Labor Force in Pullman?
There are 17,443 People in the Labor Forcein in Pullman.
What is the Percentage of People in the Labor Force in Pullman?
61.4% of People are in the Labor Force in Pullman.
What is the Unemployment Rate in Pullman?
Unemployment Rate in Pullman is 7.8%.