Zip Codes with the Highest Percentage of Population Employed in Administrative & Support Services in Kennewick, WA
RELATED REPORTS & OPTIONS
Administrative & Support Services
Kennewick
Compare Zip Codes
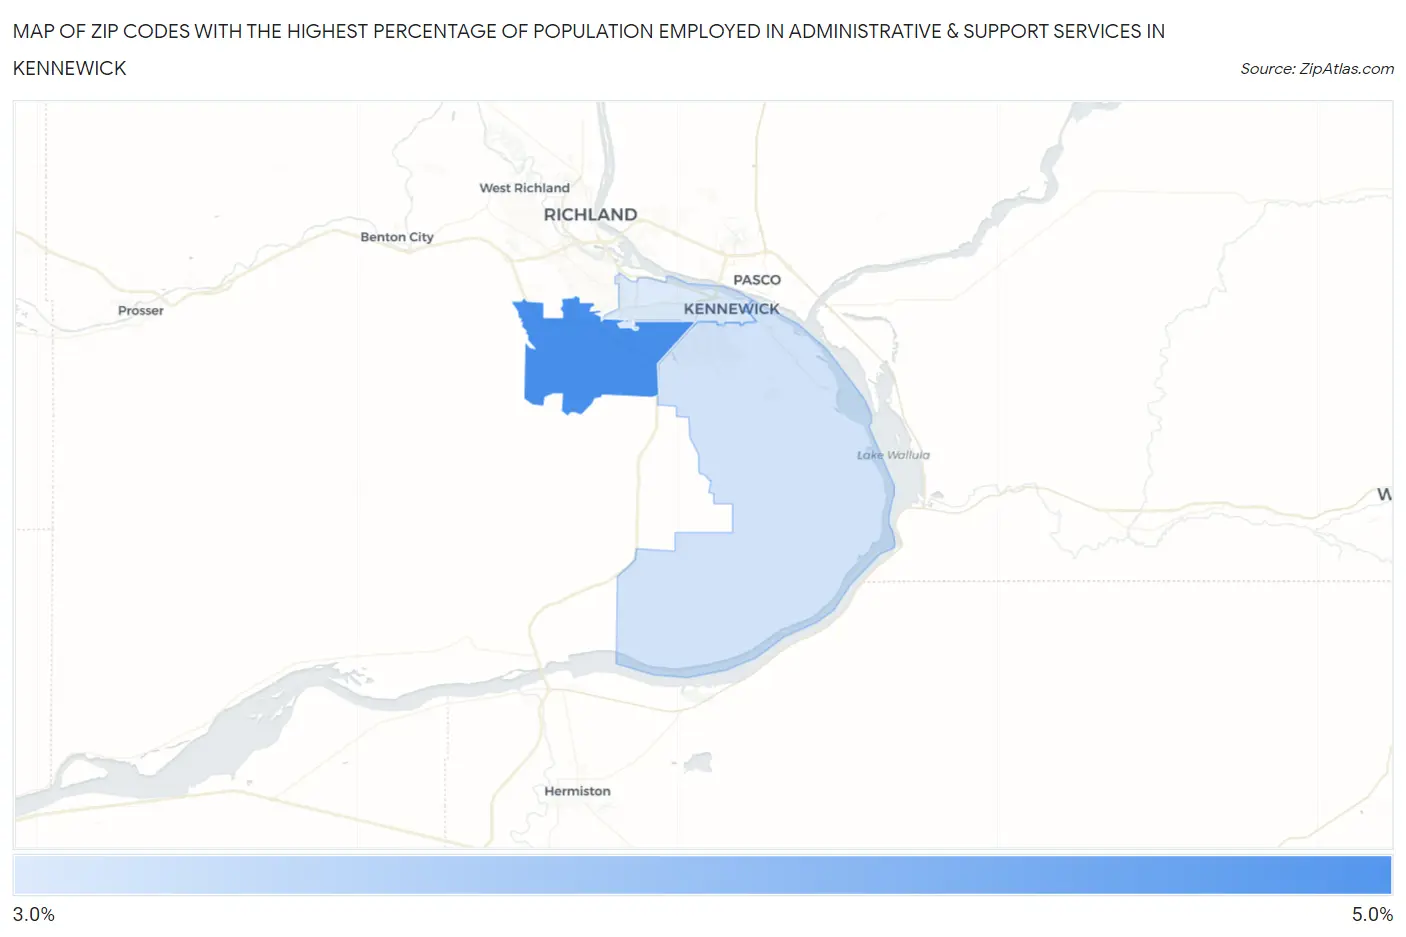
Map of Zip Codes with the Highest Percentage of Population Employed in Administrative & Support Services in Kennewick
0.0%
5.0%
Zip Codes with the Highest Percentage of Population Employed in Administrative & Support Services in Kennewick, WA
| Zip Code | % Employed | vs State | vs National | |
| 1. | 99338 | 4.2% | 3.8%(+0.455)#168 | 4.1%(+0.070)#9,742 |
| 2. | 99337 | 3.9% | 3.8%(+0.115)#205 | 4.1%(-0.269)#11,201 |
| 3. | 99336 | 3.9% | 3.8%(+0.089)#211 | 4.1%(-0.295)#11,306 |
1
Common Questions
What are the Top Zip Codes with the Highest Percentage of Population Employed in Administrative & Support Services in Kennewick, WA?
Top Zip Codes with the Highest Percentage of Population Employed in Administrative & Support Services in Kennewick, WA are:
What zip code has the Highest Percentage of Population Employed in Administrative & Support Services in Kennewick, WA?
99338 has the Highest Percentage of Population Employed in Administrative & Support Services in Kennewick, WA with 4.2%.
What is the Percentage of Population Employed in Administrative & Support Services in Kennewick, WA?
Percentage of Population Employed in Administrative & Support Services in Kennewick is 3.8%.
What is the Percentage of Population Employed in Administrative & Support Services in Washington?
Percentage of Population Employed in Administrative & Support Services in Washington is 3.8%.
What is the Percentage of Population Employed in Administrative & Support Services in the United States?
Percentage of Population Employed in Administrative & Support Services in the United States is 4.1%.