Lewisville, WA
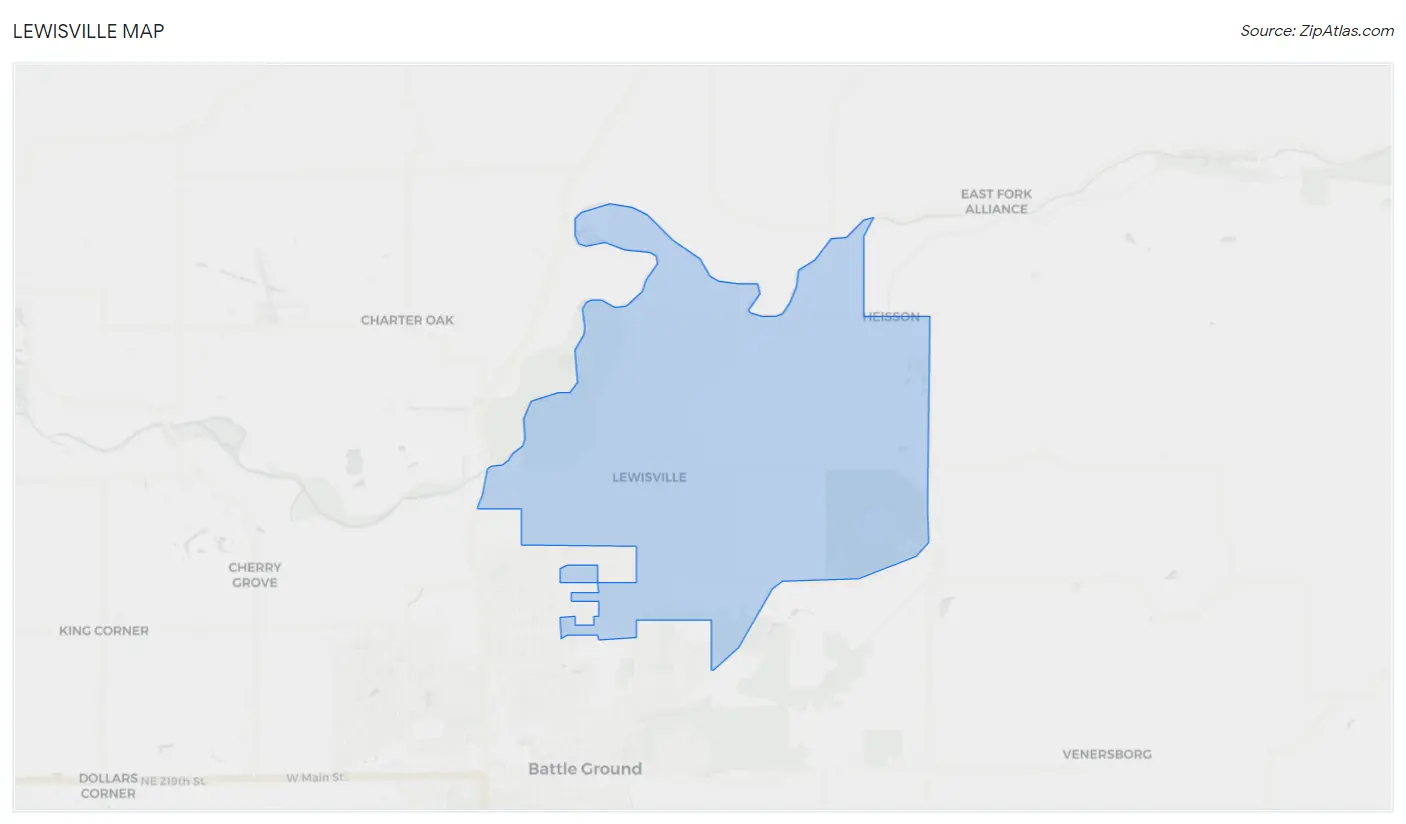
Lewisville Map
Lewisville Overview
2,474
TOTAL POPULATION
1,107
MALE POPULATION
1,367
FEMALE POPULATION
80.98
MALES / 100 FEMALES
123.49
FEMALES / 100 MALES
44.5
MEDIAN AGE
2.9
AVG FAMILY SIZE
3.0
AVG HOUSEHOLD SIZE
$43,184
PER CAPITA INCOME
$114,936
AVG FAMILY INCOME
$114,968
AVG HOUSEHOLD INCOME
43.0%
WAGE / INCOME GAP [ % ]
57.0¢/ $1
WAGE / INCOME GAP [ $ ]
0.32
INEQUALITY / GINI INDEX
1,109
LABOR FORCE [ PEOPLE ]
58.3%
PERCENT IN LABOR FORCE
4.4%
UNEMPLOYMENT RATE
Race in Lewisville
The most populous races in Lewisville are White / Caucasian (2,315 | 93.6%), Hispanic or Latino (99 | 4.0%), and Two or more Races (89 | 3.6%).
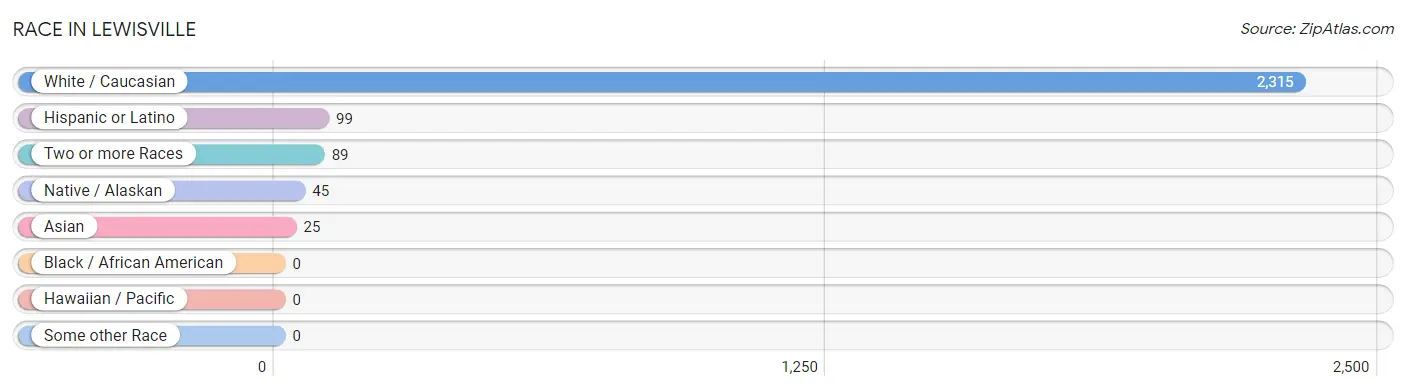
| Race | # Population | % Population |
| Asian | 25 | 1.0% |
| Black / African American | 0 | 0.0% |
| Hawaiian / Pacific | 0 | 0.0% |
| Hispanic or Latino | 99 | 4.0% |
| Native / Alaskan | 45 | 1.8% |
| White / Caucasian | 2,315 | 93.6% |
| Two or more Races | 89 | 3.6% |
| Some other Race | 0 | 0.0% |
| Total | 2,474 | 100.0% |
Ancestry in Lewisville
The most populous ancestries reported in Lewisville are English (619 | 25.0%), Irish (331 | 13.4%), German (323 | 13.1%), Ukrainian (166 | 6.7%), and French (125 | 5.1%), together accounting for 63.2% of all Lewisville residents.
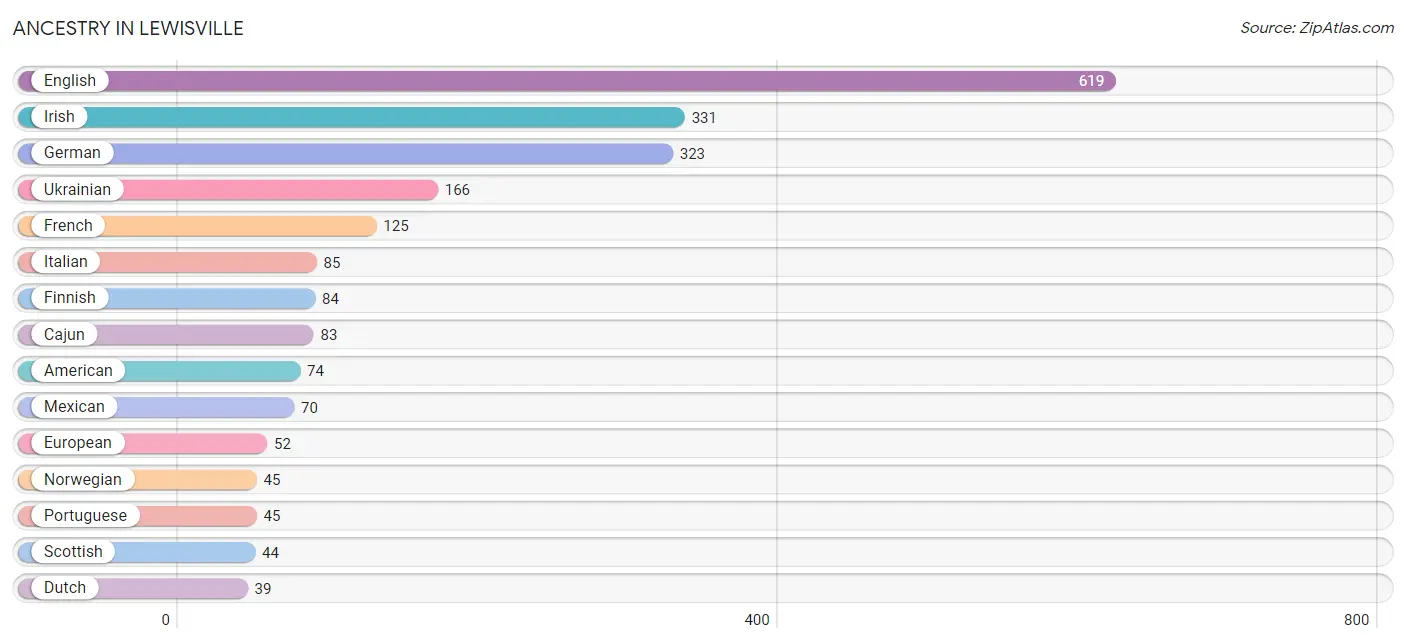
| Ancestry | # Population | % Population |
| American | 74 | 3.0% |
| Bhutanese | 14 | 0.6% |
| British | 6 | 0.2% |
| Burmese | 25 | 1.0% |
| Cajun | 83 | 3.4% |
| Canadian | 4 | 0.2% |
| Cherokee | 1 | 0.0% |
| Croatian | 28 | 1.1% |
| Danish | 6 | 0.2% |
| Dutch | 39 | 1.6% |
| English | 619 | 25.0% |
| European | 52 | 2.1% |
| Finnish | 84 | 3.4% |
| French | 125 | 5.1% |
| German | 323 | 13.1% |
| Hungarian | 11 | 0.4% |
| Indian (Asian) | 11 | 0.4% |
| Irish | 331 | 13.4% |
| Italian | 85 | 3.4% |
| Lithuanian | 23 | 0.9% |
| Mexican | 70 | 2.8% |
| Norwegian | 45 | 1.8% |
| Polish | 29 | 1.2% |
| Portuguese | 45 | 1.8% |
| Russian | 9 | 0.4% |
| Scandinavian | 9 | 0.4% |
| Scottish | 44 | 1.8% |
| Slovene | 8 | 0.3% |
| Spaniard | 4 | 0.2% |
| Spanish | 25 | 1.0% |
| Swedish | 24 | 1.0% |
| Ukrainian | 166 | 6.7% |
| Welsh | 11 | 0.4% |
| Yugoslavian | 13 | 0.5% | View All 34 Rows |
Immigrants in Lewisville
The most numerous immigrant groups reported in Lewisville came from Eastern Europe (54 | 2.2%), Europe (54 | 2.2%), Ukraine (48 | 1.9%), Asia (14 | 0.6%), and Eastern Asia (14 | 0.6%), together accounting for 7.4% of all Lewisville residents.

| Immigration Origin | # Population | % Population |
| Asia | 14 | 0.6% |
| Central America | 12 | 0.5% |
| Eastern Asia | 14 | 0.6% |
| Eastern Europe | 54 | 2.2% |
| Europe | 54 | 2.2% |
| Japan | 14 | 0.6% |
| Latin America | 12 | 0.5% |
| Mexico | 12 | 0.5% |
| Moldova | 6 | 0.2% |
| Ukraine | 48 | 1.9% | View All 10 Rows |
Sex and Age in Lewisville
Sex and Age in Lewisville
The most populous age groups in Lewisville are 10 to 14 Years (132 | 11.9%) for men and 40 to 44 Years (147 | 10.7%) for women.
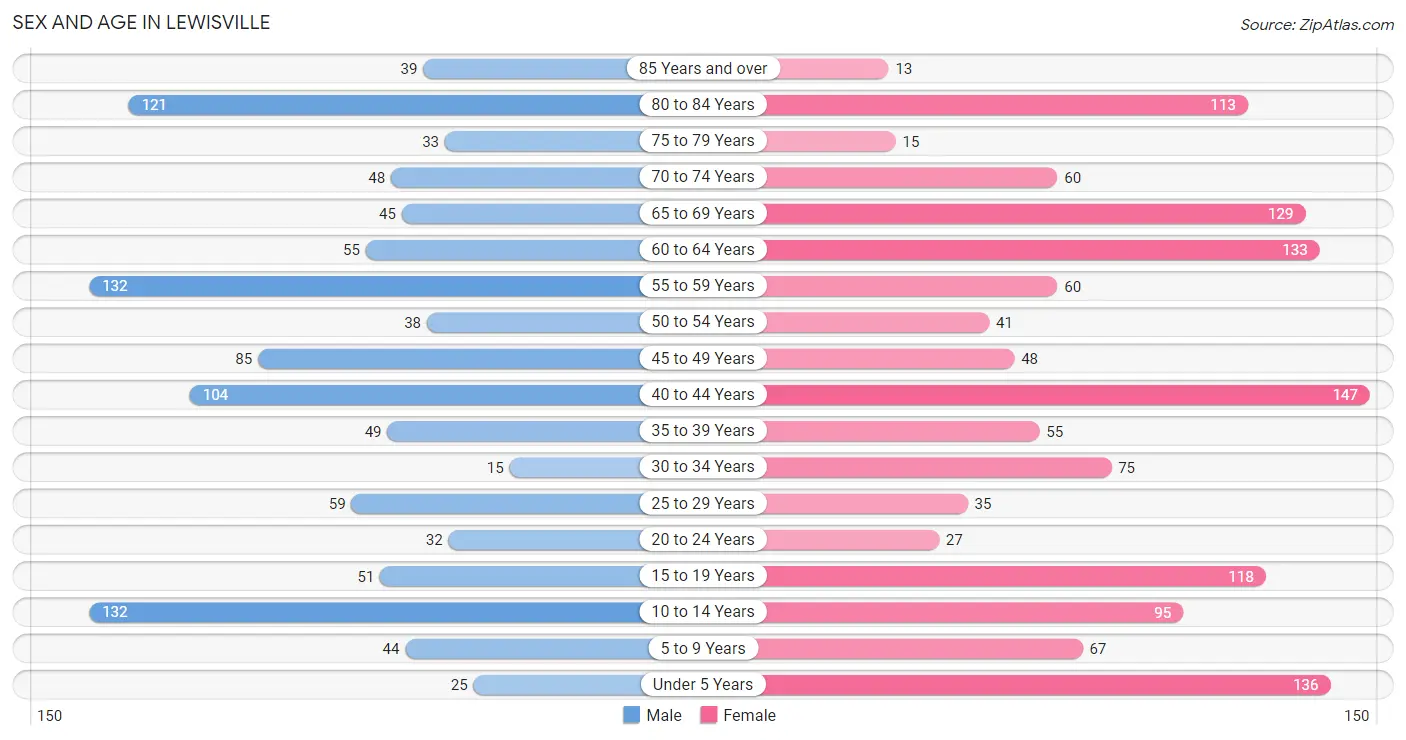
| Age Bracket | Male | Female |
| Under 5 Years | 25 (2.3%) | 136 (10.0%) |
| 5 to 9 Years | 44 (4.0%) | 67 (4.9%) |
| 10 to 14 Years | 132 (11.9%) | 95 (7.0%) |
| 15 to 19 Years | 51 (4.6%) | 118 (8.6%) |
| 20 to 24 Years | 32 (2.9%) | 27 (2.0%) |
| 25 to 29 Years | 59 (5.3%) | 35 (2.6%) |
| 30 to 34 Years | 15 (1.4%) | 75 (5.5%) |
| 35 to 39 Years | 49 (4.4%) | 55 (4.0%) |
| 40 to 44 Years | 104 (9.4%) | 147 (10.7%) |
| 45 to 49 Years | 85 (7.7%) | 48 (3.5%) |
| 50 to 54 Years | 38 (3.4%) | 41 (3.0%) |
| 55 to 59 Years | 132 (11.9%) | 60 (4.4%) |
| 60 to 64 Years | 55 (5.0%) | 133 (9.7%) |
| 65 to 69 Years | 45 (4.1%) | 129 (9.4%) |
| 70 to 74 Years | 48 (4.3%) | 60 (4.4%) |
| 75 to 79 Years | 33 (3.0%) | 15 (1.1%) |
| 80 to 84 Years | 121 (10.9%) | 113 (8.3%) |
| 85 Years and over | 39 (3.5%) | 13 (0.9%) |
| Total | 1,107 (100.0%) | 1,367 (100.0%) |
Families and Households in Lewisville
Median Family Size in Lewisville
The median family size in Lewisville is 2.94 persons per family, with single male/father families (17 | 2.2%) accounting for the largest median family size of 3.41 persons per family. On the other hand, single female/mother families (37 | 4.8%) represent the smallest median family size with 2.62 persons per family.
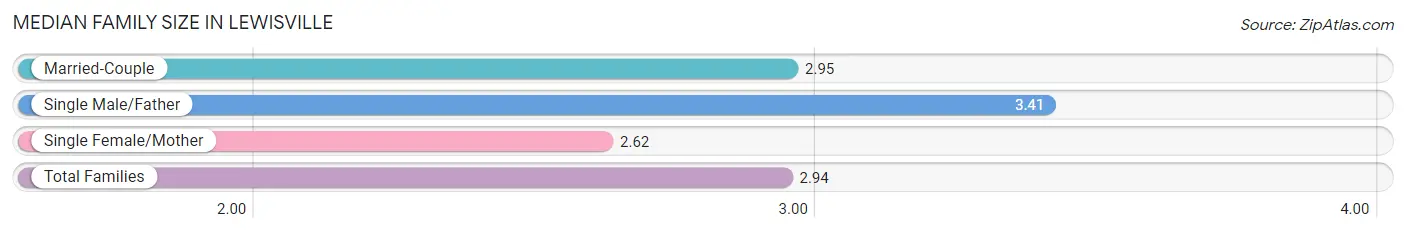
| Family Type | # Families | Family Size |
| Married-Couple | 718 (93.0%) | 2.95 |
| Single Male/Father | 17 (2.2%) | 3.41 |
| Single Female/Mother | 37 (4.8%) | 2.62 |
| Total Families | 772 (100.0%) | 2.94 |
Median Household Size in Lewisville
The median household size in Lewisville is 2.99 persons per household, with single male/father households (17 | 2.1%) accounting for the largest median household size of 3.94 persons per household. non-family households (55 | 6.7%) represent the smallest median household size with 1.49 persons per household.
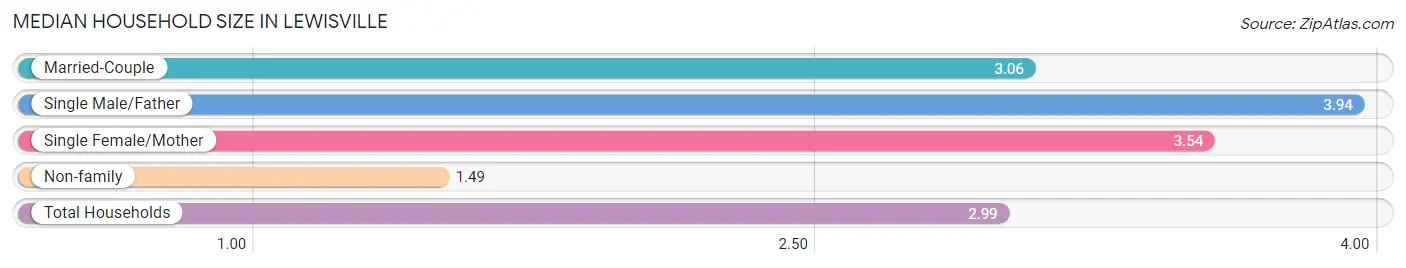
| Household Type | # Households | Household Size |
| Married-Couple | 718 (86.8%) | 3.06 |
| Single Male/Father | 17 (2.1%) | 3.94 |
| Single Female/Mother | 37 (4.5%) | 3.54 |
| Non-family | 55 (6.7%) | 1.49 |
| Total Households | 827 (100.0%) | 2.99 |
Household Size by Marriage Status in Lewisville
Out of a total of 827 households in Lewisville, 772 (93.3%) are family households, while 55 (6.7%) are nonfamily households. The most numerous type of family households are 2-person households, comprising 433, and the most common type of nonfamily households are 1-person households, comprising 28.
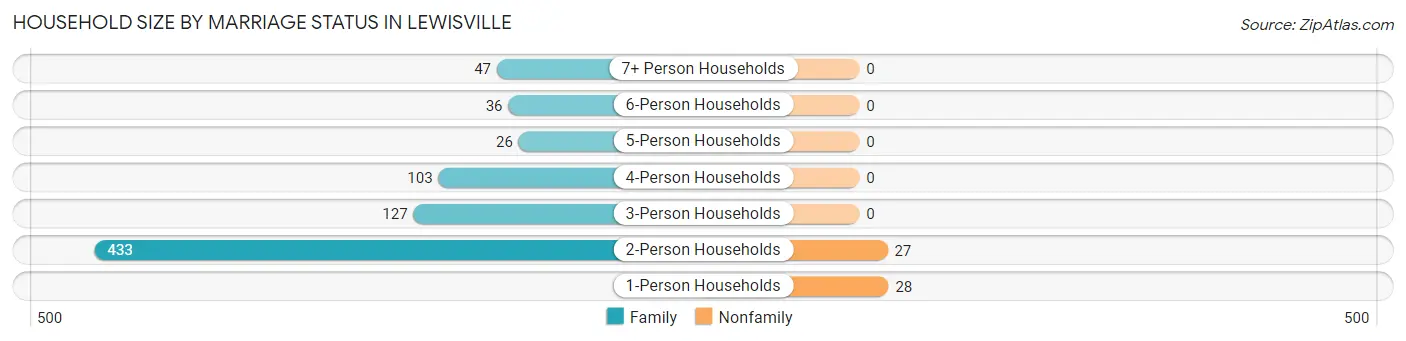
| Household Size | Family Households | Nonfamily Households |
| 1-Person Households | - | 28 (3.4%) |
| 2-Person Households | 433 (52.4%) | 27 (3.3%) |
| 3-Person Households | 127 (15.4%) | 0 (0.0%) |
| 4-Person Households | 103 (12.4%) | 0 (0.0%) |
| 5-Person Households | 26 (3.1%) | 0 (0.0%) |
| 6-Person Households | 36 (4.3%) | 0 (0.0%) |
| 7+ Person Households | 47 (5.7%) | 0 (0.0%) |
| Total | 772 (93.3%) | 55 (6.7%) |
Female Fertility in Lewisville
Fertility by Age in Lewisville
Average fertility rate in Lewisville is 12.0 births per 1,000 women. Women in the age bracket of 35 to 50 years have the highest fertility rate with 23.0 births per 1,000 women. Women in the age bracket of 35 to 50 years acount for 100.0% of all women with births.
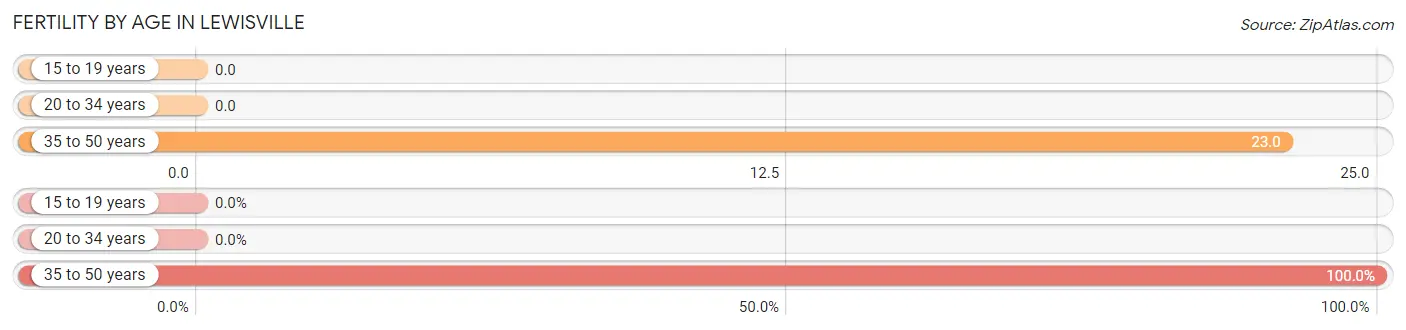
| Age Bracket | Women with Births | Births / 1,000 Women |
| 15 to 19 years | 0 (0.0%) | 0.0 |
| 20 to 34 years | 0 (0.0%) | 0.0 |
| 35 to 50 years | 6 (100.0%) | 23.0 |
| Total | 6 (100.0%) | 12.0 |
Fertility by Age by Marriage Status in Lewisville
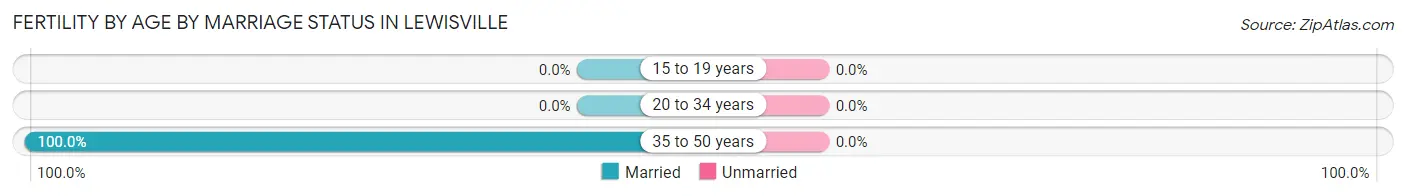
| Age Bracket | Married | Unmarried |
| 15 to 19 years | 0 (0.0%) | 0 (0.0%) |
| 20 to 34 years | 0 (0.0%) | 0 (0.0%) |
| 35 to 50 years | 6 (100.0%) | 0 (0.0%) |
| Total | 6 (100.0%) | 0 (0.0%) |
Fertility by Education in Lewisville
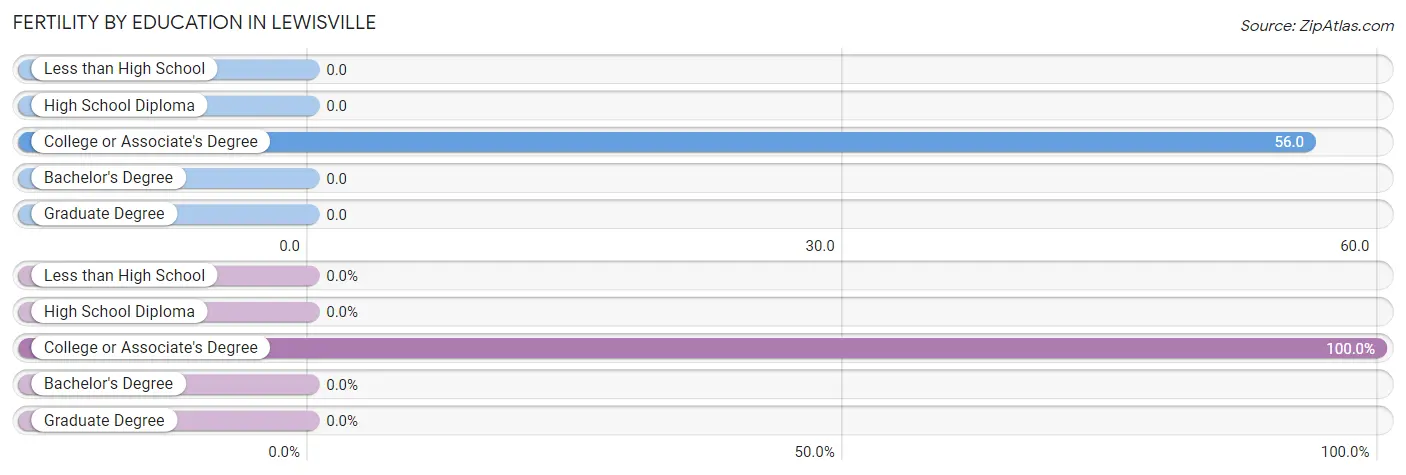
| Educational Attainment | Women with Births | Births / 1,000 Women |
| Less than High School | 0 (0.0%) | 0.0 |
| High School Diploma | 0 (0.0%) | 0.0 |
| College or Associate's Degree | 6 (100.0%) | 56.0 |
| Bachelor's Degree | 0 (0.0%) | 0.0 |
| Graduate Degree | 0 (0.0%) | 0.0 |
| Total | 6 (100.0%) | 12.0 |
Fertility by Education by Marriage Status in Lewisville
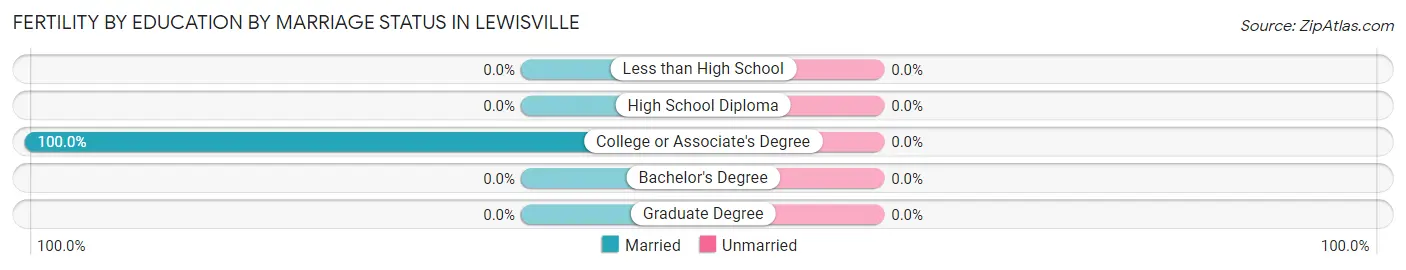
| Educational Attainment | Married | Unmarried |
| Less than High School | 0 (0.0%) | 0 (0.0%) |
| High School Diploma | 0 (0.0%) | 0 (0.0%) |
| College or Associate's Degree | 6 (100.0%) | 0 (0.0%) |
| Bachelor's Degree | 0 (0.0%) | 0 (0.0%) |
| Graduate Degree | 0 (0.0%) | 0 (0.0%) |
| Total | 6 (100.0%) | 0 (0.0%) |
Income in Lewisville
Income Overview in Lewisville
Per Capita Income in Lewisville is $43,184, while median incomes of families and households are $114,936 and $114,968 respectively.
| Characteristic | Number | Measure |
| Per Capita Income | 2,474 | $43,184 |
| Median Family Income | 772 | $114,936 |
| Mean Family Income | 772 | $126,099 |
| Median Household Income | 827 | $114,968 |
| Mean Household Income | 827 | $127,601 |
| Income Deficit | 772 | $0 |
| Wage / Income Gap (%) | 2,474 | 43.04% |
| Wage / Income Gap ($) | 2,474 | 56.96¢ per $1 |
| Gini / Inequality Index | 2,474 | 0.32 |
Earnings by Sex in Lewisville
Average Earnings in Lewisville are $57,500, $69,782 for men and $39,750 for women, a difference of 43.0%.
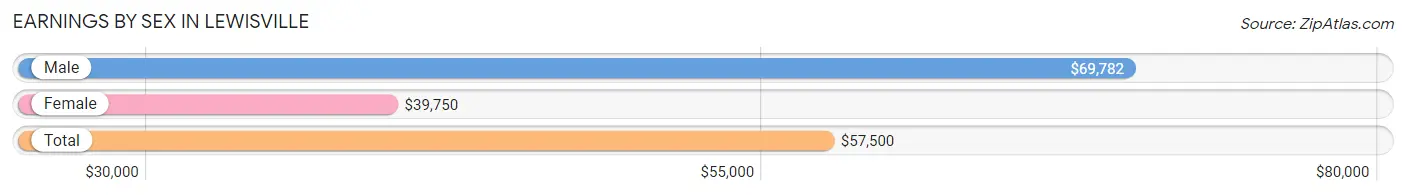
| Sex | Number | Average Earnings |
| Male | 679 (61.2%) | $69,782 |
| Female | 431 (38.8%) | $39,750 |
| Total | 1,110 (100.0%) | $57,500 |
Earnings by Sex by Income Bracket in Lewisville
The most common earnings brackets in Lewisville are $100,000+ for men (217 | 32.0%) and $12,500 to $14,999 for women (67 | 15.5%).
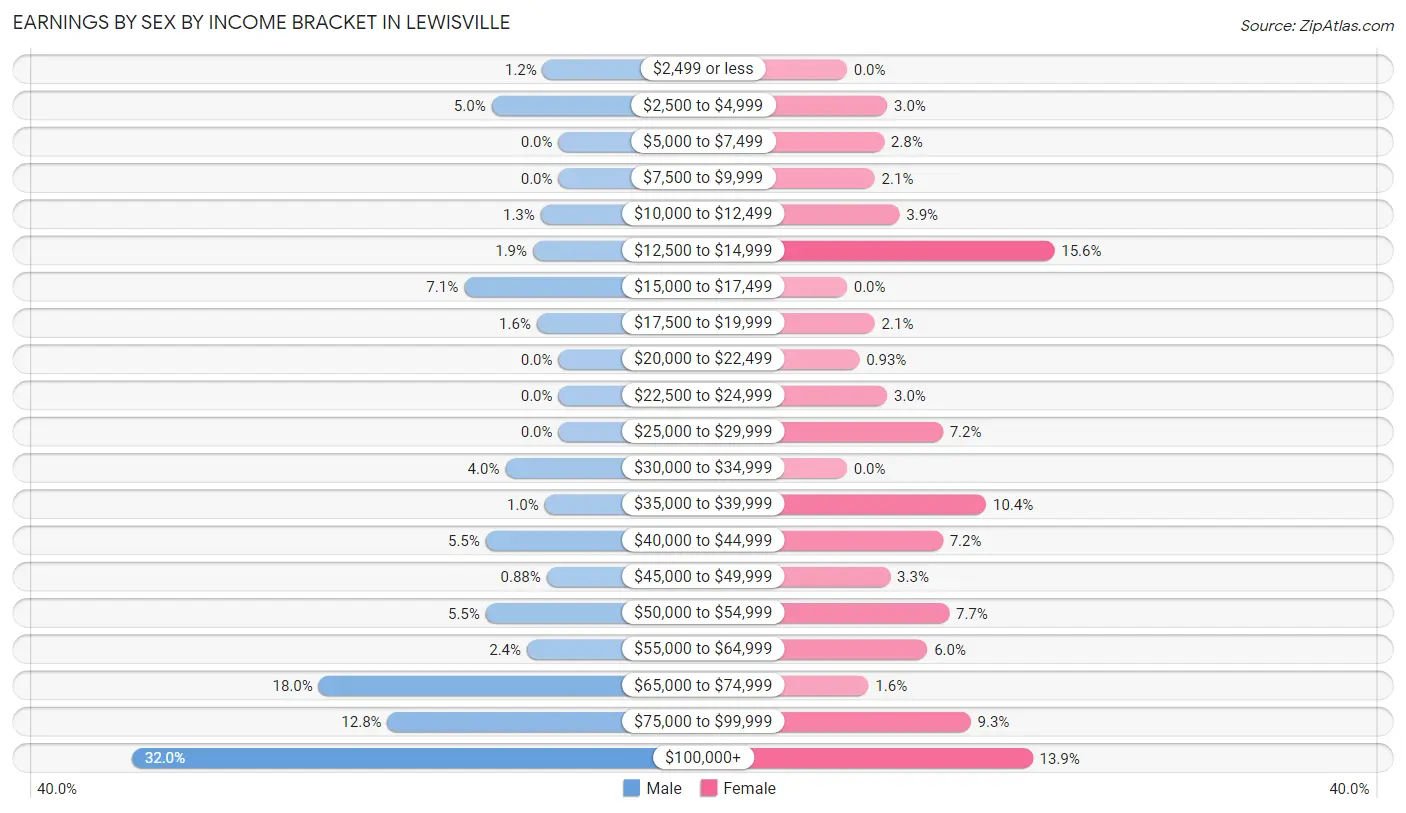
| Income | Male | Female |
| $2,499 or less | 8 (1.2%) | 0 (0.0%) |
| $2,500 to $4,999 | 34 (5.0%) | 13 (3.0%) |
| $5,000 to $7,499 | 0 (0.0%) | 12 (2.8%) |
| $7,500 to $9,999 | 0 (0.0%) | 9 (2.1%) |
| $10,000 to $12,499 | 9 (1.3%) | 17 (3.9%) |
| $12,500 to $14,999 | 13 (1.9%) | 67 (15.5%) |
| $15,000 to $17,499 | 48 (7.1%) | 0 (0.0%) |
| $17,500 to $19,999 | 11 (1.6%) | 9 (2.1%) |
| $20,000 to $22,499 | 0 (0.0%) | 4 (0.9%) |
| $22,500 to $24,999 | 0 (0.0%) | 13 (3.0%) |
| $25,000 to $29,999 | 0 (0.0%) | 31 (7.2%) |
| $30,000 to $34,999 | 27 (4.0%) | 0 (0.0%) |
| $35,000 to $39,999 | 7 (1.0%) | 45 (10.4%) |
| $40,000 to $44,999 | 37 (5.4%) | 31 (7.2%) |
| $45,000 to $49,999 | 6 (0.9%) | 14 (3.3%) |
| $50,000 to $54,999 | 37 (5.4%) | 33 (7.7%) |
| $55,000 to $64,999 | 16 (2.4%) | 26 (6.0%) |
| $65,000 to $74,999 | 122 (18.0%) | 7 (1.6%) |
| $75,000 to $99,999 | 87 (12.8%) | 40 (9.3%) |
| $100,000+ | 217 (32.0%) | 60 (13.9%) |
| Total | 679 (100.0%) | 431 (100.0%) |
Earnings by Sex by Educational Attainment in Lewisville
Average earnings in Lewisville are $75,288 for men and $42,727 for women, a difference of 43.2%. Men with an educational attainment of bachelor's degree enjoy the highest average annual earnings of $163,281, while those with high school diploma education earn the least with $68,611. Women with an educational attainment of bachelor's degree earn the most with the average annual earnings of $109,375, while those with college or associate's degree education have the smallest earnings of $38,111.
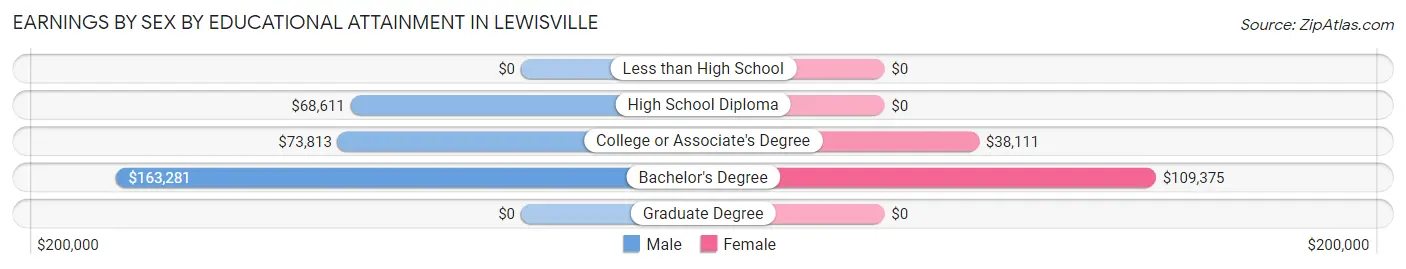
| Educational Attainment | Male Income | Female Income |
| Less than High School | - | - |
| High School Diploma | $68,611 | $0 |
| College or Associate's Degree | $73,813 | $38,111 |
| Bachelor's Degree | $163,281 | $109,375 |
| Graduate Degree | - | - |
| Total | $75,288 | $42,727 |
Family Income in Lewisville
Family Income Brackets in Lewisville
According to the Lewisville family income data, there are 232 families falling into the $100,000 to $149,999 income range, which is the most common income bracket and makes up 30.0% of all families.
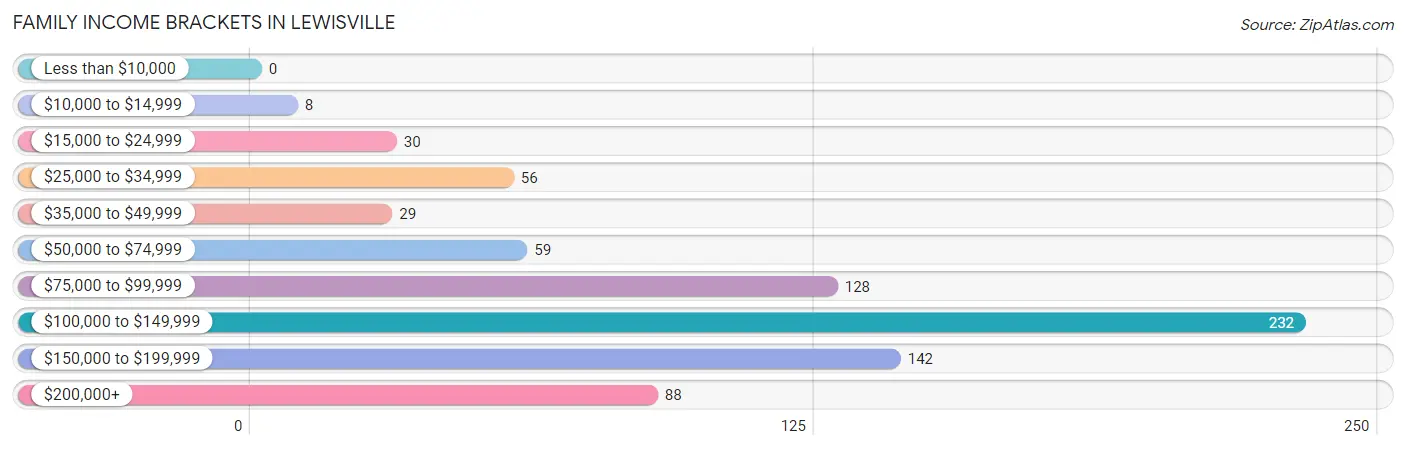
| Income Bracket | # Families | % Families |
| Less than $10,000 | 0 | 0.0% |
| $10,000 to $14,999 | 8 | 1.0% |
| $15,000 to $24,999 | 30 | 3.9% |
| $25,000 to $34,999 | 56 | 7.3% |
| $35,000 to $49,999 | 29 | 3.8% |
| $50,000 to $74,999 | 59 | 7.6% |
| $75,000 to $99,999 | 128 | 16.6% |
| $100,000 to $149,999 | 232 | 30.1% |
| $150,000 to $199,999 | 142 | 18.4% |
| $200,000+ | 88 | 11.4% |
Family Income by Famaliy Size in Lewisville
4-person families (93 | 12.0%) account for the highest median family income in Lewisville with $198,250 per family, while 2-person families (495 | 64.1%) have the highest median income of $56,271 per family member.
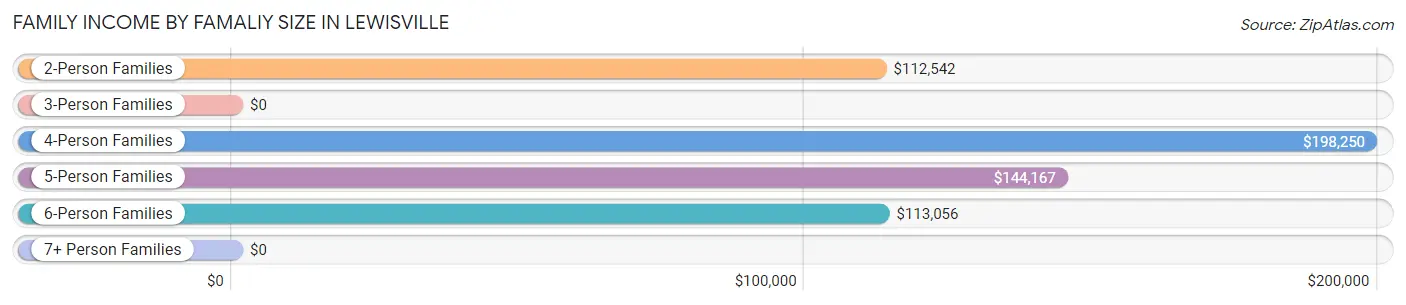
| Income Bracket | # Families | Median Income |
| 2-Person Families | 495 (64.1%) | $112,542 |
| 3-Person Families | 87 (11.3%) | $0 |
| 4-Person Families | 93 (12.0%) | $198,250 |
| 5-Person Families | 20 (2.6%) | $144,167 |
| 6-Person Families | 30 (3.9%) | $113,056 |
| 7+ Person Families | 47 (6.1%) | $0 |
| Total | 772 (100.0%) | $114,936 |
Family Income by Number of Earners in Lewisville
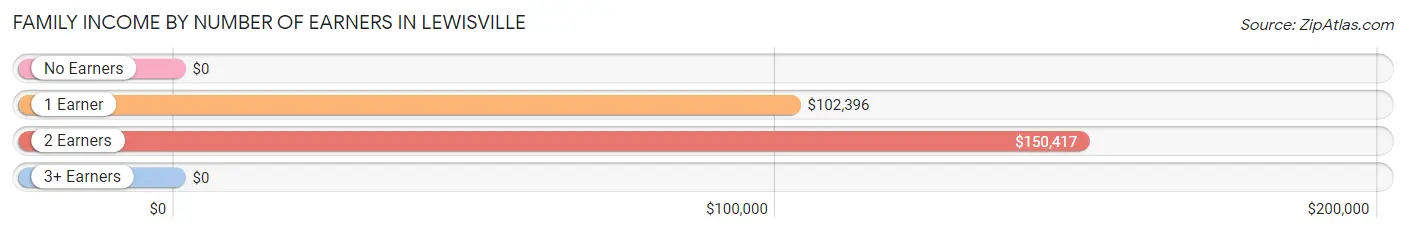
| Number of Earners | # Families | Median Income |
| No Earners | 164 (21.2%) | $0 |
| 1 Earner | 275 (35.6%) | $102,396 |
| 2 Earners | 324 (42.0%) | $150,417 |
| 3+ Earners | 9 (1.2%) | $0 |
| Total | 772 (100.0%) | $114,936 |
Household Income in Lewisville
Household Income Brackets in Lewisville
With 269 households falling in the category, the $100,000 to $149,999 income range is the most frequent in Lewisville, accounting for 32.5% of all households.
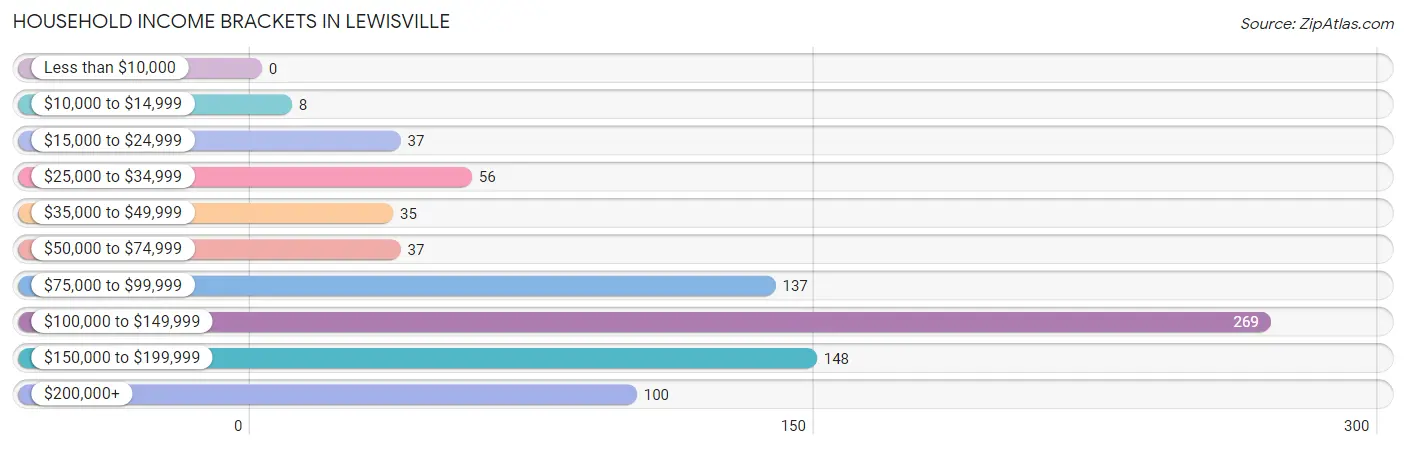
| Income Bracket | # Households | % Households |
| Less than $10,000 | 0 | 0.0% |
| $10,000 to $14,999 | 8 | 1.0% |
| $15,000 to $24,999 | 37 | 4.5% |
| $25,000 to $34,999 | 56 | 6.8% |
| $35,000 to $49,999 | 35 | 4.2% |
| $50,000 to $74,999 | 37 | 4.5% |
| $75,000 to $99,999 | 137 | 16.6% |
| $100,000 to $149,999 | 269 | 32.5% |
| $150,000 to $199,999 | 148 | 17.9% |
| $200,000+ | 100 | 12.1% |
Household Income by Householder Age in Lewisville
The median household income in Lewisville is $114,968, with the highest median household income of $136,538 found in the 25 to 44 years age bracket for the primary householder. A total of 216 households (26.1%) fall into this category.
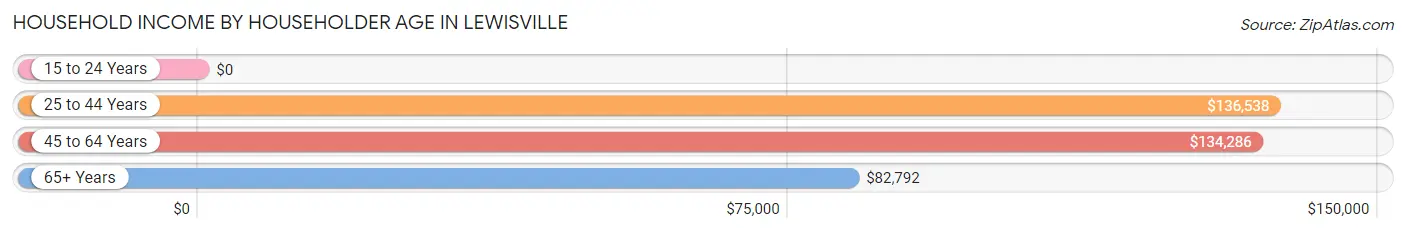
| Income Bracket | # Households | Median Income |
| 15 to 24 Years | 0 (0.0%) | $0 |
| 25 to 44 Years | 216 (26.1%) | $136,538 |
| 45 to 64 Years | 278 (33.6%) | $134,286 |
| 65+ Years | 333 (40.3%) | $82,792 |
| Total | 827 (100.0%) | $114,968 |
Poverty in Lewisville
Income Below Poverty by Sex and Age in Lewisville
With 0.7% poverty level for males and 4.9% for females among the residents of Lewisville, 75 year old and over males and 35 to 44 year old females are the most vulnerable to poverty, with 8 males (4.2%) and 54 females (26.7%) in their respective age groups living below the poverty level.
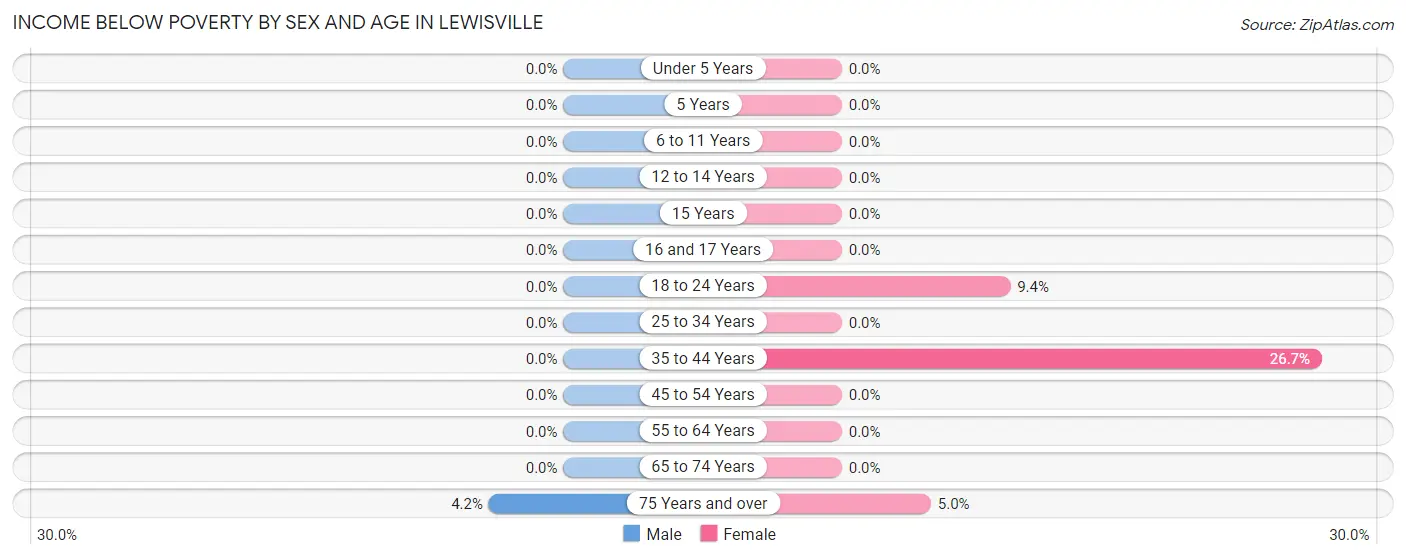
| Age Bracket | Male | Female |
| Under 5 Years | 0 (0.0%) | 0 (0.0%) |
| 5 Years | 0 (0.0%) | 0 (0.0%) |
| 6 to 11 Years | 0 (0.0%) | 0 (0.0%) |
| 12 to 14 Years | 0 (0.0%) | 0 (0.0%) |
| 15 Years | 0 (0.0%) | 0 (0.0%) |
| 16 and 17 Years | 0 (0.0%) | 0 (0.0%) |
| 18 to 24 Years | 0 (0.0%) | 6 (9.4%) |
| 25 to 34 Years | 0 (0.0%) | 0 (0.0%) |
| 35 to 44 Years | 0 (0.0%) | 54 (26.7%) |
| 45 to 54 Years | 0 (0.0%) | 0 (0.0%) |
| 55 to 64 Years | 0 (0.0%) | 0 (0.0%) |
| 65 to 74 Years | 0 (0.0%) | 0 (0.0%) |
| 75 Years and over | 8 (4.2%) | 7 (5.0%) |
| Total | 8 (0.7%) | 67 (4.9%) |
Income Above Poverty by Sex and Age in Lewisville
According to the poverty statistics in Lewisville, males aged under 5 years and females aged under 5 years are the age groups that are most secure financially, with 100.0% of males and 100.0% of females in these age groups living above the poverty line.
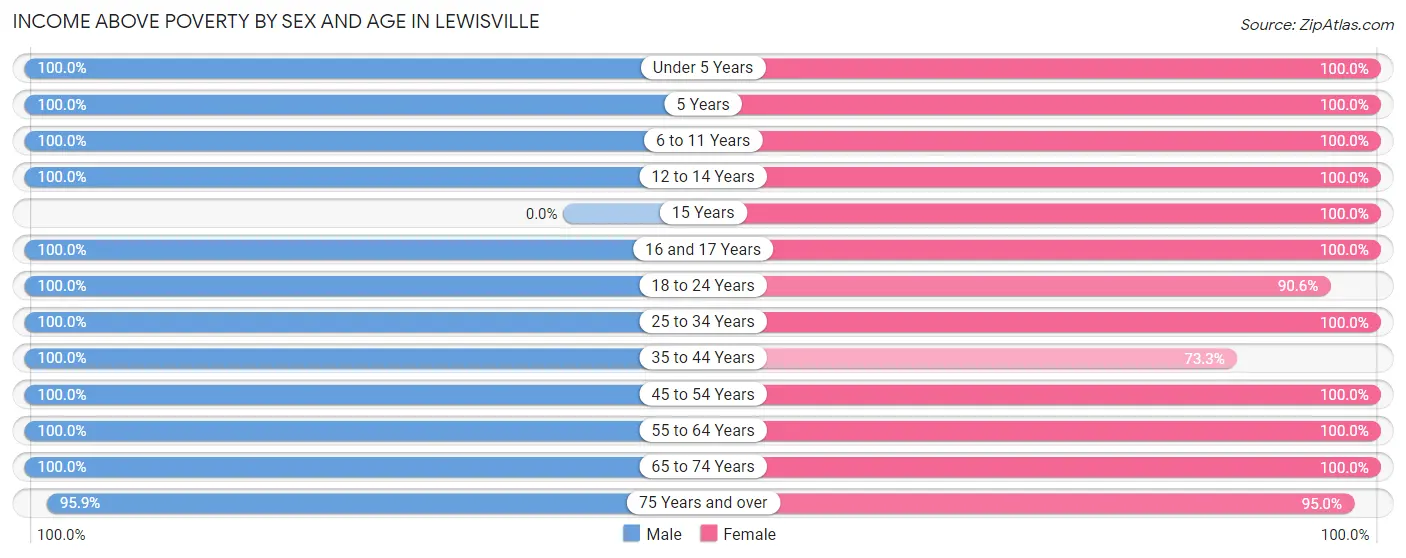
| Age Bracket | Male | Female |
| Under 5 Years | 25 (100.0%) | 136 (100.0%) |
| 5 Years | 9 (100.0%) | 21 (100.0%) |
| 6 to 11 Years | 79 (100.0%) | 56 (100.0%) |
| 12 to 14 Years | 88 (100.0%) | 85 (100.0%) |
| 15 Years | 0 (0.0%) | 72 (100.0%) |
| 16 and 17 Years | 18 (100.0%) | 9 (100.0%) |
| 18 to 24 Years | 65 (100.0%) | 58 (90.6%) |
| 25 to 34 Years | 74 (100.0%) | 110 (100.0%) |
| 35 to 44 Years | 153 (100.0%) | 148 (73.3%) |
| 45 to 54 Years | 123 (100.0%) | 89 (100.0%) |
| 55 to 64 Years | 187 (100.0%) | 193 (100.0%) |
| 65 to 74 Years | 93 (100.0%) | 189 (100.0%) |
| 75 Years and over | 185 (95.9%) | 134 (95.0%) |
| Total | 1,099 (99.3%) | 1,300 (95.1%) |
Income Below Poverty Among Married-Couple Families in Lewisville
The poverty statistics for married-couple families in Lewisville show that 1.1% or 8 of the total 718 families live below the poverty line. Families with no children have the highest poverty rate of 1.7%, comprising of 8 families. On the other hand, families with 1 or 2 children have the lowest poverty rate of 0.0%, which includes 0 families.
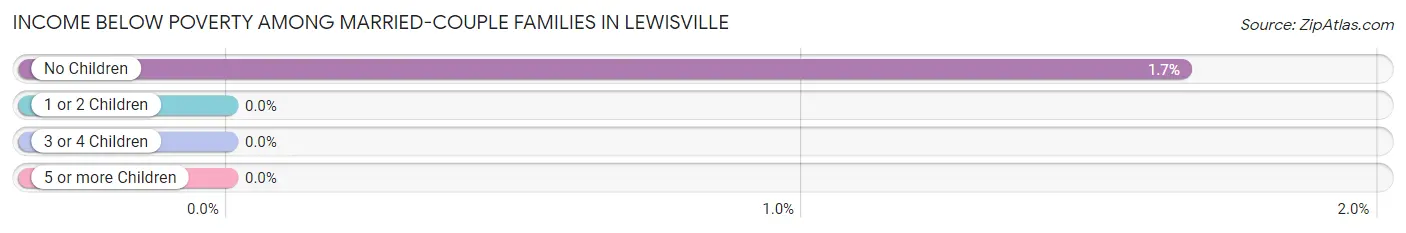
| Children | Above Poverty | Below Poverty |
| No Children | 474 (98.3%) | 8 (1.7%) |
| 1 or 2 Children | 156 (100.0%) | 0 (0.0%) |
| 3 or 4 Children | 36 (100.0%) | 0 (0.0%) |
| 5 or more Children | 44 (100.0%) | 0 (0.0%) |
| Total | 710 (98.9%) | 8 (1.1%) |
Income Below Poverty Among Single-Parent Households in Lewisville
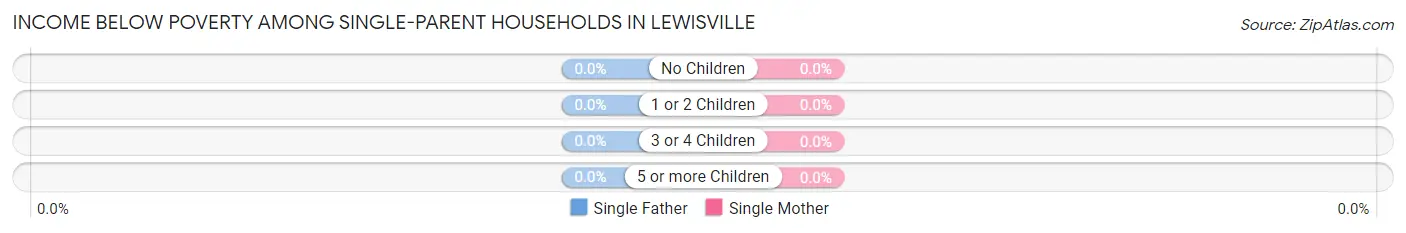
| Children | Single Father | Single Mother |
| No Children | 0 (0.0%) | 0 (0.0%) |
| 1 or 2 Children | 0 (0.0%) | 0 (0.0%) |
| 3 or 4 Children | 0 (0.0%) | 0 (0.0%) |
| 5 or more Children | 0 (0.0%) | 0 (0.0%) |
| Total | 0 (0.0%) | 0 (0.0%) |
Income Below Poverty Among Married-Couple vs Single-Parent Households in Lewisville
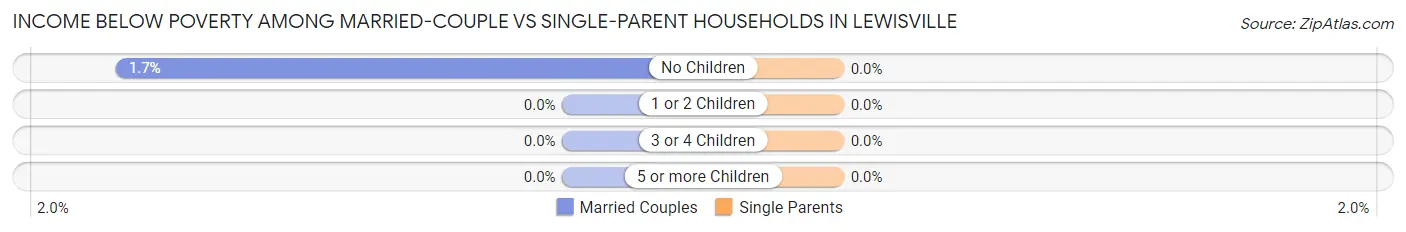
| Children | Married-Couple Families | Single-Parent Households |
| No Children | 8 (1.7%) | 0 (0.0%) |
| 1 or 2 Children | 0 (0.0%) | 0 (0.0%) |
| 3 or 4 Children | 0 (0.0%) | 0 (0.0%) |
| 5 or more Children | 0 (0.0%) | 0 (0.0%) |
| Total | 8 (1.1%) | 0 (0.0%) |
Employment Characteristics in Lewisville
Employment by Class of Employer in Lewisville
Among the 1,047 employed individuals in Lewisville, private company employees (762 | 72.8%), self-employed (incorporated) (141 | 13.5%), and local government employees (93 | 8.9%) make up the most common classes of employment.
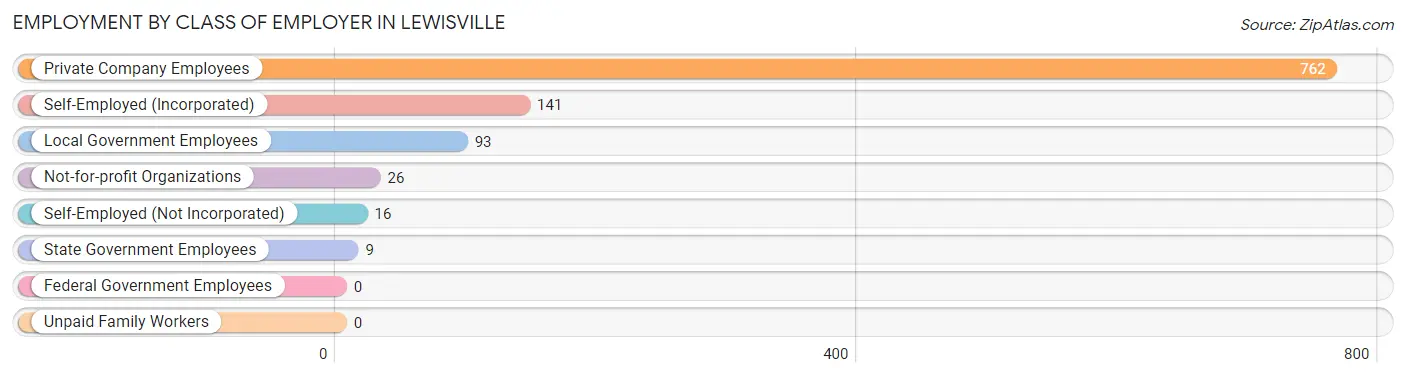
| Employer Class | # Employees | % Employees |
| Private Company Employees | 762 | 72.8% |
| Self-Employed (Incorporated) | 141 | 13.5% |
| Self-Employed (Not Incorporated) | 16 | 1.5% |
| Not-for-profit Organizations | 26 | 2.5% |
| Local Government Employees | 93 | 8.9% |
| State Government Employees | 9 | 0.9% |
| Federal Government Employees | 0 | 0.0% |
| Unpaid Family Workers | 0 | 0.0% |
| Total | 1,047 | 100.0% |
Employment Status by Age in Lewisville
According to the labor force statistics for Lewisville, out of the total population over 16 years of age (1,903), 58.3% or 1,109 individuals are in the labor force, with 4.4% or 49 of them unemployed. The age group with the highest labor force participation rate is 20 to 24 years, with 100.0% or 59 individuals in the labor force. Within the labor force, the 20 to 24 years age range has the highest percentage of unemployed individuals, with 50.8% or 30 of them being unemployed.
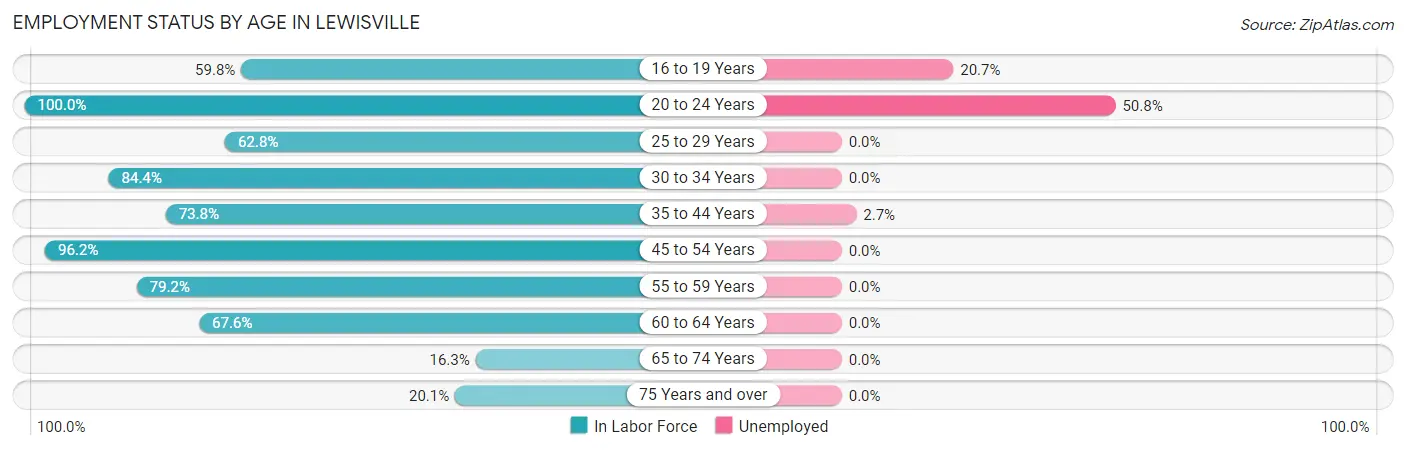
| Age Bracket | In Labor Force | Unemployed |
| 16 to 19 Years | 58 (59.8%) | 12 (20.7%) |
| 20 to 24 Years | 59 (100.0%) | 30 (50.8%) |
| 25 to 29 Years | 59 (62.8%) | 0 (0.0%) |
| 30 to 34 Years | 76 (84.4%) | 0 (0.0%) |
| 35 to 44 Years | 262 (73.8%) | 7 (2.7%) |
| 45 to 54 Years | 204 (96.2%) | 0 (0.0%) |
| 55 to 59 Years | 152 (79.2%) | 0 (0.0%) |
| 60 to 64 Years | 127 (67.6%) | 0 (0.0%) |
| 65 to 74 Years | 46 (16.3%) | 0 (0.0%) |
| 75 Years and over | 67 (20.1%) | 0 (0.0%) |
| Total | 1,109 (58.3%) | 49 (4.4%) |
Employment Status by Educational Attainment in Lewisville
According to labor force statistics for Lewisville, 77.8% of individuals (880) out of the total population between 25 and 64 years of age (1,131) are in the labor force, with 0.8% or 7 of them being unemployed. The group with the highest labor force participation rate are those with the educational attainment of less than high school, with 100.0% or 73 individuals in the labor force. Within the labor force, individuals with college / associate degree education have the highest percentage of unemployment, with 3.0% or 7 of them being unemployed.
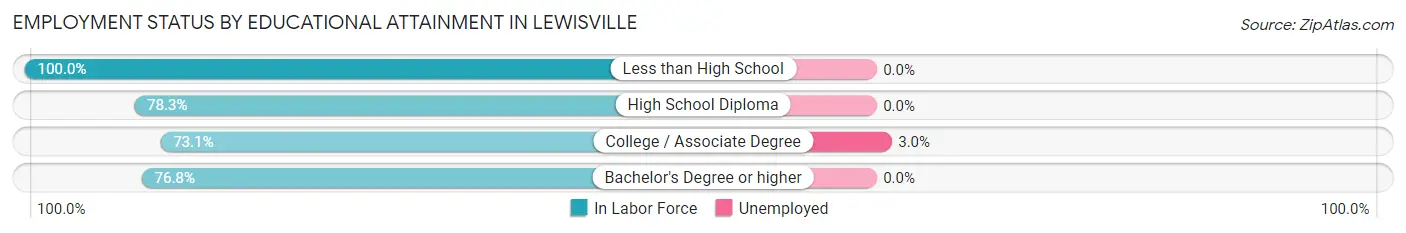
| Educational Attainment | In Labor Force | Unemployed |
| Less than High School | 73 (100.0%) | 0 (0.0%) |
| High School Diploma | 335 (78.3%) | 0 (0.0%) |
| College / Associate Degree | 237 (73.1%) | 10 (3.0%) |
| Bachelor's Degree or higher | 235 (76.8%) | 0 (0.0%) |
| Total | 880 (77.8%) | 9 (0.8%) |
Employment Occupations by Sex in Lewisville
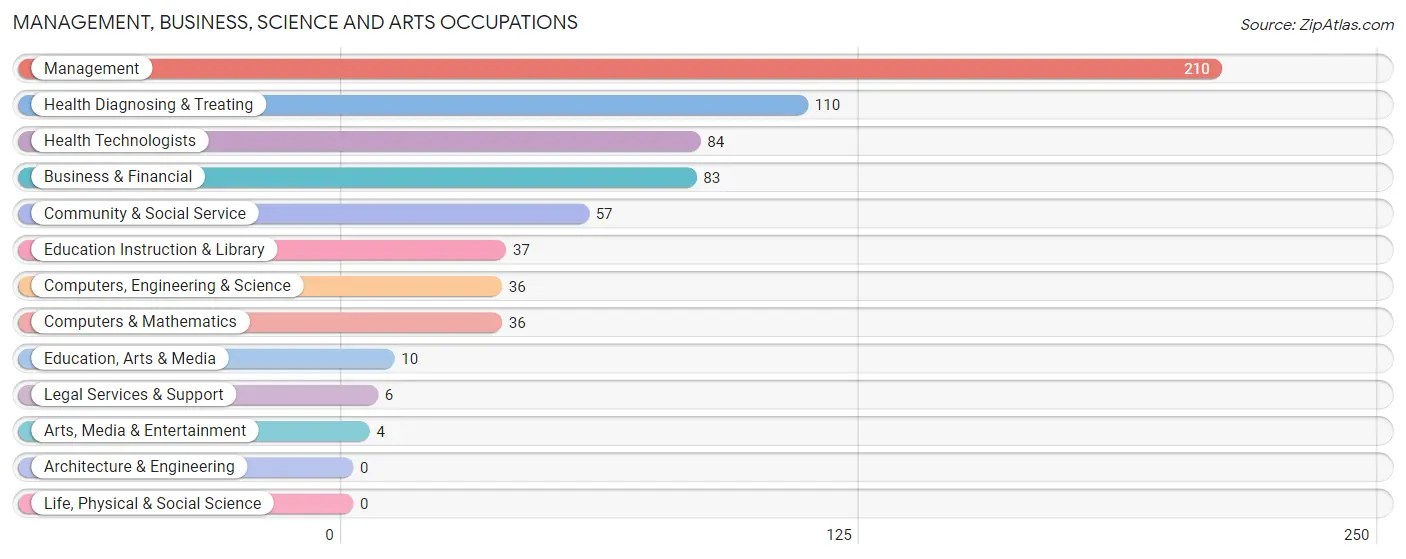
Management, Business, Science and Arts Occupations
The most common Management, Business, Science and Arts occupations in Lewisville are Management (210 | 19.8%), Health Diagnosing & Treating (110 | 10.4%), Health Technologists (84 | 7.9%), Business & Financial (83 | 7.8%), and Community & Social Service (57 | 5.4%).
Management, Business, Science and Arts Occupations by Sex
Within the Management, Business, Science and Arts occupations in Lewisville, the most male-oriented occupations are Computers, Engineering & Science (100.0%), Computers & Mathematics (100.0%), and Education, Arts & Media (100.0%), while the most female-oriented occupations are Legal Services & Support (100.0%), Arts, Media & Entertainment (100.0%), and Health Diagnosing & Treating (63.6%).
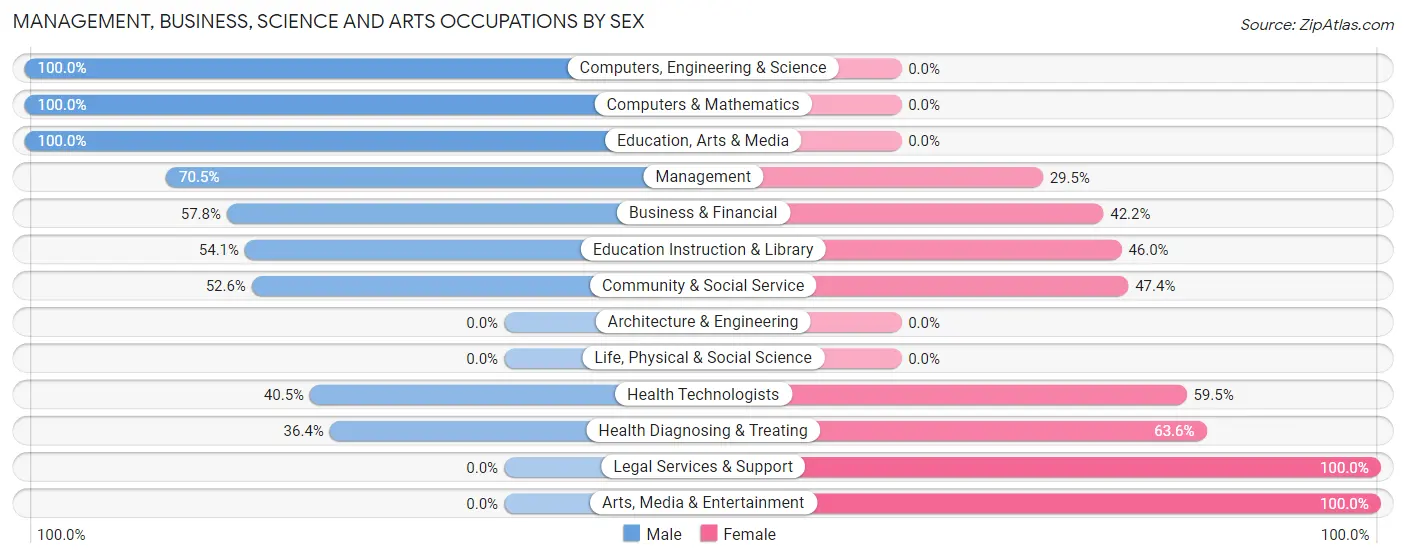
| Occupation | Male | Female |
| Management | 148 (70.5%) | 62 (29.5%) |
| Business & Financial | 48 (57.8%) | 35 (42.2%) |
| Computers, Engineering & Science | 36 (100.0%) | 0 (0.0%) |
| Computers & Mathematics | 36 (100.0%) | 0 (0.0%) |
| Architecture & Engineering | 0 (0.0%) | 0 (0.0%) |
| Life, Physical & Social Science | 0 (0.0%) | 0 (0.0%) |
| Community & Social Service | 30 (52.6%) | 27 (47.4%) |
| Education, Arts & Media | 10 (100.0%) | 0 (0.0%) |
| Legal Services & Support | 0 (0.0%) | 6 (100.0%) |
| Education Instruction & Library | 20 (54.0%) | 17 (46.0%) |
| Arts, Media & Entertainment | 0 (0.0%) | 4 (100.0%) |
| Health Diagnosing & Treating | 40 (36.4%) | 70 (63.6%) |
| Health Technologists | 34 (40.5%) | 50 (59.5%) |
| Total (Category) | 302 (60.9%) | 194 (39.1%) |
| Total (Overall) | 648 (61.1%) | 413 (38.9%) |
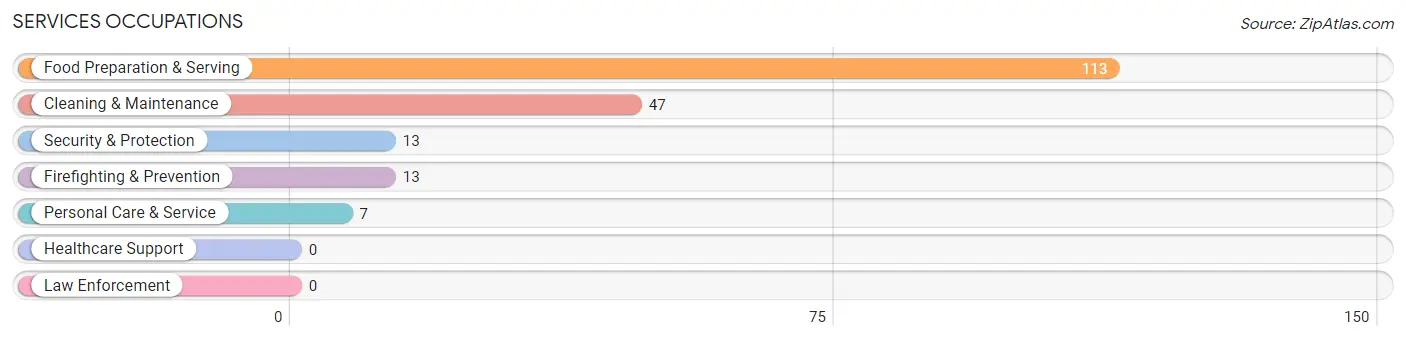
Services Occupations
The most common Services occupations in Lewisville are Food Preparation & Serving (113 | 10.6%), Cleaning & Maintenance (47 | 4.4%), Security & Protection (13 | 1.2%), Firefighting & Prevention (13 | 1.2%), and Personal Care & Service (7 | 0.7%).
Services Occupations by Sex
Within the Services occupations in Lewisville, the most male-oriented occupations are Security & Protection (100.0%), Firefighting & Prevention (100.0%), and Cleaning & Maintenance (100.0%), while the most female-oriented occupations are Personal Care & Service (100.0%), and Food Preparation & Serving (66.4%).
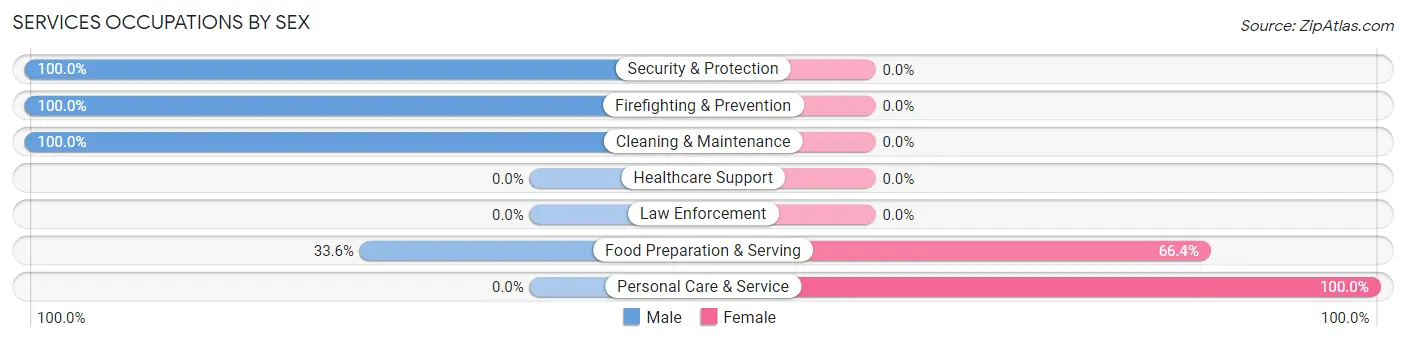
| Occupation | Male | Female |
| Healthcare Support | 0 (0.0%) | 0 (0.0%) |
| Security & Protection | 13 (100.0%) | 0 (0.0%) |
| Firefighting & Prevention | 13 (100.0%) | 0 (0.0%) |
| Law Enforcement | 0 (0.0%) | 0 (0.0%) |
| Food Preparation & Serving | 38 (33.6%) | 75 (66.4%) |
| Cleaning & Maintenance | 47 (100.0%) | 0 (0.0%) |
| Personal Care & Service | 0 (0.0%) | 7 (100.0%) |
| Total (Category) | 98 (54.4%) | 82 (45.6%) |
| Total (Overall) | 648 (61.1%) | 413 (38.9%) |
Sales and Office Occupations
The most common Sales and Office occupations in Lewisville are Office & Administration (109 | 10.3%), and Sales & Related (28 | 2.6%).

Sales and Office Occupations by Sex
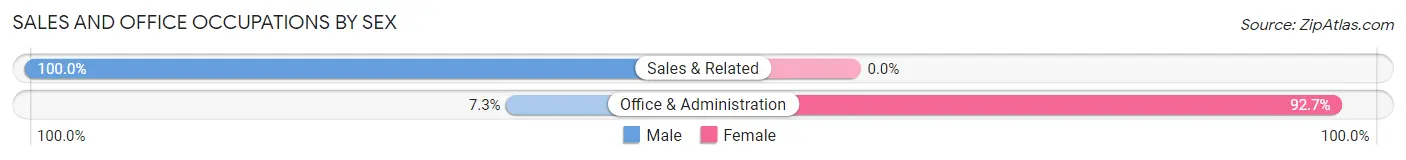
| Occupation | Male | Female |
| Sales & Related | 28 (100.0%) | 0 (0.0%) |
| Office & Administration | 8 (7.3%) | 101 (92.7%) |
| Total (Category) | 36 (26.3%) | 101 (73.7%) |
| Total (Overall) | 648 (61.1%) | 413 (38.9%) |
Natural Resources, Construction and Maintenance Occupations
The most common Natural Resources, Construction and Maintenance occupations in Lewisville are Construction & Extraction (52 | 4.9%), and Installation, Maintenance & Repair (32 | 3.0%).

Natural Resources, Construction and Maintenance Occupations by Sex
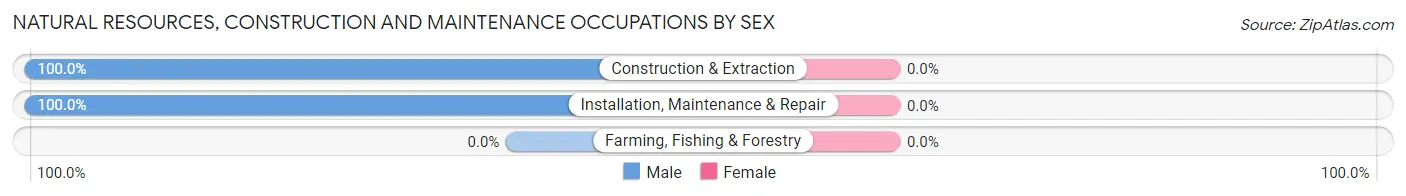
| Occupation | Male | Female |
| Farming, Fishing & Forestry | 0 (0.0%) | 0 (0.0%) |
| Construction & Extraction | 52 (100.0%) | 0 (0.0%) |
| Installation, Maintenance & Repair | 32 (100.0%) | 0 (0.0%) |
| Total (Category) | 84 (100.0%) | 0 (0.0%) |
| Total (Overall) | 648 (61.1%) | 413 (38.9%) |
Production, Transportation and Moving Occupations
The most common Production, Transportation and Moving occupations in Lewisville are Transportation (123 | 11.6%), and Production (41 | 3.9%).
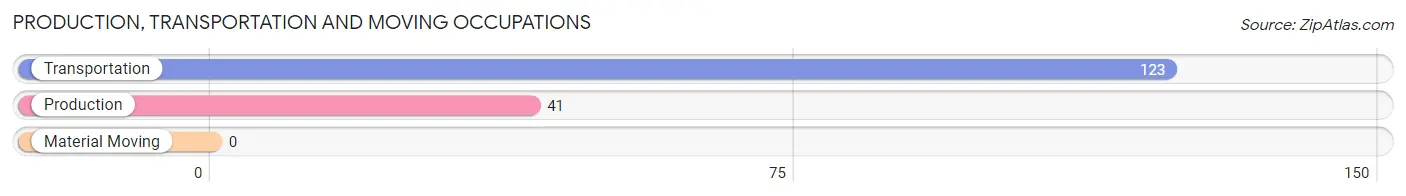
Production, Transportation and Moving Occupations by Sex
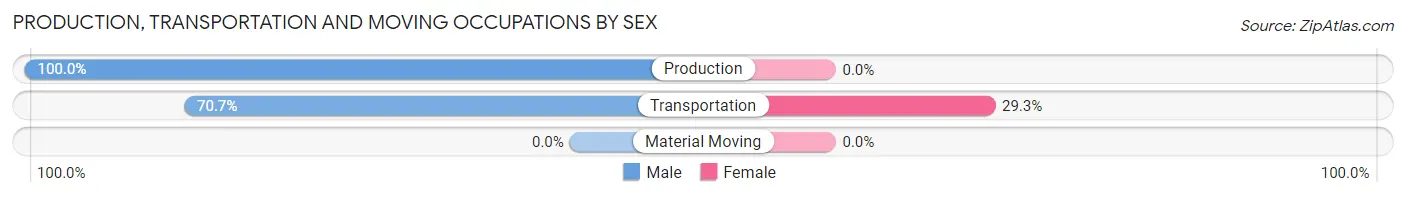
| Occupation | Male | Female |
| Production | 41 (100.0%) | 0 (0.0%) |
| Transportation | 87 (70.7%) | 36 (29.3%) |
| Material Moving | 0 (0.0%) | 0 (0.0%) |
| Total (Category) | 128 (78.0%) | 36 (22.0%) |
| Total (Overall) | 648 (61.1%) | 413 (38.9%) |
Employment Industries by Sex in Lewisville
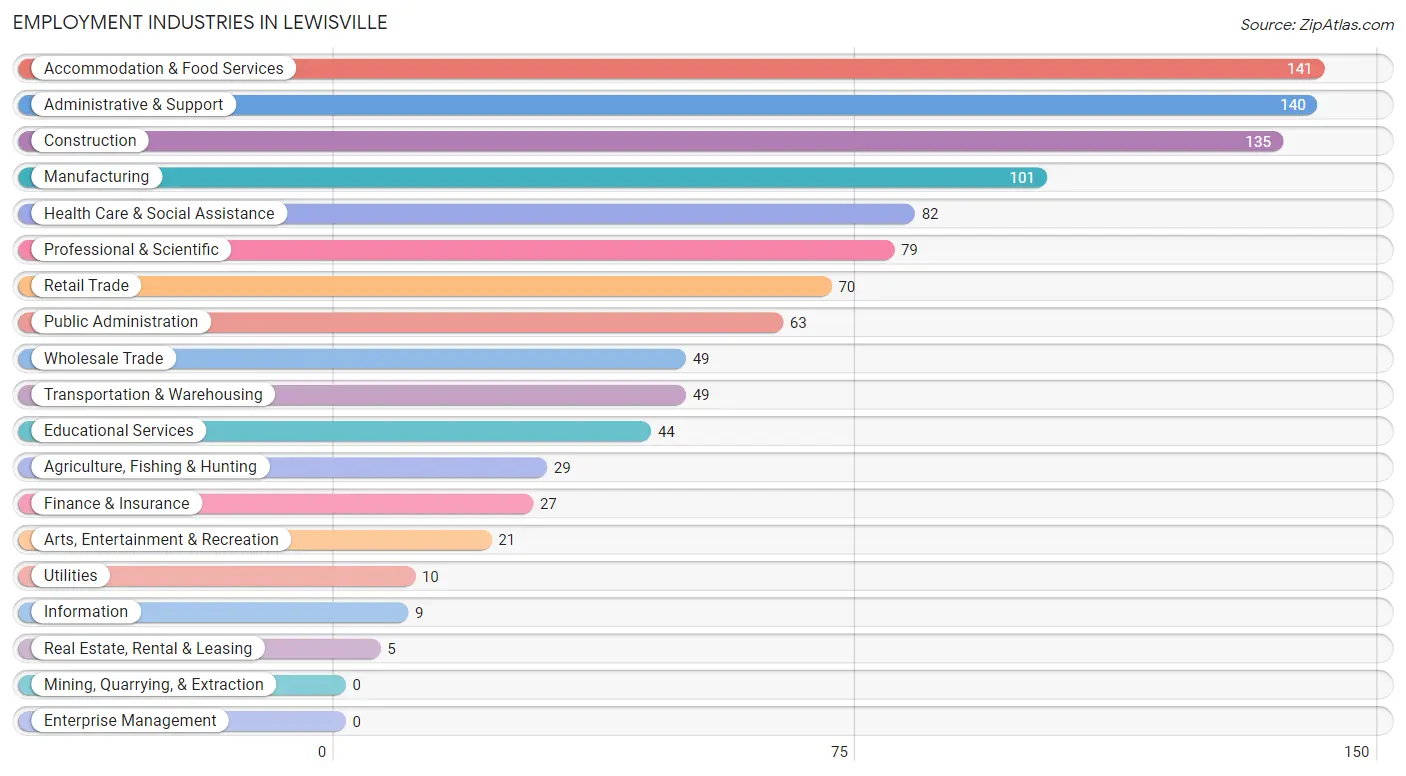
Employment Industries in Lewisville
The major employment industries in Lewisville include Accommodation & Food Services (141 | 13.3%), Administrative & Support (140 | 13.2%), Construction (135 | 12.7%), Manufacturing (101 | 9.5%), and Health Care & Social Assistance (82 | 7.7%).
Employment Industries by Sex in Lewisville
The Lewisville industries that see more men than women are Agriculture, Fishing & Hunting (100.0%), Wholesale Trade (100.0%), and Information (100.0%), whereas the industries that tend to have a higher number of women are Utilities (100.0%), Real Estate, Rental & Leasing (100.0%), and Transportation & Warehousing (73.5%).
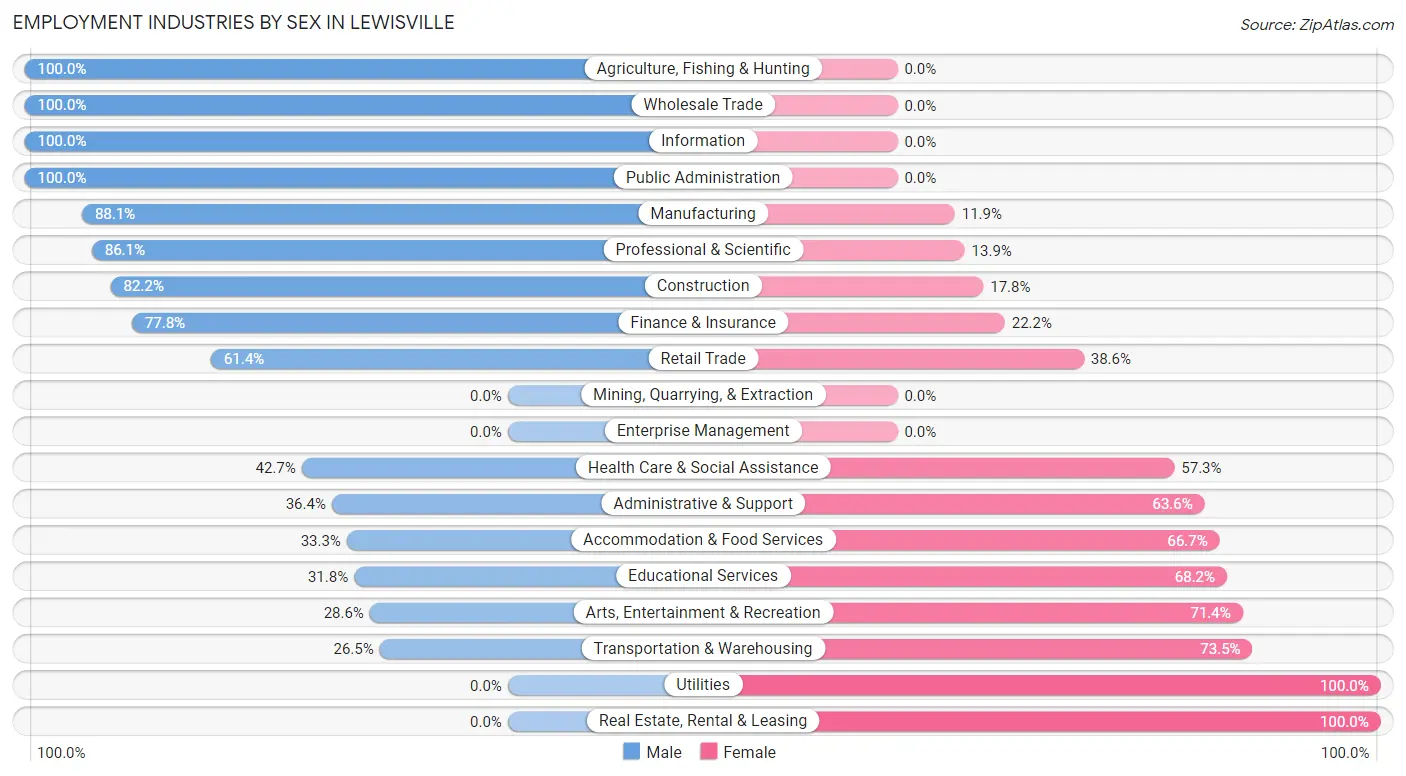
| Industry | Male | Female |
| Agriculture, Fishing & Hunting | 29 (100.0%) | 0 (0.0%) |
| Mining, Quarrying, & Extraction | 0 (0.0%) | 0 (0.0%) |
| Construction | 111 (82.2%) | 24 (17.8%) |
| Manufacturing | 89 (88.1%) | 12 (11.9%) |
| Wholesale Trade | 49 (100.0%) | 0 (0.0%) |
| Retail Trade | 43 (61.4%) | 27 (38.6%) |
| Transportation & Warehousing | 13 (26.5%) | 36 (73.5%) |
| Utilities | 0 (0.0%) | 10 (100.0%) |
| Information | 9 (100.0%) | 0 (0.0%) |
| Finance & Insurance | 21 (77.8%) | 6 (22.2%) |
| Real Estate, Rental & Leasing | 0 (0.0%) | 5 (100.0%) |
| Professional & Scientific | 68 (86.1%) | 11 (13.9%) |
| Enterprise Management | 0 (0.0%) | 0 (0.0%) |
| Administrative & Support | 51 (36.4%) | 89 (63.6%) |
| Educational Services | 14 (31.8%) | 30 (68.2%) |
| Health Care & Social Assistance | 35 (42.7%) | 47 (57.3%) |
| Arts, Entertainment & Recreation | 6 (28.6%) | 15 (71.4%) |
| Accommodation & Food Services | 47 (33.3%) | 94 (66.7%) |
| Public Administration | 63 (100.0%) | 0 (0.0%) |
| Total | 648 (61.1%) | 413 (38.9%) |
Education in Lewisville
School Enrollment in Lewisville
The most common levels of schooling among the 469 students in Lewisville are middle school (218 | 46.5%), high school (95 | 20.3%), and elementary school (88 | 18.8%).
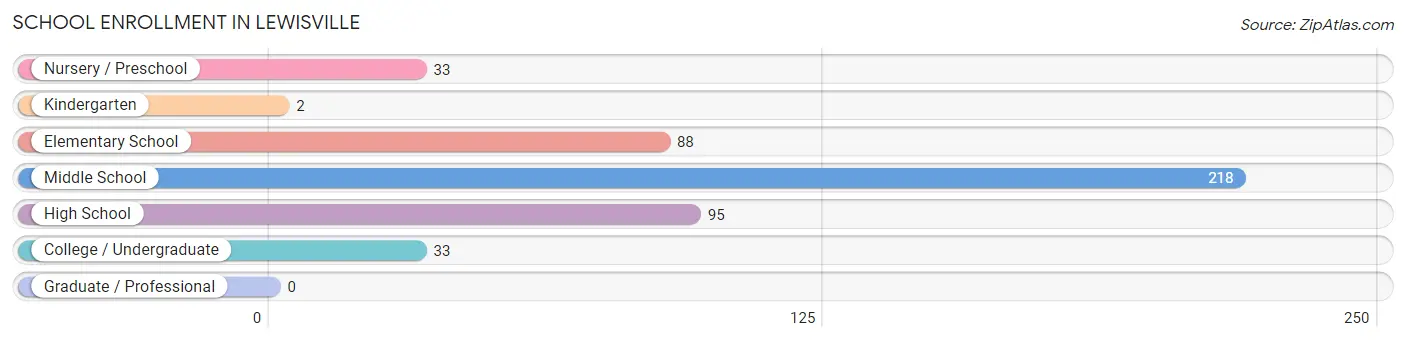
| School Level | # Students | % Students |
| Nursery / Preschool | 33 | 7.0% |
| Kindergarten | 2 | 0.4% |
| Elementary School | 88 | 18.8% |
| Middle School | 218 | 46.5% |
| High School | 95 | 20.3% |
| College / Undergraduate | 33 | 7.0% |
| Graduate / Professional | 0 | 0.0% |
| Total | 469 | 100.0% |
School Enrollment by Age by Funding Source in Lewisville
Out of a total of 469 students who are enrolled in schools in Lewisville, 21 (4.5%) attend a private institution, while the remaining 448 (95.5%) are enrolled in public schools. The age group of 25 to 34 year olds has the highest likelihood of being enrolled in private schools, with 8 (100.0% in the age bracket) enrolled. Conversely, the age group of 3 to 4 year olds has the lowest likelihood of being enrolled in a private school, with 15 (100.0% in the age bracket) attending a public institution.
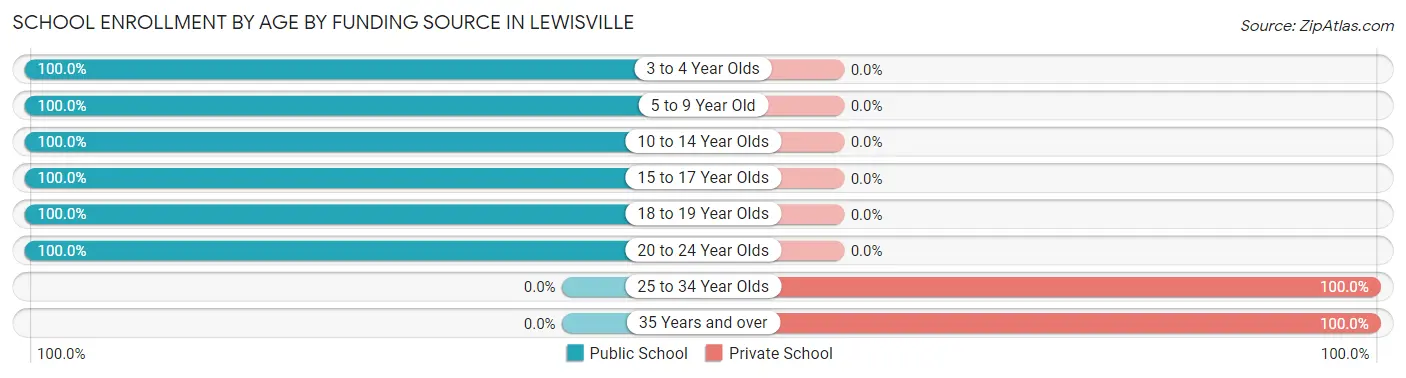
| Age Bracket | Public School | Private School |
| 3 to 4 Year Olds | 15 (100.0%) | 0 (0.0%) |
| 5 to 9 Year Old | 99 (100.0%) | 0 (0.0%) |
| 10 to 14 Year Olds | 227 (100.0%) | 0 (0.0%) |
| 15 to 17 Year Olds | 74 (100.0%) | 0 (0.0%) |
| 18 to 19 Year Olds | 21 (100.0%) | 0 (0.0%) |
| 20 to 24 Year Olds | 12 (100.0%) | 0 (0.0%) |
| 25 to 34 Year Olds | 0 (0.0%) | 8 (100.0%) |
| 35 Years and over | 0 (0.0%) | 13 (100.0%) |
| Total | 448 (95.5%) | 21 (4.5%) |
Educational Attainment by Field of Study in Lewisville
Education (199 | 29.1%), business (133 | 19.5%), science & technology (64 | 9.4%), computers & mathematics (48 | 7.0%), and literature & languages (48 | 7.0%) are the most common fields of study among 683 individuals in Lewisville who have obtained a bachelor's degree or higher.
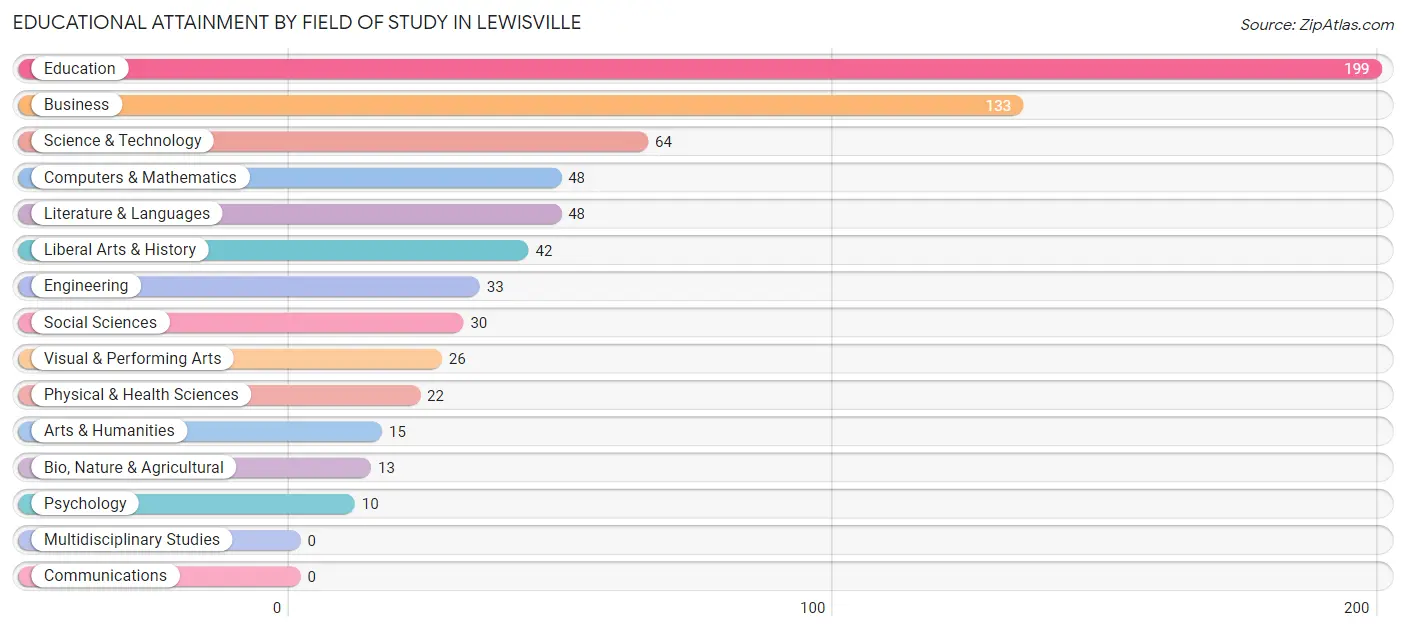
| Field of Study | # Graduates | % Graduates |
| Computers & Mathematics | 48 | 7.0% |
| Bio, Nature & Agricultural | 13 | 1.9% |
| Physical & Health Sciences | 22 | 3.2% |
| Psychology | 10 | 1.5% |
| Social Sciences | 30 | 4.4% |
| Engineering | 33 | 4.8% |
| Multidisciplinary Studies | 0 | 0.0% |
| Science & Technology | 64 | 9.4% |
| Business | 133 | 19.5% |
| Education | 199 | 29.1% |
| Literature & Languages | 48 | 7.0% |
| Liberal Arts & History | 42 | 6.1% |
| Visual & Performing Arts | 26 | 3.8% |
| Communications | 0 | 0.0% |
| Arts & Humanities | 15 | 2.2% |
| Total | 683 | 100.0% |
Transportation & Commute in Lewisville
Vehicle Availability by Sex in Lewisville
The most prevalent vehicle ownership categories in Lewisville are males with 3 vehicles (289, accounting for 45.6%) and females with 3 vehicles (182, making up 70.0%).
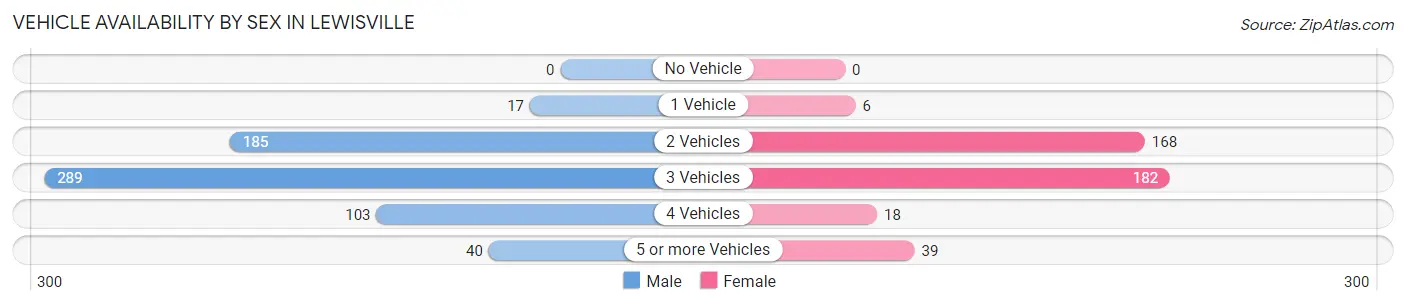
| Vehicles Available | Male | Female |
| No Vehicle | 0 (0.0%) | 0 (0.0%) |
| 1 Vehicle | 17 (2.7%) | 6 (1.5%) |
| 2 Vehicles | 185 (29.2%) | 168 (40.7%) |
| 3 Vehicles | 289 (45.6%) | 182 (44.1%) |
| 4 Vehicles | 103 (16.3%) | 18 (4.4%) |
| 5 or more Vehicles | 40 (6.3%) | 39 (9.4%) |
| Total | 634 (100.0%) | 413 (100.0%) |
Commute Time in Lewisville
The most frequently occuring commute durations in Lewisville are 30 to 34 minutes (228 commuters, 25.7%), 20 to 24 minutes (166 commuters, 18.7%), and 25 to 29 minutes (101 commuters, 11.4%).
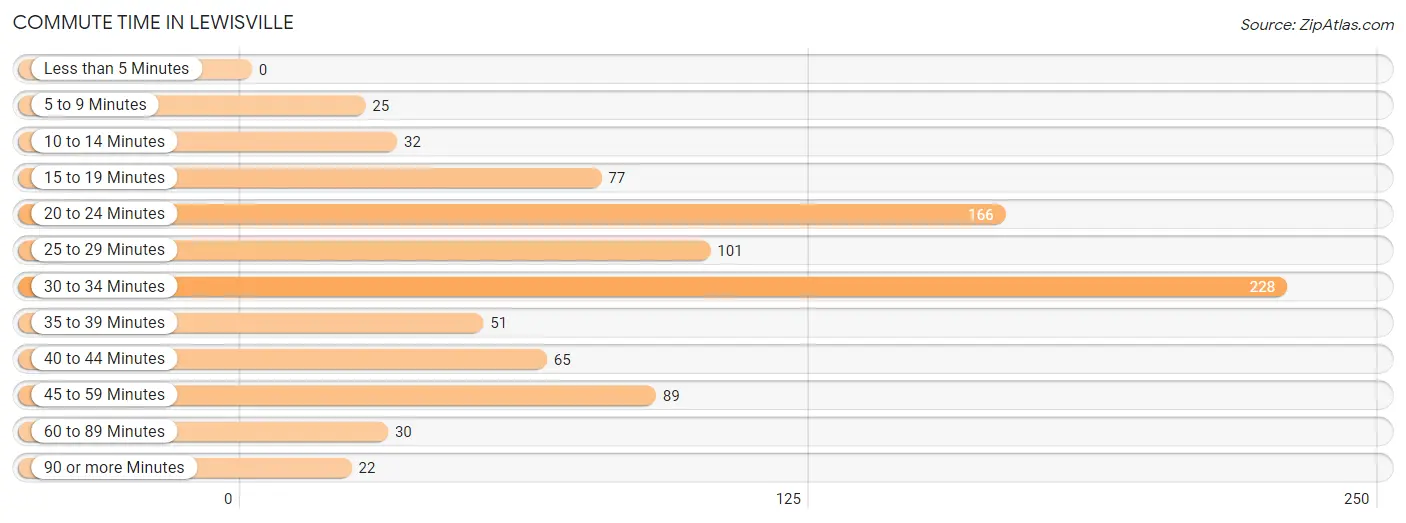
| Commute Time | # Commuters | % Commuters |
| Less than 5 Minutes | 0 | 0.0% |
| 5 to 9 Minutes | 25 | 2.8% |
| 10 to 14 Minutes | 32 | 3.6% |
| 15 to 19 Minutes | 77 | 8.7% |
| 20 to 24 Minutes | 166 | 18.7% |
| 25 to 29 Minutes | 101 | 11.4% |
| 30 to 34 Minutes | 228 | 25.7% |
| 35 to 39 Minutes | 51 | 5.8% |
| 40 to 44 Minutes | 65 | 7.3% |
| 45 to 59 Minutes | 89 | 10.1% |
| 60 to 89 Minutes | 30 | 3.4% |
| 90 or more Minutes | 22 | 2.5% |
Commute Time by Sex in Lewisville
The most common commute times in Lewisville are 30 to 34 minutes (137 commuters, 24.7%) for males and 30 to 34 minutes (91 commuters, 27.5%) for females.
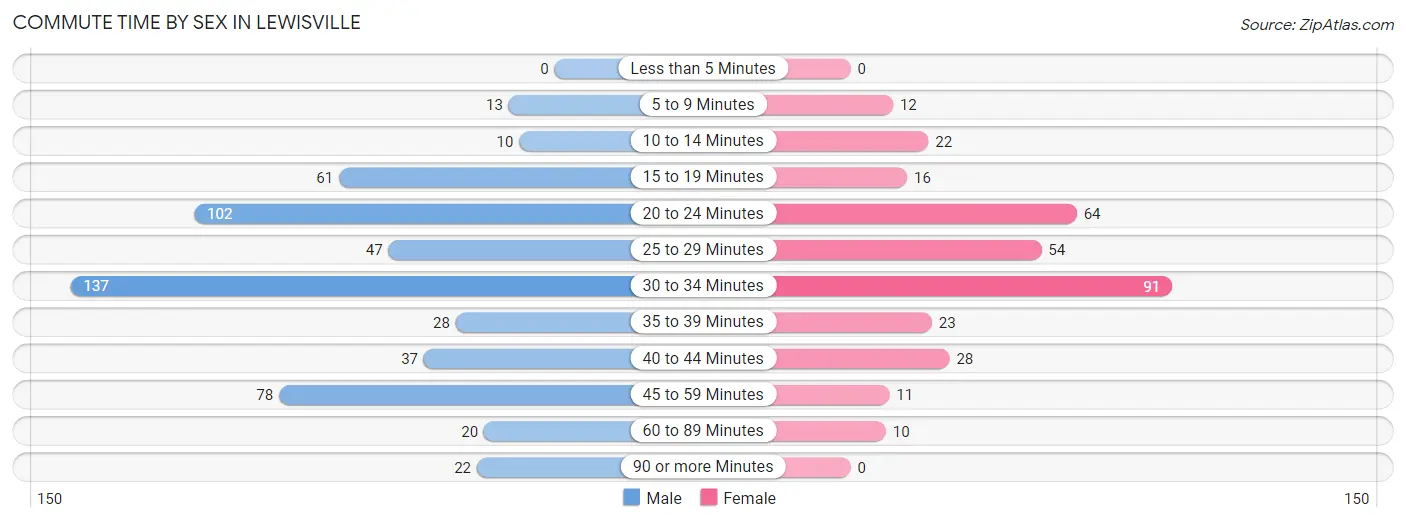
| Commute Time | Male | Female |
| Less than 5 Minutes | 0 (0.0%) | 0 (0.0%) |
| 5 to 9 Minutes | 13 (2.3%) | 12 (3.6%) |
| 10 to 14 Minutes | 10 (1.8%) | 22 (6.7%) |
| 15 to 19 Minutes | 61 (11.0%) | 16 (4.8%) |
| 20 to 24 Minutes | 102 (18.4%) | 64 (19.3%) |
| 25 to 29 Minutes | 47 (8.5%) | 54 (16.3%) |
| 30 to 34 Minutes | 137 (24.7%) | 91 (27.5%) |
| 35 to 39 Minutes | 28 (5.1%) | 23 (7.0%) |
| 40 to 44 Minutes | 37 (6.7%) | 28 (8.5%) |
| 45 to 59 Minutes | 78 (14.1%) | 11 (3.3%) |
| 60 to 89 Minutes | 20 (3.6%) | 10 (3.0%) |
| 90 or more Minutes | 22 (4.0%) | 0 (0.0%) |
Time of Departure to Work by Sex in Lewisville
The most frequent times of departure to work in Lewisville are 6:00 AM to 6:29 AM (152, 27.4%) for males and 7:00 AM to 7:29 AM (89, 26.9%) for females.
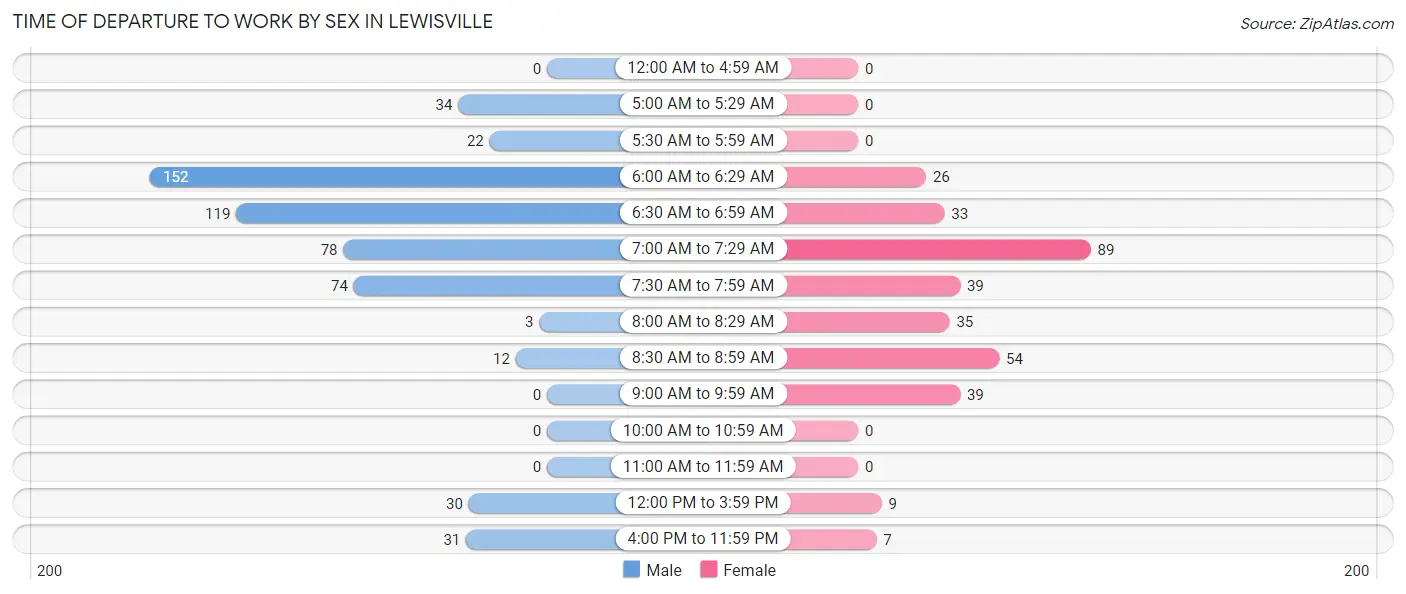
| Time of Departure | Male | Female |
| 12:00 AM to 4:59 AM | 0 (0.0%) | 0 (0.0%) |
| 5:00 AM to 5:29 AM | 34 (6.1%) | 0 (0.0%) |
| 5:30 AM to 5:59 AM | 22 (4.0%) | 0 (0.0%) |
| 6:00 AM to 6:29 AM | 152 (27.4%) | 26 (7.9%) |
| 6:30 AM to 6:59 AM | 119 (21.4%) | 33 (10.0%) |
| 7:00 AM to 7:29 AM | 78 (14.1%) | 89 (26.9%) |
| 7:30 AM to 7:59 AM | 74 (13.3%) | 39 (11.8%) |
| 8:00 AM to 8:29 AM | 3 (0.5%) | 35 (10.6%) |
| 8:30 AM to 8:59 AM | 12 (2.2%) | 54 (16.3%) |
| 9:00 AM to 9:59 AM | 0 (0.0%) | 39 (11.8%) |
| 10:00 AM to 10:59 AM | 0 (0.0%) | 0 (0.0%) |
| 11:00 AM to 11:59 AM | 0 (0.0%) | 0 (0.0%) |
| 12:00 PM to 3:59 PM | 30 (5.4%) | 9 (2.7%) |
| 4:00 PM to 11:59 PM | 31 (5.6%) | 7 (2.1%) |
| Total | 555 (100.0%) | 331 (100.0%) |
Housing Occupancy in Lewisville
Occupancy by Ownership in Lewisville
Of the total 827 dwellings in Lewisville, owner-occupied units account for 814 (98.4%), while renter-occupied units make up 13 (1.6%).
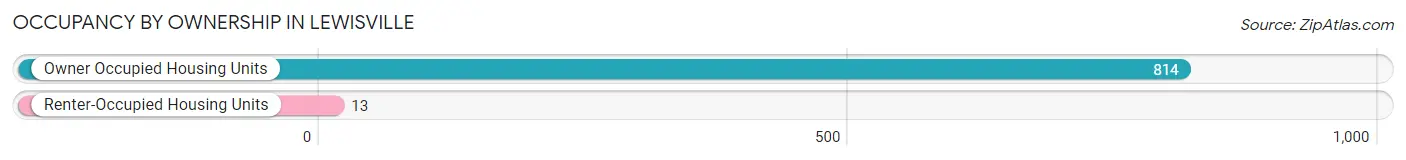
| Occupancy | # Housing Units | % Housing Units |
| Owner Occupied Housing Units | 814 | 98.4% |
| Renter-Occupied Housing Units | 13 | 1.6% |
| Total Occupied Housing Units | 827 | 100.0% |
Occupancy by Household Size in Lewisville
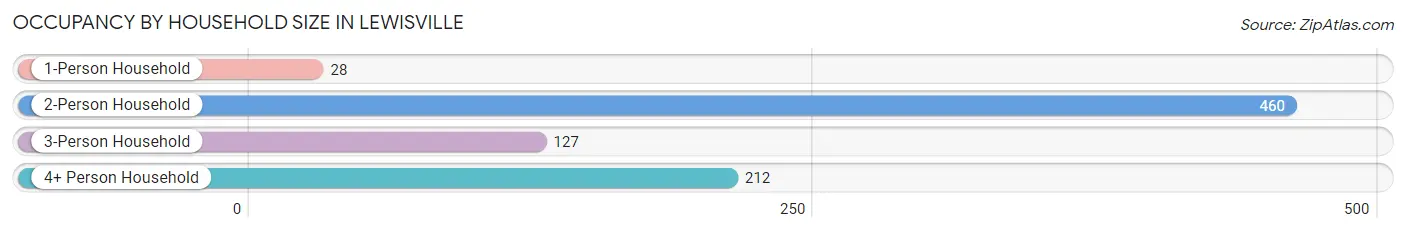
| Household Size | # Housing Units | % Housing Units |
| 1-Person Household | 28 | 3.4% |
| 2-Person Household | 460 | 55.6% |
| 3-Person Household | 127 | 15.4% |
| 4+ Person Household | 212 | 25.6% |
| Total Housing Units | 827 | 100.0% |
Occupancy by Ownership by Household Size in Lewisville
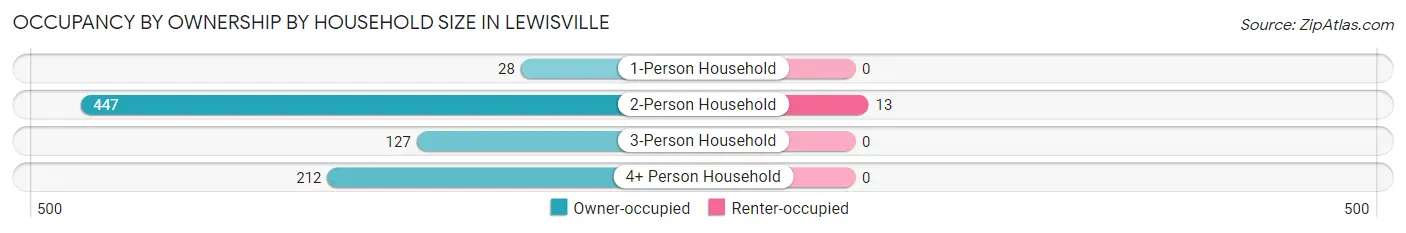
| Household Size | Owner-occupied | Renter-occupied |
| 1-Person Household | 28 (100.0%) | 0 (0.0%) |
| 2-Person Household | 447 (97.2%) | 13 (2.8%) |
| 3-Person Household | 127 (100.0%) | 0 (0.0%) |
| 4+ Person Household | 212 (100.0%) | 0 (0.0%) |
| Total Housing Units | 814 (98.4%) | 13 (1.6%) |
Occupancy by Educational Attainment in Lewisville
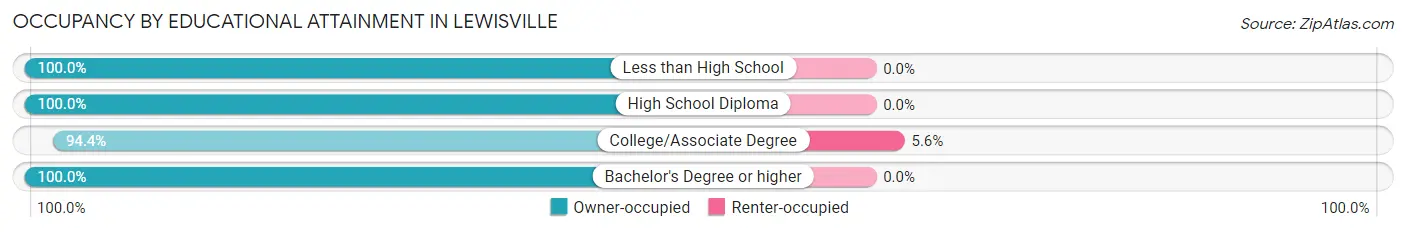
| Household Size | Owner-occupied | Renter-occupied |
| Less than High School | 38 (100.0%) | 0 (0.0%) |
| High School Diploma | 238 (100.0%) | 0 (0.0%) |
| College/Associate Degree | 218 (94.4%) | 13 (5.6%) |
| Bachelor's Degree or higher | 320 (100.0%) | 0 (0.0%) |
Occupancy by Age of Householder in Lewisville
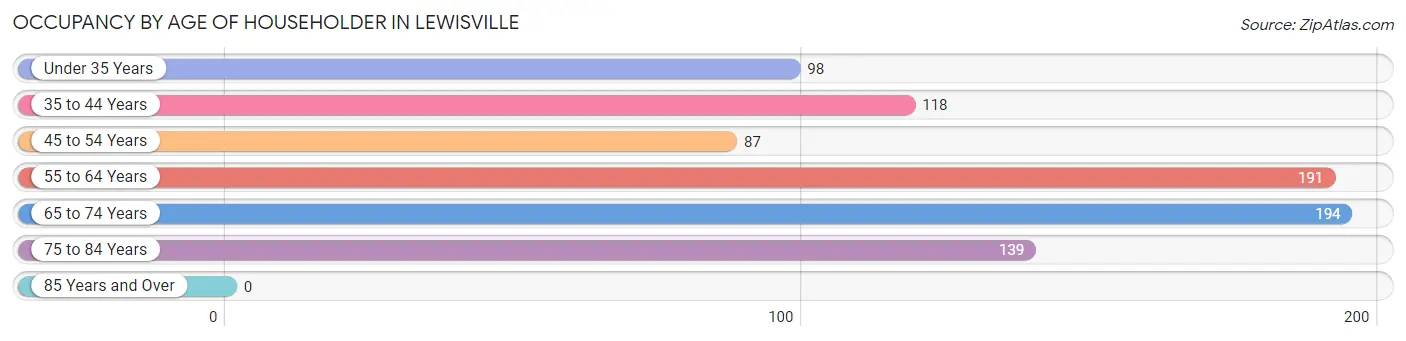
| Age Bracket | # Households | % Households |
| Under 35 Years | 98 | 11.8% |
| 35 to 44 Years | 118 | 14.3% |
| 45 to 54 Years | 87 | 10.5% |
| 55 to 64 Years | 191 | 23.1% |
| 65 to 74 Years | 194 | 23.5% |
| 75 to 84 Years | 139 | 16.8% |
| 85 Years and Over | 0 | 0.0% |
| Total | 827 | 100.0% |
Housing Finances in Lewisville
Median Income by Occupancy in Lewisville
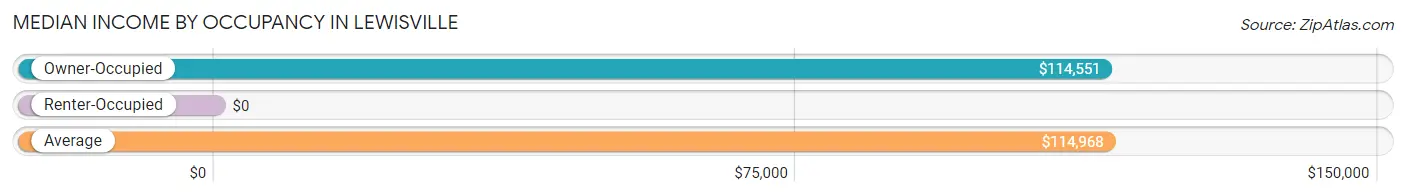
| Occupancy Type | # Households | Median Income |
| Owner-Occupied | 814 (98.4%) | $114,551 |
| Renter-Occupied | 13 (1.6%) | $0 |
| Average | 827 (100.0%) | $114,968 |
Occupancy by Householder Income Bracket in Lewisville
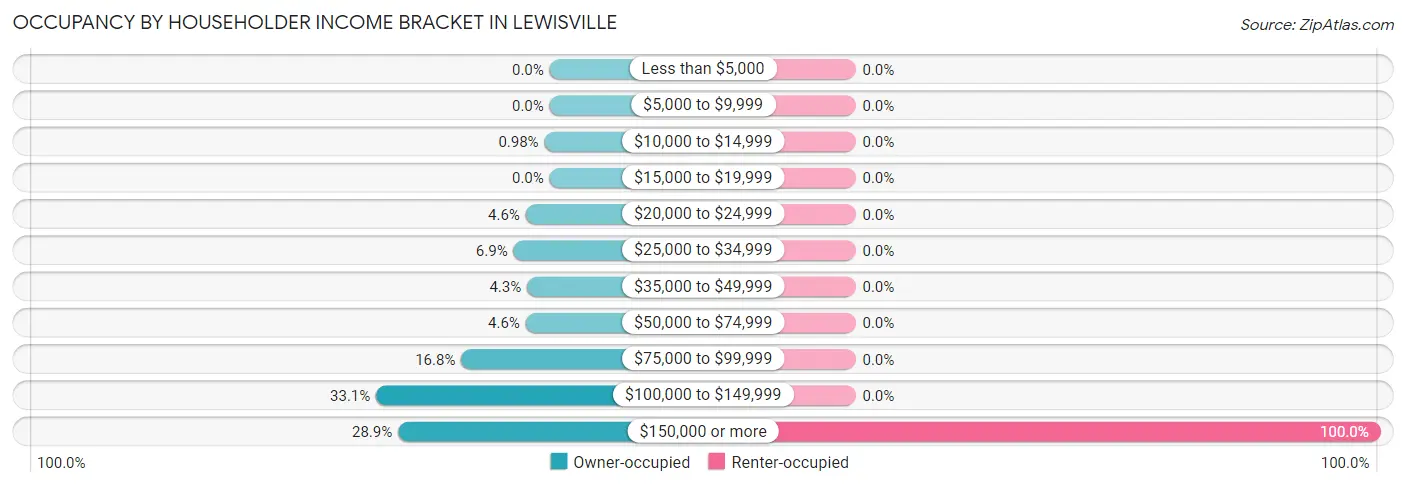
| Income Bracket | Owner-occupied | Renter-occupied |
| Less than $5,000 | 0 (0.0%) | 0 (0.0%) |
| $5,000 to $9,999 | 0 (0.0%) | 0 (0.0%) |
| $10,000 to $14,999 | 8 (1.0%) | 0 (0.0%) |
| $15,000 to $19,999 | 0 (0.0%) | 0 (0.0%) |
| $20,000 to $24,999 | 37 (4.5%) | 0 (0.0%) |
| $25,000 to $34,999 | 56 (6.9%) | 0 (0.0%) |
| $35,000 to $49,999 | 35 (4.3%) | 0 (0.0%) |
| $50,000 to $74,999 | 37 (4.5%) | 0 (0.0%) |
| $75,000 to $99,999 | 137 (16.8%) | 0 (0.0%) |
| $100,000 to $149,999 | 269 (33.1%) | 0 (0.0%) |
| $150,000 or more | 235 (28.9%) | 13 (100.0%) |
| Total | 814 (100.0%) | 13 (100.0%) |
Monthly Housing Cost Tiers in Lewisville
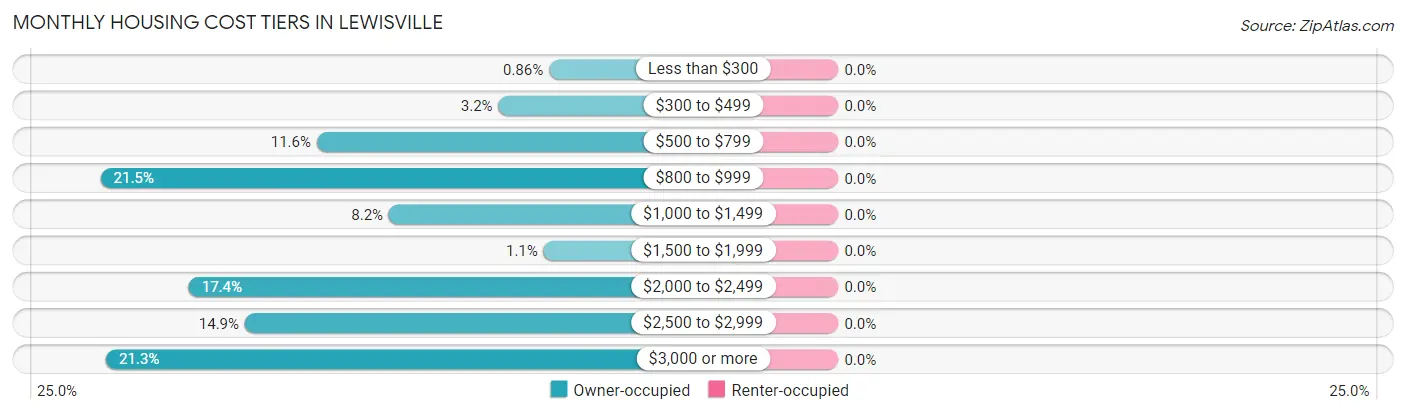
| Monthly Cost | Owner-occupied | Renter-occupied |
| Less than $300 | 7 (0.9%) | 0 (0.0%) |
| $300 to $499 | 26 (3.2%) | 0 (0.0%) |
| $500 to $799 | 94 (11.6%) | 0 (0.0%) |
| $800 to $999 | 175 (21.5%) | 0 (0.0%) |
| $1,000 to $1,499 | 67 (8.2%) | 0 (0.0%) |
| $1,500 to $1,999 | 9 (1.1%) | 0 (0.0%) |
| $2,000 to $2,499 | 142 (17.4%) | 0 (0.0%) |
| $2,500 to $2,999 | 121 (14.9%) | 0 (0.0%) |
| $3,000 or more | 173 (21.2%) | 0 (0.0%) |
| Total | 814 (100.0%) | 13 (100.0%) |
Physical Housing Characteristics in Lewisville
Housing Structures in Lewisville
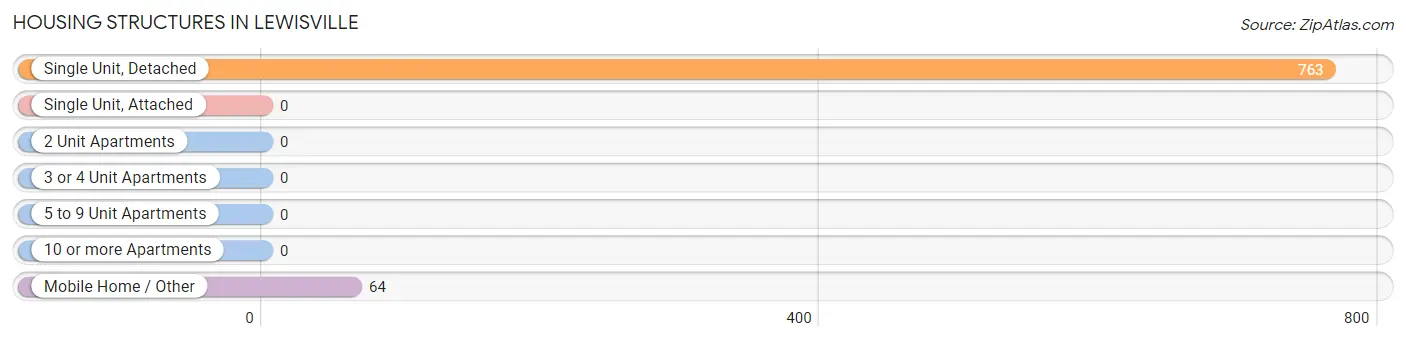
| Structure Type | # Housing Units | % Housing Units |
| Single Unit, Detached | 763 | 92.3% |
| Single Unit, Attached | 0 | 0.0% |
| 2 Unit Apartments | 0 | 0.0% |
| 3 or 4 Unit Apartments | 0 | 0.0% |
| 5 to 9 Unit Apartments | 0 | 0.0% |
| 10 or more Apartments | 0 | 0.0% |
| Mobile Home / Other | 64 | 7.7% |
| Total | 827 | 100.0% |
Housing Structures by Occupancy in Lewisville
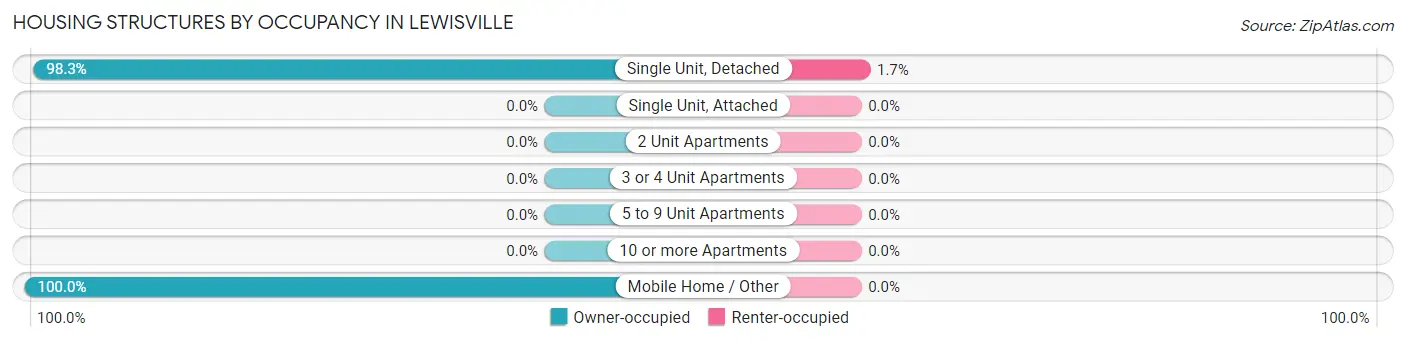
| Structure Type | Owner-occupied | Renter-occupied |
| Single Unit, Detached | 750 (98.3%) | 13 (1.7%) |
| Single Unit, Attached | 0 (0.0%) | 0 (0.0%) |
| 2 Unit Apartments | 0 (0.0%) | 0 (0.0%) |
| 3 or 4 Unit Apartments | 0 (0.0%) | 0 (0.0%) |
| 5 to 9 Unit Apartments | 0 (0.0%) | 0 (0.0%) |
| 10 or more Apartments | 0 (0.0%) | 0 (0.0%) |
| Mobile Home / Other | 64 (100.0%) | 0 (0.0%) |
| Total | 814 (98.4%) | 13 (1.6%) |
Housing Structures by Number of Rooms in Lewisville
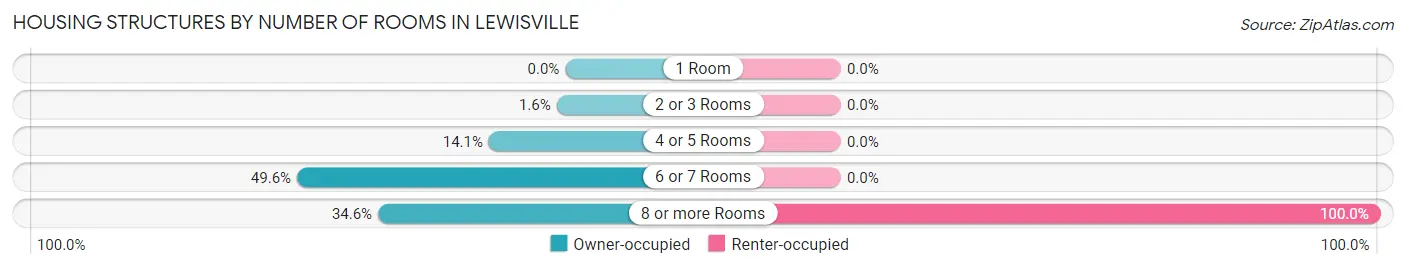
| Number of Rooms | Owner-occupied | Renter-occupied |
| 1 Room | 0 (0.0%) | 0 (0.0%) |
| 2 or 3 Rooms | 13 (1.6%) | 0 (0.0%) |
| 4 or 5 Rooms | 115 (14.1%) | 0 (0.0%) |
| 6 or 7 Rooms | 404 (49.6%) | 0 (0.0%) |
| 8 or more Rooms | 282 (34.6%) | 13 (100.0%) |
| Total | 814 (100.0%) | 13 (100.0%) |
Housing Structure by Heating Type in Lewisville
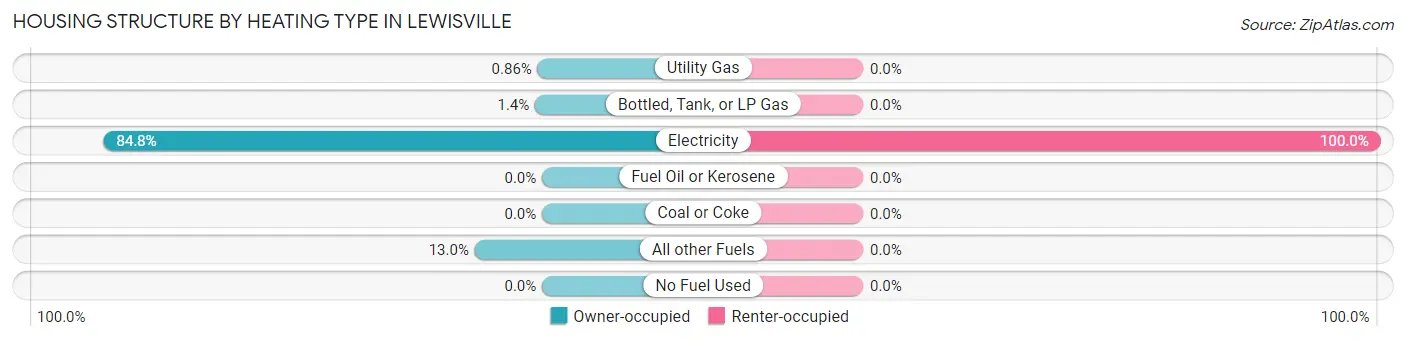
| Heating Type | Owner-occupied | Renter-occupied |
| Utility Gas | 7 (0.9%) | 0 (0.0%) |
| Bottled, Tank, or LP Gas | 11 (1.3%) | 0 (0.0%) |
| Electricity | 690 (84.8%) | 13 (100.0%) |
| Fuel Oil or Kerosene | 0 (0.0%) | 0 (0.0%) |
| Coal or Coke | 0 (0.0%) | 0 (0.0%) |
| All other Fuels | 106 (13.0%) | 0 (0.0%) |
| No Fuel Used | 0 (0.0%) | 0 (0.0%) |
| Total | 814 (100.0%) | 13 (100.0%) |
Household Vehicle Usage in Lewisville
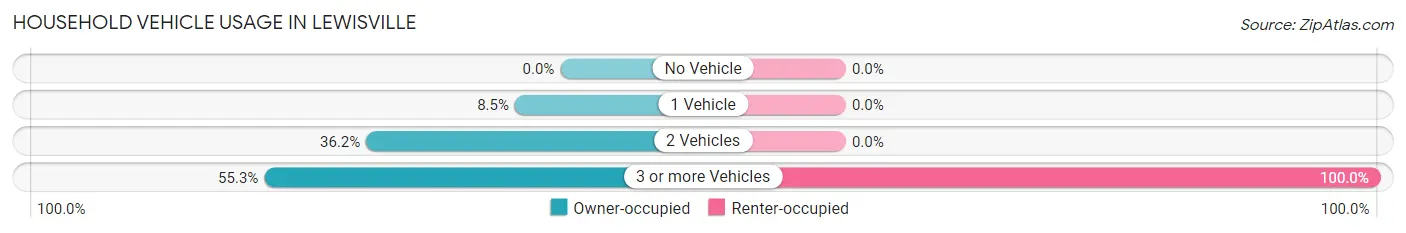
| Vehicles per Household | Owner-occupied | Renter-occupied |
| No Vehicle | 0 (0.0%) | 0 (0.0%) |
| 1 Vehicle | 69 (8.5%) | 0 (0.0%) |
| 2 Vehicles | 295 (36.2%) | 0 (0.0%) |
| 3 or more Vehicles | 450 (55.3%) | 13 (100.0%) |
| Total | 814 (100.0%) | 13 (100.0%) |
Real Estate & Mortgages in Lewisville
Real Estate and Mortgage Overview in Lewisville
| Characteristic | Without Mortgage | With Mortgage |
| Housing Units | 207 | 607 |
| Median Property Value | $626,700 | $593,200 |
| Median Household Income | $84,327 | $179 |
| Monthly Housing Costs | $727 | $173 |
| Real Estate Taxes | $4,918 | $0 |
Property Value by Mortgage Status in Lewisville
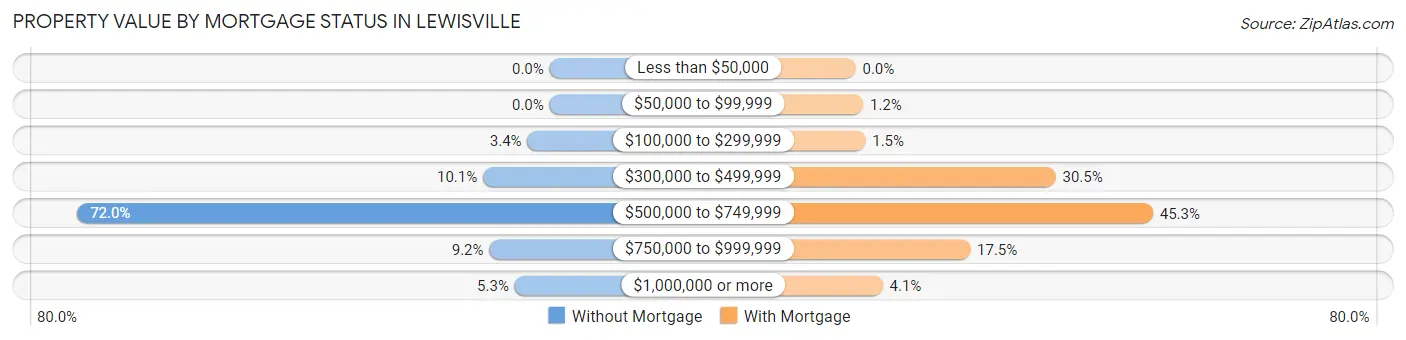
| Property Value | Without Mortgage | With Mortgage |
| Less than $50,000 | 0 (0.0%) | 0 (0.0%) |
| $50,000 to $99,999 | 0 (0.0%) | 7 (1.1%) |
| $100,000 to $299,999 | 7 (3.4%) | 9 (1.5%) |
| $300,000 to $499,999 | 21 (10.1%) | 185 (30.5%) |
| $500,000 to $749,999 | 149 (72.0%) | 275 (45.3%) |
| $750,000 to $999,999 | 19 (9.2%) | 106 (17.5%) |
| $1,000,000 or more | 11 (5.3%) | 25 (4.1%) |
| Total | 207 (100.0%) | 607 (100.0%) |
Household Income by Mortgage Status in Lewisville
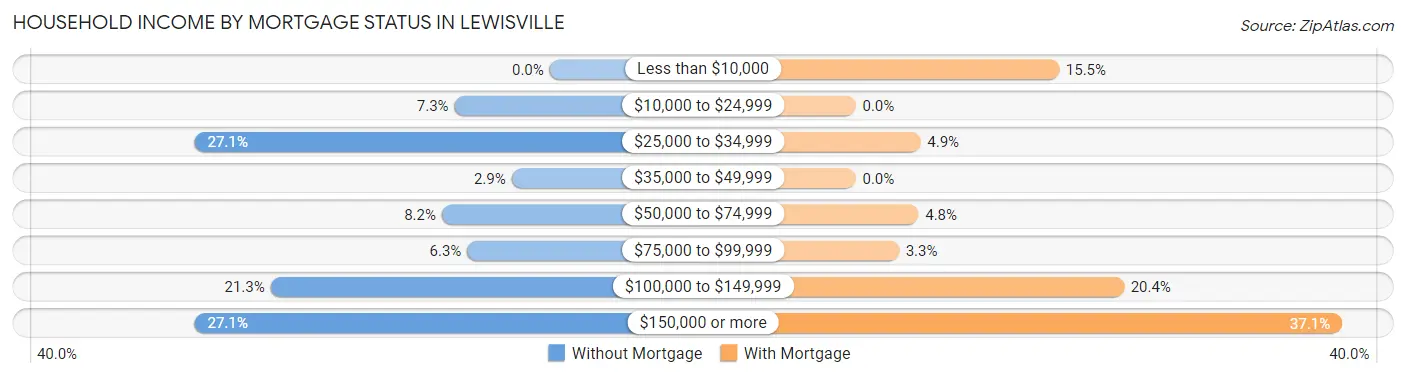
| Household Income | Without Mortgage | With Mortgage |
| Less than $10,000 | 0 (0.0%) | 94 (15.5%) |
| $10,000 to $24,999 | 15 (7.2%) | 0 (0.0%) |
| $25,000 to $34,999 | 56 (27.1%) | 30 (4.9%) |
| $35,000 to $49,999 | 6 (2.9%) | 0 (0.0%) |
| $50,000 to $74,999 | 17 (8.2%) | 29 (4.8%) |
| $75,000 to $99,999 | 13 (6.3%) | 20 (3.3%) |
| $100,000 to $149,999 | 44 (21.3%) | 124 (20.4%) |
| $150,000 or more | 56 (27.1%) | 225 (37.1%) |
| Total | 207 (100.0%) | 607 (100.0%) |
Property Value to Household Income Ratio in Lewisville

| Value-to-Income Ratio | Without Mortgage | With Mortgage |
| Less than 2.0x | 0 (0.0%) | 127,522 (21,008.6%) |
| 2.0x to 2.9x | 45 (21.7%) | 18 (3.0%) |
| 3.0x to 3.9x | 7 (3.4%) | 40 (6.6%) |
| 4.0x or more | 155 (74.9%) | 124 (20.4%) |
| Total | 207 (100.0%) | 607 (100.0%) |
Real Estate Taxes by Mortgage Status in Lewisville
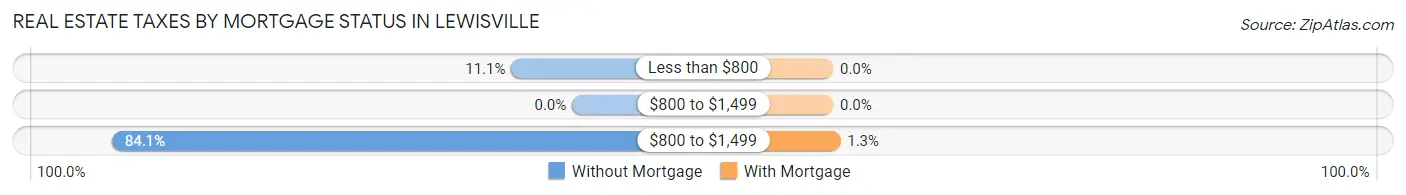
| Property Taxes | Without Mortgage | With Mortgage |
| Less than $800 | 23 (11.1%) | 0 (0.0%) |
| $800 to $1,499 | 0 (0.0%) | 0 (0.0%) |
| $800 to $1,499 | 174 (84.1%) | 8 (1.3%) |
| Total | 207 (100.0%) | 607 (100.0%) |
Health & Disability in Lewisville
Health Insurance Coverage by Age in Lewisville
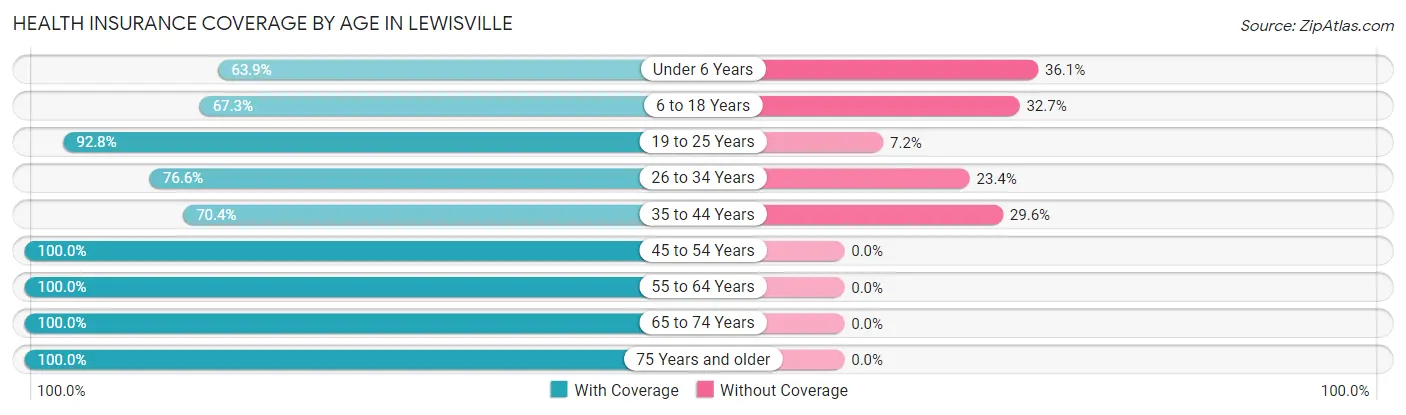
| Age Bracket | With Coverage | Without Coverage |
| Under 6 Years | 122 (63.9%) | 69 (36.1%) |
| 6 to 18 Years | 305 (67.3%) | 148 (32.7%) |
| 19 to 25 Years | 77 (92.8%) | 6 (7.2%) |
| 26 to 34 Years | 141 (76.6%) | 43 (23.4%) |
| 35 to 44 Years | 250 (70.4%) | 105 (29.6%) |
| 45 to 54 Years | 212 (100.0%) | 0 (0.0%) |
| 55 to 64 Years | 380 (100.0%) | 0 (0.0%) |
| 65 to 74 Years | 282 (100.0%) | 0 (0.0%) |
| 75 Years and older | 334 (100.0%) | 0 (0.0%) |
| Total | 2,103 (85.0%) | 371 (15.0%) |
Health Insurance Coverage by Citizenship Status in Lewisville
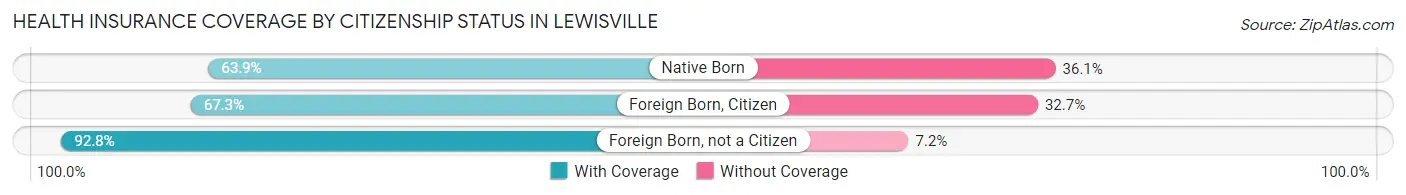
| Citizenship Status | With Coverage | Without Coverage |
| Native Born | 122 (63.9%) | 69 (36.1%) |
| Foreign Born, Citizen | 305 (67.3%) | 148 (32.7%) |
| Foreign Born, not a Citizen | 77 (92.8%) | 6 (7.2%) |
Health Insurance Coverage by Household Income in Lewisville
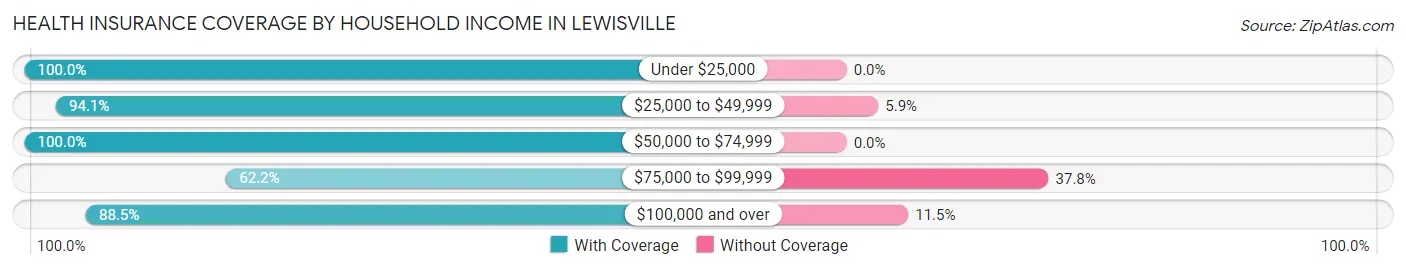
| Household Income | With Coverage | Without Coverage |
| Under $25,000 | 82 (100.0%) | 0 (0.0%) |
| $25,000 to $49,999 | 175 (94.1%) | 11 (5.9%) |
| $50,000 to $74,999 | 85 (100.0%) | 0 (0.0%) |
| $75,000 to $99,999 | 273 (62.2%) | 166 (37.8%) |
| $100,000 and over | 1,488 (88.5%) | 194 (11.5%) |
Public vs Private Health Insurance Coverage by Age in Lewisville
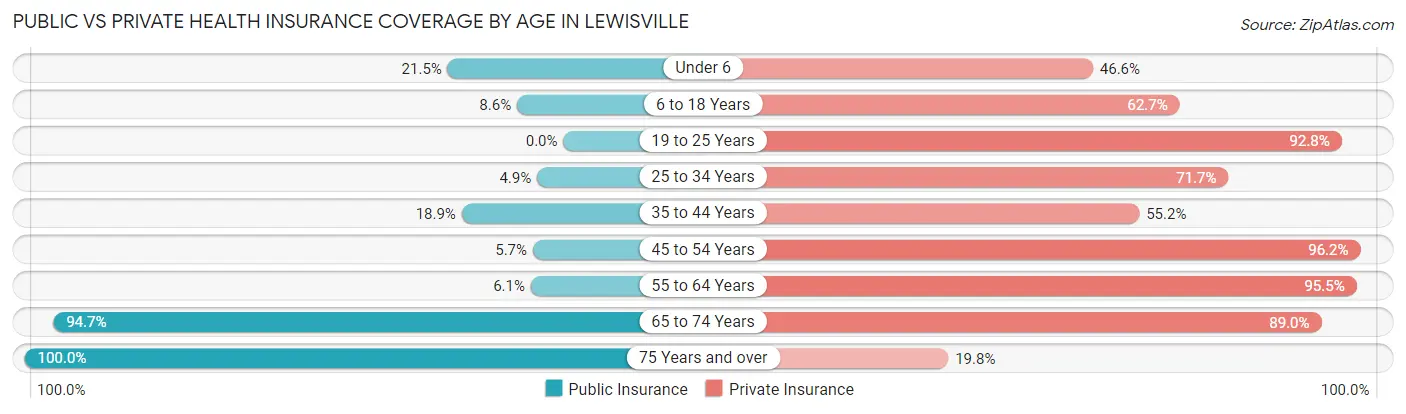
| Age Bracket | Public Insurance | Private Insurance |
| Under 6 | 41 (21.5%) | 89 (46.6%) |
| 6 to 18 Years | 39 (8.6%) | 284 (62.7%) |
| 19 to 25 Years | 0 (0.0%) | 77 (92.8%) |
| 25 to 34 Years | 9 (4.9%) | 132 (71.7%) |
| 35 to 44 Years | 67 (18.9%) | 196 (55.2%) |
| 45 to 54 Years | 12 (5.7%) | 204 (96.2%) |
| 55 to 64 Years | 23 (6.0%) | 363 (95.5%) |
| 65 to 74 Years | 267 (94.7%) | 251 (89.0%) |
| 75 Years and over | 334 (100.0%) | 66 (19.8%) |
| Total | 792 (32.0%) | 1,662 (67.2%) |
Disability Status by Sex by Age in Lewisville
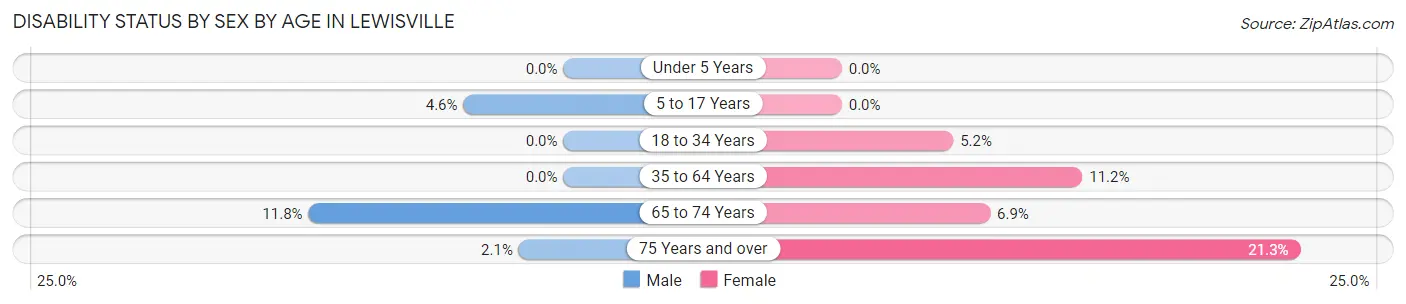
| Age Bracket | Male | Female |
| Under 5 Years | 0 (0.0%) | 0 (0.0%) |
| 5 to 17 Years | 9 (4.6%) | 0 (0.0%) |
| 18 to 34 Years | 0 (0.0%) | 9 (5.2%) |
| 35 to 64 Years | 0 (0.0%) | 54 (11.2%) |
| 65 to 74 Years | 11 (11.8%) | 13 (6.9%) |
| 75 Years and over | 4 (2.1%) | 30 (21.3%) |
Disability Class by Sex by Age in Lewisville
Disability Class: Hearing Difficulty
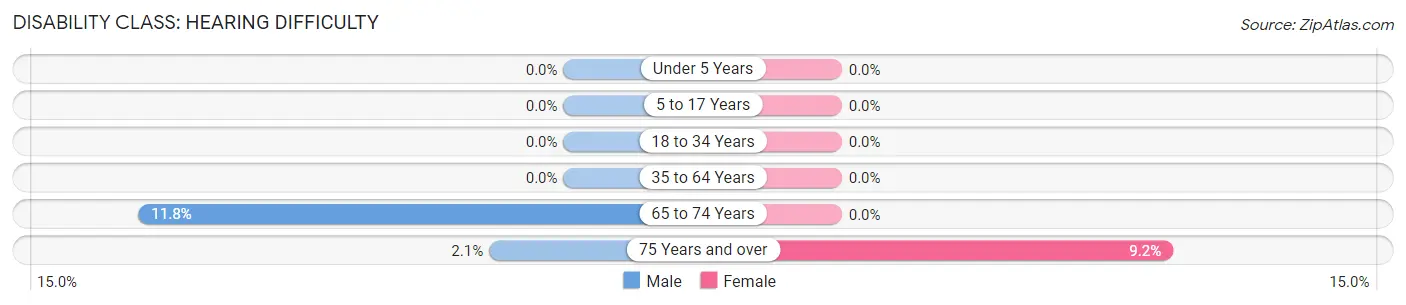
| Age Bracket | Male | Female |
| Under 5 Years | 0 (0.0%) | 0 (0.0%) |
| 5 to 17 Years | 0 (0.0%) | 0 (0.0%) |
| 18 to 34 Years | 0 (0.0%) | 0 (0.0%) |
| 35 to 64 Years | 0 (0.0%) | 0 (0.0%) |
| 65 to 74 Years | 11 (11.8%) | 0 (0.0%) |
| 75 Years and over | 4 (2.1%) | 13 (9.2%) |
Disability Class: Vision Difficulty
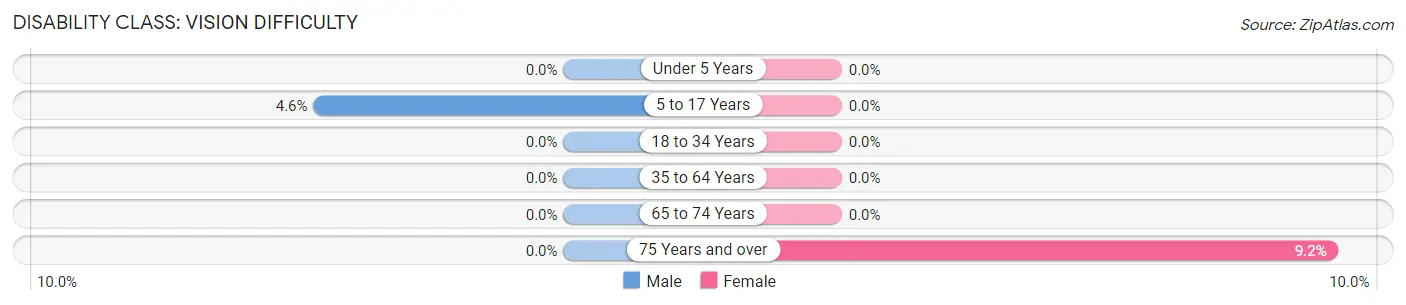
| Age Bracket | Male | Female |
| Under 5 Years | 0 (0.0%) | 0 (0.0%) |
| 5 to 17 Years | 9 (4.6%) | 0 (0.0%) |
| 18 to 34 Years | 0 (0.0%) | 0 (0.0%) |
| 35 to 64 Years | 0 (0.0%) | 0 (0.0%) |
| 65 to 74 Years | 0 (0.0%) | 0 (0.0%) |
| 75 Years and over | 0 (0.0%) | 13 (9.2%) |
Disability Class: Cognitive Difficulty
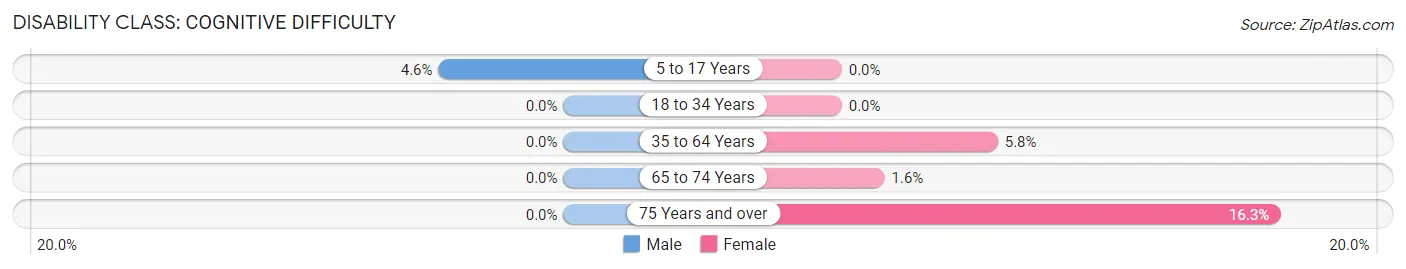
| Age Bracket | Male | Female |
| 5 to 17 Years | 9 (4.6%) | 0 (0.0%) |
| 18 to 34 Years | 0 (0.0%) | 0 (0.0%) |
| 35 to 64 Years | 0 (0.0%) | 28 (5.8%) |
| 65 to 74 Years | 0 (0.0%) | 3 (1.6%) |
| 75 Years and over | 0 (0.0%) | 23 (16.3%) |
Disability Class: Ambulatory Difficulty
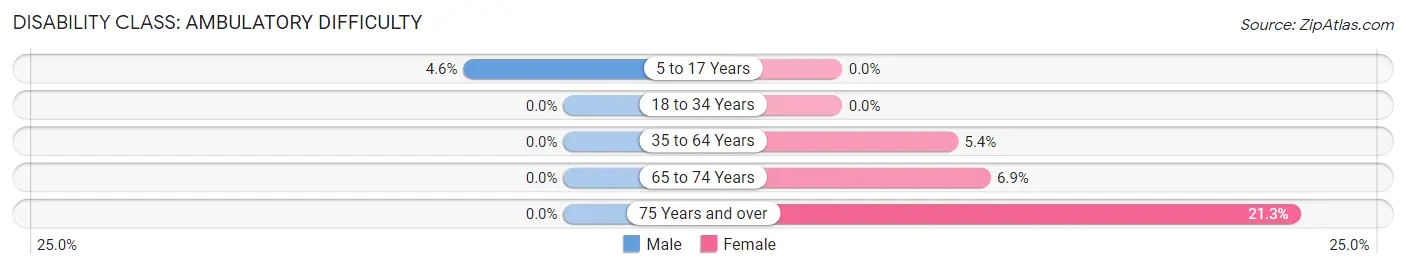
| Age Bracket | Male | Female |
| 5 to 17 Years | 9 (4.6%) | 0 (0.0%) |
| 18 to 34 Years | 0 (0.0%) | 0 (0.0%) |
| 35 to 64 Years | 0 (0.0%) | 26 (5.4%) |
| 65 to 74 Years | 0 (0.0%) | 13 (6.9%) |
| 75 Years and over | 0 (0.0%) | 30 (21.3%) |
Disability Class: Self-Care Difficulty
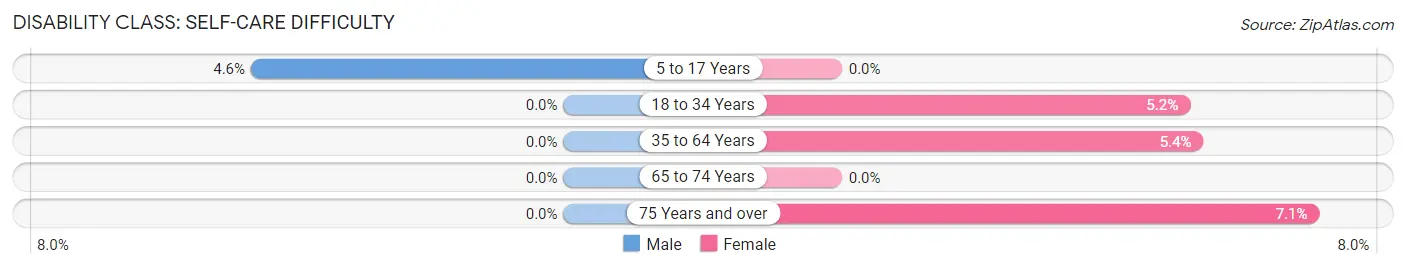
| Age Bracket | Male | Female |
| 5 to 17 Years | 9 (4.6%) | 0 (0.0%) |
| 18 to 34 Years | 0 (0.0%) | 9 (5.2%) |
| 35 to 64 Years | 0 (0.0%) | 26 (5.4%) |
| 65 to 74 Years | 0 (0.0%) | 0 (0.0%) |
| 75 Years and over | 0 (0.0%) | 10 (7.1%) |
Technology Access in Lewisville
Computing Device Access in Lewisville
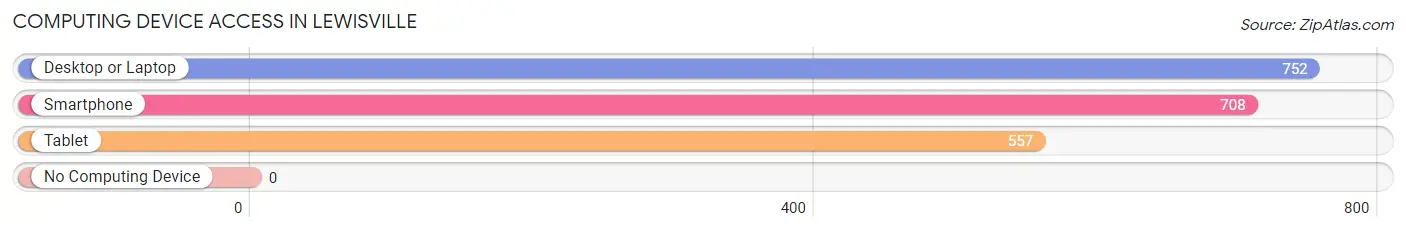
| Device Type | # Households | % Households |
| Desktop or Laptop | 752 | 90.9% |
| Smartphone | 708 | 85.6% |
| Tablet | 557 | 67.3% |
| No Computing Device | 0 | 0.0% |
| Total | 827 | 100.0% |
Internet Access in Lewisville
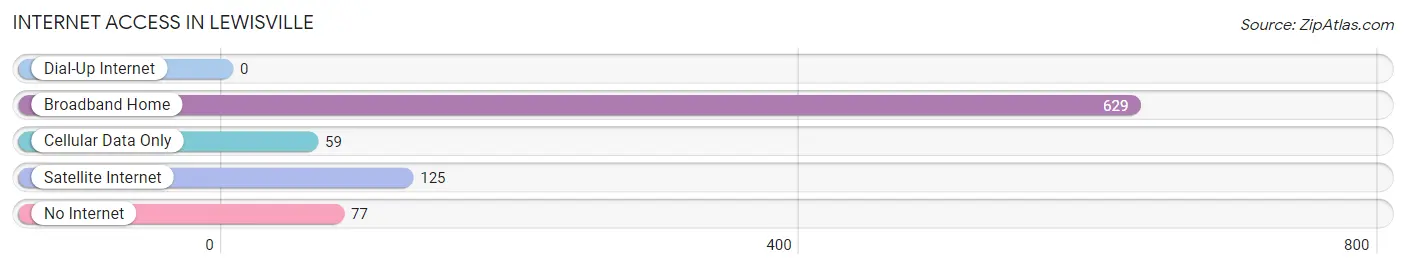
| Internet Type | # Households | % Households |
| Dial-Up Internet | 0 | 0.0% |
| Broadband Home | 629 | 76.1% |
| Cellular Data Only | 59 | 7.1% |
| Satellite Internet | 125 | 15.1% |
| No Internet | 77 | 9.3% |
| Total | 827 | 100.0% |
Lewisville Summary
Lewisville, Washington is a small town located in the eastern part of the state, in the county of Spokane. It is situated on the Spokane River, near the Idaho border. The town was founded in 1883 and has a population of approximately 1,000 people.
History
Lewisville was founded in 1883 by William Lewis, a former Civil War veteran. He named the town after himself and it was incorporated in 1891. The town was originally a farming community, but it soon became a center for logging and mining. The town was also home to a number of sawmills and other industries.
In the early 1900s, Lewisville was a thriving community with a population of over 1,000 people. The town had a number of stores, churches, schools, and other businesses. The town was also home to a number of saloons and gambling halls.
In the 1920s, the town began to decline as the logging and mining industries moved away. The population dropped to around 500 people by the 1950s. The town was revitalized in the 1970s when the Spokane River was dammed to create a reservoir. This created a recreational area that attracted tourists and new businesses.
Geography
Lewisville is located in the eastern part of Washington, in the county of Spokane. It is situated on the Spokane River, near the Idaho border. The town is surrounded by rolling hills and forests. The climate is generally mild, with hot summers and cold winters.
The town is located near several lakes, including Lake Coeur d'Alene, Lake Pend Oreille, and Lake Roosevelt. The town is also close to the Spokane River, which is a popular destination for fishing and boating.
Economy
The economy of Lewisville is largely based on tourism and recreation. The town is home to a number of resorts, campgrounds, and other recreational facilities. The town is also home to a number of businesses, including restaurants, stores, and other services.
The town is also home to a number of manufacturing and industrial businesses. These businesses include a lumber mill, a sawmill, and a paper mill.
Demographics
As of the 2010 census, the population of Lewisville was 1,000 people. The racial makeup of the town was 95.2% White, 0.7% African American, 0.7% Native American, 0.7% Asian, 0.7% from other races, and 2.1% from two or more races.
The median income for a household in the town was $37,500, and the median income for a family was $45,000. The per capita income for the town was $19,000. About 10.7% of families and 14.3% of the population were below the poverty line, including 18.2% of those under age 18 and 8.3% of those age 65 or over.
Common Questions
What is the Total Population of Lewisville?
Total Population of Lewisville is 2,474.
What is the Total Male Population of Lewisville?
Total Male Population of Lewisville is 1,107.
What is the Total Female Population of Lewisville?
Total Female Population of Lewisville is 1,367.
What is the Ratio of Males per 100 Females in Lewisville?
There are 80.98 Males per 100 Females in Lewisville.
What is the Ratio of Females per 100 Males in Lewisville?
There are 123.49 Females per 100 Males in Lewisville.
What is the Median Population Age in Lewisville?
Median Population Age in Lewisville is 44.5 Years.
What is the Average Family Size in Lewisville
Average Family Size in Lewisville is 2.9 People.
What is the Average Household Size in Lewisville
Average Household Size in Lewisville is 3.0 People.
What is Per Capita Income in Lewisville?
Per Capita income in Lewisville is $43,184.
What is the Median Family Income in Lewisville?
Median Family Income in Lewisville is $114,936.
What is the Median Household income in Lewisville?
Median Household Income in Lewisville is $114,968.
What is Income or Wage Gap in Lewisville?
Income or Wage Gap in Lewisville is 43.0%.
Women in Lewisville earn 57.0 cents for every dollar earned by a man.
What is Inequality or Gini Index in Lewisville?
Inequality or Gini Index in Lewisville is 0.32.
How Large is the Labor Force in Lewisville?
There are 1,109 People in the Labor Forcein in Lewisville.
What is the Percentage of People in the Labor Force in Lewisville?
58.3% of People are in the Labor Force in Lewisville.
What is the Unemployment Rate in Lewisville?
Unemployment Rate in Lewisville is 4.4%.