Zip Codes with the Highest Percentage of Population Employed in Administrative & Support Services in Lynnwood, WA
RELATED REPORTS & OPTIONS
Administrative & Support Services
Lynnwood
Compare Zip Codes
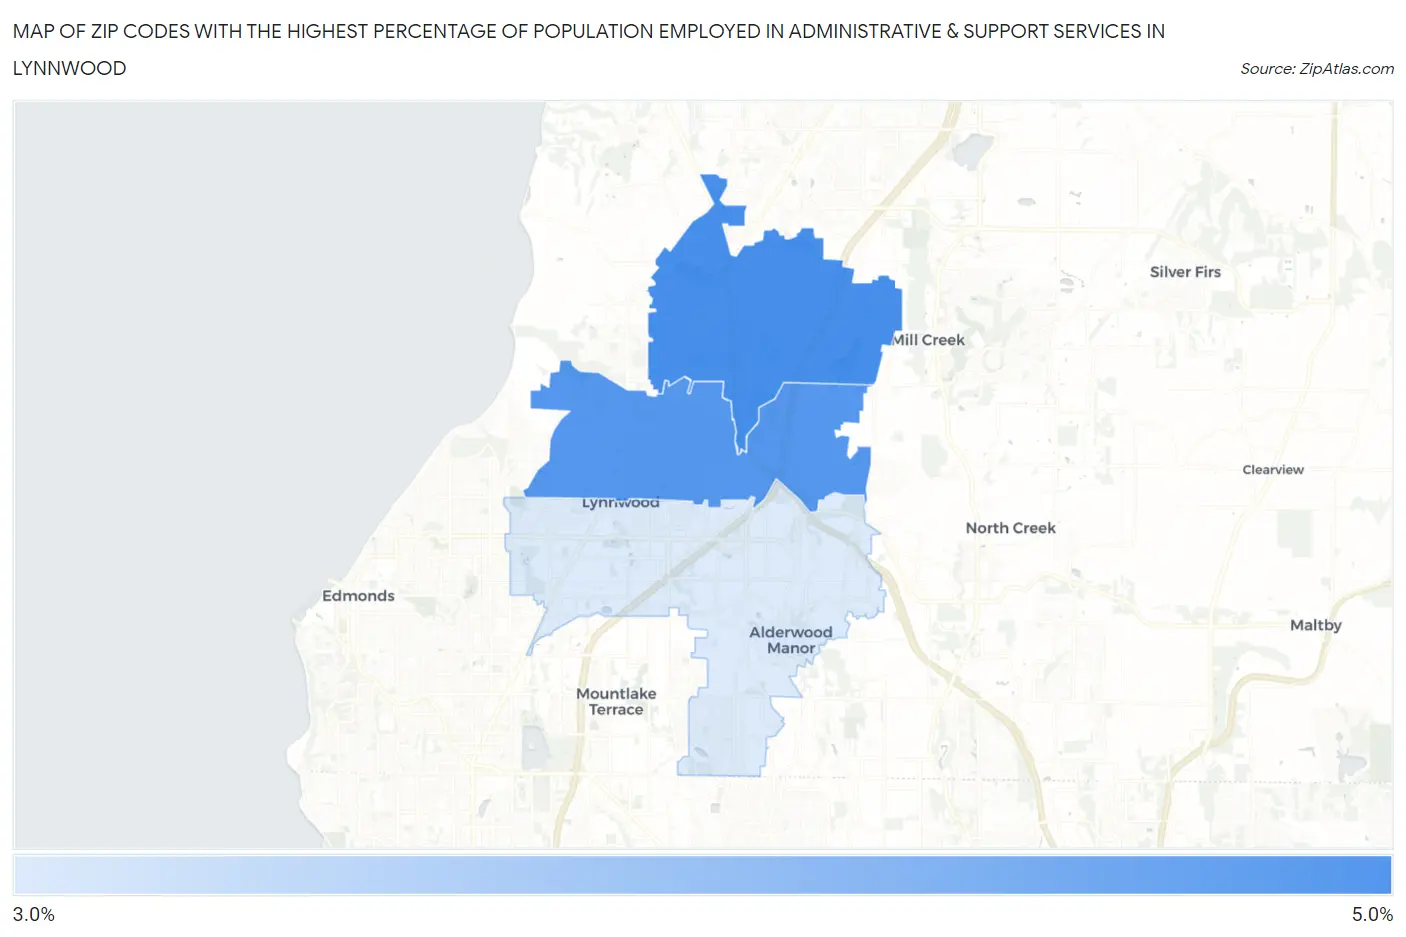
Map of Zip Codes with the Highest Percentage of Population Employed in Administrative & Support Services in Lynnwood
0.0%
5.0%
Zip Codes with the Highest Percentage of Population Employed in Administrative & Support Services in Lynnwood, WA
| Zip Code | % Employed | vs State | vs National | |
| 1. | 98087 | 4.7% | 3.8%(+0.897)#133 | 4.1%(+0.513)#8,155 |
| 2. | 98037 | 4.6% | 3.8%(+0.814)#139 | 4.1%(+0.430)#8,440 |
| 3. | 98036 | 3.8% | 3.8%(+0.031)#216 | 4.1%(-0.353)#11,546 |
1
Common Questions
What are the Top Zip Codes with the Highest Percentage of Population Employed in Administrative & Support Services in Lynnwood, WA?
Top Zip Codes with the Highest Percentage of Population Employed in Administrative & Support Services in Lynnwood, WA are:
What zip code has the Highest Percentage of Population Employed in Administrative & Support Services in Lynnwood, WA?
98087 has the Highest Percentage of Population Employed in Administrative & Support Services in Lynnwood, WA with 4.7%.
What is the Percentage of Population Employed in Administrative & Support Services in Lynnwood, WA?
Percentage of Population Employed in Administrative & Support Services in Lynnwood is 4.7%.
What is the Percentage of Population Employed in Administrative & Support Services in Washington?
Percentage of Population Employed in Administrative & Support Services in Washington is 3.8%.
What is the Percentage of Population Employed in Administrative & Support Services in the United States?
Percentage of Population Employed in Administrative & Support Services in the United States is 4.1%.