Lower Elochoman, WA
Lower Elochoman Map
Lower Elochoman Overview
445
TOTAL POPULATION
309
MALE POPULATION
136
FEMALE POPULATION
227.21
MALES / 100 FEMALES
44.01
FEMALES / 100 MALES
38.1
MEDIAN AGE
4.4
AVG FAMILY SIZE
3.5
AVG HOUSEHOLD SIZE
$27,411
PER CAPITA INCOME
$94,292
AVG FAMILY INCOME
$93,458
AVG HOUSEHOLD INCOME
38.7%
WAGE / INCOME GAP [ % ]
61.3¢/ $1
WAGE / INCOME GAP [ $ ]
0.35
INEQUALITY / GINI INDEX
241
LABOR FORCE [ PEOPLE ]
80.3%
PERCENT IN LABOR FORCE
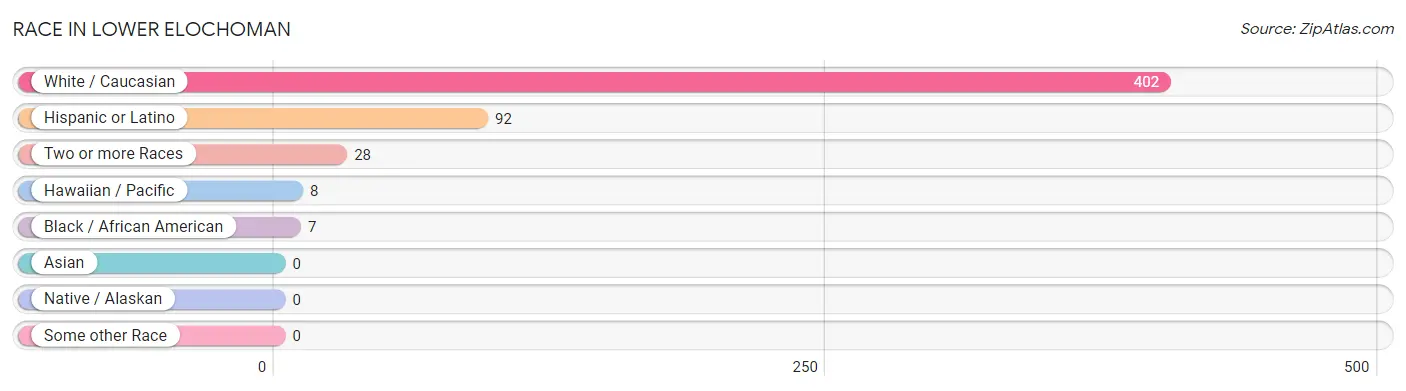
Race in Lower Elochoman
The most populous races in Lower Elochoman are White / Caucasian (402 | 90.3%), Hispanic or Latino (92 | 20.7%), and Two or more Races (28 | 6.3%).
| Race | # Population | % Population |
| Asian | 0 | 0.0% |
| Black / African American | 7 | 1.6% |
| Hawaiian / Pacific | 8 | 1.8% |
| Hispanic or Latino | 92 | 20.7% |
| Native / Alaskan | 0 | 0.0% |
| White / Caucasian | 402 | 90.3% |
| Two or more Races | 28 | 6.3% |
| Some other Race | 0 | 0.0% |
| Total | 445 | 100.0% |
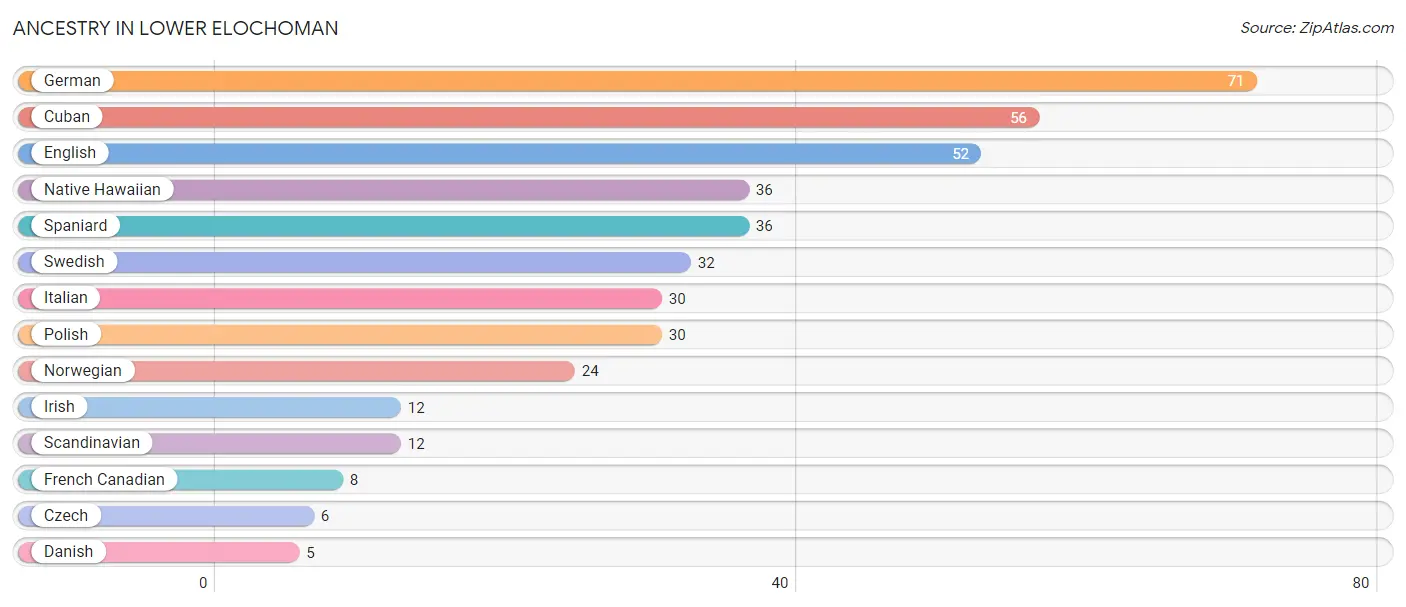
Ancestry in Lower Elochoman
The most populous ancestries reported in Lower Elochoman are German (71 | 16.0%), Cuban (56 | 12.6%), English (52 | 11.7%), Native Hawaiian (36 | 8.1%), and Spaniard (36 | 8.1%), together accounting for 56.4% of all Lower Elochoman residents.
| Ancestry | # Population | % Population |
| Cuban | 56 | 12.6% |
| Czech | 6 | 1.3% |
| Danish | 5 | 1.1% |
| English | 52 | 11.7% |
| French Canadian | 8 | 1.8% |
| German | 71 | 16.0% |
| Irish | 12 | 2.7% |
| Italian | 30 | 6.7% |
| Native Hawaiian | 36 | 8.1% |
| Norwegian | 24 | 5.4% |
| Polish | 30 | 6.7% |
| Scandinavian | 12 | 2.7% |
| Spaniard | 36 | 8.1% |
| Swedish | 32 | 7.2% | View All 14 Rows |
Immigrants in Lower Elochoman

| Immigration Origin | # Population | % Population | View All 0 Rows |
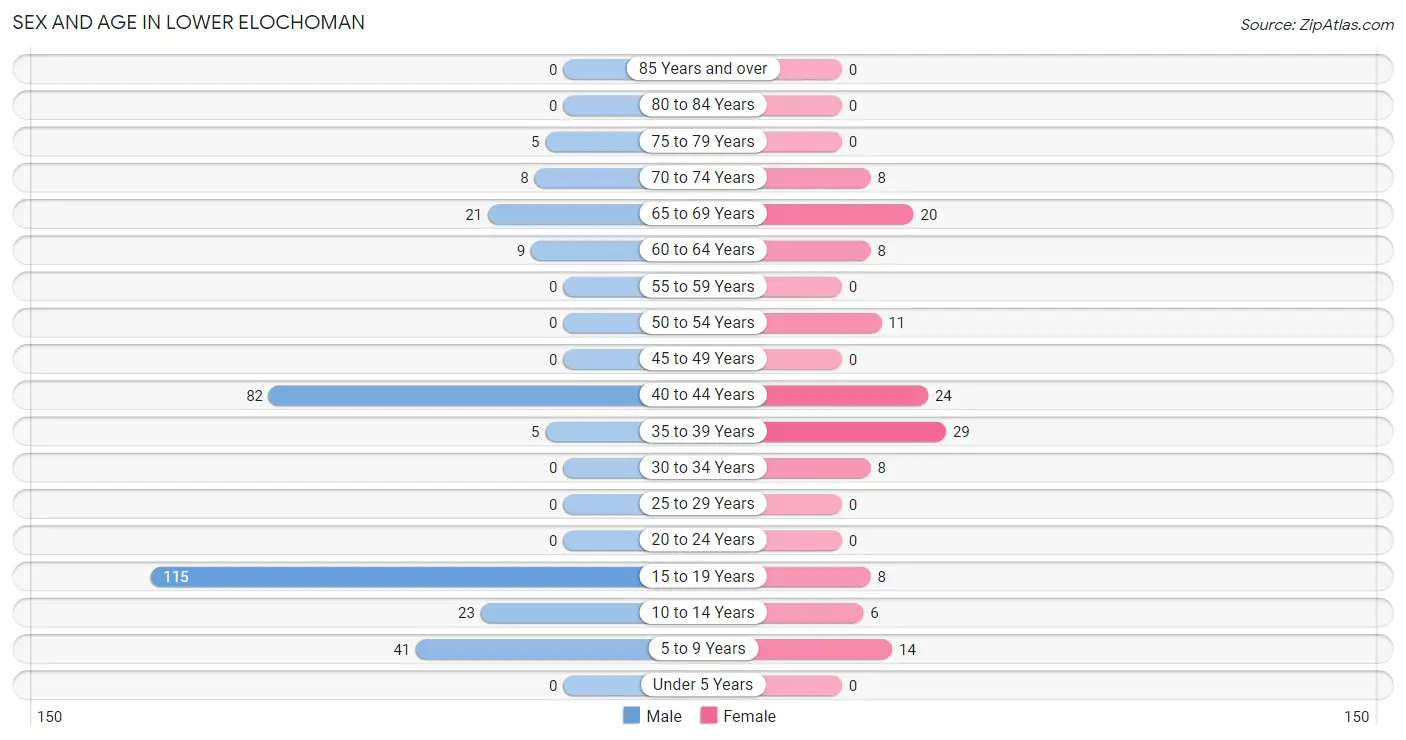
Sex and Age in Lower Elochoman
Sex and Age in Lower Elochoman
The most populous age groups in Lower Elochoman are 15 to 19 Years (115 | 37.2%) for men and 35 to 39 Years (29 | 21.3%) for women.
| Age Bracket | Male | Female |
| Under 5 Years | 0 (0.0%) | 0 (0.0%) |
| 5 to 9 Years | 41 (13.3%) | 14 (10.3%) |
| 10 to 14 Years | 23 (7.4%) | 6 (4.4%) |
| 15 to 19 Years | 115 (37.2%) | 8 (5.9%) |
| 20 to 24 Years | 0 (0.0%) | 0 (0.0%) |
| 25 to 29 Years | 0 (0.0%) | 0 (0.0%) |
| 30 to 34 Years | 0 (0.0%) | 8 (5.9%) |
| 35 to 39 Years | 5 (1.6%) | 29 (21.3%) |
| 40 to 44 Years | 82 (26.5%) | 24 (17.6%) |
| 45 to 49 Years | 0 (0.0%) | 0 (0.0%) |
| 50 to 54 Years | 0 (0.0%) | 11 (8.1%) |
| 55 to 59 Years | 0 (0.0%) | 0 (0.0%) |
| 60 to 64 Years | 9 (2.9%) | 8 (5.9%) |
| 65 to 69 Years | 21 (6.8%) | 20 (14.7%) |
| 70 to 74 Years | 8 (2.6%) | 8 (5.9%) |
| 75 to 79 Years | 5 (1.6%) | 0 (0.0%) |
| 80 to 84 Years | 0 (0.0%) | 0 (0.0%) |
| 85 Years and over | 0 (0.0%) | 0 (0.0%) |
| Total | 309 (100.0%) | 136 (100.0%) |
Families and Households in Lower Elochoman
Median Family Size in Lower Elochoman
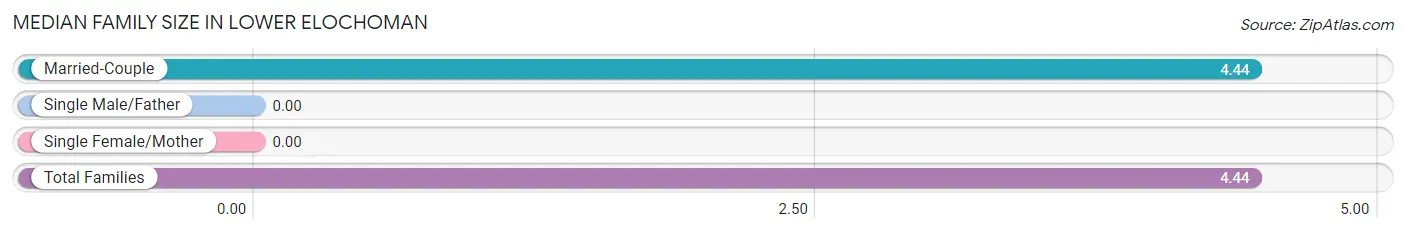
| Family Type | # Families | Family Size |
| Married-Couple | 91 (100.0%) | 4.44 |
| Single Male/Father | 0 (0.0%) | - |
| Single Female/Mother | 0 (0.0%) | - |
| Total Families | 91 (100.0%) | 4.44 |
Median Household Size in Lower Elochoman
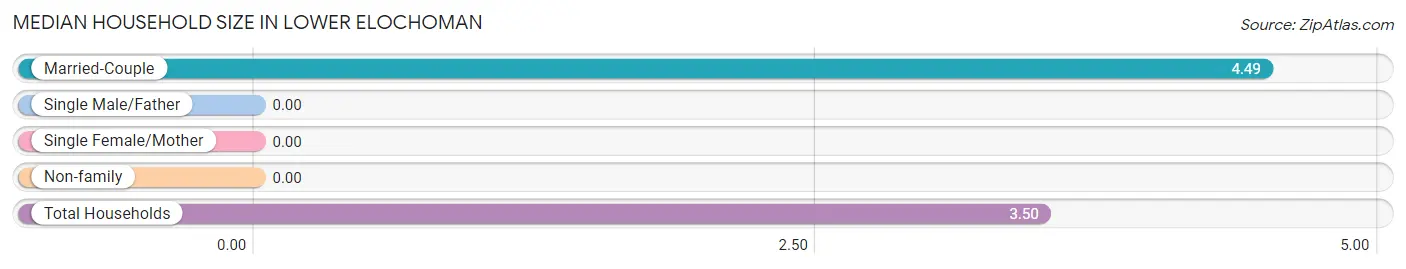
| Household Type | # Households | Household Size |
| Married-Couple | 91 (71.7%) | 4.49 |
| Single Male/Father | 0 (0.0%) | - |
| Single Female/Mother | 0 (0.0%) | - |
| Non-family | 36 (28.3%) | - |
| Total Households | 127 (100.0%) | 3.50 |
Household Size by Marriage Status in Lower Elochoman
Out of a total of 127 households in Lower Elochoman, 91 (71.7%) are family households, while 36 (28.3%) are nonfamily households. The most numerous type of family households are 4-person households, comprising 40, and the most common type of nonfamily households are 1-person households, comprising 36.
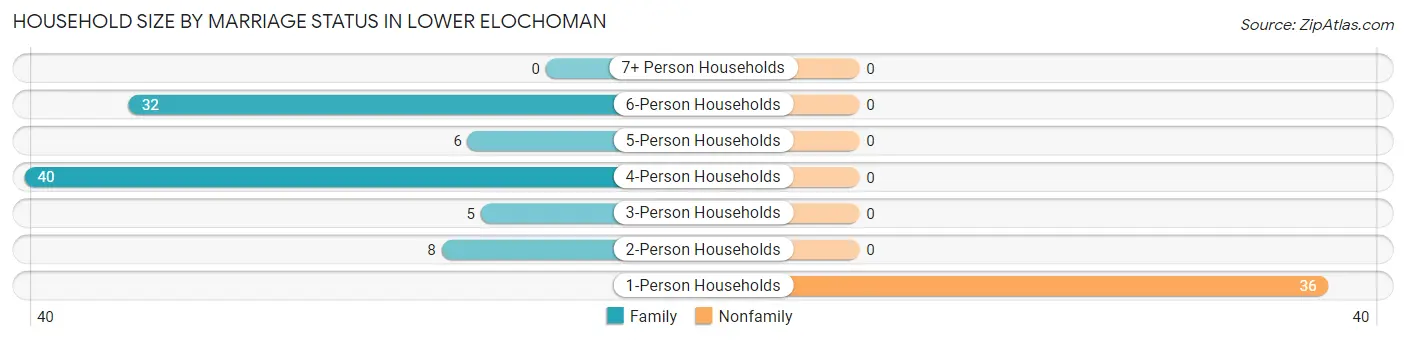
| Household Size | Family Households | Nonfamily Households |
| 1-Person Households | - | 36 (28.3%) |
| 2-Person Households | 8 (6.3%) | 0 (0.0%) |
| 3-Person Households | 5 (3.9%) | 0 (0.0%) |
| 4-Person Households | 40 (31.5%) | 0 (0.0%) |
| 5-Person Households | 6 (4.7%) | 0 (0.0%) |
| 6-Person Households | 32 (25.2%) | 0 (0.0%) |
| 7+ Person Households | 0 (0.0%) | 0 (0.0%) |
| Total | 91 (71.7%) | 36 (28.3%) |
Female Fertility in Lower Elochoman
Fertility by Age in Lower Elochoman
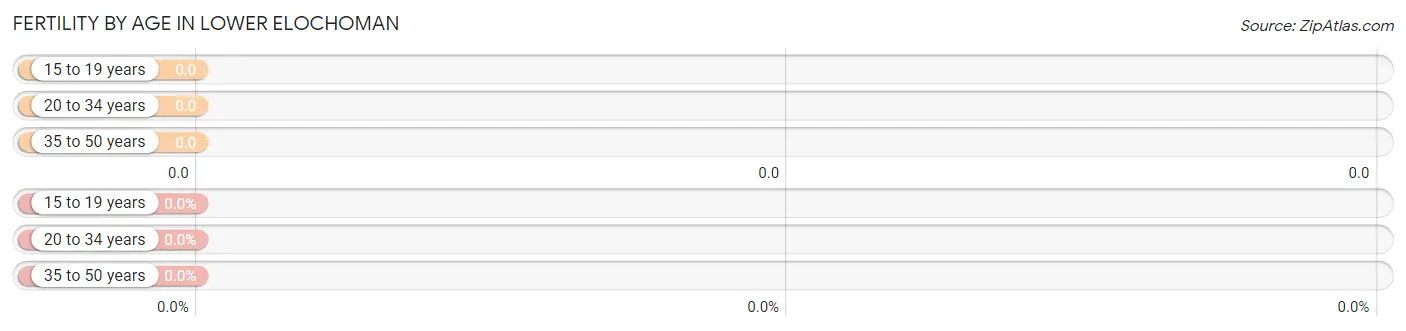
| Age Bracket | Women with Births | Births / 1,000 Women |
| 15 to 19 years | 0 (0.0%) | 0.0 |
| 20 to 34 years | 0 (0.0%) | 0.0 |
| 35 to 50 years | 0 (0.0%) | 0.0 |
| Total | 0 (0.0%) | 0.0 |
Fertility by Age by Marriage Status in Lower Elochoman
| Age Bracket | Married | Unmarried |
| 15 to 19 years | 0 (0.0%) | 0 (0.0%) |
| 20 to 34 years | 0 (0.0%) | 0 (0.0%) |
| 35 to 50 years | 0 (0.0%) | 0 (0.0%) |
| Total | 0 (0.0%) | 0 (0.0%) |
Fertility by Education in Lower Elochoman
| Educational Attainment | Women with Births | Births / 1,000 Women |
| Less than High School | 0 (0.0%) | 0.0 |
| High School Diploma | 0 (0.0%) | 0.0 |
| College or Associate's Degree | 0 (0.0%) | 0.0 |
| Bachelor's Degree | 0 (0.0%) | 0.0 |
| Graduate Degree | 0 (0.0%) | 0.0 |
| Total | 0 (0.0%) | 0.0 |
Fertility by Education by Marriage Status in Lower Elochoman
| Educational Attainment | Married | Unmarried |
| Less than High School | 0 (0.0%) | 0 (0.0%) |
| High School Diploma | 0 (0.0%) | 0 (0.0%) |
| College or Associate's Degree | 0 (0.0%) | 0 (0.0%) |
| Bachelor's Degree | 0 (0.0%) | 0 (0.0%) |
| Graduate Degree | 0 (0.0%) | 0 (0.0%) |
| Total | 0 (0.0%) | 0 (0.0%) |
Income in Lower Elochoman
Income Overview in Lower Elochoman
Per Capita Income in Lower Elochoman is $27,411, while median incomes of families and households are $94,292 and $93,458 respectively.
| Characteristic | Number | Measure |
| Per Capita Income | 445 | $27,411 |
| Median Family Income | 91 | $94,292 |
| Mean Family Income | 91 | $111,946 |
| Median Household Income | 127 | $93,458 |
| Mean Household Income | 127 | $94,879 |
| Income Deficit | 91 | $0 |
| Wage / Income Gap (%) | 445 | 38.70% |
| Wage / Income Gap ($) | 445 | 61.30¢ per $1 |
| Gini / Inequality Index | 445 | 0.35 |
Earnings by Sex in Lower Elochoman
Average Earnings in Lower Elochoman are $40,313, $41,632 for men and $25,521 for women, a difference of 38.7%.
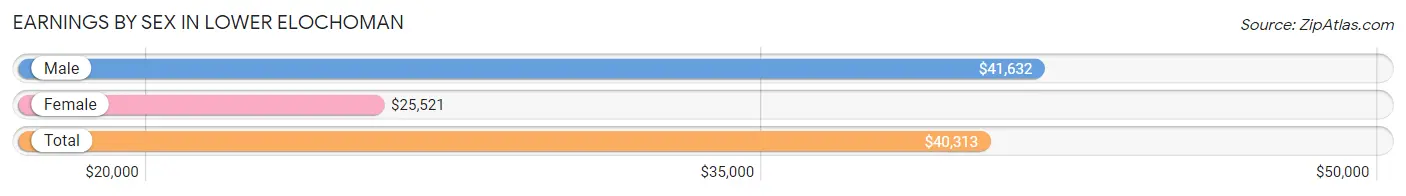
| Sex | Number | Average Earnings |
| Male | 155 (62.7%) | $41,632 |
| Female | 92 (37.2%) | $25,521 |
| Total | 247 (100.0%) | $40,313 |
Earnings by Sex by Income Bracket in Lower Elochoman
The most common earnings brackets in Lower Elochoman are $2,500 to $4,999 for men (48 | 31.0%) and $12,500 to $14,999 for women (24 | 26.1%).
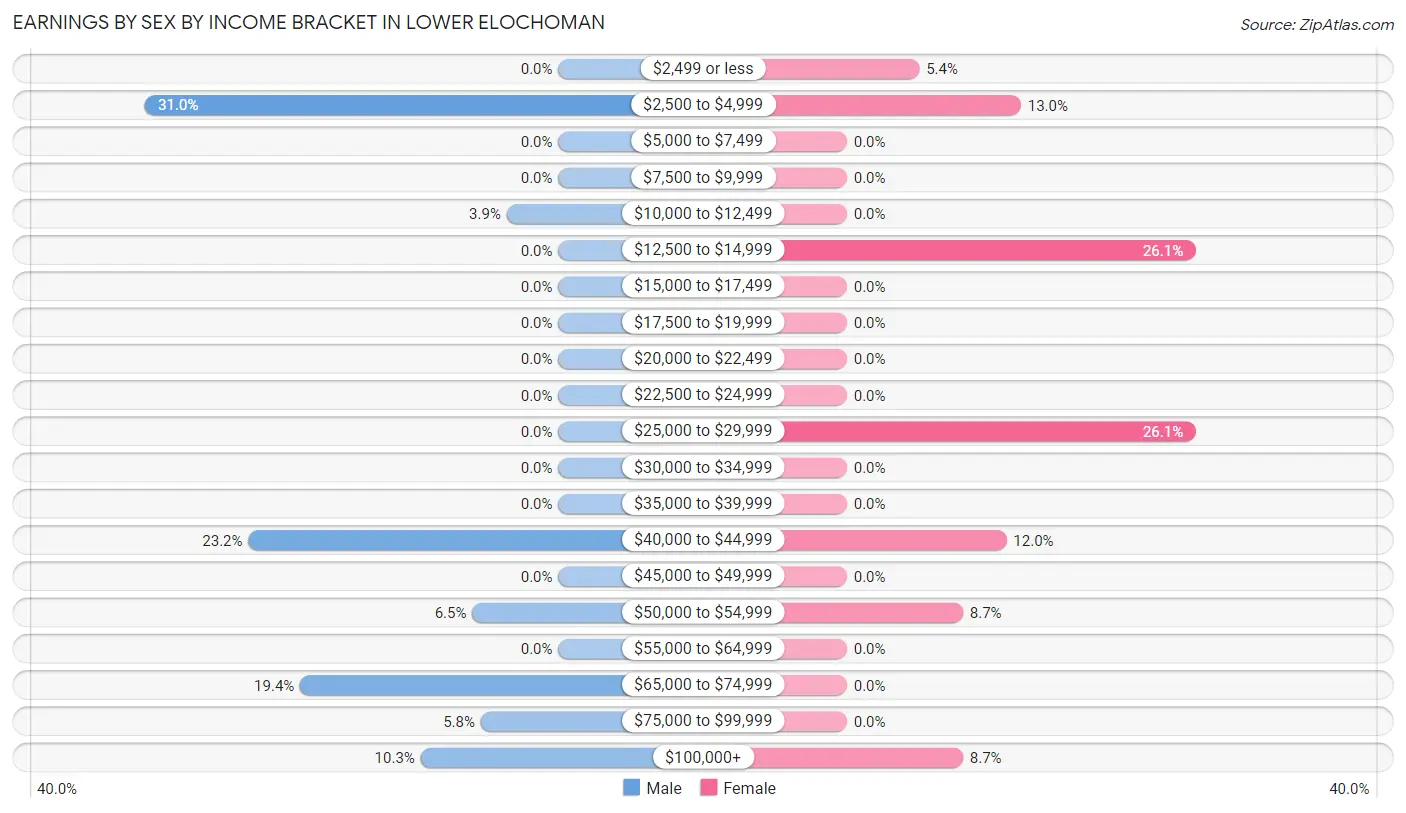
| Income | Male | Female |
| $2,499 or less | 0 (0.0%) | 5 (5.4%) |
| $2,500 to $4,999 | 48 (31.0%) | 12 (13.0%) |
| $5,000 to $7,499 | 0 (0.0%) | 0 (0.0%) |
| $7,500 to $9,999 | 0 (0.0%) | 0 (0.0%) |
| $10,000 to $12,499 | 6 (3.9%) | 0 (0.0%) |
| $12,500 to $14,999 | 0 (0.0%) | 24 (26.1%) |
| $15,000 to $17,499 | 0 (0.0%) | 0 (0.0%) |
| $17,500 to $19,999 | 0 (0.0%) | 0 (0.0%) |
| $20,000 to $22,499 | 0 (0.0%) | 0 (0.0%) |
| $22,500 to $24,999 | 0 (0.0%) | 0 (0.0%) |
| $25,000 to $29,999 | 0 (0.0%) | 24 (26.1%) |
| $30,000 to $34,999 | 0 (0.0%) | 0 (0.0%) |
| $35,000 to $39,999 | 0 (0.0%) | 0 (0.0%) |
| $40,000 to $44,999 | 36 (23.2%) | 11 (12.0%) |
| $45,000 to $49,999 | 0 (0.0%) | 0 (0.0%) |
| $50,000 to $54,999 | 10 (6.5%) | 8 (8.7%) |
| $55,000 to $64,999 | 0 (0.0%) | 0 (0.0%) |
| $65,000 to $74,999 | 30 (19.4%) | 0 (0.0%) |
| $75,000 to $99,999 | 9 (5.8%) | 0 (0.0%) |
| $100,000+ | 16 (10.3%) | 8 (8.7%) |
| Total | 155 (100.0%) | 92 (100.0%) |
Earnings by Sex by Educational Attainment in Lower Elochoman
Average earnings in Lower Elochoman are $67,875 for men and $25,521 for women, a difference of 62.4%. Men with an educational attainment of college or associate's degree enjoy the highest average annual earnings of $69,417, while those with college or associate's degree education earn the least with $69,417. Women with an educational attainment of less than high school earn the most with the average annual earnings of $26,563, while those with less than high school education have the smallest earnings of $26,563.
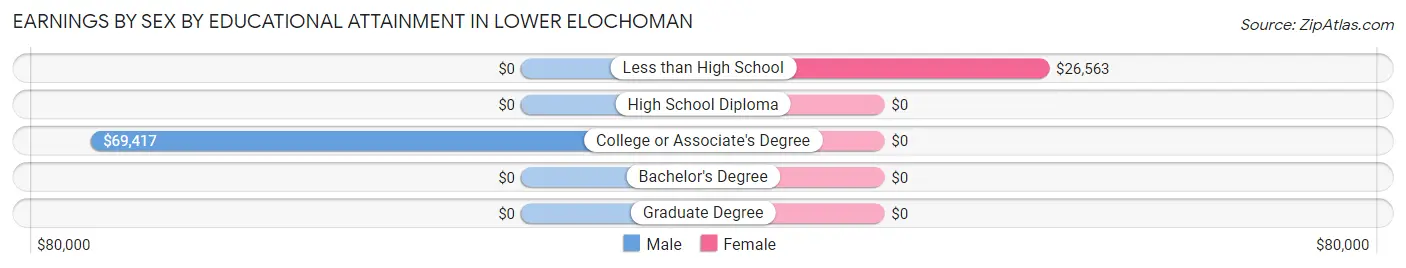
| Educational Attainment | Male Income | Female Income |
| Less than High School | - | - |
| High School Diploma | - | - |
| College or Associate's Degree | $69,417 | $0 |
| Bachelor's Degree | - | - |
| Graduate Degree | - | - |
| Total | $67,875 | $25,521 |
Family Income in Lower Elochoman
Family Income Brackets in Lower Elochoman
According to the Lower Elochoman family income data, there are 32 families falling into the $100,000 to $149,999 income range, which is the most common income bracket and makes up 35.2% of all families.

| Income Bracket | # Families | % Families |
| Less than $10,000 | 0 | 0.0% |
| $10,000 to $14,999 | 0 | 0.0% |
| $15,000 to $24,999 | 0 | 0.0% |
| $25,000 to $34,999 | 0 | 0.0% |
| $35,000 to $49,999 | 0 | 0.0% |
| $50,000 to $74,999 | 24 | 26.4% |
| $75,000 to $99,999 | 30 | 33.0% |
| $100,000 to $149,999 | 32 | 35.2% |
| $150,000 to $199,999 | 0 | 0.0% |
| $200,000+ | 5 | 5.5% |
Family Income by Famaliy Size in Lower Elochoman
| Income Bracket | # Families | Median Income |
| 2-Person Families | 8 (8.8%) | $0 |
| 3-Person Families | 15 (16.5%) | $0 |
| 4-Person Families | 30 (33.0%) | $0 |
| 5-Person Families | 6 (6.6%) | $0 |
| 6-Person Families | 32 (35.2%) | $0 |
| 7+ Person Families | 0 (0.0%) | $0 |
| Total | 91 (100.0%) | $94,292 |
Family Income by Number of Earners in Lower Elochoman
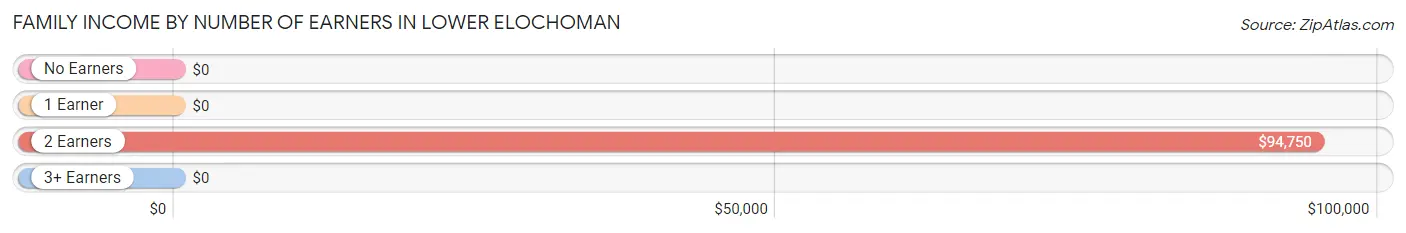
| Number of Earners | # Families | Median Income |
| No Earners | 0 (0.0%) | $0 |
| 1 Earner | 8 (8.8%) | $0 |
| 2 Earners | 54 (59.3%) | $94,750 |
| 3+ Earners | 29 (31.9%) | $0 |
| Total | 91 (100.0%) | $94,292 |
Household Income in Lower Elochoman
Household Income Brackets in Lower Elochoman
With 40 households falling in the category, the $100,000 to $149,999 income range is the most frequent in Lower Elochoman, accounting for 31.5% of all households.
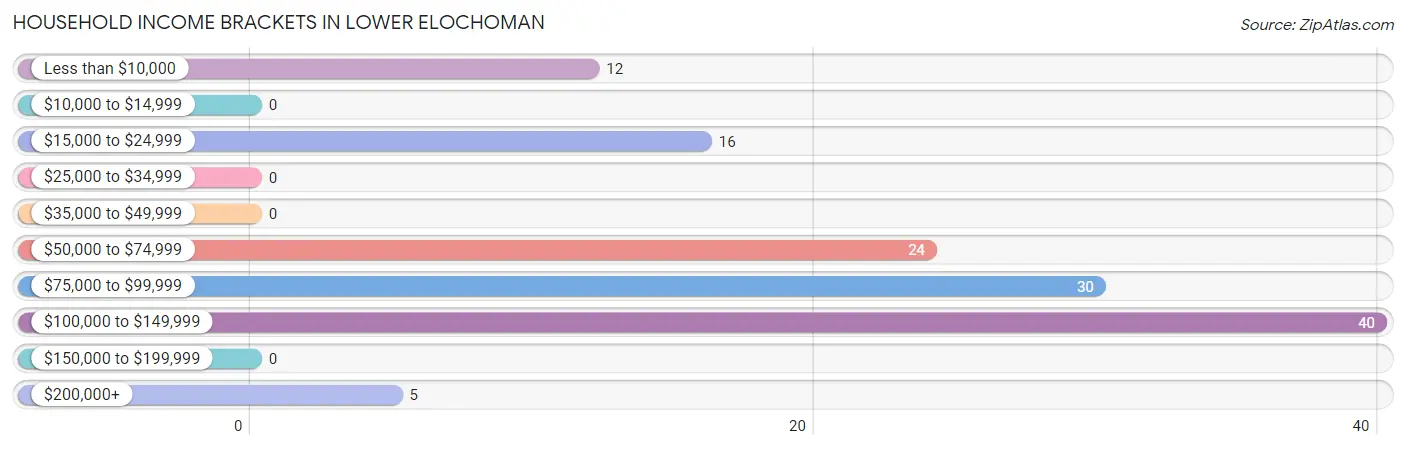
| Income Bracket | # Households | % Households |
| Less than $10,000 | 12 | 9.4% |
| $10,000 to $14,999 | 0 | 0.0% |
| $15,000 to $24,999 | 16 | 12.6% |
| $25,000 to $34,999 | 0 | 0.0% |
| $35,000 to $49,999 | 0 | 0.0% |
| $50,000 to $74,999 | 24 | 18.9% |
| $75,000 to $99,999 | 30 | 23.6% |
| $100,000 to $149,999 | 40 | 31.5% |
| $150,000 to $199,999 | 0 | 0.0% |
| $200,000+ | 5 | 3.9% |
Household Income by Householder Age in Lower Elochoman
The median household income in Lower Elochoman is $93,458, with the highest median household income of $93,750 found in the 25 to 44 years age bracket for the primary householder. A total of 78 households (61.4%) fall into this category.
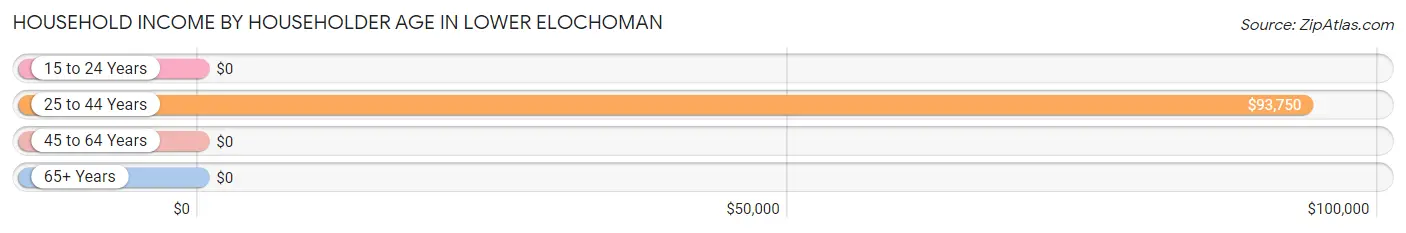
| Income Bracket | # Households | Median Income |
| 15 to 24 Years | 0 (0.0%) | $0 |
| 25 to 44 Years | 78 (61.4%) | $93,750 |
| 45 to 64 Years | 8 (6.3%) | $0 |
| 65+ Years | 41 (32.3%) | $0 |
| Total | 127 (100.0%) | $93,458 |
Poverty in Lower Elochoman
Income Below Poverty by Sex and Age in Lower Elochoman
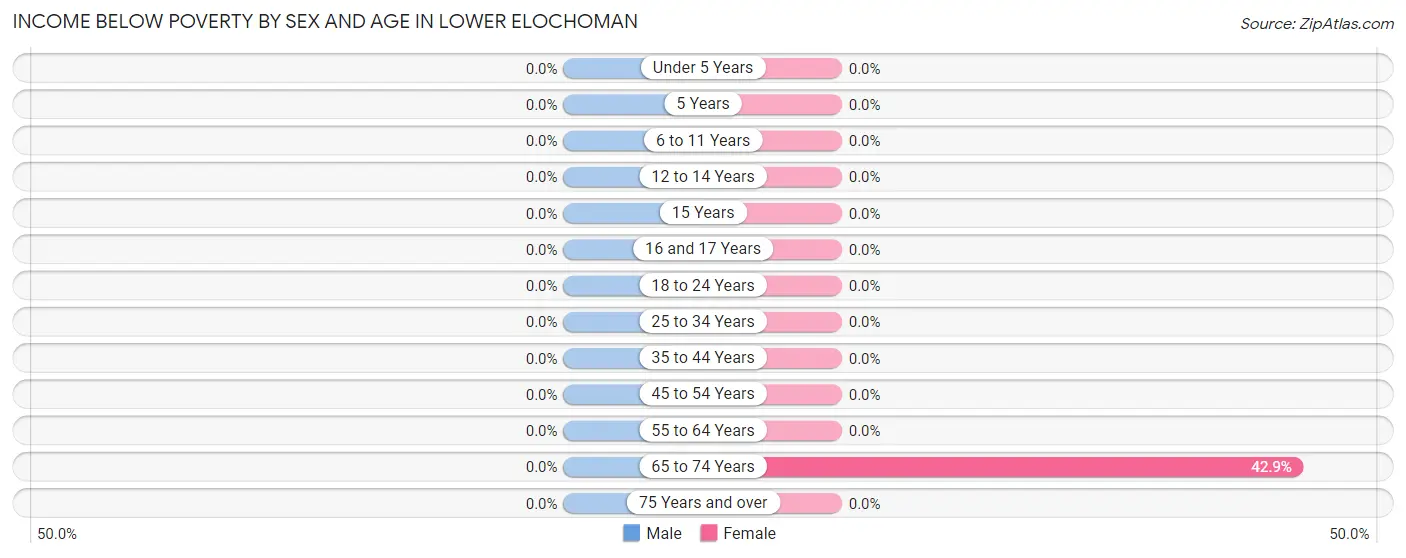
| Age Bracket | Male | Female |
| Under 5 Years | 0 (0.0%) | 0 (0.0%) |
| 5 Years | 0 (0.0%) | 0 (0.0%) |
| 6 to 11 Years | 0 (0.0%) | 0 (0.0%) |
| 12 to 14 Years | 0 (0.0%) | 0 (0.0%) |
| 15 Years | 0 (0.0%) | 0 (0.0%) |
| 16 and 17 Years | 0 (0.0%) | 0 (0.0%) |
| 18 to 24 Years | 0 (0.0%) | 0 (0.0%) |
| 25 to 34 Years | 0 (0.0%) | 0 (0.0%) |
| 35 to 44 Years | 0 (0.0%) | 0 (0.0%) |
| 45 to 54 Years | 0 (0.0%) | 0 (0.0%) |
| 55 to 64 Years | 0 (0.0%) | 0 (0.0%) |
| 65 to 74 Years | 0 (0.0%) | 12 (42.9%) |
| 75 Years and over | 0 (0.0%) | 0 (0.0%) |
| Total | 0 (0.0%) | 12 (8.8%) |
Income Above Poverty by Sex and Age in Lower Elochoman
According to the poverty statistics in Lower Elochoman, males aged 6 to 11 years and females aged 5 years are the age groups that are most secure financially, with 100.0% of males and 100.0% of females in these age groups living above the poverty line.
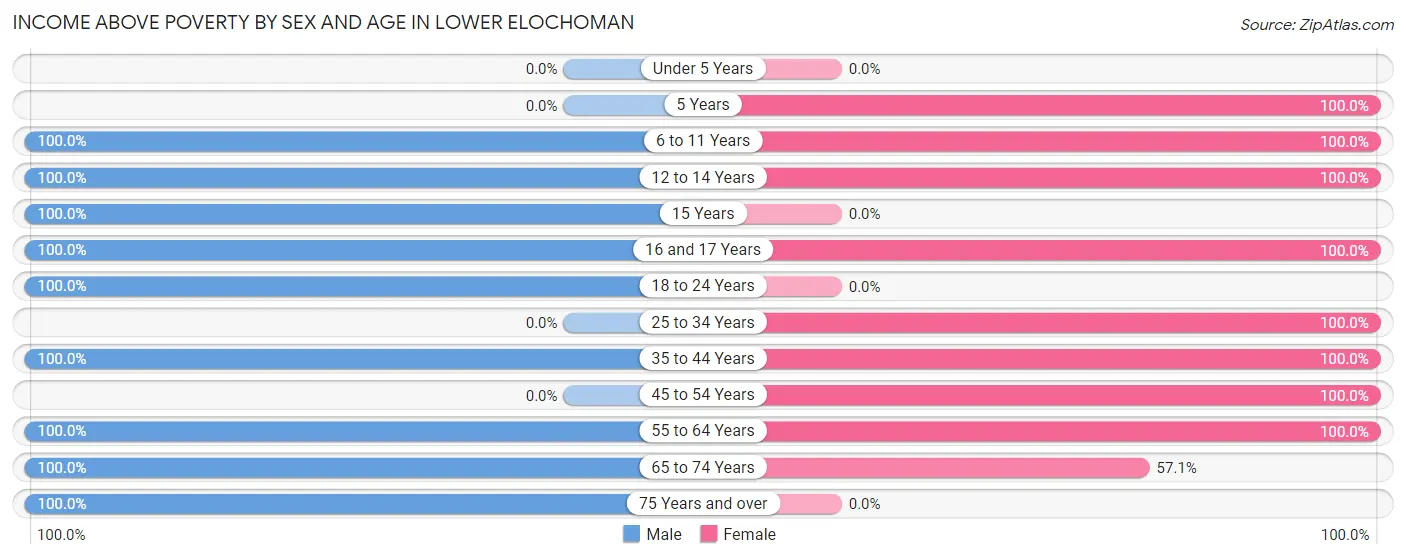
| Age Bracket | Male | Female |
| Under 5 Years | 0 (0.0%) | 0 (0.0%) |
| 5 Years | 0 (0.0%) | 7 (100.0%) |
| 6 to 11 Years | 57 (100.0%) | 7 (100.0%) |
| 12 to 14 Years | 7 (100.0%) | 6 (100.0%) |
| 15 Years | 61 (100.0%) | 0 (0.0%) |
| 16 and 17 Years | 6 (100.0%) | 8 (100.0%) |
| 18 to 24 Years | 48 (100.0%) | 0 (0.0%) |
| 25 to 34 Years | 0 (0.0%) | 8 (100.0%) |
| 35 to 44 Years | 87 (100.0%) | 53 (100.0%) |
| 45 to 54 Years | 0 (0.0%) | 11 (100.0%) |
| 55 to 64 Years | 9 (100.0%) | 8 (100.0%) |
| 65 to 74 Years | 29 (100.0%) | 16 (57.1%) |
| 75 Years and over | 5 (100.0%) | 0 (0.0%) |
| Total | 309 (100.0%) | 124 (91.2%) |
Income Below Poverty Among Married-Couple Families in Lower Elochoman
| Children | Above Poverty | Below Poverty |
| No Children | 23 (100.0%) | 0 (0.0%) |
| 1 or 2 Children | 30 (100.0%) | 0 (0.0%) |
| 3 or 4 Children | 38 (100.0%) | 0 (0.0%) |
| 5 or more Children | 0 (0.0%) | 0 (0.0%) |
| Total | 91 (100.0%) | 0 (0.0%) |
Income Below Poverty Among Single-Parent Households in Lower Elochoman
| Children | Single Father | Single Mother |
| No Children | 0 (0.0%) | 0 (0.0%) |
| 1 or 2 Children | 0 (0.0%) | 0 (0.0%) |
| 3 or 4 Children | 0 (0.0%) | 0 (0.0%) |
| 5 or more Children | 0 (0.0%) | 0 (0.0%) |
| Total | 0 (0.0%) | 0 (0.0%) |
Income Below Poverty Among Married-Couple vs Single-Parent Households in Lower Elochoman
| Children | Married-Couple Families | Single-Parent Households |
| No Children | 0 (0.0%) | 0 (0.0%) |
| 1 or 2 Children | 0 (0.0%) | 0 (0.0%) |
| 3 or 4 Children | 0 (0.0%) | 0 (0.0%) |
| 5 or more Children | 0 (0.0%) | 0 (0.0%) |
| Total | 0 (0.0%) | 0 (0.0%) |
Employment Characteristics in Lower Elochoman
Employment by Class of Employer in Lower Elochoman
Among the 241 employed individuals in Lower Elochoman, private company employees (129 | 53.5%), local government employees (41 | 17.0%), and state government employees (35 | 14.5%) make up the most common classes of employment.
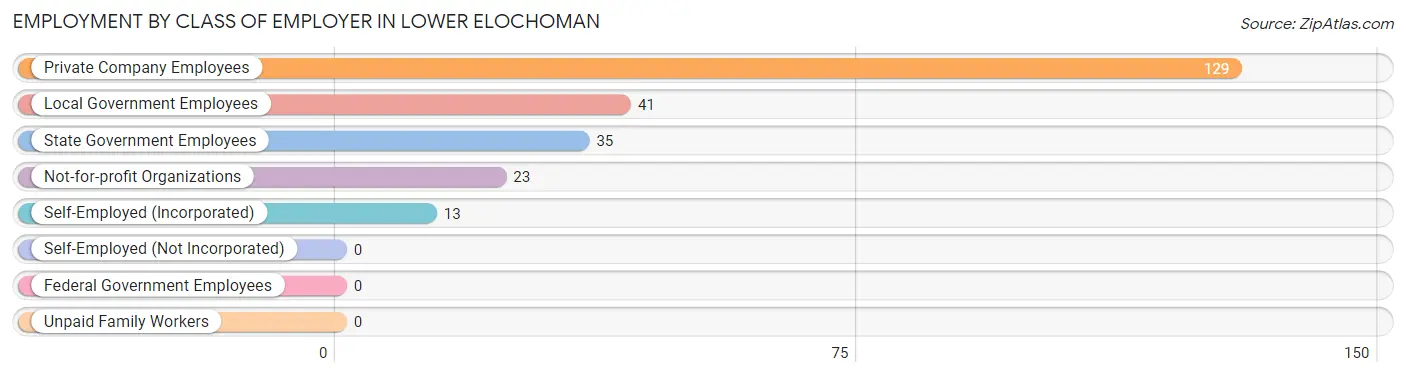
| Employer Class | # Employees | % Employees |
| Private Company Employees | 129 | 53.5% |
| Self-Employed (Incorporated) | 13 | 5.4% |
| Self-Employed (Not Incorporated) | 0 | 0.0% |
| Not-for-profit Organizations | 23 | 9.5% |
| Local Government Employees | 41 | 17.0% |
| State Government Employees | 35 | 14.5% |
| Federal Government Employees | 0 | 0.0% |
| Unpaid Family Workers | 0 | 0.0% |
| Total | 241 | 100.0% |
Employment Status by Age in Lower Elochoman
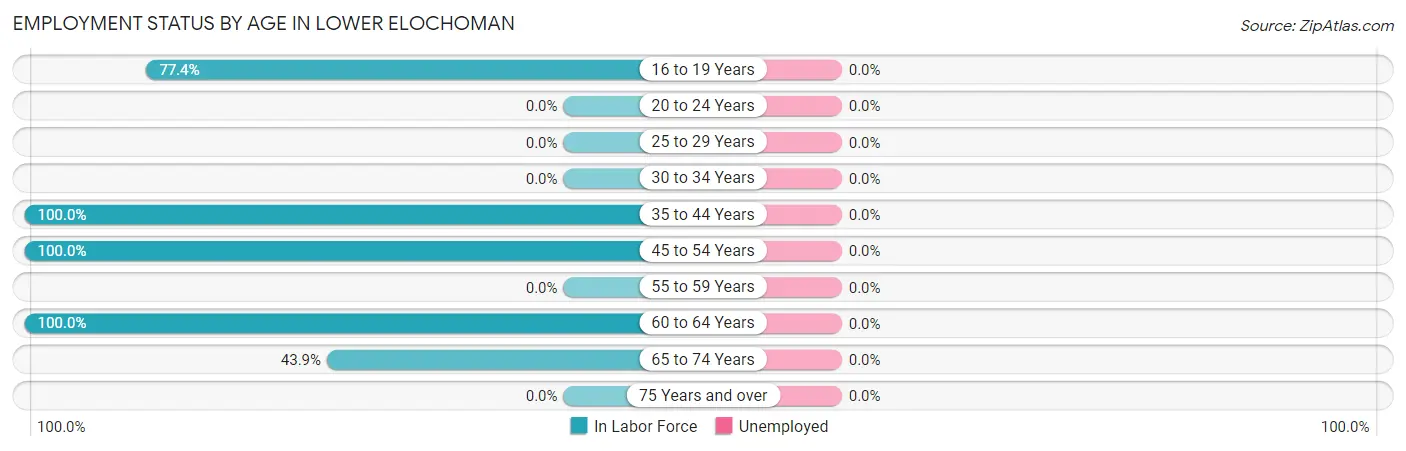
| Age Bracket | In Labor Force | Unemployed |
| 16 to 19 Years | 48 (77.4%) | 0 (0.0%) |
| 20 to 24 Years | 0 (0.0%) | 0 (0.0%) |
| 25 to 29 Years | 0 (0.0%) | 0 (0.0%) |
| 30 to 34 Years | 0 (0.0%) | 0 (0.0%) |
| 35 to 44 Years | 140 (100.0%) | 0 (0.0%) |
| 45 to 54 Years | 11 (100.0%) | 0 (0.0%) |
| 55 to 59 Years | 0 (0.0%) | 0 (0.0%) |
| 60 to 64 Years | 17 (100.0%) | 0 (0.0%) |
| 65 to 74 Years | 25 (43.9%) | 0 (0.0%) |
| 75 Years and over | 0 (0.0%) | 0 (0.0%) |
| Total | 241 (80.3%) | 0 (0.0%) |
Employment Status by Educational Attainment in Lower Elochoman
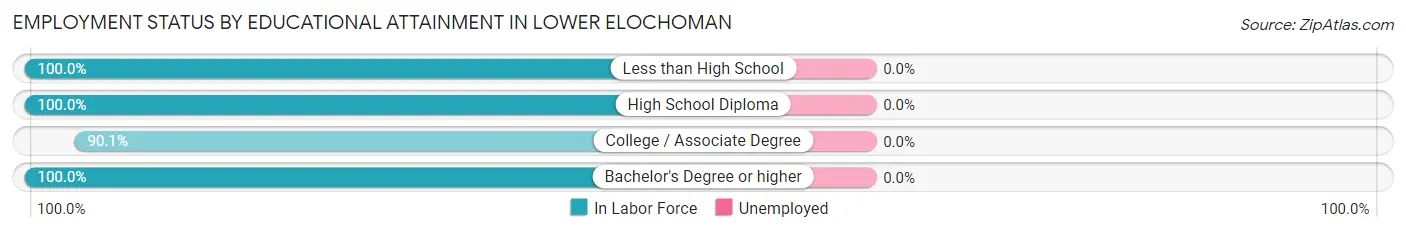
| Educational Attainment | In Labor Force | Unemployed |
| Less than High School | 40 (100.0%) | 0 (0.0%) |
| High School Diploma | 46 (100.0%) | 0 (0.0%) |
| College / Associate Degree | 73 (90.1%) | 0 (0.0%) |
| Bachelor's Degree or higher | 9 (100.0%) | 0 (0.0%) |
| Total | 168 (95.5%) | 0 (0.0%) |
Employment Occupations by Sex in Lower Elochoman
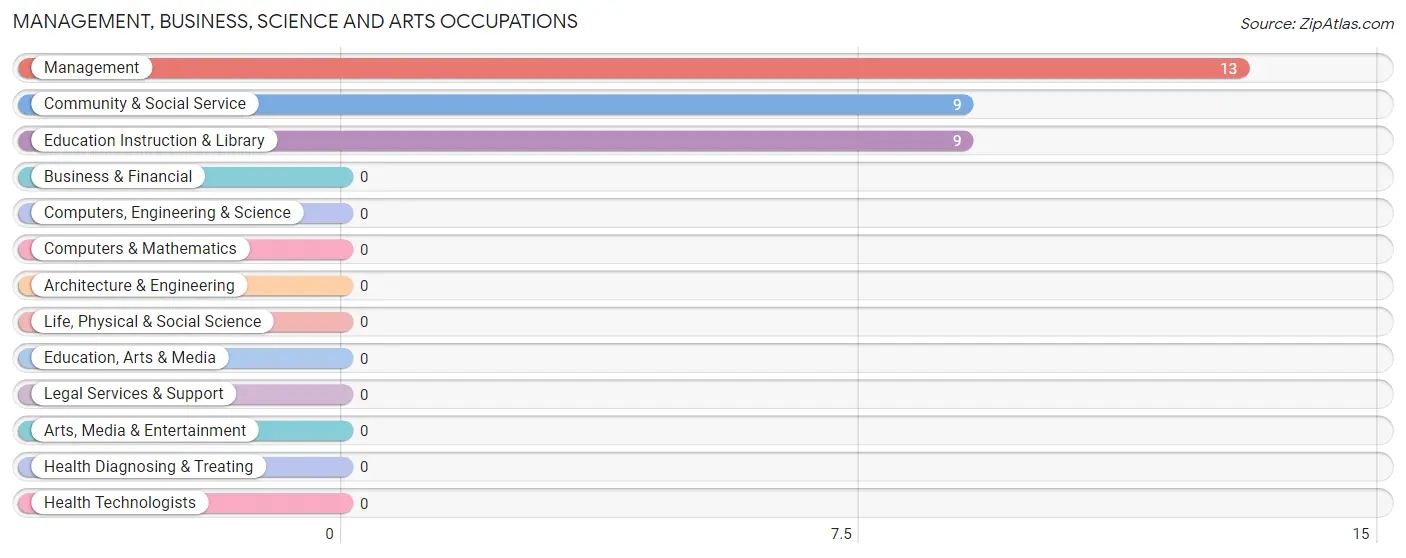
Management, Business, Science and Arts Occupations
The most common Management, Business, Science and Arts occupations in Lower Elochoman are Management (13 | 5.4%), Community & Social Service (9 | 3.7%), and Education Instruction & Library (9 | 3.7%).
Management, Business, Science and Arts Occupations by Sex
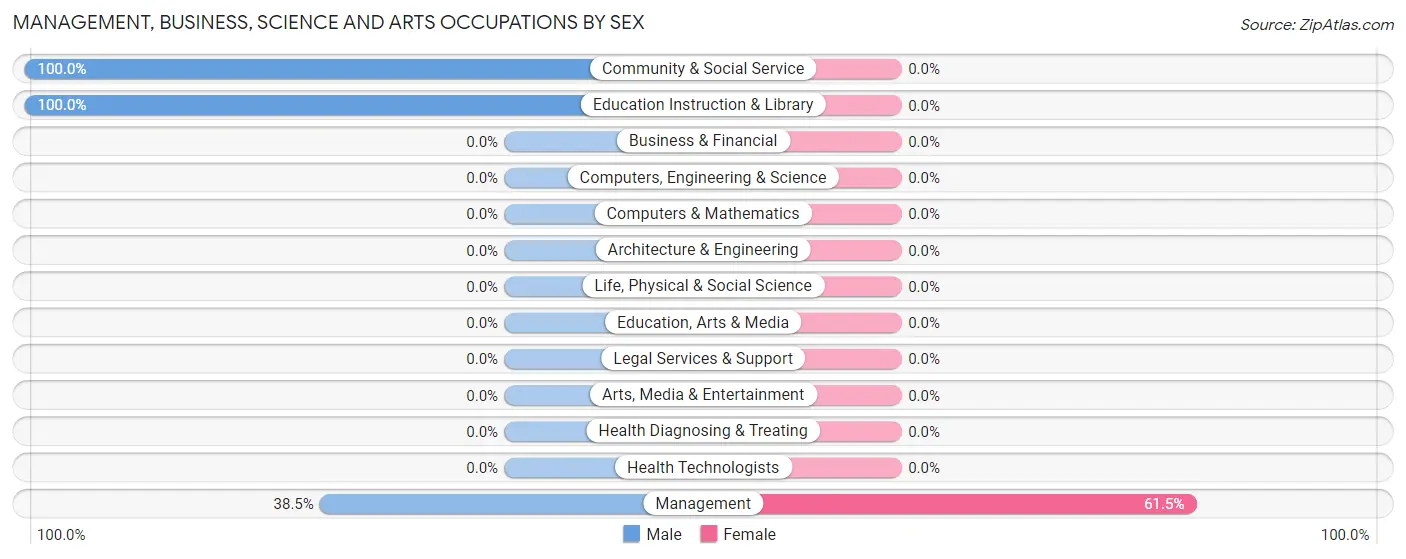
| Occupation | Male | Female |
| Management | 5 (38.5%) | 8 (61.5%) |
| Business & Financial | 0 (0.0%) | 0 (0.0%) |
| Computers, Engineering & Science | 0 (0.0%) | 0 (0.0%) |
| Computers & Mathematics | 0 (0.0%) | 0 (0.0%) |
| Architecture & Engineering | 0 (0.0%) | 0 (0.0%) |
| Life, Physical & Social Science | 0 (0.0%) | 0 (0.0%) |
| Community & Social Service | 9 (100.0%) | 0 (0.0%) |
| Education, Arts & Media | 0 (0.0%) | 0 (0.0%) |
| Legal Services & Support | 0 (0.0%) | 0 (0.0%) |
| Education Instruction & Library | 9 (100.0%) | 0 (0.0%) |
| Arts, Media & Entertainment | 0 (0.0%) | 0 (0.0%) |
| Health Diagnosing & Treating | 0 (0.0%) | 0 (0.0%) |
| Health Technologists | 0 (0.0%) | 0 (0.0%) |
| Total (Category) | 14 (63.6%) | 8 (36.4%) |
| Total (Overall) | 149 (61.8%) | 92 (38.2%) |
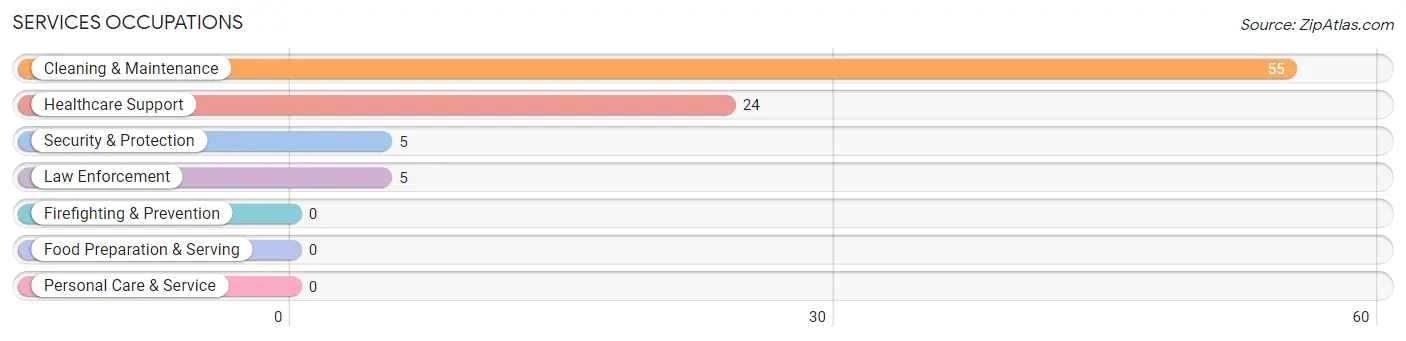
Services Occupations
The most common Services occupations in Lower Elochoman are Cleaning & Maintenance (55 | 22.8%), Healthcare Support (24 | 10.0%), Security & Protection (5 | 2.1%), and Law Enforcement (5 | 2.1%).
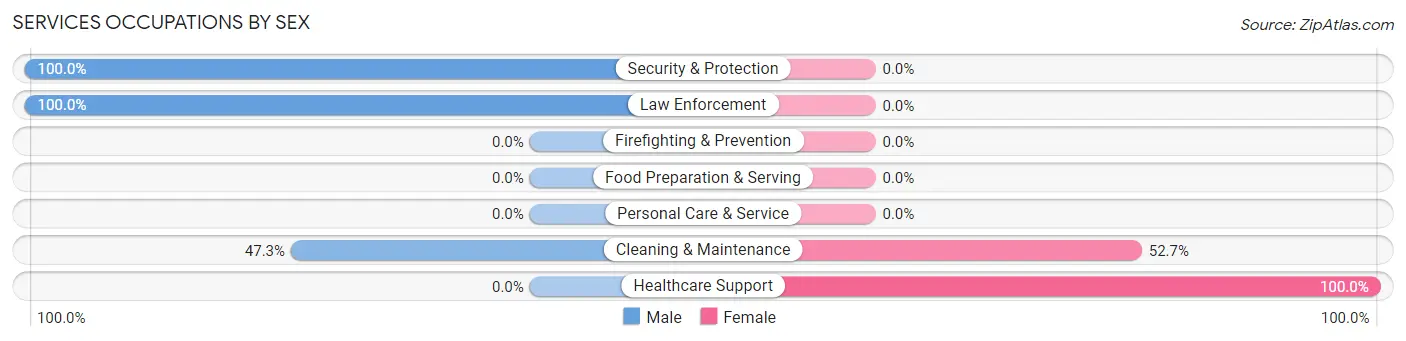
Services Occupations by Sex
Within the Services occupations in Lower Elochoman, the most male-oriented occupations are Security & Protection (100.0%), Law Enforcement (100.0%), and Cleaning & Maintenance (47.3%), while the most female-oriented occupations are Healthcare Support (100.0%), and Cleaning & Maintenance (52.7%).
| Occupation | Male | Female |
| Healthcare Support | 0 (0.0%) | 24 (100.0%) |
| Security & Protection | 5 (100.0%) | 0 (0.0%) |
| Firefighting & Prevention | 0 (0.0%) | 0 (0.0%) |
| Law Enforcement | 5 (100.0%) | 0 (0.0%) |
| Food Preparation & Serving | 0 (0.0%) | 0 (0.0%) |
| Cleaning & Maintenance | 26 (47.3%) | 29 (52.7%) |
| Personal Care & Service | 0 (0.0%) | 0 (0.0%) |
| Total (Category) | 31 (36.9%) | 53 (63.1%) |
| Total (Overall) | 149 (61.8%) | 92 (38.2%) |
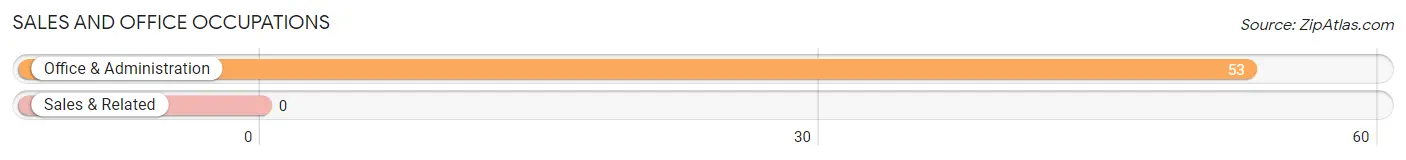
Sales and Office Occupations
The most common Sales and Office occupations in Lower Elochoman are , and Office & Administration (53 | 22.0%).
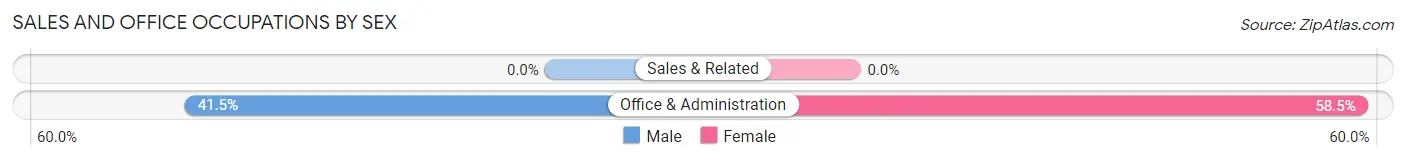
Sales and Office Occupations by Sex
| Occupation | Male | Female |
| Sales & Related | 0 (0.0%) | 0 (0.0%) |
| Office & Administration | 22 (41.5%) | 31 (58.5%) |
| Total (Category) | 22 (41.5%) | 31 (58.5%) |
| Total (Overall) | 149 (61.8%) | 92 (38.2%) |
Natural Resources, Construction and Maintenance Occupations
The most common Natural Resources, Construction and Maintenance occupations in Lower Elochoman are Farming, Fishing & Forestry (36 | 14.9%), and Construction & Extraction (36 | 14.9%).
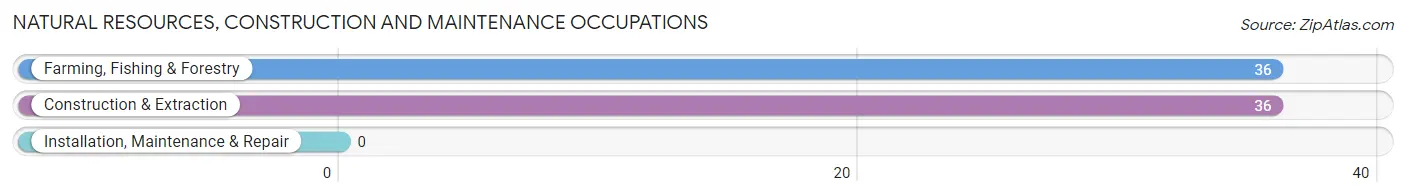
Natural Resources, Construction and Maintenance Occupations by Sex
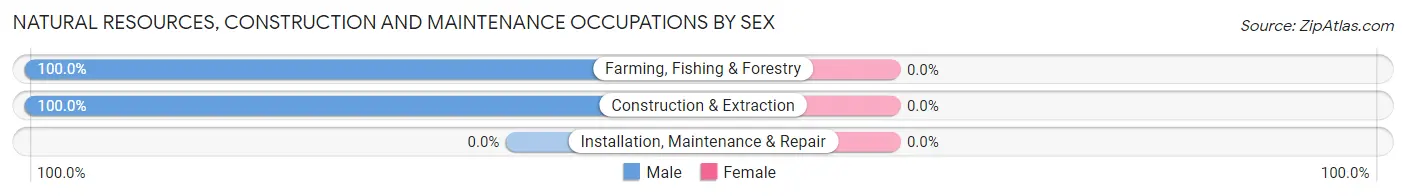
| Occupation | Male | Female |
| Farming, Fishing & Forestry | 36 (100.0%) | 0 (0.0%) |
| Construction & Extraction | 36 (100.0%) | 0 (0.0%) |
| Installation, Maintenance & Repair | 0 (0.0%) | 0 (0.0%) |
| Total (Category) | 72 (100.0%) | 0 (0.0%) |
| Total (Overall) | 149 (61.8%) | 92 (38.2%) |
Production, Transportation and Moving Occupations
The most common Production, Transportation and Moving occupations in Lower Elochoman are , and Production (10 | 4.2%).
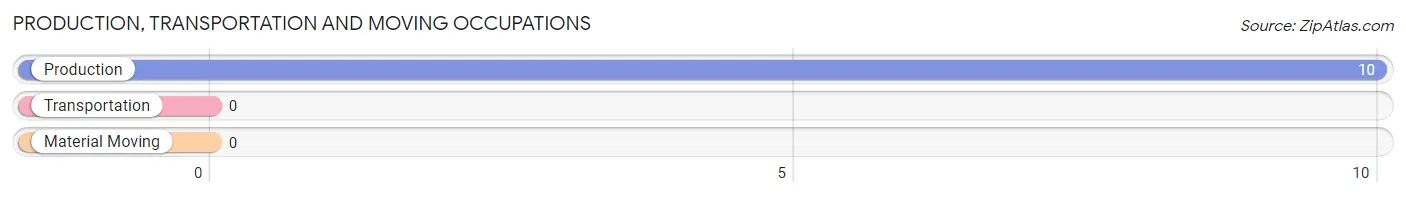
Production, Transportation and Moving Occupations by Sex
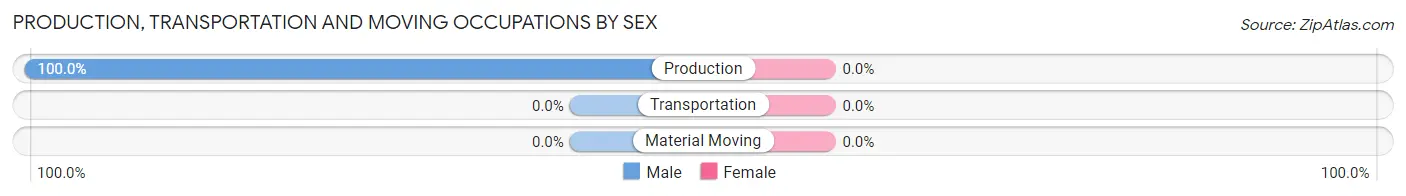
| Occupation | Male | Female |
| Production | 10 (100.0%) | 0 (0.0%) |
| Transportation | 0 (0.0%) | 0 (0.0%) |
| Material Moving | 0 (0.0%) | 0 (0.0%) |
| Total (Category) | 10 (100.0%) | 0 (0.0%) |
| Total (Overall) | 149 (61.8%) | 92 (38.2%) |
Employment Industries by Sex in Lower Elochoman
Employment Industries in Lower Elochoman
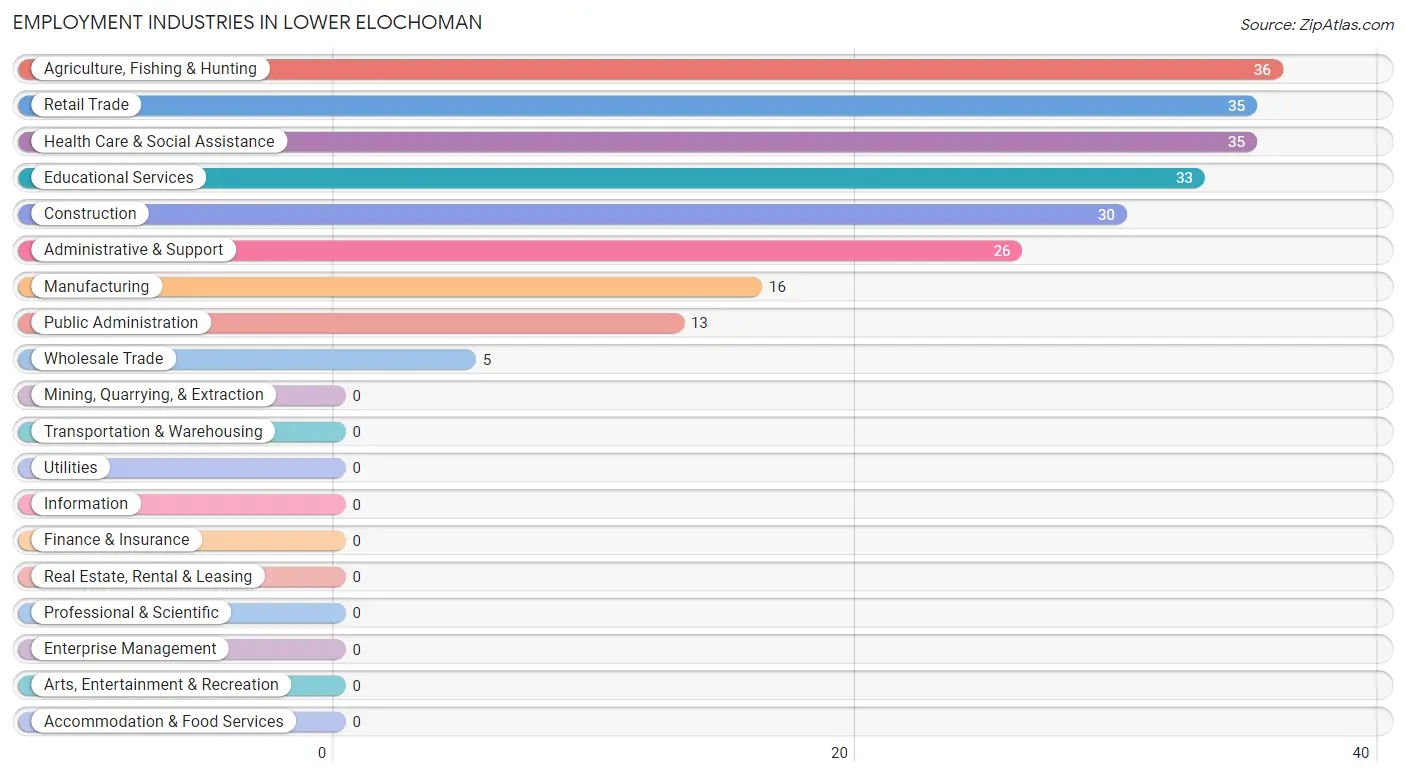
The major employment industries in Lower Elochoman include Agriculture, Fishing & Hunting (36 | 14.9%), Retail Trade (35 | 14.5%), Health Care & Social Assistance (35 | 14.5%), Educational Services (33 | 13.7%), and Construction (30 | 12.4%).
Employment Industries by Sex in Lower Elochoman
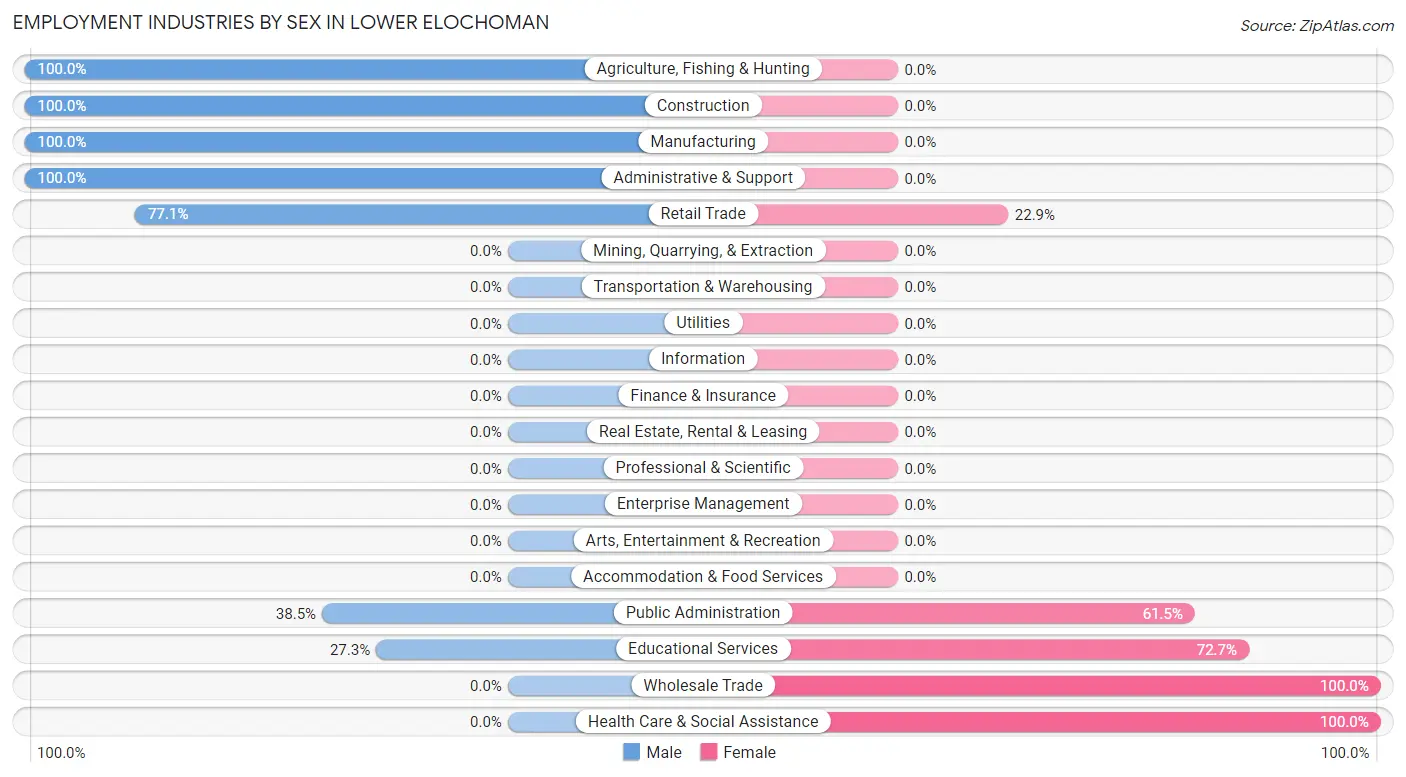
The Lower Elochoman industries that see more men than women are Agriculture, Fishing & Hunting (100.0%), Construction (100.0%), and Manufacturing (100.0%), whereas the industries that tend to have a higher number of women are Wholesale Trade (100.0%), Health Care & Social Assistance (100.0%), and Educational Services (72.7%).
| Industry | Male | Female |
| Agriculture, Fishing & Hunting | 36 (100.0%) | 0 (0.0%) |
| Mining, Quarrying, & Extraction | 0 (0.0%) | 0 (0.0%) |
| Construction | 30 (100.0%) | 0 (0.0%) |
| Manufacturing | 16 (100.0%) | 0 (0.0%) |
| Wholesale Trade | 0 (0.0%) | 5 (100.0%) |
| Retail Trade | 27 (77.1%) | 8 (22.9%) |
| Transportation & Warehousing | 0 (0.0%) | 0 (0.0%) |
| Utilities | 0 (0.0%) | 0 (0.0%) |
| Information | 0 (0.0%) | 0 (0.0%) |
| Finance & Insurance | 0 (0.0%) | 0 (0.0%) |
| Real Estate, Rental & Leasing | 0 (0.0%) | 0 (0.0%) |
| Professional & Scientific | 0 (0.0%) | 0 (0.0%) |
| Enterprise Management | 0 (0.0%) | 0 (0.0%) |
| Administrative & Support | 26 (100.0%) | 0 (0.0%) |
| Educational Services | 9 (27.3%) | 24 (72.7%) |
| Health Care & Social Assistance | 0 (0.0%) | 35 (100.0%) |
| Arts, Entertainment & Recreation | 0 (0.0%) | 0 (0.0%) |
| Accommodation & Food Services | 0 (0.0%) | 0 (0.0%) |
| Public Administration | 5 (38.5%) | 8 (61.5%) |
| Total | 149 (61.8%) | 92 (38.2%) |
Education in Lower Elochoman
School Enrollment in Lower Elochoman
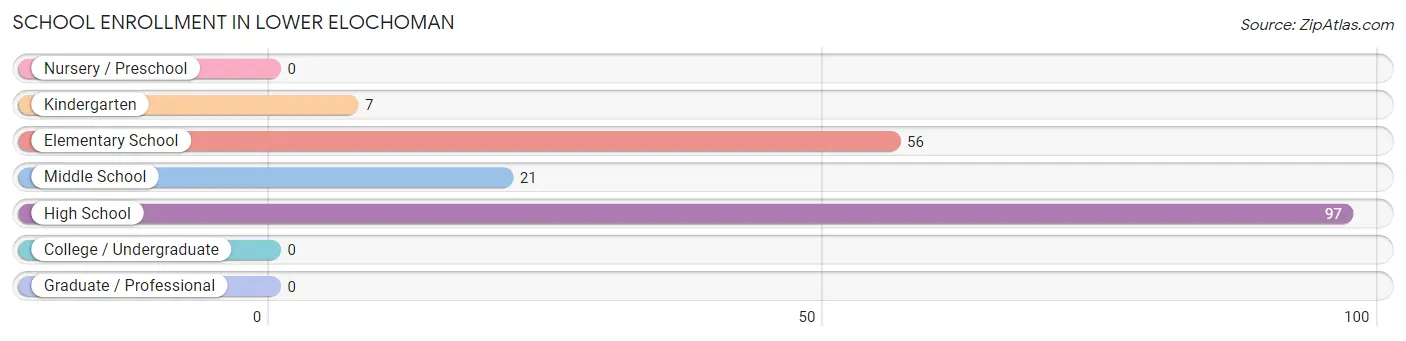
The most common levels of schooling among the 181 students in Lower Elochoman are high school (97 | 53.6%), elementary school (56 | 30.9%), and middle school (21 | 11.6%).
| School Level | # Students | % Students |
| Nursery / Preschool | 0 | 0.0% |
| Kindergarten | 7 | 3.9% |
| Elementary School | 56 | 30.9% |
| Middle School | 21 | 11.6% |
| High School | 97 | 53.6% |
| College / Undergraduate | 0 | 0.0% |
| Graduate / Professional | 0 | 0.0% |
| Total | 181 | 100.0% |
School Enrollment by Age by Funding Source in Lower Elochoman
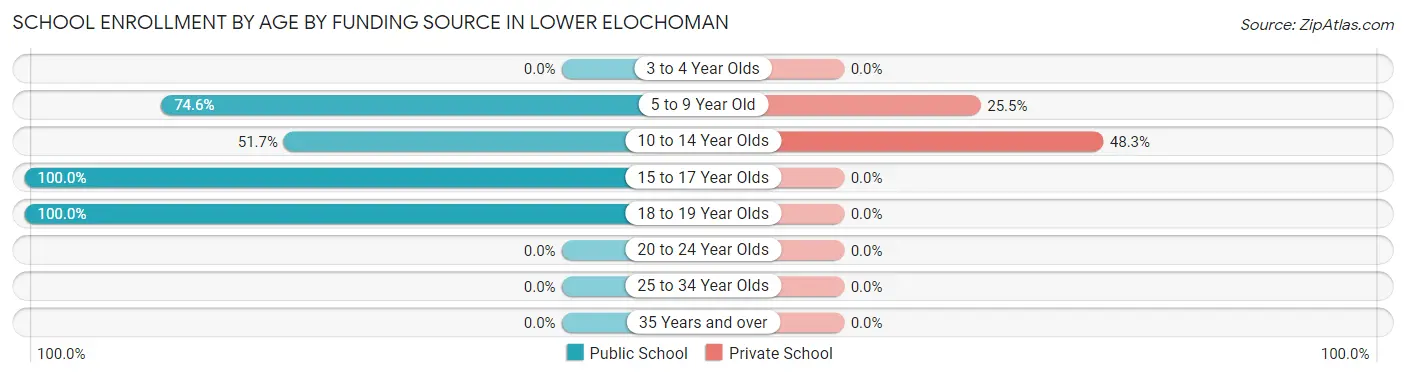
Out of a total of 181 students who are enrolled in schools in Lower Elochoman, 28 (15.5%) attend a private institution, while the remaining 153 (84.5%) are enrolled in public schools. The age group of 10 to 14 year olds has the highest likelihood of being enrolled in private schools, with 14 (48.3% in the age bracket) enrolled. Conversely, the age group of 15 to 17 year olds has the lowest likelihood of being enrolled in a private school, with 75 (100.0% in the age bracket) attending a public institution.
| Age Bracket | Public School | Private School |
| 3 to 4 Year Olds | 0 (0.0%) | 0 (0.0%) |
| 5 to 9 Year Old | 41 (74.6%) | 14 (25.5%) |
| 10 to 14 Year Olds | 15 (51.7%) | 14 (48.3%) |
| 15 to 17 Year Olds | 75 (100.0%) | 0 (0.0%) |
| 18 to 19 Year Olds | 22 (100.0%) | 0 (0.0%) |
| 20 to 24 Year Olds | 0 (0.0%) | 0 (0.0%) |
| 25 to 34 Year Olds | 0 (0.0%) | 0 (0.0%) |
| 35 Years and over | 0 (0.0%) | 0 (0.0%) |
| Total | 153 (84.5%) | 28 (15.5%) |
Educational Attainment by Field of Study in Lower Elochoman
, and bio, nature & agricultural (9 | 100.0%) are the most common fields of study among 9 individuals in Lower Elochoman who have obtained a bachelor's degree or higher.
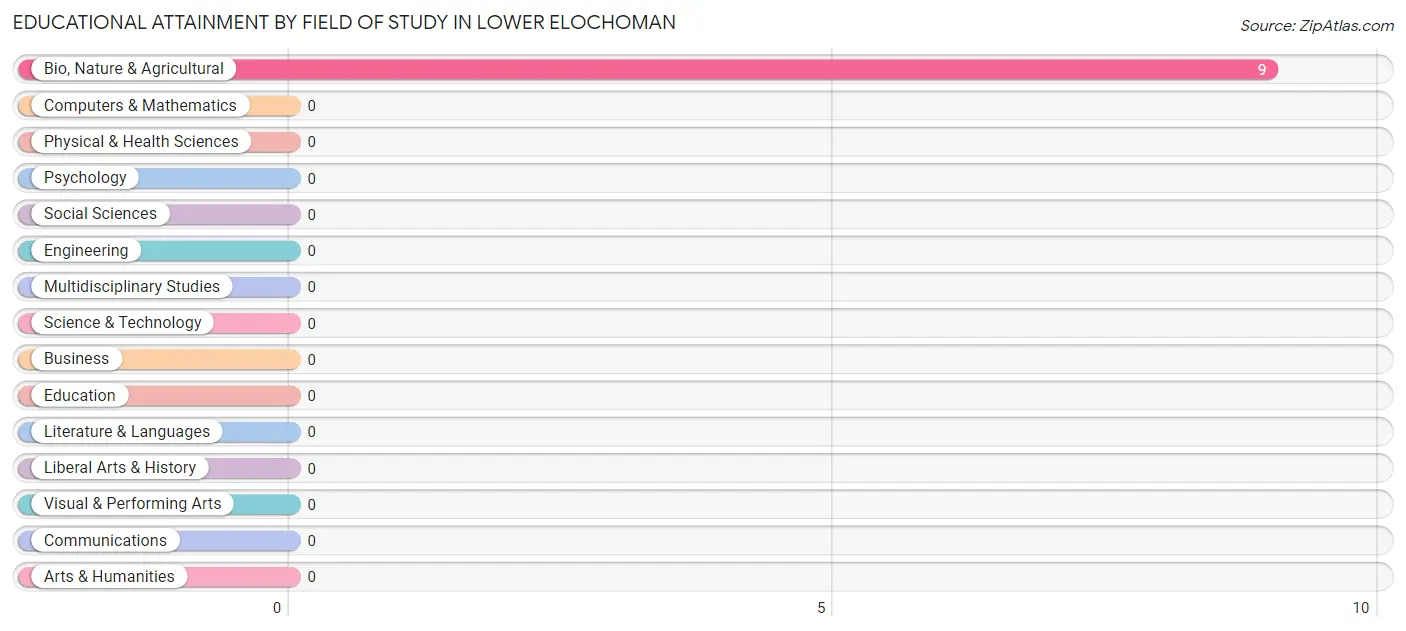
| Field of Study | # Graduates | % Graduates |
| Computers & Mathematics | 0 | 0.0% |
| Bio, Nature & Agricultural | 9 | 100.0% |
| Physical & Health Sciences | 0 | 0.0% |
| Psychology | 0 | 0.0% |
| Social Sciences | 0 | 0.0% |
| Engineering | 0 | 0.0% |
| Multidisciplinary Studies | 0 | 0.0% |
| Science & Technology | 0 | 0.0% |
| Business | 0 | 0.0% |
| Education | 0 | 0.0% |
| Literature & Languages | 0 | 0.0% |
| Liberal Arts & History | 0 | 0.0% |
| Visual & Performing Arts | 0 | 0.0% |
| Communications | 0 | 0.0% |
| Arts & Humanities | 0 | 0.0% |
| Total | 9 | 100.0% |
Transportation & Commute in Lower Elochoman
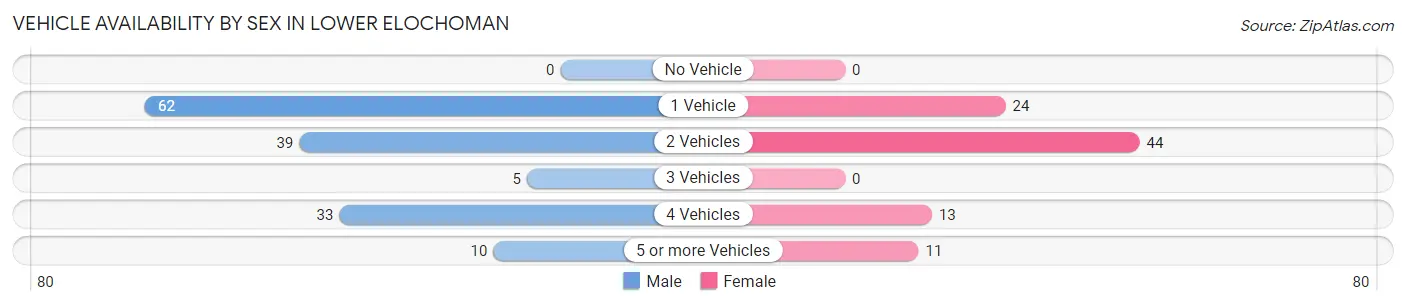
Vehicle Availability by Sex in Lower Elochoman
The most prevalent vehicle ownership categories in Lower Elochoman are males with 1 vehicle (62, accounting for 41.6%) and females with 1 vehicle (24, making up 67.4%).
| Vehicles Available | Male | Female |
| No Vehicle | 0 (0.0%) | 0 (0.0%) |
| 1 Vehicle | 62 (41.6%) | 24 (26.1%) |
| 2 Vehicles | 39 (26.2%) | 44 (47.8%) |
| 3 Vehicles | 5 (3.4%) | 0 (0.0%) |
| 4 Vehicles | 33 (22.2%) | 13 (14.1%) |
| 5 or more Vehicles | 10 (6.7%) | 11 (12.0%) |
| Total | 149 (100.0%) | 92 (100.0%) |
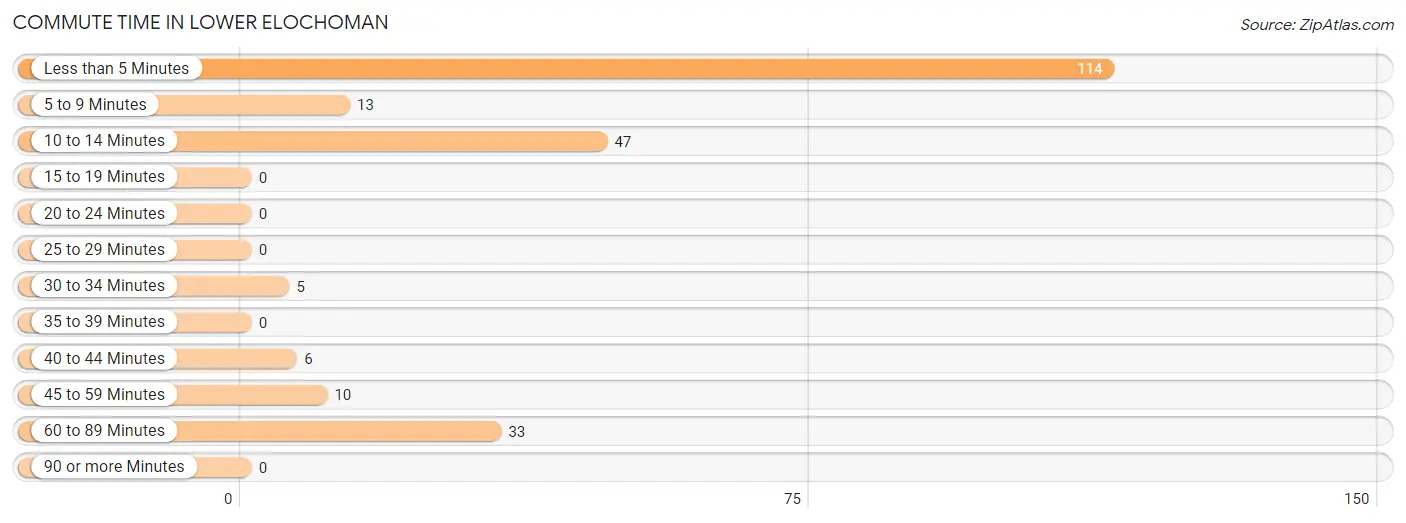
Commute Time in Lower Elochoman
The most frequently occuring commute durations in Lower Elochoman are less than 5 minutes (114 commuters, 50.0%), 10 to 14 minutes (47 commuters, 20.6%), and 60 to 89 minutes (33 commuters, 14.5%).
| Commute Time | # Commuters | % Commuters |
| Less than 5 Minutes | 114 | 50.0% |
| 5 to 9 Minutes | 13 | 5.7% |
| 10 to 14 Minutes | 47 | 20.6% |
| 15 to 19 Minutes | 0 | 0.0% |
| 20 to 24 Minutes | 0 | 0.0% |
| 25 to 29 Minutes | 0 | 0.0% |
| 30 to 34 Minutes | 5 | 2.2% |
| 35 to 39 Minutes | 0 | 0.0% |
| 40 to 44 Minutes | 6 | 2.6% |
| 45 to 59 Minutes | 10 | 4.4% |
| 60 to 89 Minutes | 33 | 14.5% |
| 90 or more Minutes | 0 | 0.0% |
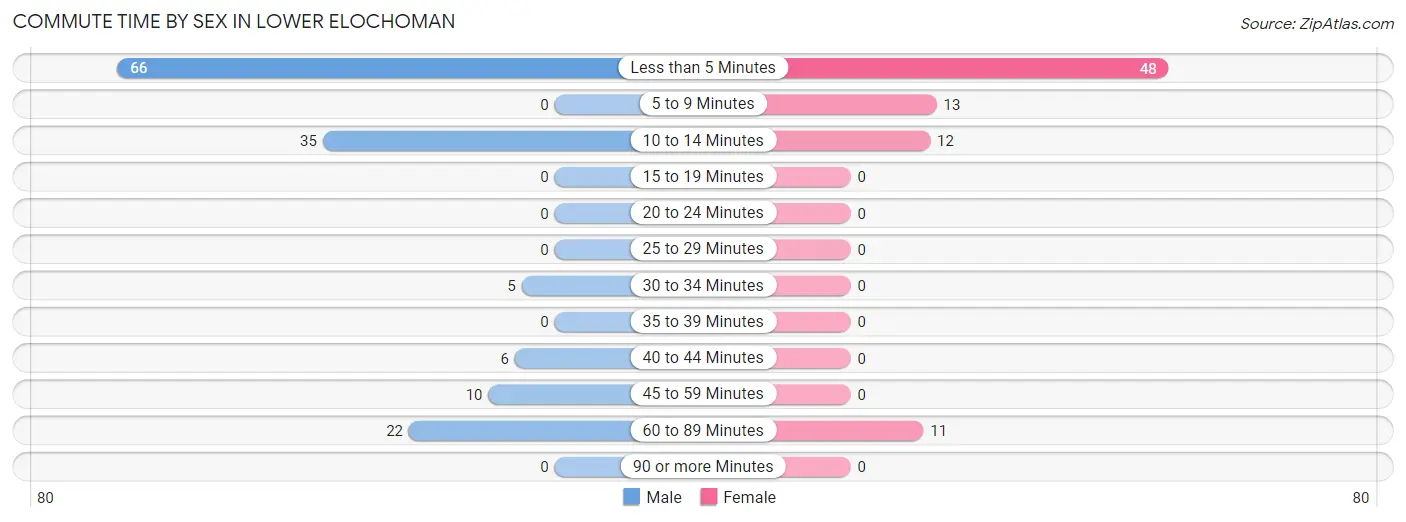
Commute Time by Sex in Lower Elochoman
The most common commute times in Lower Elochoman are less than 5 minutes (66 commuters, 45.8%) for males and less than 5 minutes (48 commuters, 57.1%) for females.
| Commute Time | Male | Female |
| Less than 5 Minutes | 66 (45.8%) | 48 (57.1%) |
| 5 to 9 Minutes | 0 (0.0%) | 13 (15.5%) |
| 10 to 14 Minutes | 35 (24.3%) | 12 (14.3%) |
| 15 to 19 Minutes | 0 (0.0%) | 0 (0.0%) |
| 20 to 24 Minutes | 0 (0.0%) | 0 (0.0%) |
| 25 to 29 Minutes | 0 (0.0%) | 0 (0.0%) |
| 30 to 34 Minutes | 5 (3.5%) | 0 (0.0%) |
| 35 to 39 Minutes | 0 (0.0%) | 0 (0.0%) |
| 40 to 44 Minutes | 6 (4.2%) | 0 (0.0%) |
| 45 to 59 Minutes | 10 (6.9%) | 0 (0.0%) |
| 60 to 89 Minutes | 22 (15.3%) | 11 (13.1%) |
| 90 or more Minutes | 0 (0.0%) | 0 (0.0%) |
Time of Departure to Work by Sex in Lower Elochoman
The most frequent times of departure to work in Lower Elochoman are 5:30 AM to 5:59 AM (40, 27.8%) for males and 12:00 PM to 3:59 PM (35, 41.7%) for females.
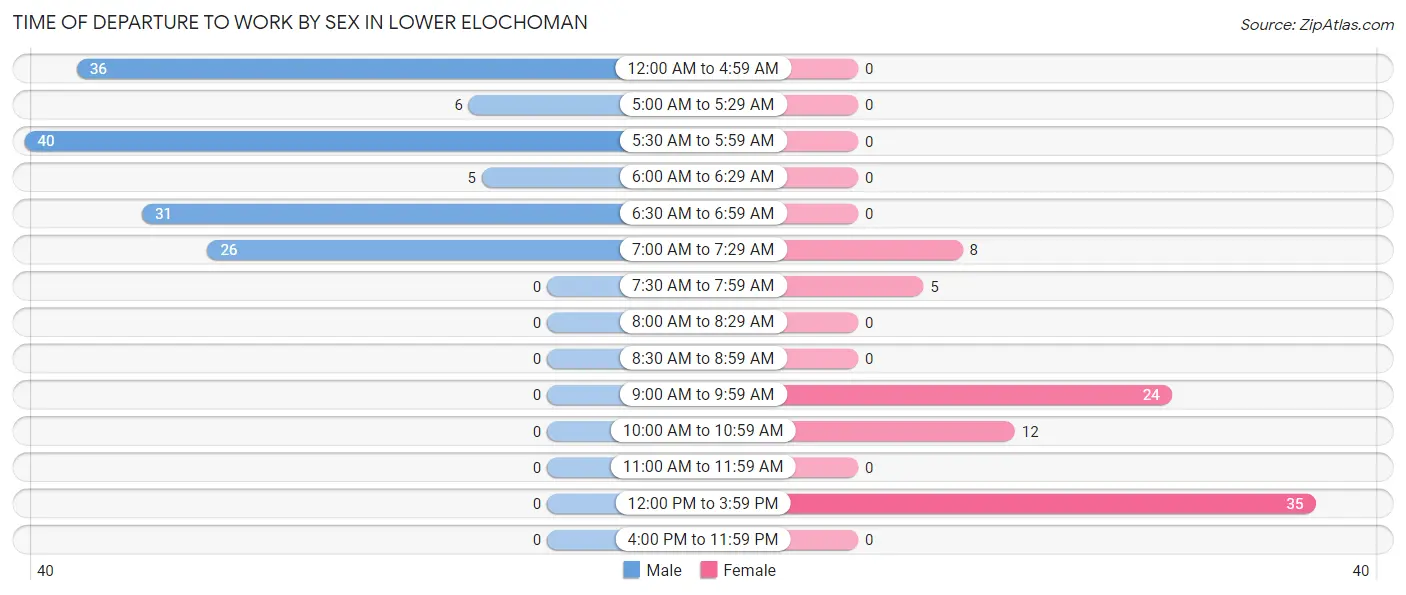
| Time of Departure | Male | Female |
| 12:00 AM to 4:59 AM | 36 (25.0%) | 0 (0.0%) |
| 5:00 AM to 5:29 AM | 6 (4.2%) | 0 (0.0%) |
| 5:30 AM to 5:59 AM | 40 (27.8%) | 0 (0.0%) |
| 6:00 AM to 6:29 AM | 5 (3.5%) | 0 (0.0%) |
| 6:30 AM to 6:59 AM | 31 (21.5%) | 0 (0.0%) |
| 7:00 AM to 7:29 AM | 26 (18.1%) | 8 (9.5%) |
| 7:30 AM to 7:59 AM | 0 (0.0%) | 5 (5.9%) |
| 8:00 AM to 8:29 AM | 0 (0.0%) | 0 (0.0%) |
| 8:30 AM to 8:59 AM | 0 (0.0%) | 0 (0.0%) |
| 9:00 AM to 9:59 AM | 0 (0.0%) | 24 (28.6%) |
| 10:00 AM to 10:59 AM | 0 (0.0%) | 12 (14.3%) |
| 11:00 AM to 11:59 AM | 0 (0.0%) | 0 (0.0%) |
| 12:00 PM to 3:59 PM | 0 (0.0%) | 35 (41.7%) |
| 4:00 PM to 11:59 PM | 0 (0.0%) | 0 (0.0%) |
| Total | 144 (100.0%) | 84 (100.0%) |
Housing Occupancy in Lower Elochoman
Occupancy by Ownership in Lower Elochoman
Of the total 127 dwellings in Lower Elochoman, owner-occupied units account for 127 (100.0%), while renter-occupied units make up 0 (0.0%).
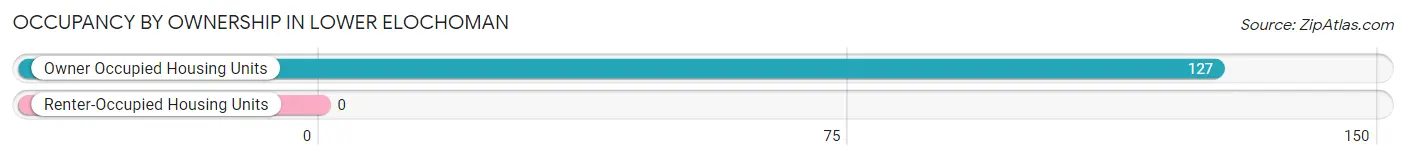
| Occupancy | # Housing Units | % Housing Units |
| Owner Occupied Housing Units | 127 | 100.0% |
| Renter-Occupied Housing Units | 0 | 0.0% |
| Total Occupied Housing Units | 127 | 100.0% |
Occupancy by Household Size in Lower Elochoman
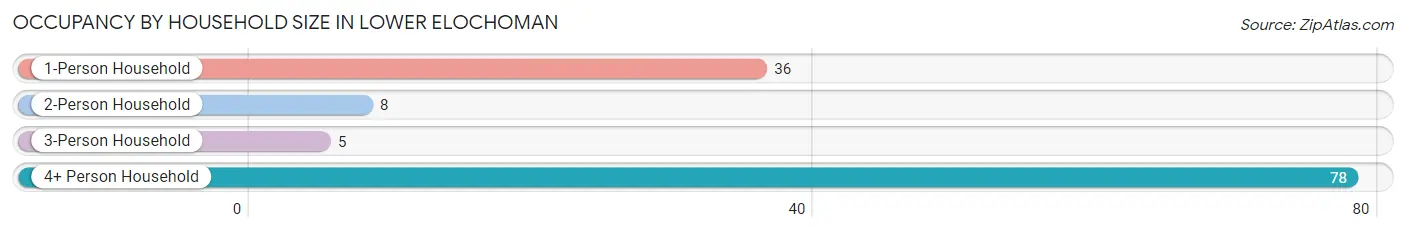
| Household Size | # Housing Units | % Housing Units |
| 1-Person Household | 36 | 28.3% |
| 2-Person Household | 8 | 6.3% |
| 3-Person Household | 5 | 3.9% |
| 4+ Person Household | 78 | 61.4% |
| Total Housing Units | 127 | 100.0% |
Occupancy by Ownership by Household Size in Lower Elochoman
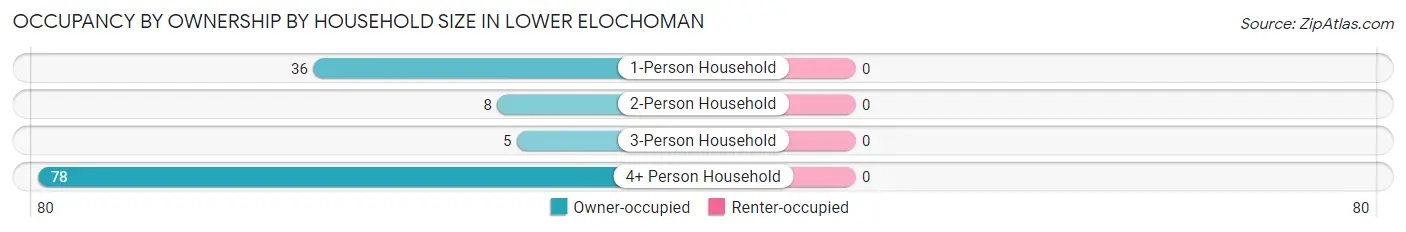
| Household Size | Owner-occupied | Renter-occupied |
| 1-Person Household | 36 (100.0%) | 0 (0.0%) |
| 2-Person Household | 8 (100.0%) | 0 (0.0%) |
| 3-Person Household | 5 (100.0%) | 0 (0.0%) |
| 4+ Person Household | 78 (100.0%) | 0 (0.0%) |
| Total Housing Units | 127 (100.0%) | 0 (0.0%) |
Occupancy by Educational Attainment in Lower Elochoman
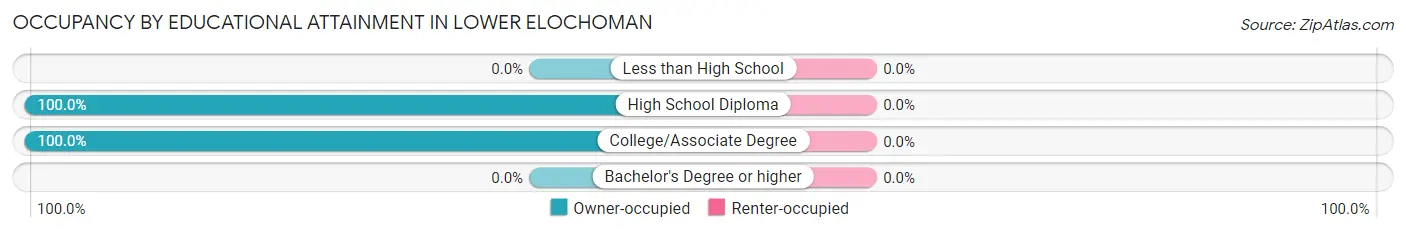
| Household Size | Owner-occupied | Renter-occupied |
| Less than High School | 0 (0.0%) | 0 (0.0%) |
| High School Diploma | 34 (100.0%) | 0 (0.0%) |
| College/Associate Degree | 93 (100.0%) | 0 (0.0%) |
| Bachelor's Degree or higher | 0 (0.0%) | 0 (0.0%) |
Occupancy by Age of Householder in Lower Elochoman
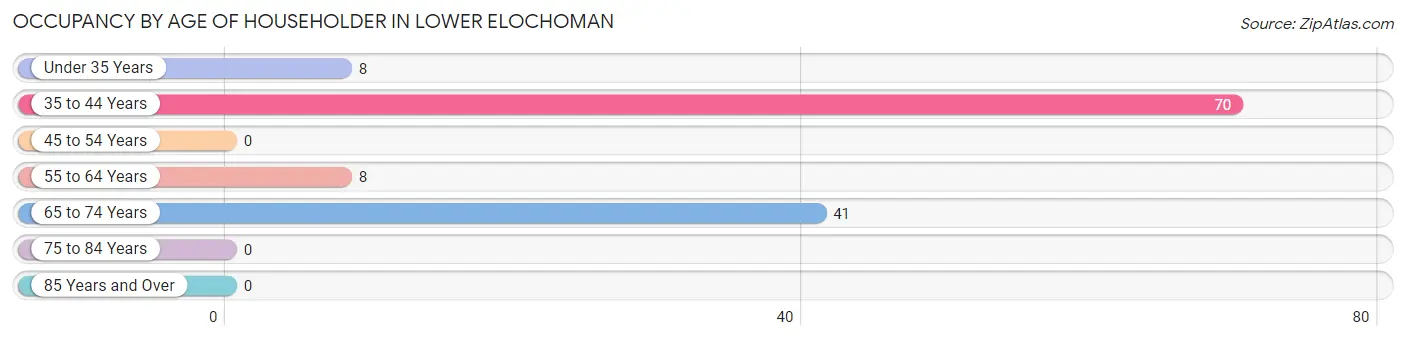
| Age Bracket | # Households | % Households |
| Under 35 Years | 8 | 6.3% |
| 35 to 44 Years | 70 | 55.1% |
| 45 to 54 Years | 0 | 0.0% |
| 55 to 64 Years | 8 | 6.3% |
| 65 to 74 Years | 41 | 32.3% |
| 75 to 84 Years | 0 | 0.0% |
| 85 Years and Over | 0 | 0.0% |
| Total | 127 | 100.0% |
Housing Finances in Lower Elochoman
Median Income by Occupancy in Lower Elochoman
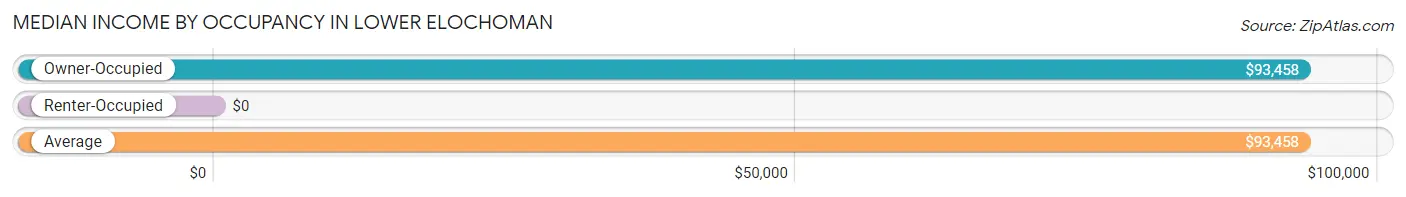
| Occupancy Type | # Households | Median Income |
| Owner-Occupied | 127 (100.0%) | $93,458 |
| Renter-Occupied | 0 (0.0%) | $0 |
| Average | 127 (100.0%) | $93,458 |
Occupancy by Householder Income Bracket in Lower Elochoman
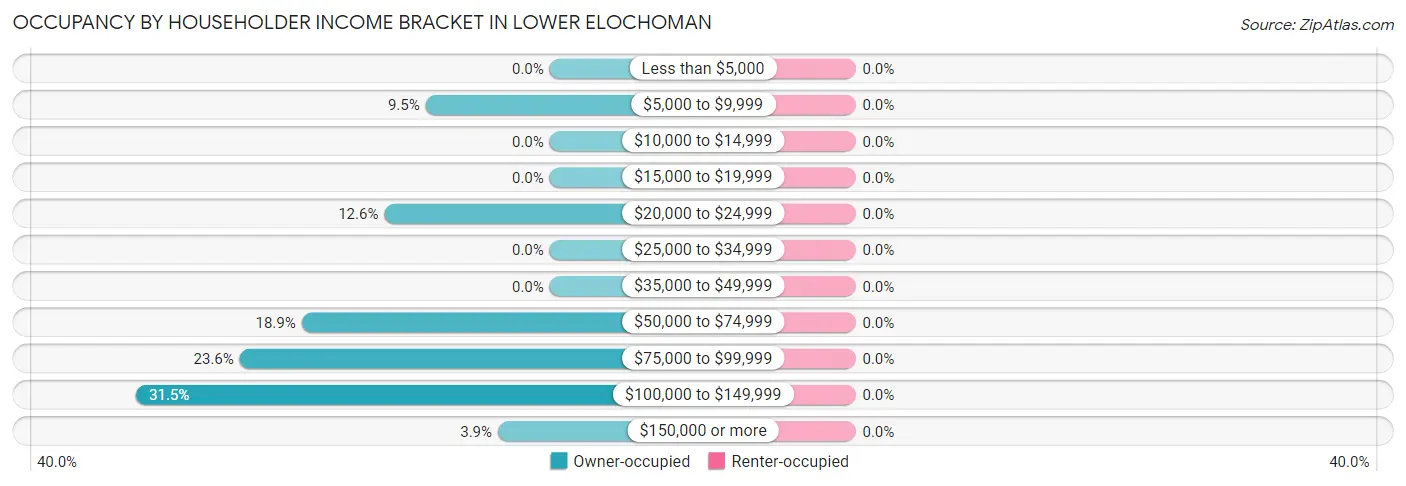
| Income Bracket | Owner-occupied | Renter-occupied |
| Less than $5,000 | 0 (0.0%) | 0 (0.0%) |
| $5,000 to $9,999 | 12 (9.5%) | 0 (0.0%) |
| $10,000 to $14,999 | 0 (0.0%) | 0 (0.0%) |
| $15,000 to $19,999 | 0 (0.0%) | 0 (0.0%) |
| $20,000 to $24,999 | 16 (12.6%) | 0 (0.0%) |
| $25,000 to $34,999 | 0 (0.0%) | 0 (0.0%) |
| $35,000 to $49,999 | 0 (0.0%) | 0 (0.0%) |
| $50,000 to $74,999 | 24 (18.9%) | 0 (0.0%) |
| $75,000 to $99,999 | 30 (23.6%) | 0 (0.0%) |
| $100,000 to $149,999 | 40 (31.5%) | 0 (0.0%) |
| $150,000 or more | 5 (3.9%) | 0 (0.0%) |
| Total | 127 (100.0%) | 0 (0.0%) |
Monthly Housing Cost Tiers in Lower Elochoman
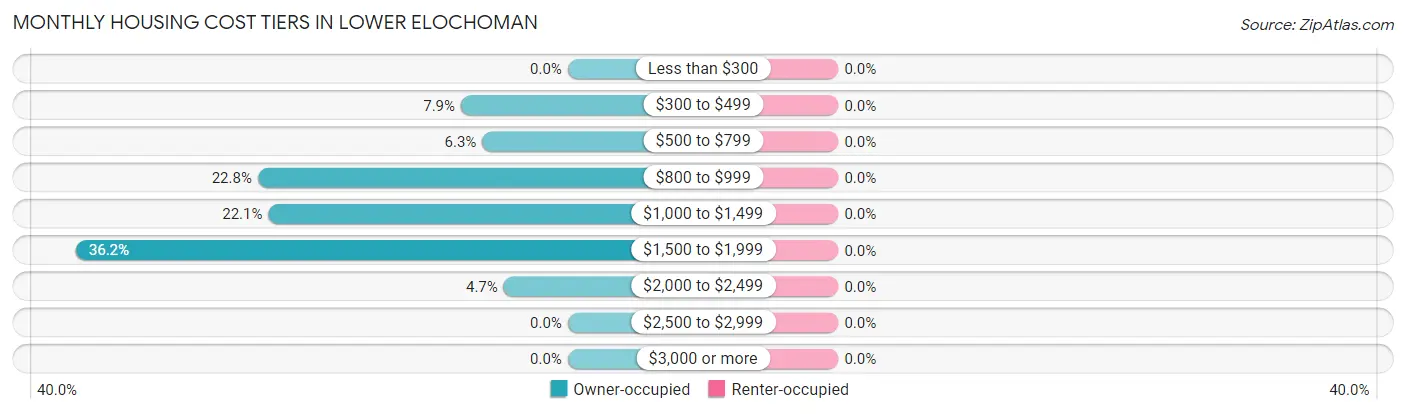
| Monthly Cost | Owner-occupied | Renter-occupied |
| Less than $300 | 0 (0.0%) | 0 (0.0%) |
| $300 to $499 | 10 (7.9%) | 0 (0.0%) |
| $500 to $799 | 8 (6.3%) | 0 (0.0%) |
| $800 to $999 | 29 (22.8%) | 0 (0.0%) |
| $1,000 to $1,499 | 28 (22.1%) | 0 (0.0%) |
| $1,500 to $1,999 | 46 (36.2%) | 0 (0.0%) |
| $2,000 to $2,499 | 6 (4.7%) | 0 (0.0%) |
| $2,500 to $2,999 | 0 (0.0%) | 0 (0.0%) |
| $3,000 or more | 0 (0.0%) | 0 (0.0%) |
| Total | 127 (100.0%) | 0 (0.0%) |
Physical Housing Characteristics in Lower Elochoman
Housing Structures in Lower Elochoman
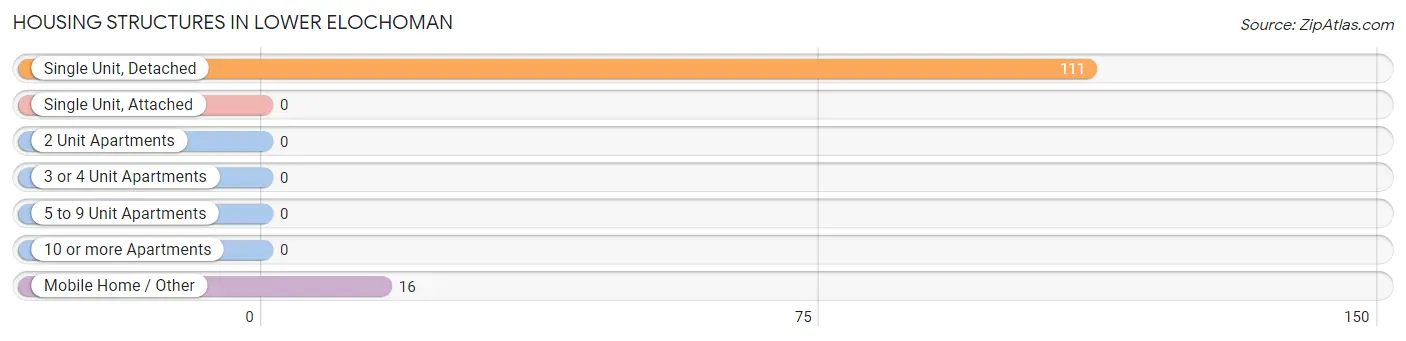
| Structure Type | # Housing Units | % Housing Units |
| Single Unit, Detached | 111 | 87.4% |
| Single Unit, Attached | 0 | 0.0% |
| 2 Unit Apartments | 0 | 0.0% |
| 3 or 4 Unit Apartments | 0 | 0.0% |
| 5 to 9 Unit Apartments | 0 | 0.0% |
| 10 or more Apartments | 0 | 0.0% |
| Mobile Home / Other | 16 | 12.6% |
| Total | 127 | 100.0% |
Housing Structures by Occupancy in Lower Elochoman
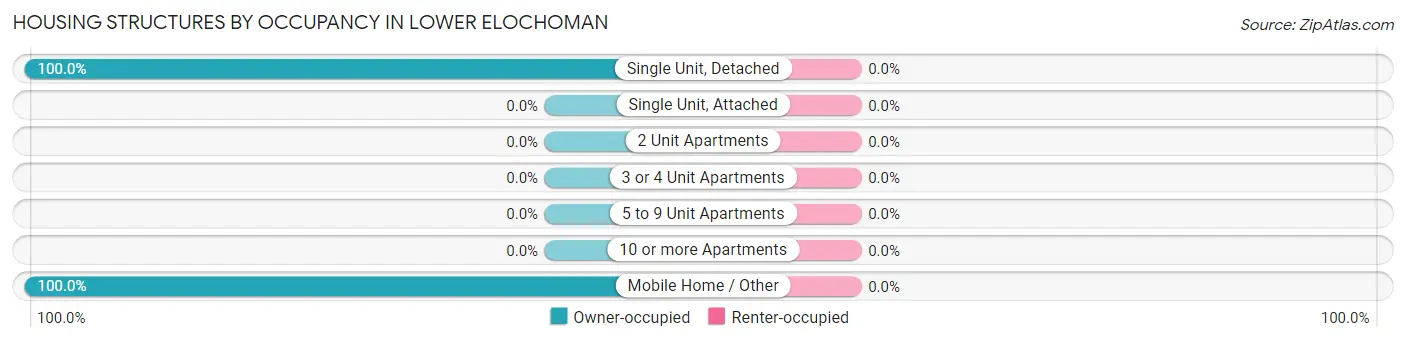
| Structure Type | Owner-occupied | Renter-occupied |
| Single Unit, Detached | 111 (100.0%) | 0 (0.0%) |
| Single Unit, Attached | 0 (0.0%) | 0 (0.0%) |
| 2 Unit Apartments | 0 (0.0%) | 0 (0.0%) |
| 3 or 4 Unit Apartments | 0 (0.0%) | 0 (0.0%) |
| 5 to 9 Unit Apartments | 0 (0.0%) | 0 (0.0%) |
| 10 or more Apartments | 0 (0.0%) | 0 (0.0%) |
| Mobile Home / Other | 16 (100.0%) | 0 (0.0%) |
| Total | 127 (100.0%) | 0 (0.0%) |
Housing Structures by Number of Rooms in Lower Elochoman
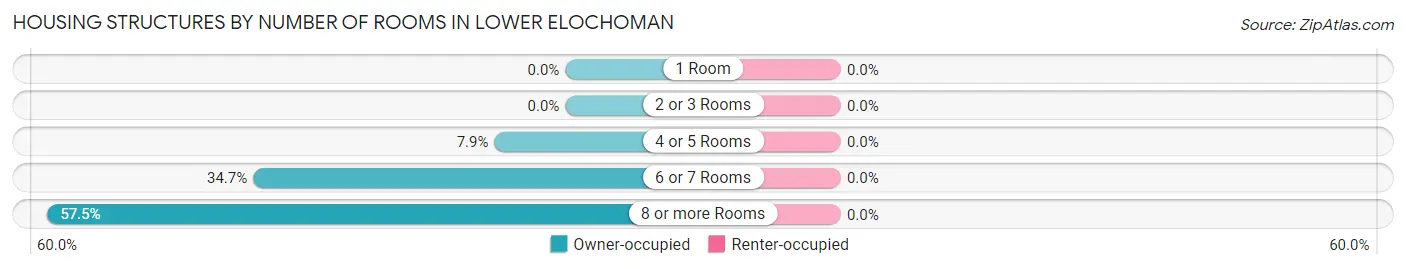
| Number of Rooms | Owner-occupied | Renter-occupied |
| 1 Room | 0 (0.0%) | 0 (0.0%) |
| 2 or 3 Rooms | 0 (0.0%) | 0 (0.0%) |
| 4 or 5 Rooms | 10 (7.9%) | 0 (0.0%) |
| 6 or 7 Rooms | 44 (34.6%) | 0 (0.0%) |
| 8 or more Rooms | 73 (57.5%) | 0 (0.0%) |
| Total | 127 (100.0%) | 0 (0.0%) |
Housing Structure by Heating Type in Lower Elochoman
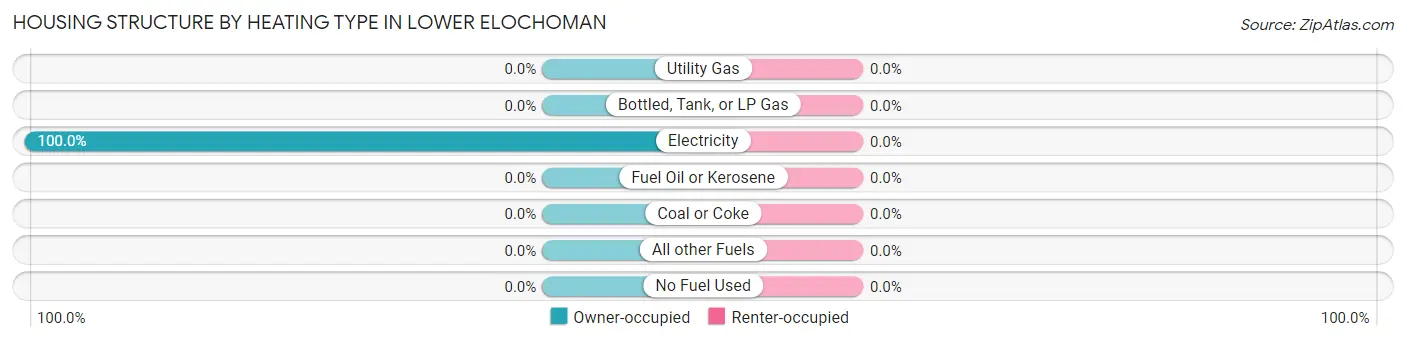
| Heating Type | Owner-occupied | Renter-occupied |
| Utility Gas | 0 (0.0%) | 0 (0.0%) |
| Bottled, Tank, or LP Gas | 0 (0.0%) | 0 (0.0%) |
| Electricity | 127 (100.0%) | 0 (0.0%) |
| Fuel Oil or Kerosene | 0 (0.0%) | 0 (0.0%) |
| Coal or Coke | 0 (0.0%) | 0 (0.0%) |
| All other Fuels | 0 (0.0%) | 0 (0.0%) |
| No Fuel Used | 0 (0.0%) | 0 (0.0%) |
| Total | 127 (100.0%) | 0 (0.0%) |
Household Vehicle Usage in Lower Elochoman
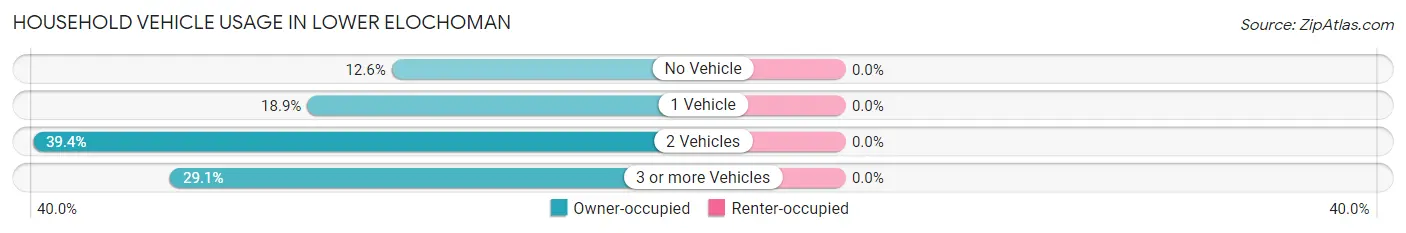
| Vehicles per Household | Owner-occupied | Renter-occupied |
| No Vehicle | 16 (12.6%) | 0 (0.0%) |
| 1 Vehicle | 24 (18.9%) | 0 (0.0%) |
| 2 Vehicles | 50 (39.4%) | 0 (0.0%) |
| 3 or more Vehicles | 37 (29.1%) | 0 (0.0%) |
| Total | 127 (100.0%) | 0 (0.0%) |
Real Estate & Mortgages in Lower Elochoman
Real Estate and Mortgage Overview in Lower Elochoman
| Characteristic | Without Mortgage | With Mortgage |
| Housing Units | 47 | 80 |
| Median Property Value | $547,400 | $464,300 |
| Median Household Income | - | - |
| Monthly Housing Costs | $819 | $0 |
| Real Estate Taxes | $5,474 | $0 |
Property Value by Mortgage Status in Lower Elochoman
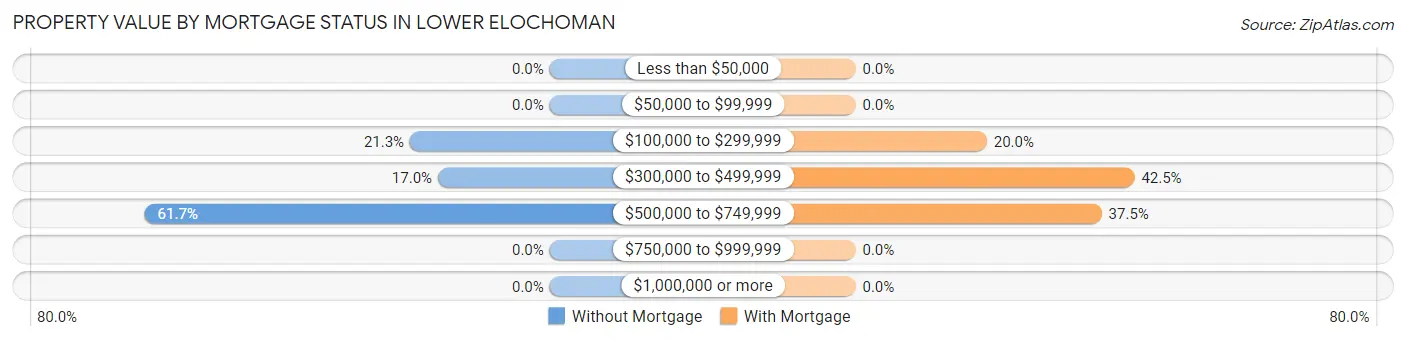
| Property Value | Without Mortgage | With Mortgage |
| Less than $50,000 | 0 (0.0%) | 0 (0.0%) |
| $50,000 to $99,999 | 0 (0.0%) | 0 (0.0%) |
| $100,000 to $299,999 | 10 (21.3%) | 16 (20.0%) |
| $300,000 to $499,999 | 8 (17.0%) | 34 (42.5%) |
| $500,000 to $749,999 | 29 (61.7%) | 30 (37.5%) |
| $750,000 to $999,999 | 0 (0.0%) | 0 (0.0%) |
| $1,000,000 or more | 0 (0.0%) | 0 (0.0%) |
| Total | 47 (100.0%) | 80 (100.0%) |
Household Income by Mortgage Status in Lower Elochoman
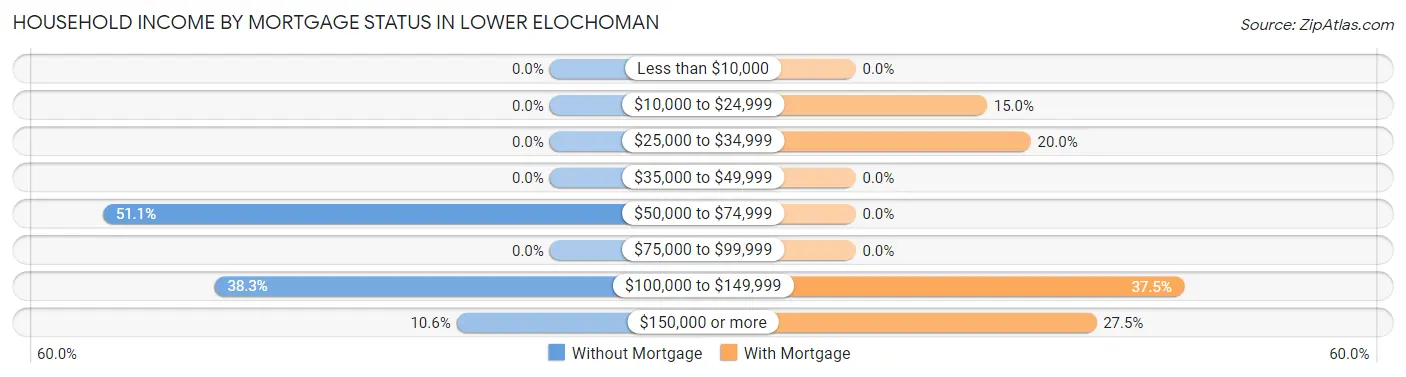
| Household Income | Without Mortgage | With Mortgage |
| Less than $10,000 | 0 (0.0%) | 0 (0.0%) |
| $10,000 to $24,999 | 0 (0.0%) | 12 (15.0%) |
| $25,000 to $34,999 | 0 (0.0%) | 16 (20.0%) |
| $35,000 to $49,999 | 0 (0.0%) | 0 (0.0%) |
| $50,000 to $74,999 | 24 (51.1%) | 0 (0.0%) |
| $75,000 to $99,999 | 0 (0.0%) | 0 (0.0%) |
| $100,000 to $149,999 | 18 (38.3%) | 30 (37.5%) |
| $150,000 or more | 5 (10.6%) | 22 (27.5%) |
| Total | 47 (100.0%) | 80 (100.0%) |
Property Value to Household Income Ratio in Lower Elochoman
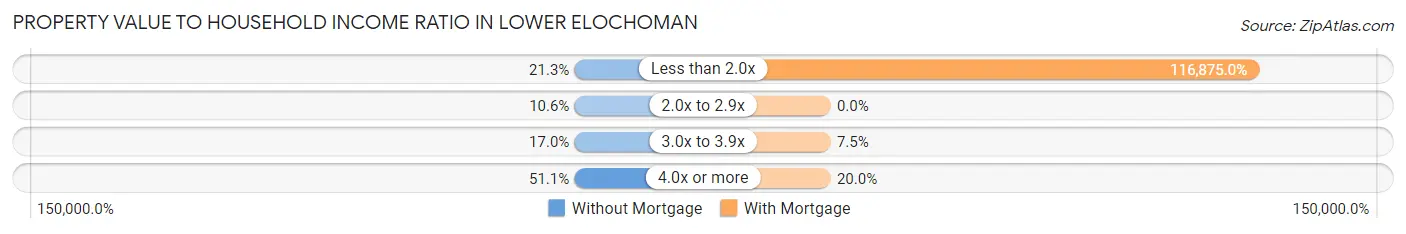
| Value-to-Income Ratio | Without Mortgage | With Mortgage |
| Less than 2.0x | 10 (21.3%) | 93,500 (116,875.0%) |
| 2.0x to 2.9x | 5 (10.6%) | 0 (0.0%) |
| 3.0x to 3.9x | 8 (17.0%) | 6 (7.5%) |
| 4.0x or more | 24 (51.1%) | 16 (20.0%) |
| Total | 47 (100.0%) | 80 (100.0%) |
Real Estate Taxes by Mortgage Status in Lower Elochoman
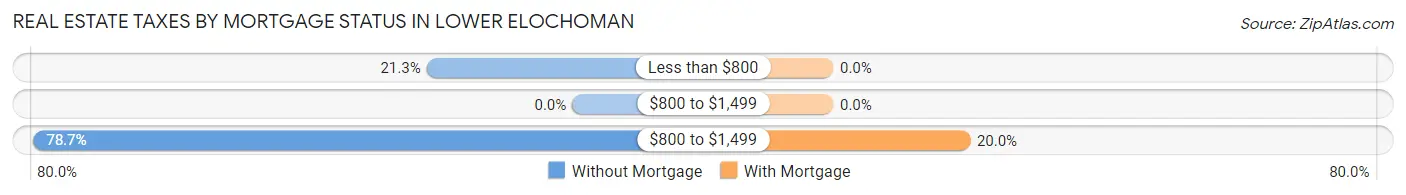
| Property Taxes | Without Mortgage | With Mortgage |
| Less than $800 | 10 (21.3%) | 0 (0.0%) |
| $800 to $1,499 | 0 (0.0%) | 0 (0.0%) |
| $800 to $1,499 | 37 (78.7%) | 16 (20.0%) |
| Total | 47 (100.0%) | 80 (100.0%) |
Health & Disability in Lower Elochoman
Health Insurance Coverage by Age in Lower Elochoman
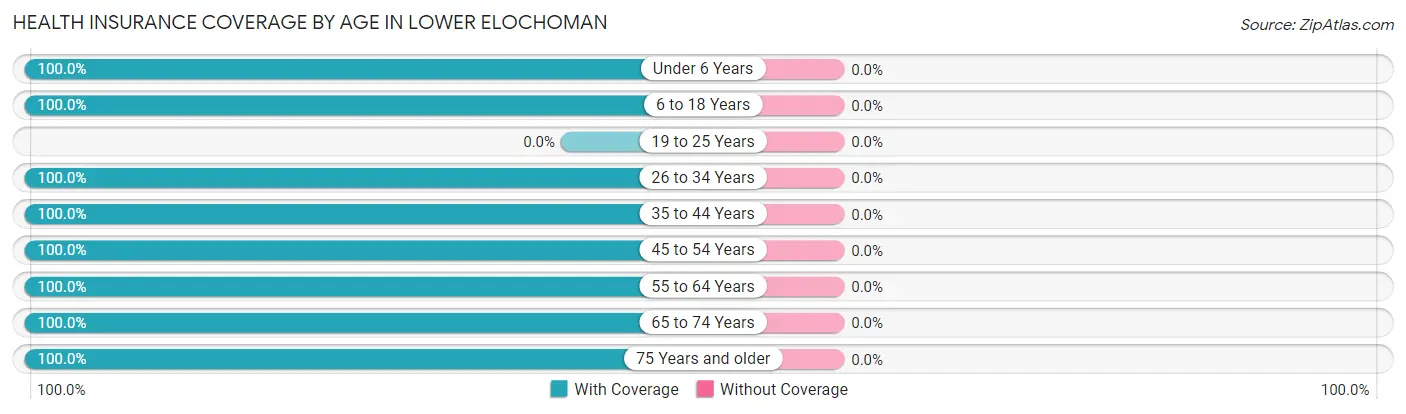
| Age Bracket | With Coverage | Without Coverage |
| Under 6 Years | 7 (100.0%) | 0 (0.0%) |
| 6 to 18 Years | 200 (100.0%) | 0 (0.0%) |
| 19 to 25 Years | 0 (0.0%) | 0 (0.0%) |
| 26 to 34 Years | 8 (100.0%) | 0 (0.0%) |
| 35 to 44 Years | 140 (100.0%) | 0 (0.0%) |
| 45 to 54 Years | 11 (100.0%) | 0 (0.0%) |
| 55 to 64 Years | 17 (100.0%) | 0 (0.0%) |
| 65 to 74 Years | 57 (100.0%) | 0 (0.0%) |
| 75 Years and older | 5 (100.0%) | 0 (0.0%) |
| Total | 445 (100.0%) | 0 (0.0%) |
Health Insurance Coverage by Citizenship Status in Lower Elochoman
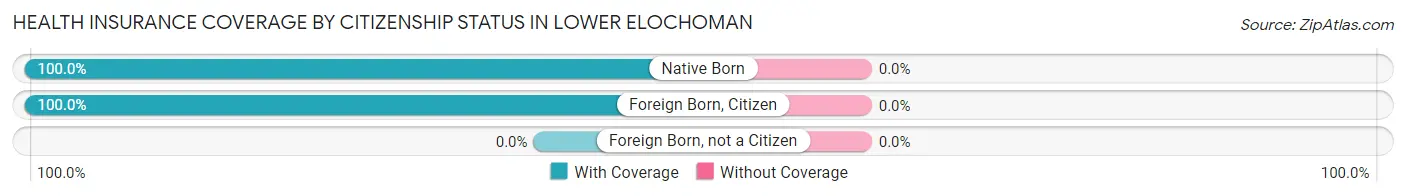
| Citizenship Status | With Coverage | Without Coverage |
| Native Born | 7 (100.0%) | 0 (0.0%) |
| Foreign Born, Citizen | 200 (100.0%) | 0 (0.0%) |
| Foreign Born, not a Citizen | 0 (0.0%) | 0 (0.0%) |
Health Insurance Coverage by Household Income in Lower Elochoman
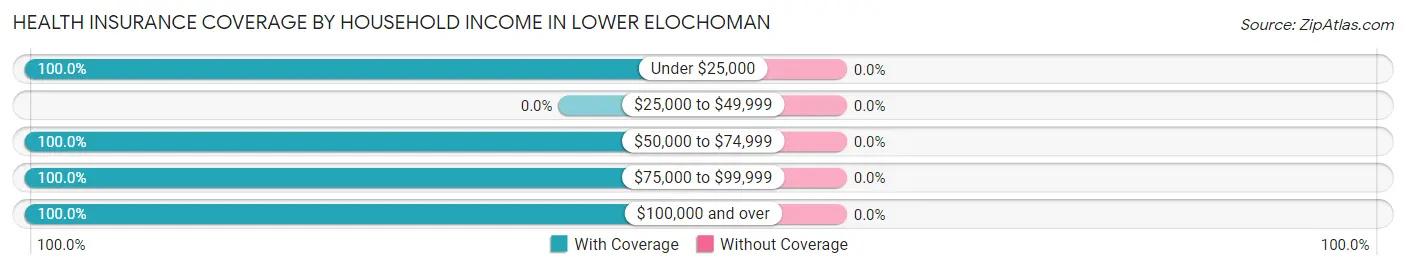
| Household Income | With Coverage | Without Coverage |
| Under $25,000 | 28 (100.0%) | 0 (0.0%) |
| $25,000 to $49,999 | 0 (0.0%) | 0 (0.0%) |
| $50,000 to $74,999 | 106 (100.0%) | 0 (0.0%) |
| $75,000 to $99,999 | 143 (100.0%) | 0 (0.0%) |
| $100,000 and over | 168 (100.0%) | 0 (0.0%) |
Public vs Private Health Insurance Coverage by Age in Lower Elochoman
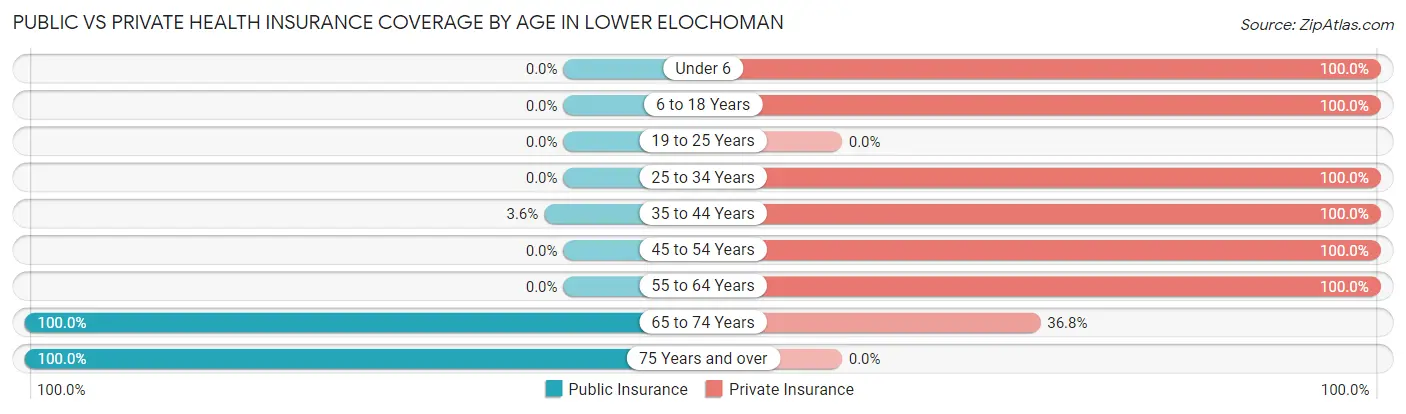
| Age Bracket | Public Insurance | Private Insurance |
| Under 6 | 0 (0.0%) | 7 (100.0%) |
| 6 to 18 Years | 0 (0.0%) | 200 (100.0%) |
| 19 to 25 Years | 0 (0.0%) | 0 (0.0%) |
| 25 to 34 Years | 0 (0.0%) | 8 (100.0%) |
| 35 to 44 Years | 5 (3.6%) | 140 (100.0%) |
| 45 to 54 Years | 0 (0.0%) | 11 (100.0%) |
| 55 to 64 Years | 0 (0.0%) | 17 (100.0%) |
| 65 to 74 Years | 57 (100.0%) | 21 (36.8%) |
| 75 Years and over | 5 (100.0%) | 0 (0.0%) |
| Total | 67 (15.1%) | 404 (90.8%) |
Disability Status by Sex by Age in Lower Elochoman
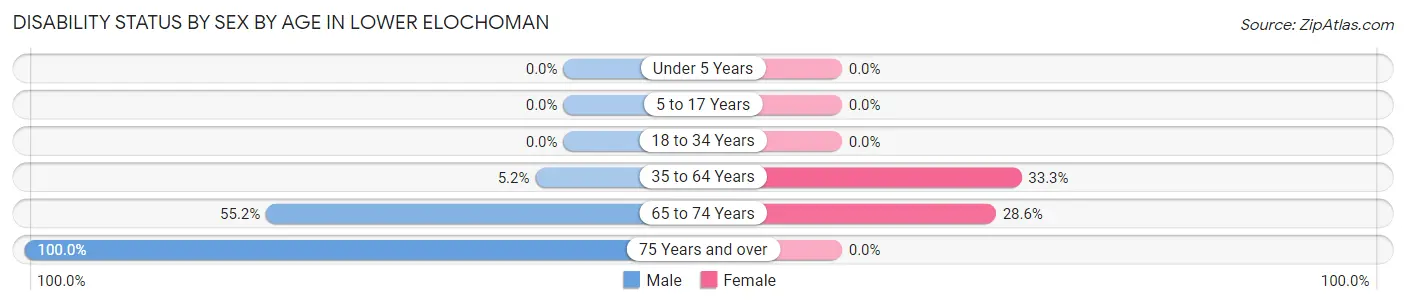
| Age Bracket | Male | Female |
| Under 5 Years | 0 (0.0%) | 0 (0.0%) |
| 5 to 17 Years | 0 (0.0%) | 0 (0.0%) |
| 18 to 34 Years | 0 (0.0%) | 0 (0.0%) |
| 35 to 64 Years | 5 (5.2%) | 24 (33.3%) |
| 65 to 74 Years | 16 (55.2%) | 8 (28.6%) |
| 75 Years and over | 5 (100.0%) | 0 (0.0%) |
Disability Class by Sex by Age in Lower Elochoman
Disability Class: Hearing Difficulty
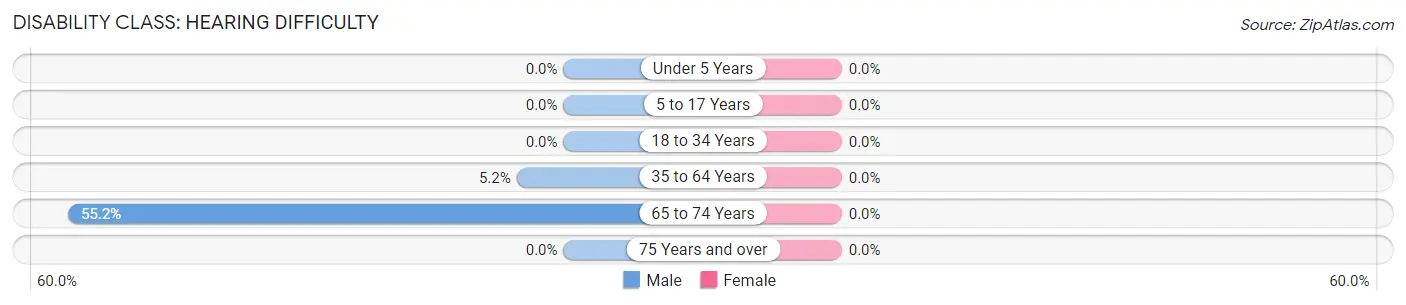
| Age Bracket | Male | Female |
| Under 5 Years | 0 (0.0%) | 0 (0.0%) |
| 5 to 17 Years | 0 (0.0%) | 0 (0.0%) |
| 18 to 34 Years | 0 (0.0%) | 0 (0.0%) |
| 35 to 64 Years | 5 (5.2%) | 0 (0.0%) |
| 65 to 74 Years | 16 (55.2%) | 0 (0.0%) |
| 75 Years and over | 0 (0.0%) | 0 (0.0%) |
Disability Class: Vision Difficulty
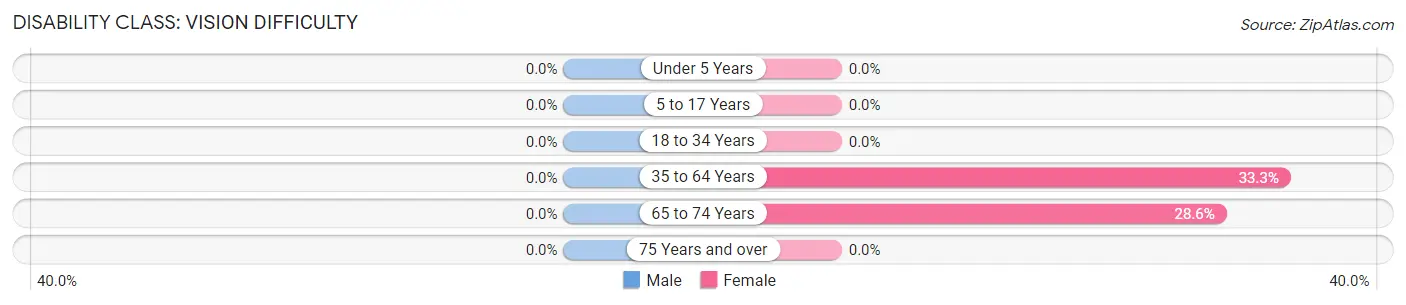
| Age Bracket | Male | Female |
| Under 5 Years | 0 (0.0%) | 0 (0.0%) |
| 5 to 17 Years | 0 (0.0%) | 0 (0.0%) |
| 18 to 34 Years | 0 (0.0%) | 0 (0.0%) |
| 35 to 64 Years | 0 (0.0%) | 24 (33.3%) |
| 65 to 74 Years | 0 (0.0%) | 8 (28.6%) |
| 75 Years and over | 0 (0.0%) | 0 (0.0%) |
Disability Class: Cognitive Difficulty
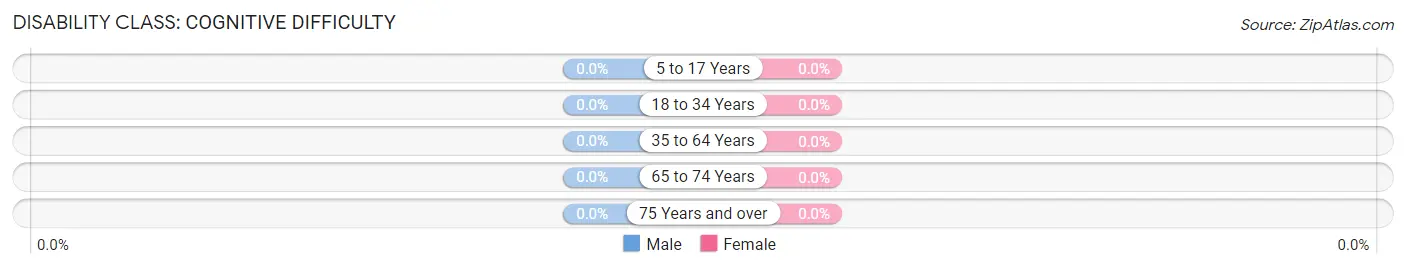
| Age Bracket | Male | Female |
| 5 to 17 Years | 0 (0.0%) | 0 (0.0%) |
| 18 to 34 Years | 0 (0.0%) | 0 (0.0%) |
| 35 to 64 Years | 0 (0.0%) | 0 (0.0%) |
| 65 to 74 Years | 0 (0.0%) | 0 (0.0%) |
| 75 Years and over | 0 (0.0%) | 0 (0.0%) |
Disability Class: Ambulatory Difficulty
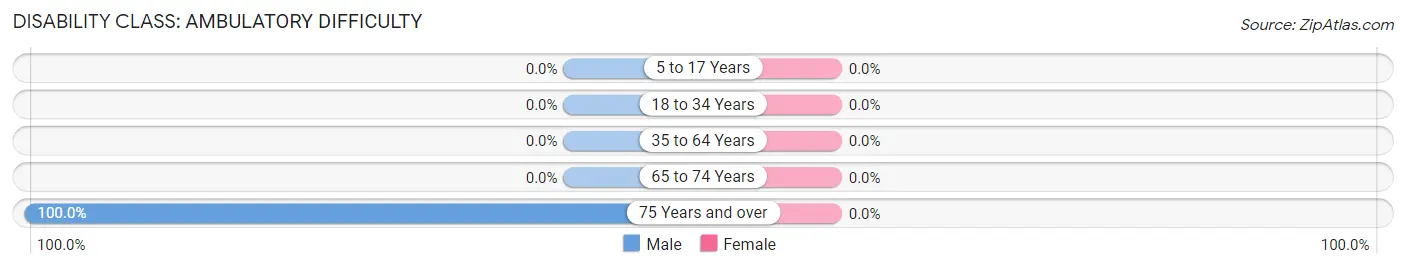
| Age Bracket | Male | Female |
| 5 to 17 Years | 0 (0.0%) | 0 (0.0%) |
| 18 to 34 Years | 0 (0.0%) | 0 (0.0%) |
| 35 to 64 Years | 0 (0.0%) | 0 (0.0%) |
| 65 to 74 Years | 0 (0.0%) | 0 (0.0%) |
| 75 Years and over | 5 (100.0%) | 0 (0.0%) |
Disability Class: Self-Care Difficulty

| Age Bracket | Male | Female |
| 5 to 17 Years | 0 (0.0%) | 0 (0.0%) |
| 18 to 34 Years | 0 (0.0%) | 0 (0.0%) |
| 35 to 64 Years | 0 (0.0%) | 0 (0.0%) |
| 65 to 74 Years | 0 (0.0%) | 0 (0.0%) |
| 75 Years and over | 0 (0.0%) | 0 (0.0%) |
Technology Access in Lower Elochoman
Computing Device Access in Lower Elochoman
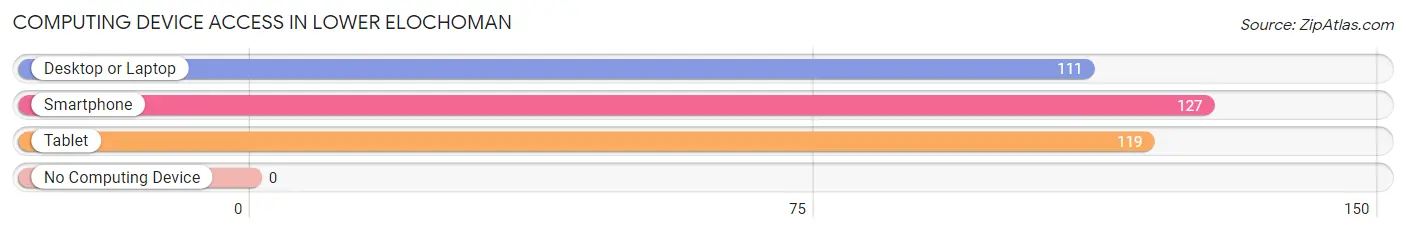
| Device Type | # Households | % Households |
| Desktop or Laptop | 111 | 87.4% |
| Smartphone | 127 | 100.0% |
| Tablet | 119 | 93.7% |
| No Computing Device | 0 | 0.0% |
| Total | 127 | 100.0% |
Internet Access in Lower Elochoman
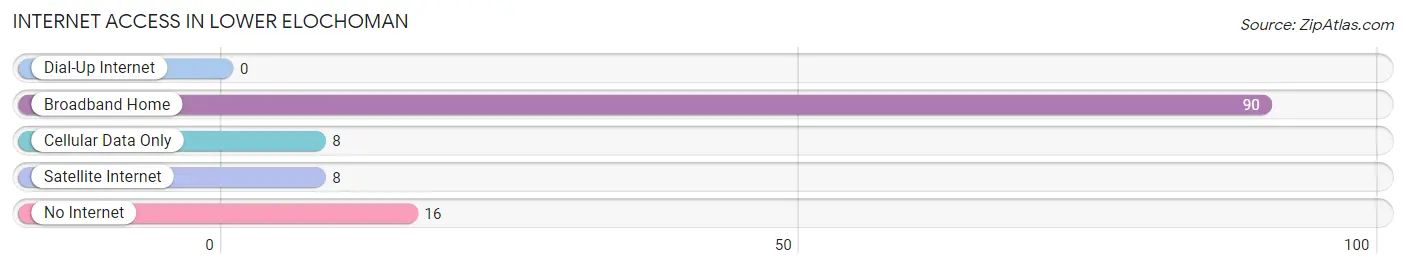
| Internet Type | # Households | % Households |
| Dial-Up Internet | 0 | 0.0% |
| Broadband Home | 90 | 70.9% |
| Cellular Data Only | 8 | 6.3% |
| Satellite Internet | 8 | 6.3% |
| No Internet | 16 | 12.6% |
| Total | 127 | 100.0% |
Lower Elochoman Summary
Lower Elochoman is a small unincorporated community located in the southwestern corner of Washington State, in the United States. It is situated in the Cowlitz County, and is part of the Longview Metropolitan Statistical Area. The community is located on the banks of the Elochoman River, and is surrounded by the lush forests of the Cascade Mountains.
History
Lower Elochoman was first settled in the late 1800s by a group of settlers from the nearby town of Cathlamet. The settlers were attracted to the area by the abundance of natural resources, including timber, fish, and game. The settlers built a small community, which they named Elochoman, after the river that ran through it.
The community grew slowly over the years, and by the early 1900s, it had become a thriving logging and fishing town. The town was home to several sawmills, a cannery, and a general store. The town also had a school, a post office, and a church.
In the 1950s, the logging industry began to decline, and the town's population began to dwindle. By the 1970s, the town had become a virtual ghost town, with only a handful of residents remaining.
Geography
Lower Elochoman is located in the southwestern corner of Washington State, in the United States. It is situated in the Cowlitz County, and is part of the Longview Metropolitan Statistical Area. The community is located on the banks of the Elochoman River, and is surrounded by the lush forests of the Cascade Mountains.
The town is located at an elevation of approximately 500 feet above sea level, and has a total area of 0.3 square miles. The climate in the area is mild, with temperatures ranging from the mid-30s in the winter to the mid-80s in the summer.
Economy
Lower Elochoman is a small, rural community with a limited economy. The town is home to a few small businesses, including a general store, a gas station, and a few restaurants. The town also has a small marina, which provides access to the Elochoman River.
The town is also home to a few small farms, which produce a variety of crops, including hay, corn, and wheat. The town also has a few small logging operations, which provide timber for the local lumber industry.
Demographics
As of the 2010 census, the population of Lower Elochoman was estimated to be around 200 people. The town is predominantly white, with a small minority population of Native Americans and African Americans. The median household income in the town is around $30,000, and the median age is around 40 years old.
Lower Elochoman is a small, rural community with a limited economy. Despite its small size, the town has a rich history and a unique culture. The town is home to a few small businesses, and is surrounded by the lush forests of the Cascade Mountains. The town is a great place to live for those who enjoy the outdoors and the quiet, rural lifestyle.
Common Questions
What is the Total Population of Lower Elochoman?
Total Population of Lower Elochoman is 445.
What is the Total Male Population of Lower Elochoman?
Total Male Population of Lower Elochoman is 309.
What is the Total Female Population of Lower Elochoman?
Total Female Population of Lower Elochoman is 136.
What is the Ratio of Males per 100 Females in Lower Elochoman?
There are 227.21 Males per 100 Females in Lower Elochoman.
What is the Ratio of Females per 100 Males in Lower Elochoman?
There are 44.01 Females per 100 Males in Lower Elochoman.
What is the Median Population Age in Lower Elochoman?
Median Population Age in Lower Elochoman is 38.1 Years.
What is the Average Family Size in Lower Elochoman
Average Family Size in Lower Elochoman is 4.4 People.
What is the Average Household Size in Lower Elochoman
Average Household Size in Lower Elochoman is 3.5 People.
What is Per Capita Income in Lower Elochoman?
Per Capita income in Lower Elochoman is $27,411.
What is the Median Family Income in Lower Elochoman?
Median Family Income in Lower Elochoman is $94,292.
What is the Median Household income in Lower Elochoman?
Median Household Income in Lower Elochoman is $93,458.
What is Income or Wage Gap in Lower Elochoman?
Income or Wage Gap in Lower Elochoman is 38.7%.
Women in Lower Elochoman earn 61.3 cents for every dollar earned by a man.
What is Inequality or Gini Index in Lower Elochoman?
Inequality or Gini Index in Lower Elochoman is 0.35.
How Large is the Labor Force in Lower Elochoman?
There are 241 People in the Labor Forcein in Lower Elochoman.
What is the Percentage of People in the Labor Force in Lower Elochoman?
80.3% of People are in the Labor Force in Lower Elochoman.