Zip Codes with the Highest Percentage of Population Employed in Administrative & Support Services in Seattle, WA
RELATED REPORTS & OPTIONS
Administrative & Support Services
Seattle
Compare Zip Codes
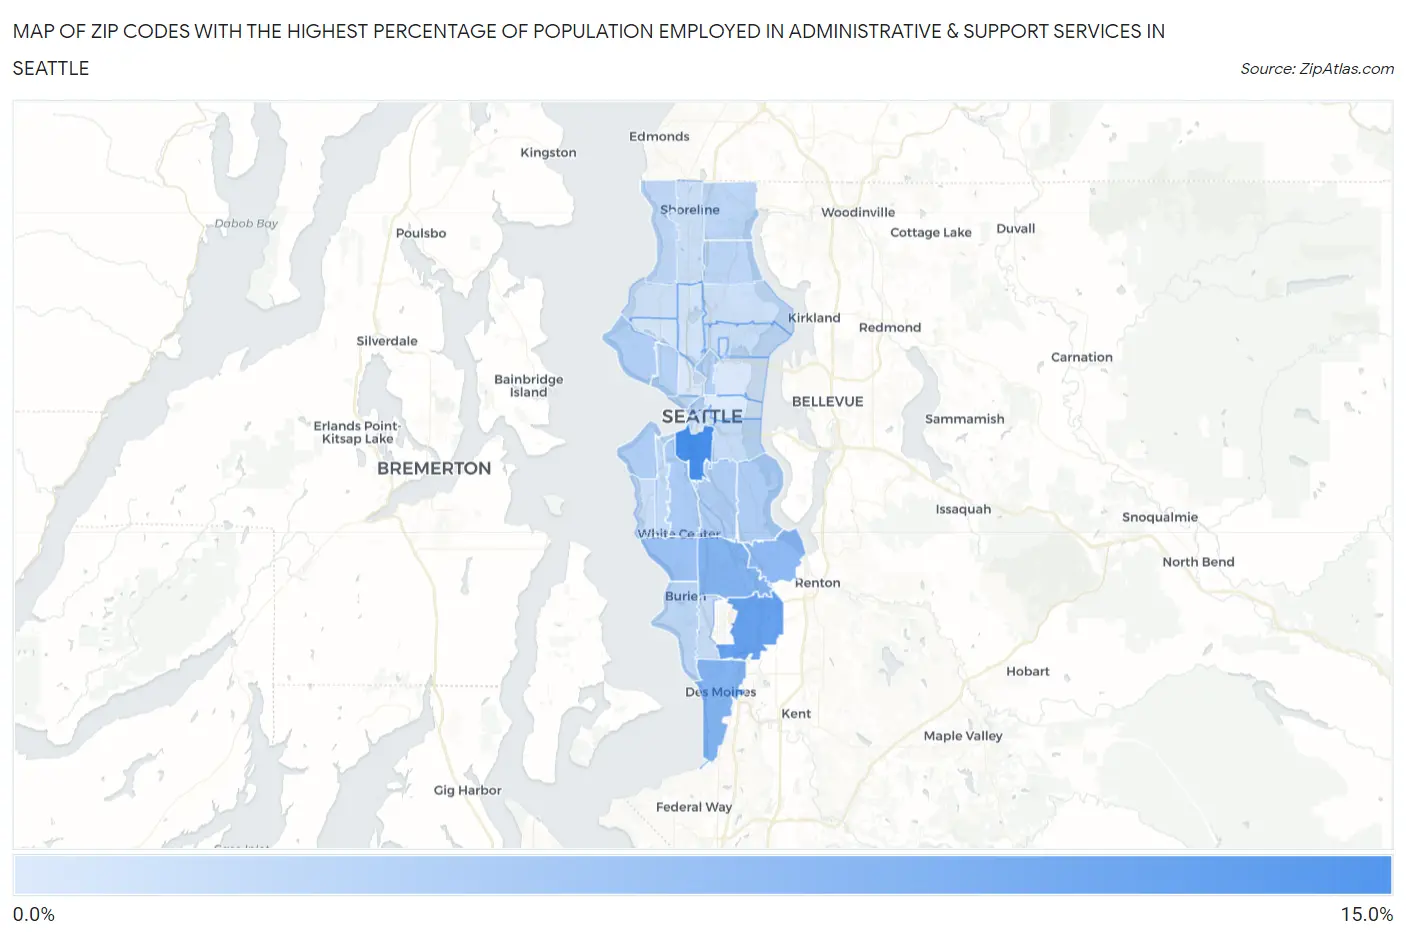
Map of Zip Codes with the Highest Percentage of Population Employed in Administrative & Support Services in Seattle
0.0%
15.0%
Zip Codes with the Highest Percentage of Population Employed in Administrative & Support Services in Seattle, WA
| Zip Code | % Employed | vs State | vs National | |
| 1. | 98134 | 10.9% | 3.8%(+7.16)#15 | 4.1%(+6.78)#1,034 |
| 2. | 98188 | 8.8% | 3.8%(+5.08)#21 | 4.1%(+4.70)#1,768 |
| 3. | 98168 | 7.0% | 3.8%(+3.22)#47 | 4.1%(+2.84)#3,234 |
| 4. | 98198 | 7.0% | 3.8%(+3.20)#49 | 4.1%(+2.82)#3,265 |
| 5. | 98178 | 6.3% | 3.8%(+2.56)#71 | 4.1%(+2.18)#4,198 |
| 6. | 98164 | 5.6% | 3.8%(+1.82)#85 | 4.1%(+1.43)#5,620 |
| 7. | 98146 | 5.4% | 3.8%(+1.63)#95 | 4.1%(+1.25)#6,087 |
| 8. | 98106 | 4.4% | 3.8%(+0.588)#156 | 4.1%(+0.204)#9,274 |
| 9. | 98118 | 4.3% | 3.8%(+0.541)#163 | 4.1%(+0.157)#9,424 |
| 10. | 98108 | 4.3% | 3.8%(+0.536)#164 | 4.1%(+0.152)#9,446 |
| 11. | 98116 | 4.2% | 3.8%(+0.428)#172 | 4.1%(+0.044)#9,846 |
| 12. | 98102 | 4.0% | 3.8%(+0.238)#192 | 4.1%(-0.146)#10,671 |
| 13. | 98199 | 4.0% | 3.8%(+0.209)#194 | 4.1%(-0.175)#10,804 |
| 14. | 98101 | 3.9% | 3.8%(+0.141)#201 | 4.1%(-0.244)#11,079 |
| 15. | 98119 | 3.8% | 3.8%(-0.007)#219 | 4.1%(-0.391)#11,718 |
| 16. | 98166 | 3.5% | 3.8%(-0.276)#254 | 4.1%(-0.660)#13,018 |
| 17. | 98155 | 3.5% | 3.8%(-0.311)#258 | 4.1%(-0.696)#13,188 |
| 18. | 98125 | 3.4% | 3.8%(-0.343)#261 | 4.1%(-0.727)#13,334 |
| 19. | 98177 | 3.1% | 3.8%(-0.645)#290 | 4.1%(-1.03)#14,883 |
| 20. | 98126 | 3.0% | 3.8%(-0.804)#309 | 4.1%(-1.19)#15,673 |
| 21. | 98144 | 2.9% | 3.8%(-0.905)#323 | 4.1%(-1.29)#16,202 |
| 22. | 98121 | 2.8% | 3.8%(-0.955)#331 | 4.1%(-1.34)#16,483 |
| 23. | 98148 | 2.8% | 3.8%(-1.01)#339 | 4.1%(-1.40)#16,812 |
| 24. | 98136 | 2.7% | 3.8%(-1.09)#348 | 4.1%(-1.47)#17,197 |
| 25. | 98105 | 2.7% | 3.8%(-1.10)#349 | 4.1%(-1.48)#17,249 |
| 26. | 98115 | 2.5% | 3.8%(-1.27)#364 | 4.1%(-1.66)#18,178 |
| 27. | 98133 | 2.4% | 3.8%(-1.32)#368 | 4.1%(-1.70)#18,400 |
| 28. | 98117 | 2.3% | 3.8%(-1.42)#379 | 4.1%(-1.80)#18,948 |
| 29. | 98195 | 2.2% | 3.8%(-1.57)#390 | 4.1%(-1.95)#19,655 |
| 30. | 98103 | 2.0% | 3.8%(-1.80)#407 | 4.1%(-2.18)#20,785 |
| 31. | 98107 | 1.9% | 3.8%(-1.86)#418 | 4.1%(-2.24)#21,050 |
| 32. | 98104 | 1.9% | 3.8%(-1.87)#419 | 4.1%(-2.26)#21,128 |
| 33. | 98109 | 1.6% | 3.8%(-2.16)#436 | 4.1%(-2.54)#22,321 |
| 34. | 98112 | 1.6% | 3.8%(-2.16)#437 | 4.1%(-2.54)#22,330 |
| 35. | 98122 | 1.5% | 3.8%(-2.31)#444 | 4.1%(-2.70)#22,918 |
1
Common Questions
What are the Top 10 Zip Codes with the Highest Percentage of Population Employed in Administrative & Support Services in Seattle, WA?
Top 10 Zip Codes with the Highest Percentage of Population Employed in Administrative & Support Services in Seattle, WA are:
What zip code has the Highest Percentage of Population Employed in Administrative & Support Services in Seattle, WA?
98134 has the Highest Percentage of Population Employed in Administrative & Support Services in Seattle, WA with 10.9%.
What is the Percentage of Population Employed in Administrative & Support Services in Seattle, WA?
Percentage of Population Employed in Administrative & Support Services in Seattle is 2.9%.
What is the Percentage of Population Employed in Administrative & Support Services in Washington?
Percentage of Population Employed in Administrative & Support Services in Washington is 3.8%.
What is the Percentage of Population Employed in Administrative & Support Services in the United States?
Percentage of Population Employed in Administrative & Support Services in the United States is 4.1%.