Bonney Lake, WA
Bonney Lake Map
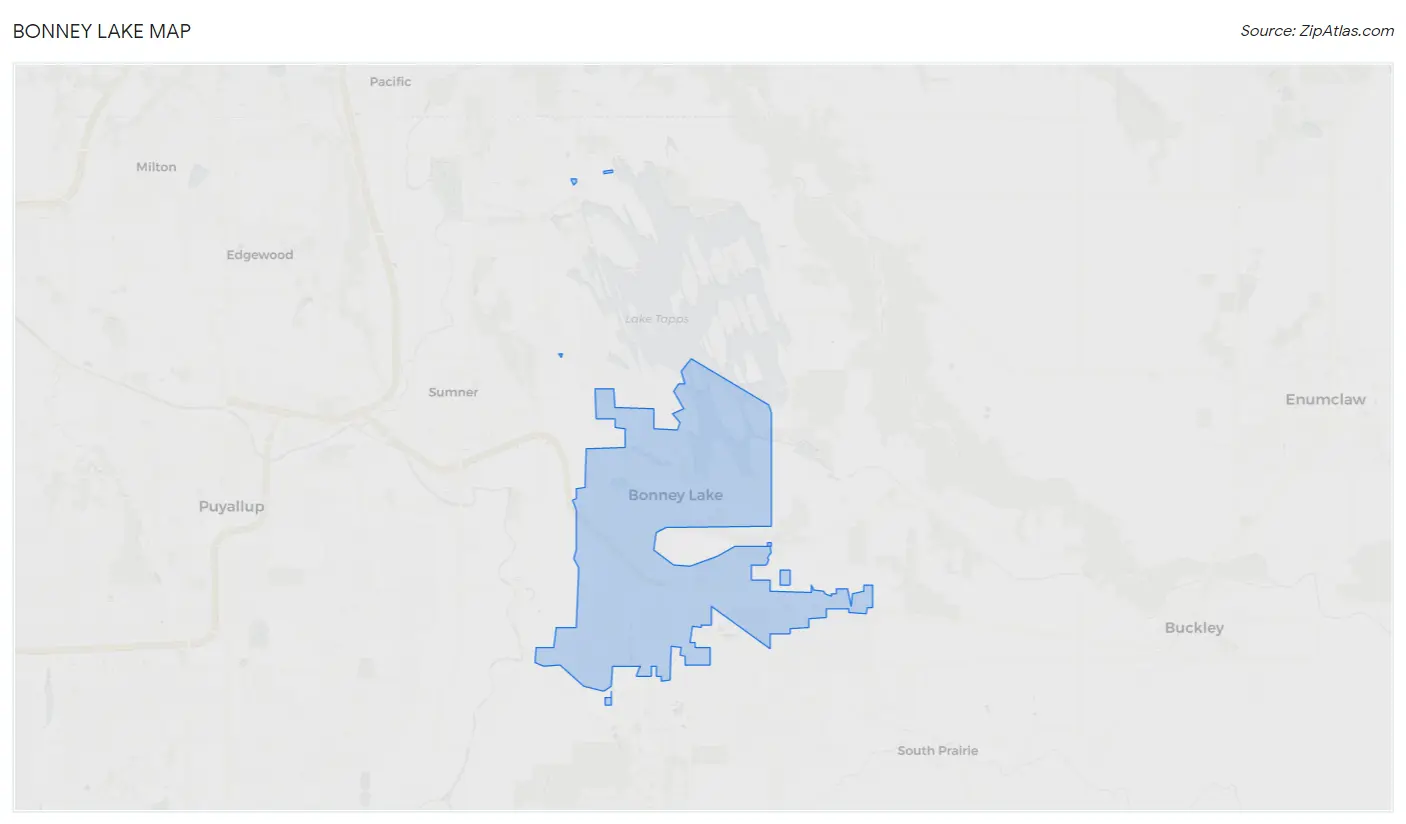
Bonney Lake Overview
22,590
TOTAL POPULATION
11,450
MALE POPULATION
11,140
FEMALE POPULATION
102.78
MALES / 100 FEMALES
97.29
FEMALES / 100 MALES
37.2
MEDIAN AGE
3.3
AVG FAMILY SIZE
2.9
AVG HOUSEHOLD SIZE
$49,627
PER CAPITA INCOME
$139,419
AVG FAMILY INCOME
$123,462
AVG HOUSEHOLD INCOME
38.3%
WAGE / INCOME GAP [ % ]
61.7¢/ $1
WAGE / INCOME GAP [ $ ]
0.37
INEQUALITY / GINI INDEX
12,101
LABOR FORCE [ PEOPLE ]
70.6%
PERCENT IN LABOR FORCE
2.8%
UNEMPLOYMENT RATE
Bonney Lake Zip Codes
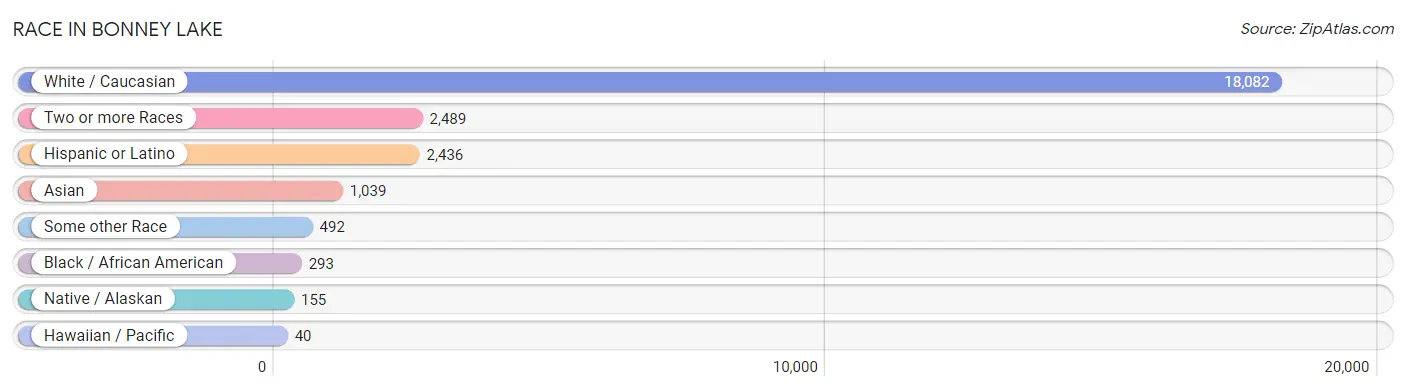
Race in Bonney Lake
The most populous races in Bonney Lake are White / Caucasian (18,082 | 80.0%), Two or more Races (2,489 | 11.0%), and Hispanic or Latino (2,436 | 10.8%).
| Race | # Population | % Population |
| Asian | 1,039 | 4.6% |
| Black / African American | 293 | 1.3% |
| Hawaiian / Pacific | 40 | 0.2% |
| Hispanic or Latino | 2,436 | 10.8% |
| Native / Alaskan | 155 | 0.7% |
| White / Caucasian | 18,082 | 80.0% |
| Two or more Races | 2,489 | 11.0% |
| Some other Race | 492 | 2.2% |
| Total | 22,590 | 100.0% |
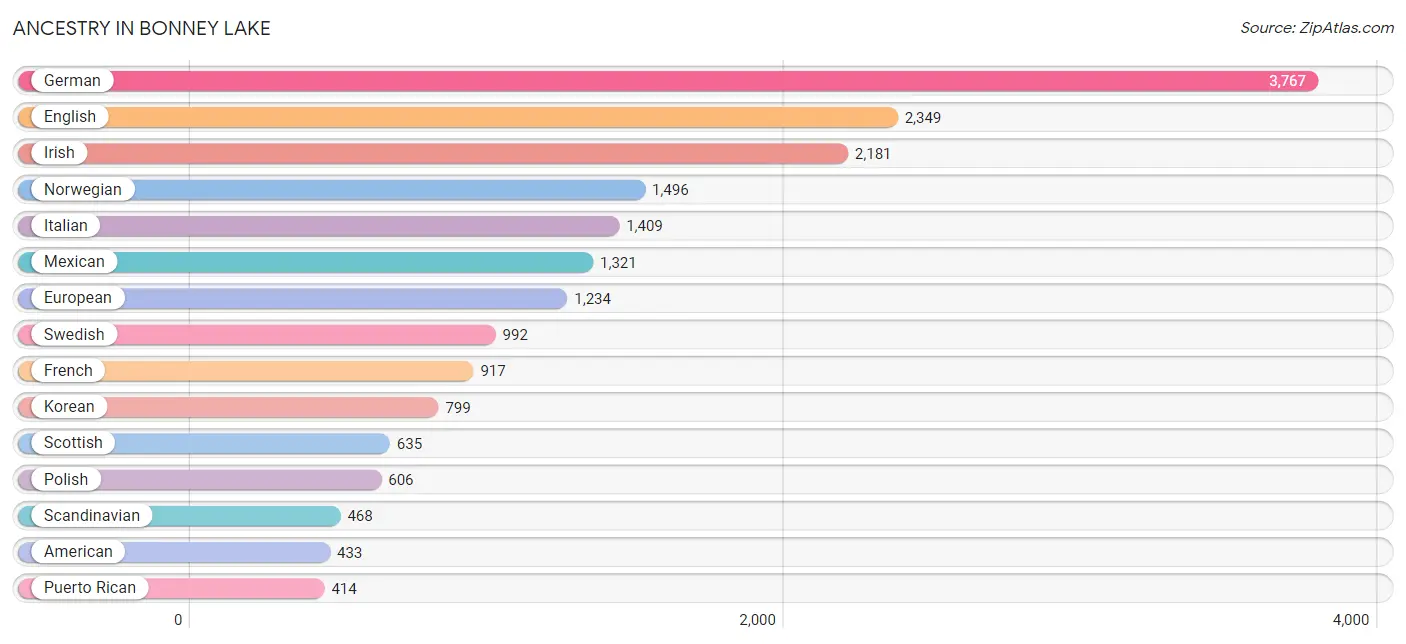
Ancestry in Bonney Lake
The most populous ancestries reported in Bonney Lake are German (3,767 | 16.7%), English (2,349 | 10.4%), Irish (2,181 | 9.7%), Norwegian (1,496 | 6.6%), and Italian (1,409 | 6.2%), together accounting for 49.6% of all Bonney Lake residents.
| Ancestry | # Population | % Population |
| Alaska Native | 4 | 0.0% |
| American | 433 | 1.9% |
| Apache | 30 | 0.1% |
| Arab | 53 | 0.2% |
| Austrian | 9 | 0.0% |
| Basque | 22 | 0.1% |
| Belgian | 10 | 0.0% |
| Bhutanese | 321 | 1.4% |
| Blackfeet | 45 | 0.2% |
| Brazilian | 55 | 0.2% |
| British | 268 | 1.2% |
| Burmese | 271 | 1.2% |
| Canadian | 113 | 0.5% |
| Celtic | 141 | 0.6% |
| Central American | 321 | 1.4% |
| Cherokee | 44 | 0.2% |
| Chilean | 14 | 0.1% |
| Costa Rican | 108 | 0.5% |
| Croatian | 13 | 0.1% |
| Czech | 49 | 0.2% |
| Danish | 264 | 1.2% |
| Dutch | 249 | 1.1% |
| Eastern European | 197 | 0.9% |
| English | 2,349 | 10.4% |
| European | 1,234 | 5.5% |
| Finnish | 2 | 0.0% |
| French | 917 | 4.1% |
| French Canadian | 80 | 0.4% |
| German | 3,767 | 16.7% |
| Greek | 256 | 1.1% |
| Guatemalan | 12 | 0.1% |
| Hungarian | 25 | 0.1% |
| Icelander | 76 | 0.3% |
| Indian (Asian) | 322 | 1.4% |
| Iranian | 20 | 0.1% |
| Irish | 2,181 | 9.7% |
| Iroquois | 20 | 0.1% |
| Italian | 1,409 | 6.2% |
| Japanese | 328 | 1.5% |
| Korean | 799 | 3.5% |
| Lebanese | 53 | 0.2% |
| Lithuanian | 14 | 0.1% |
| Malaysian | 10 | 0.0% |
| Mexican | 1,321 | 5.9% |
| Native Hawaiian | 53 | 0.2% |
| Northern European | 122 | 0.5% |
| Norwegian | 1,496 | 6.6% |
| Panamanian | 201 | 0.9% |
| Pennsylvania German | 19 | 0.1% |
| Peruvian | 84 | 0.4% |
| Polish | 606 | 2.7% |
| Portuguese | 412 | 1.8% |
| Puerto Rican | 414 | 1.8% |
| Puget Sound Salish | 108 | 0.5% |
| Romanian | 17 | 0.1% |
| Russian | 228 | 1.0% |
| Samoan | 55 | 0.2% |
| Scandinavian | 468 | 2.1% |
| Scotch-Irish | 70 | 0.3% |
| Scottish | 635 | 2.8% |
| Serbian | 10 | 0.0% |
| Shoshone | 9 | 0.0% |
| South American | 98 | 0.4% |
| Spaniard | 191 | 0.9% |
| Spanish | 20 | 0.1% |
| Sri Lankan | 5 | 0.0% |
| Swedish | 992 | 4.4% |
| Swiss | 58 | 0.3% |
| Thai | 306 | 1.3% |
| Tlingit-Haida | 12 | 0.1% |
| Ukrainian | 130 | 0.6% |
| Welsh | 294 | 1.3% |
| Yugoslavian | 45 | 0.2% |
| Yup'ik | 23 | 0.1% | View All 74 Rows |
Immigrants in Bonney Lake
The most numerous immigrant groups reported in Bonney Lake came from Latin America (414 | 1.8%), Asia (389 | 1.7%), Europe (265 | 1.2%), South Eastern Asia (250 | 1.1%), and Central America (242 | 1.1%), together accounting for 6.9% of all Bonney Lake residents.

| Immigration Origin | # Population | % Population |
| Asia | 389 | 1.7% |
| Brazil | 96 | 0.4% |
| Bulgaria | 62 | 0.3% |
| Cambodia | 104 | 0.5% |
| Canada | 107 | 0.5% |
| Caribbean | 46 | 0.2% |
| Central America | 242 | 1.1% |
| Chile | 13 | 0.1% |
| China | 57 | 0.3% |
| Costa Rica | 41 | 0.2% |
| Denmark | 12 | 0.1% |
| Eastern Asia | 78 | 0.4% |
| Eastern Europe | 197 | 0.9% |
| England | 10 | 0.0% |
| Europe | 265 | 1.2% |
| Germany | 9 | 0.0% |
| Guatemala | 20 | 0.1% |
| Hong Kong | 3 | 0.0% |
| India | 21 | 0.1% |
| Iran | 20 | 0.1% |
| Kazakhstan | 20 | 0.1% |
| Korea | 21 | 0.1% |
| Latin America | 414 | 1.8% |
| Malaysia | 14 | 0.1% |
| Mexico | 181 | 0.8% |
| Netherlands | 14 | 0.1% |
| Northern Europe | 45 | 0.2% |
| Peru | 17 | 0.1% |
| Philippines | 114 | 0.5% |
| Poland | 15 | 0.1% |
| Romania | 8 | 0.0% |
| Russia | 20 | 0.1% |
| South America | 126 | 0.6% |
| South Central Asia | 61 | 0.3% |
| South Eastern Asia | 250 | 1.1% |
| Trinidad and Tobago | 46 | 0.2% |
| Ukraine | 92 | 0.4% |
| Vietnam | 5 | 0.0% |
| Western Europe | 23 | 0.1% | View All 39 Rows |
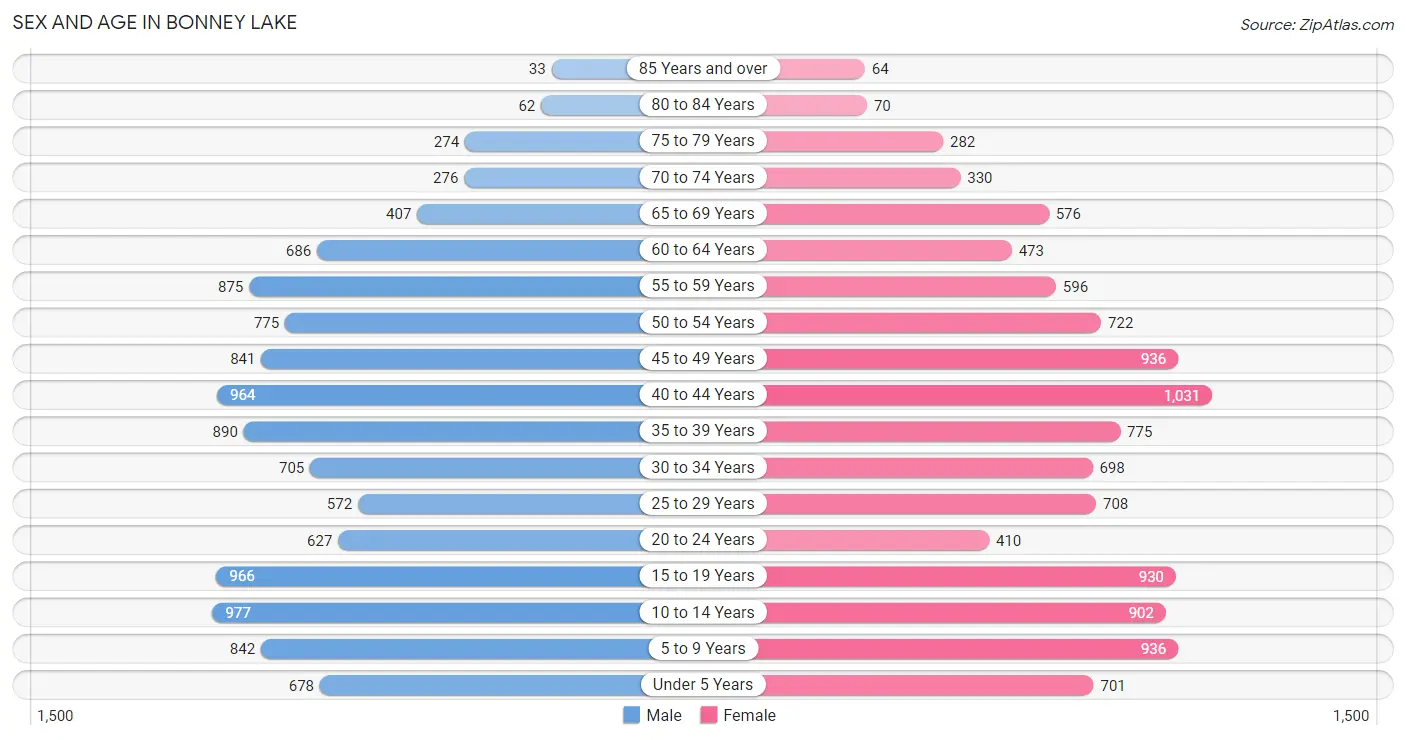
Sex and Age in Bonney Lake
Sex and Age in Bonney Lake
The most populous age groups in Bonney Lake are 10 to 14 Years (977 | 8.5%) for men and 40 to 44 Years (1,031 | 9.2%) for women.
| Age Bracket | Male | Female |
| Under 5 Years | 678 (5.9%) | 701 (6.3%) |
| 5 to 9 Years | 842 (7.3%) | 936 (8.4%) |
| 10 to 14 Years | 977 (8.5%) | 902 (8.1%) |
| 15 to 19 Years | 966 (8.4%) | 930 (8.4%) |
| 20 to 24 Years | 627 (5.5%) | 410 (3.7%) |
| 25 to 29 Years | 572 (5.0%) | 708 (6.4%) |
| 30 to 34 Years | 705 (6.2%) | 698 (6.3%) |
| 35 to 39 Years | 890 (7.8%) | 775 (7.0%) |
| 40 to 44 Years | 964 (8.4%) | 1,031 (9.2%) |
| 45 to 49 Years | 841 (7.3%) | 936 (8.4%) |
| 50 to 54 Years | 775 (6.8%) | 722 (6.5%) |
| 55 to 59 Years | 875 (7.6%) | 596 (5.3%) |
| 60 to 64 Years | 686 (6.0%) | 473 (4.3%) |
| 65 to 69 Years | 407 (3.5%) | 576 (5.2%) |
| 70 to 74 Years | 276 (2.4%) | 330 (3.0%) |
| 75 to 79 Years | 274 (2.4%) | 282 (2.5%) |
| 80 to 84 Years | 62 (0.5%) | 70 (0.6%) |
| 85 Years and over | 33 (0.3%) | 64 (0.6%) |
| Total | 11,450 (100.0%) | 11,140 (100.0%) |
Families and Households in Bonney Lake
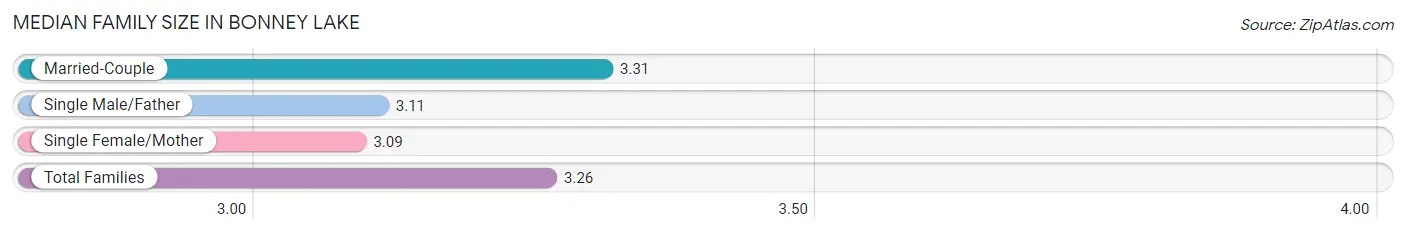
Median Family Size in Bonney Lake
The median family size in Bonney Lake is 3.26 persons per family, with married-couple families (4,682 | 77.6%) accounting for the largest median family size of 3.31 persons per family. On the other hand, single female/mother families (882 | 14.6%) represent the smallest median family size with 3.09 persons per family.
| Family Type | # Families | Family Size |
| Married-Couple | 4,682 (77.6%) | 3.31 |
| Single Male/Father | 470 (7.8%) | 3.11 |
| Single Female/Mother | 882 (14.6%) | 3.09 |
| Total Families | 6,034 (100.0%) | 3.26 |
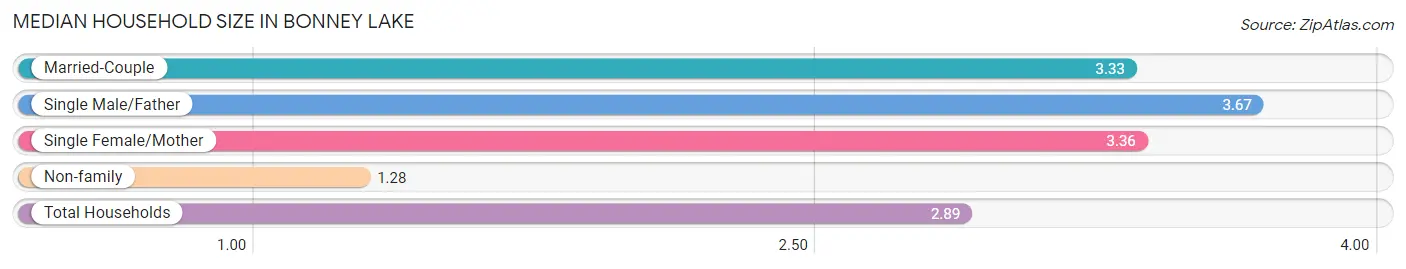
Median Household Size in Bonney Lake
The median household size in Bonney Lake is 2.89 persons per household, with single male/father households (470 | 6.0%) accounting for the largest median household size of 3.67 persons per household. non-family households (1,766 | 22.6%) represent the smallest median household size with 1.28 persons per household.
| Household Type | # Households | Household Size |
| Married-Couple | 4,682 (60.0%) | 3.33 |
| Single Male/Father | 470 (6.0%) | 3.67 |
| Single Female/Mother | 882 (11.3%) | 3.36 |
| Non-family | 1,766 (22.6%) | 1.28 |
| Total Households | 7,800 (100.0%) | 2.89 |
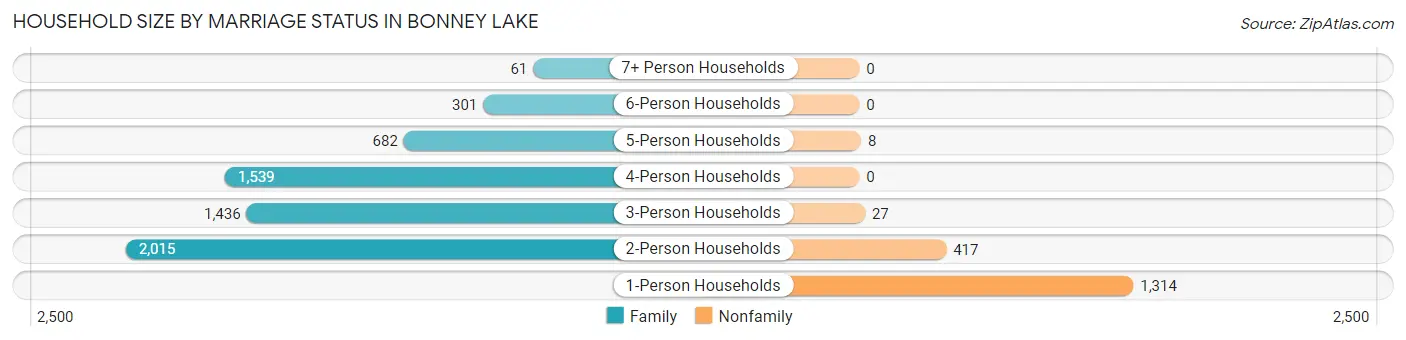
Household Size by Marriage Status in Bonney Lake
Out of a total of 7,800 households in Bonney Lake, 6,034 (77.4%) are family households, while 1,766 (22.6%) are nonfamily households. The most numerous type of family households are 2-person households, comprising 2,015, and the most common type of nonfamily households are 1-person households, comprising 1,314.
| Household Size | Family Households | Nonfamily Households |
| 1-Person Households | - | 1,314 (16.9%) |
| 2-Person Households | 2,015 (25.8%) | 417 (5.3%) |
| 3-Person Households | 1,436 (18.4%) | 27 (0.4%) |
| 4-Person Households | 1,539 (19.7%) | 0 (0.0%) |
| 5-Person Households | 682 (8.7%) | 8 (0.1%) |
| 6-Person Households | 301 (3.9%) | 0 (0.0%) |
| 7+ Person Households | 61 (0.8%) | 0 (0.0%) |
| Total | 6,034 (77.4%) | 1,766 (22.6%) |
Female Fertility in Bonney Lake
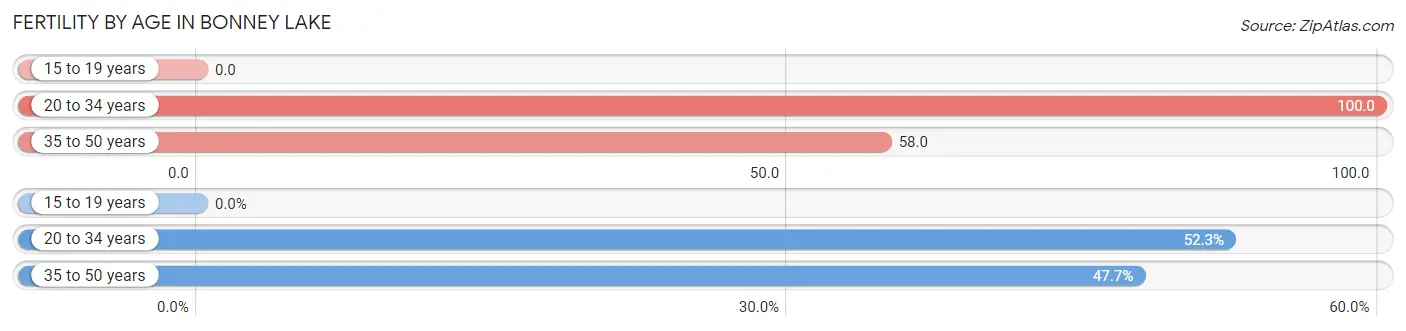
Fertility by Age in Bonney Lake
Average fertility rate in Bonney Lake is 62.0 births per 1,000 women. Women in the age bracket of 20 to 34 years have the highest fertility rate with 100.0 births per 1,000 women. Women in the age bracket of 20 to 34 years acount for 52.3% of all women with births.
| Age Bracket | Women with Births | Births / 1,000 Women |
| 15 to 19 years | 0 (0.0%) | 0.0 |
| 20 to 34 years | 181 (52.3%) | 100.0 |
| 35 to 50 years | 165 (47.7%) | 58.0 |
| Total | 346 (100.0%) | 62.0 |
Fertility by Age by Marriage Status in Bonney Lake
79.2% of women with births (346) in Bonney Lake are married. The highest percentage of unmarried women with births falls into 20 to 34 years age bracket with 39.8% of them unmarried at the time of birth, while the lowest percentage of unmarried women with births belong to 35 to 50 years age bracket with 0.0% of them unmarried.
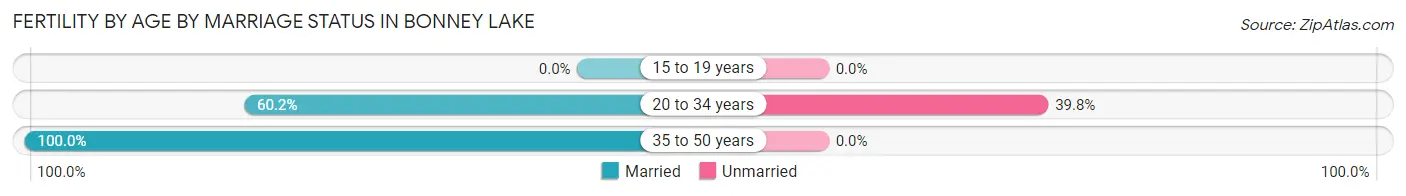
| Age Bracket | Married | Unmarried |
| 15 to 19 years | 0 (0.0%) | 0 (0.0%) |
| 20 to 34 years | 109 (60.2%) | 72 (39.8%) |
| 35 to 50 years | 165 (100.0%) | 0 (0.0%) |
| Total | 274 (79.2%) | 72 (20.8%) |
Fertility by Education in Bonney Lake
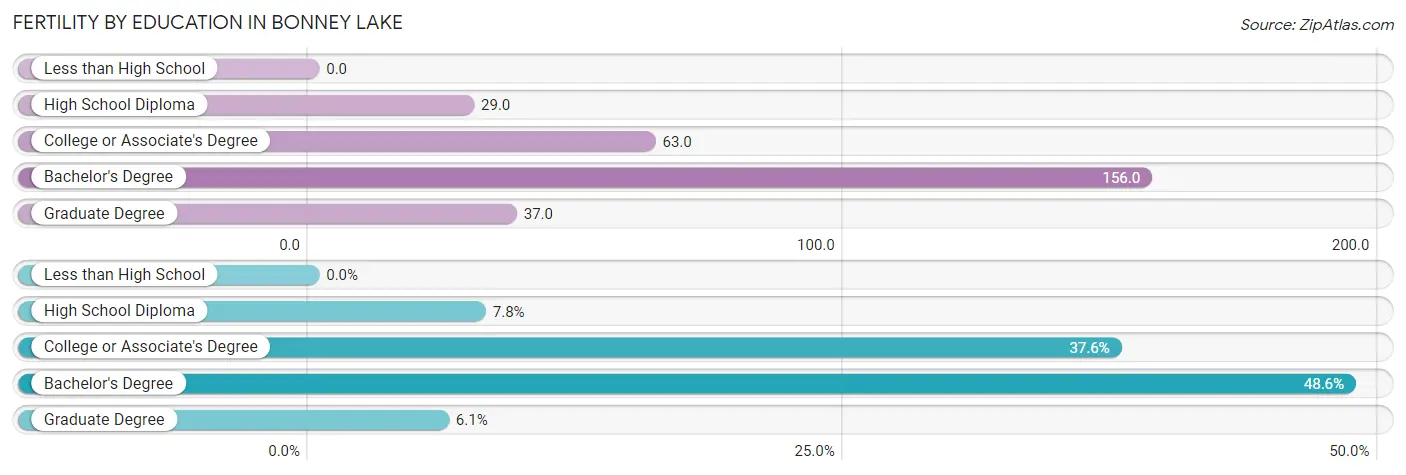
| Educational Attainment | Women with Births | Births / 1,000 Women |
| Less than High School | 0 (0.0%) | 0.0 |
| High School Diploma | 27 (7.8%) | 29.0 |
| College or Associate's Degree | 130 (37.6%) | 63.0 |
| Bachelor's Degree | 168 (48.5%) | 156.0 |
| Graduate Degree | 21 (6.1%) | 37.0 |
| Total | 346 (100.0%) | 62.0 |
Fertility by Education by Marriage Status in Bonney Lake
20.8% of women with births in Bonney Lake are unmarried. Women with the educational attainment of graduate degree are most likely to be married with 100.0% of them married at childbirth, while women with the educational attainment of high school diploma are least likely to be married with 100.0% of them unmarried at childbirth.
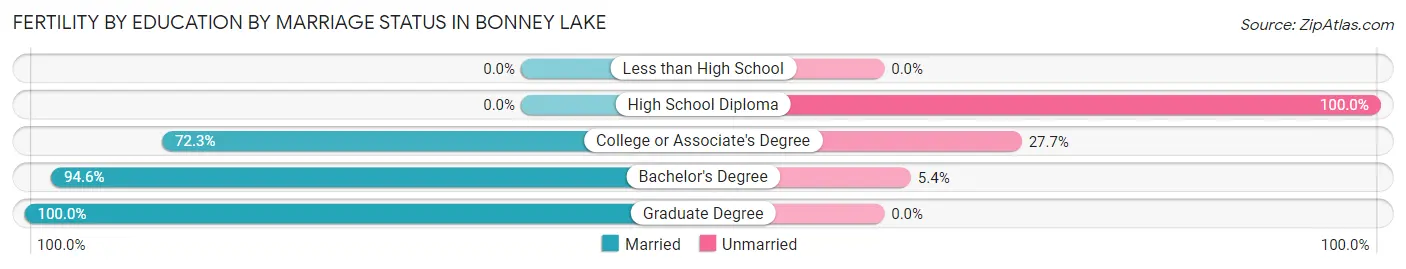
| Educational Attainment | Married | Unmarried |
| Less than High School | 0 (0.0%) | 0 (0.0%) |
| High School Diploma | 0 (0.0%) | 27 (100.0%) |
| College or Associate's Degree | 94 (72.3%) | 36 (27.7%) |
| Bachelor's Degree | 159 (94.6%) | 9 (5.4%) |
| Graduate Degree | 21 (100.0%) | 0 (0.0%) |
| Total | 274 (79.2%) | 72 (20.8%) |
Income in Bonney Lake
Income Overview in Bonney Lake
Per Capita Income in Bonney Lake is $49,627, while median incomes of families and households are $139,419 and $123,462 respectively.
| Characteristic | Number | Measure |
| Per Capita Income | 22,590 | $49,627 |
| Median Family Income | 6,034 | $139,419 |
| Mean Family Income | 6,034 | $159,121 |
| Median Household Income | 7,800 | $123,462 |
| Mean Household Income | 7,800 | $144,202 |
| Income Deficit | 6,034 | $0 |
| Wage / Income Gap (%) | 22,590 | 38.25% |
| Wage / Income Gap ($) | 22,590 | 61.75¢ per $1 |
| Gini / Inequality Index | 22,590 | 0.37 |
Earnings by Sex in Bonney Lake
Average Earnings in Bonney Lake are $61,859, $75,030 for men and $46,330 for women, a difference of 38.3%.

| Sex | Number | Average Earnings |
| Male | 7,046 (56.2%) | $75,030 |
| Female | 5,493 (43.8%) | $46,330 |
| Total | 12,539 (100.0%) | $61,859 |
Earnings by Sex by Income Bracket in Bonney Lake
The most common earnings brackets in Bonney Lake are $100,000+ for men (2,197 | 31.2%) and $100,000+ for women (1,013 | 18.4%).
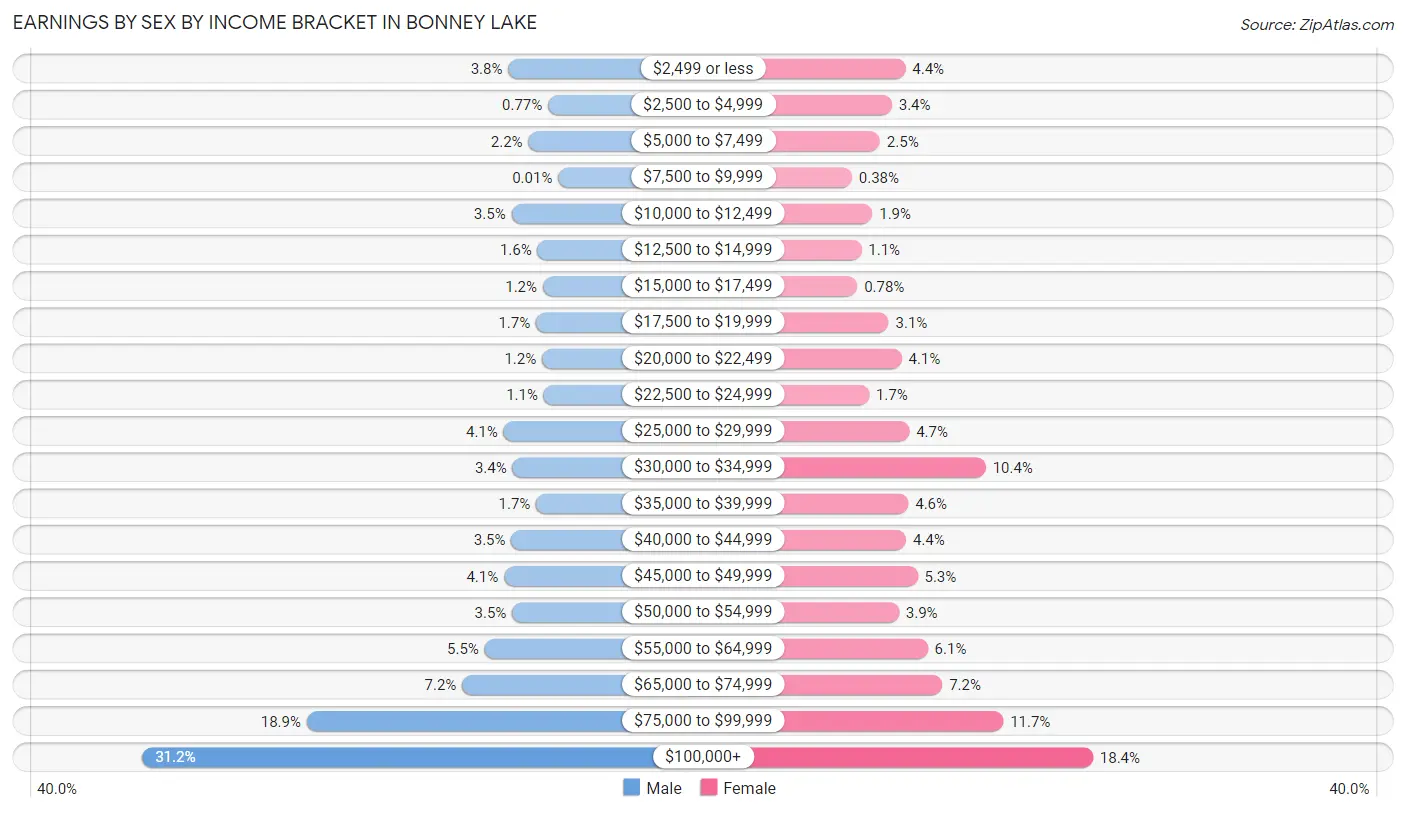
| Income | Male | Female |
| $2,499 or less | 264 (3.7%) | 241 (4.4%) |
| $2,500 to $4,999 | 54 (0.8%) | 185 (3.4%) |
| $5,000 to $7,499 | 158 (2.2%) | 136 (2.5%) |
| $7,500 to $9,999 | 1 (0.0%) | 21 (0.4%) |
| $10,000 to $12,499 | 247 (3.5%) | 105 (1.9%) |
| $12,500 to $14,999 | 110 (1.6%) | 60 (1.1%) |
| $15,000 to $17,499 | 82 (1.2%) | 43 (0.8%) |
| $17,500 to $19,999 | 118 (1.7%) | 172 (3.1%) |
| $20,000 to $22,499 | 86 (1.2%) | 225 (4.1%) |
| $22,500 to $24,999 | 77 (1.1%) | 91 (1.7%) |
| $25,000 to $29,999 | 289 (4.1%) | 257 (4.7%) |
| $30,000 to $34,999 | 242 (3.4%) | 572 (10.4%) |
| $35,000 to $39,999 | 117 (1.7%) | 253 (4.6%) |
| $40,000 to $44,999 | 248 (3.5%) | 244 (4.4%) |
| $45,000 to $49,999 | 287 (4.1%) | 291 (5.3%) |
| $50,000 to $54,999 | 244 (3.5%) | 214 (3.9%) |
| $55,000 to $64,999 | 389 (5.5%) | 333 (6.1%) |
| $65,000 to $74,999 | 508 (7.2%) | 393 (7.1%) |
| $75,000 to $99,999 | 1,328 (18.9%) | 644 (11.7%) |
| $100,000+ | 2,197 (31.2%) | 1,013 (18.4%) |
| Total | 7,046 (100.0%) | 5,493 (100.0%) |
Earnings by Sex by Educational Attainment in Bonney Lake
Average earnings in Bonney Lake are $84,852 for men and $53,424 for women, a difference of 37.0%. Men with an educational attainment of bachelor's degree enjoy the highest average annual earnings of $94,958, while those with high school diploma education earn the least with $70,621. Women with an educational attainment of graduate degree earn the most with the average annual earnings of $100,759, while those with less than high school education have the smallest earnings of $22,775.
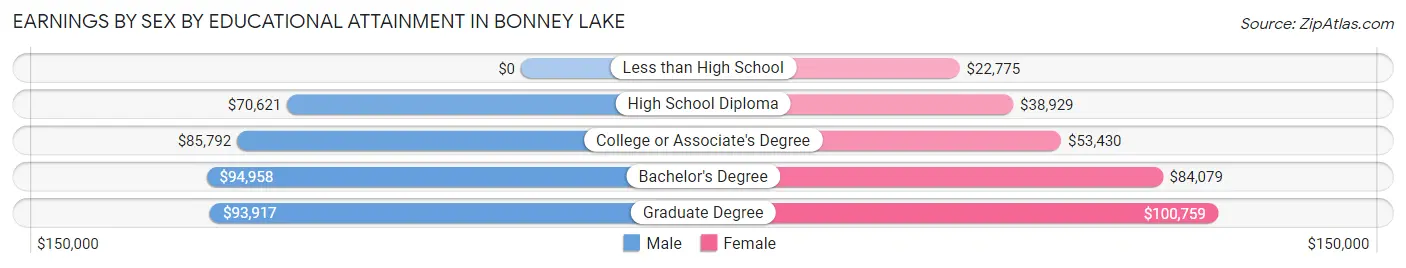
| Educational Attainment | Male Income | Female Income |
| Less than High School | - | - |
| High School Diploma | $70,621 | $38,929 |
| College or Associate's Degree | $85,792 | $53,430 |
| Bachelor's Degree | $94,958 | $84,079 |
| Graduate Degree | $93,917 | $100,759 |
| Total | $84,852 | $53,424 |
Family Income in Bonney Lake
Family Income Brackets in Bonney Lake
According to the Bonney Lake family income data, there are 1,629 families falling into the $100,000 to $149,999 income range, which is the most common income bracket and makes up 27.0% of all families.
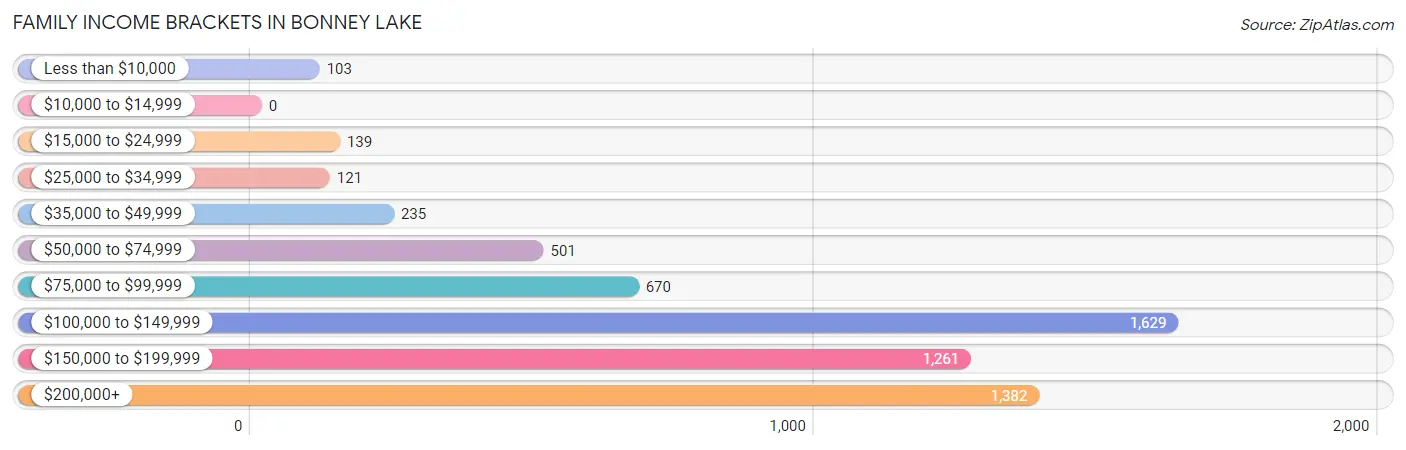
| Income Bracket | # Families | % Families |
| Less than $10,000 | 103 | 1.7% |
| $10,000 to $14,999 | 0 | 0.0% |
| $15,000 to $24,999 | 139 | 2.3% |
| $25,000 to $34,999 | 121 | 2.0% |
| $35,000 to $49,999 | 235 | 3.9% |
| $50,000 to $74,999 | 501 | 8.3% |
| $75,000 to $99,999 | 670 | 11.1% |
| $100,000 to $149,999 | 1,629 | 27.0% |
| $150,000 to $199,999 | 1,261 | 20.9% |
| $200,000+ | 1,382 | 22.9% |
Family Income by Famaliy Size in Bonney Lake
7+ person families (61 | 1.0%) account for the highest median family income in Bonney Lake with $250,001 per family, while 2-person families (2,162 | 35.8%) have the highest median income of $53,430 per family member.
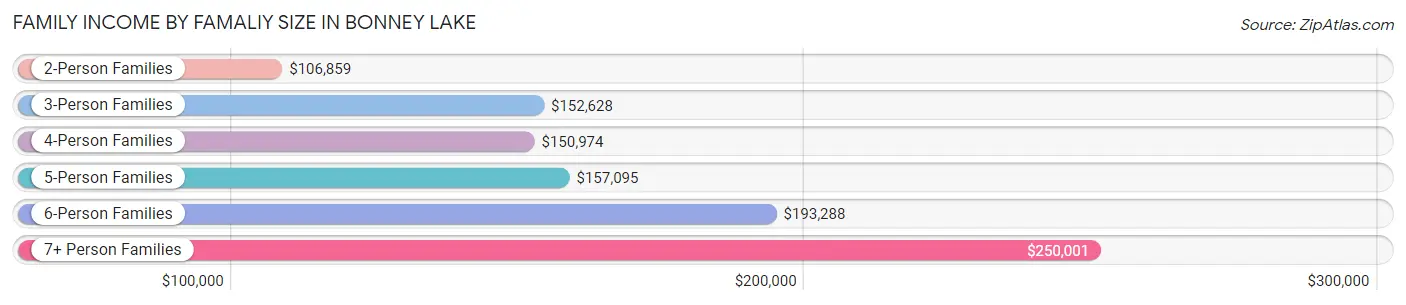
| Income Bracket | # Families | Median Income |
| 2-Person Families | 2,162 (35.8%) | $106,859 |
| 3-Person Families | 1,470 (24.4%) | $152,628 |
| 4-Person Families | 1,515 (25.1%) | $150,974 |
| 5-Person Families | 584 (9.7%) | $157,095 |
| 6-Person Families | 242 (4.0%) | $193,288 |
| 7+ Person Families | 61 (1.0%) | $250,001 |
| Total | 6,034 (100.0%) | $139,419 |
Family Income by Number of Earners in Bonney Lake
The median family income in Bonney Lake is $139,419, with families comprising 3+ earners (966) having the highest median family income of $182,292, while families with no earners (588) have the lowest median family income of $73,679, accounting for 16.0% and 9.7% of families, respectively.
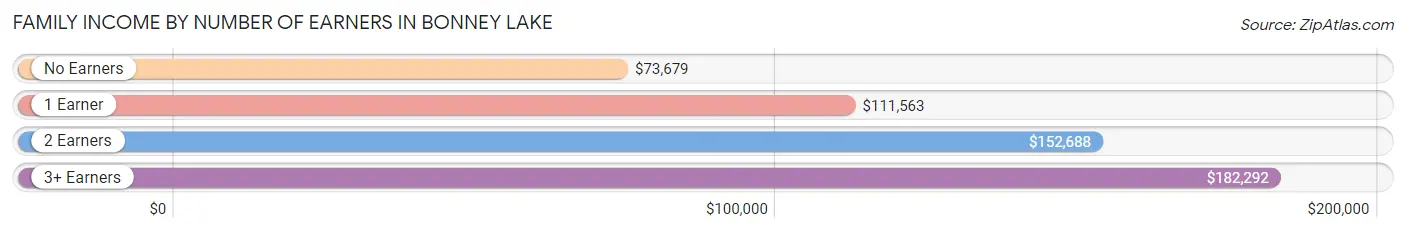
| Number of Earners | # Families | Median Income |
| No Earners | 588 (9.7%) | $73,679 |
| 1 Earner | 1,819 (30.1%) | $111,563 |
| 2 Earners | 2,661 (44.1%) | $152,688 |
| 3+ Earners | 966 (16.0%) | $182,292 |
| Total | 6,034 (100.0%) | $139,419 |
Household Income in Bonney Lake
Household Income Brackets in Bonney Lake
With 2,012 households falling in the category, the $100,000 to $149,999 income range is the most frequent in Bonney Lake, accounting for 25.8% of all households. In contrast, only 55 households (0.7%) fall into the $10,000 to $14,999 income bracket, making it the least populous group.
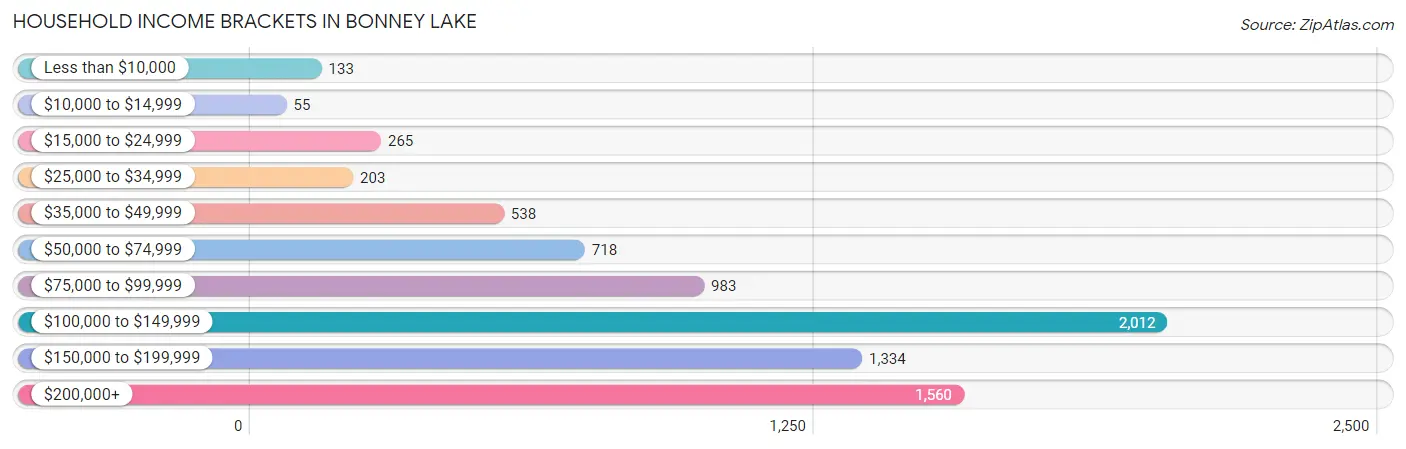
| Income Bracket | # Households | % Households |
| Less than $10,000 | 133 | 1.7% |
| $10,000 to $14,999 | 55 | 0.7% |
| $15,000 to $24,999 | 265 | 3.4% |
| $25,000 to $34,999 | 203 | 2.6% |
| $35,000 to $49,999 | 538 | 6.9% |
| $50,000 to $74,999 | 718 | 9.2% |
| $75,000 to $99,999 | 983 | 12.6% |
| $100,000 to $149,999 | 2,012 | 25.8% |
| $150,000 to $199,999 | 1,334 | 17.1% |
| $200,000+ | 1,560 | 20.0% |
Household Income by Householder Age in Bonney Lake
The median household income in Bonney Lake is $123,462, with the highest median household income of $146,445 found in the 45 to 64 years age bracket for the primary householder. A total of 3,180 households (40.8%) fall into this category. Meanwhile, the 65+ years age bracket for the primary householder has the lowest median household income of $80,258, with 1,452 households (18.6%) in this group.
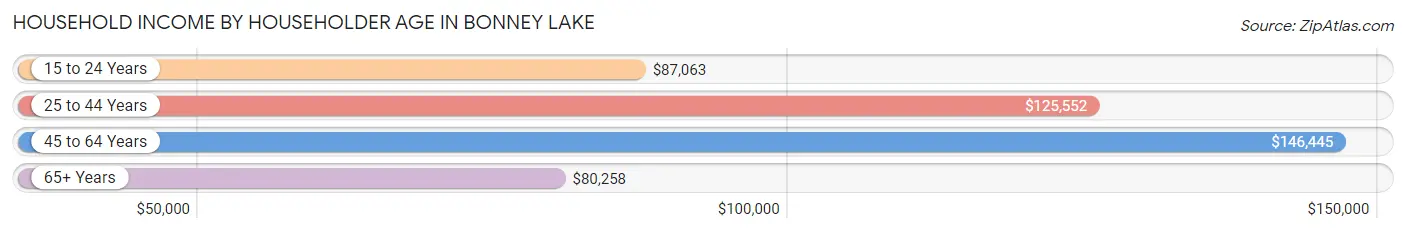
| Income Bracket | # Households | Median Income |
| 15 to 24 Years | 205 (2.6%) | $87,063 |
| 25 to 44 Years | 2,963 (38.0%) | $125,552 |
| 45 to 64 Years | 3,180 (40.8%) | $146,445 |
| 65+ Years | 1,452 (18.6%) | $80,258 |
| Total | 7,800 (100.0%) | $123,462 |
Poverty in Bonney Lake
Income Below Poverty by Sex and Age in Bonney Lake
With 5.4% poverty level for males and 4.2% for females among the residents of Bonney Lake, 6 to 11 year old males and 12 to 14 year old females are the most vulnerable to poverty, with 201 males (18.8%) and 55 females (11.3%) in their respective age groups living below the poverty level.
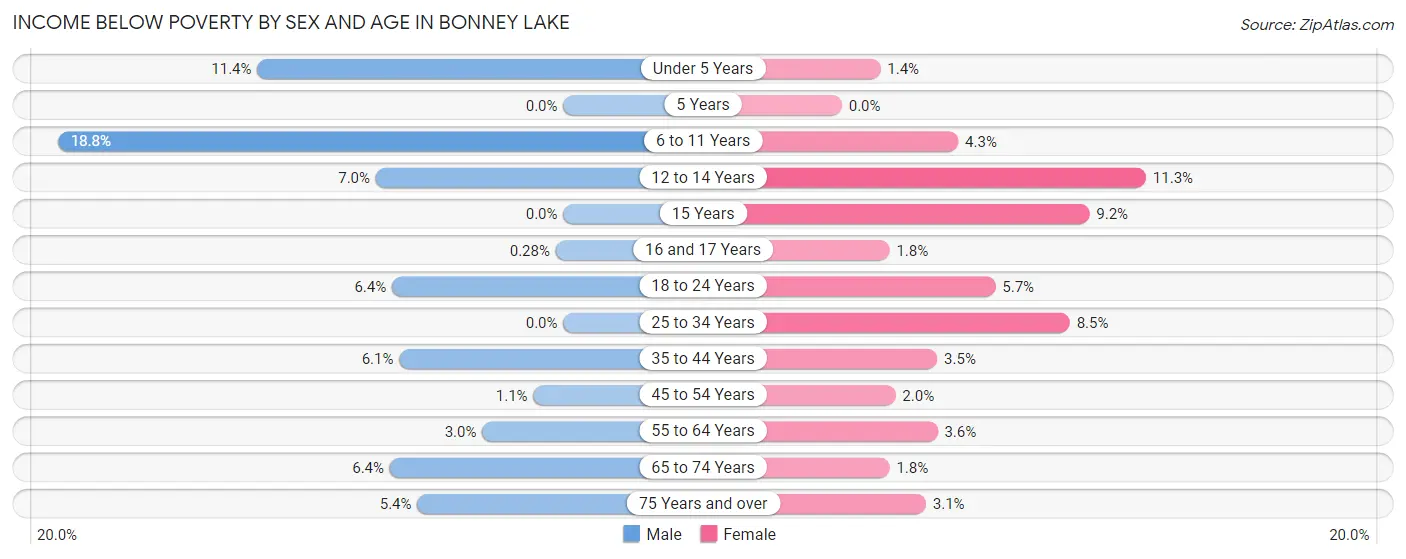
| Age Bracket | Male | Female |
| Under 5 Years | 77 (11.4%) | 10 (1.4%) |
| 5 Years | 0 (0.0%) | 0 (0.0%) |
| 6 to 11 Years | 201 (18.8%) | 49 (4.3%) |
| 12 to 14 Years | 35 (7.0%) | 55 (11.3%) |
| 15 Years | 0 (0.0%) | 17 (9.2%) |
| 16 and 17 Years | 1 (0.3%) | 8 (1.8%) |
| 18 to 24 Years | 64 (6.4%) | 40 (5.7%) |
| 25 to 34 Years | 0 (0.0%) | 119 (8.5%) |
| 35 to 44 Years | 113 (6.1%) | 64 (3.5%) |
| 45 to 54 Years | 18 (1.1%) | 33 (2.0%) |
| 55 to 64 Years | 47 (3.0%) | 38 (3.5%) |
| 65 to 74 Years | 44 (6.4%) | 16 (1.8%) |
| 75 Years and over | 20 (5.4%) | 13 (3.1%) |
| Total | 620 (5.4%) | 462 (4.2%) |
Income Above Poverty by Sex and Age in Bonney Lake
According to the poverty statistics in Bonney Lake, males aged 5 years and females aged 5 years are the age groups that are most secure financially, with 100.0% of males and 100.0% of females in these age groups living above the poverty line.
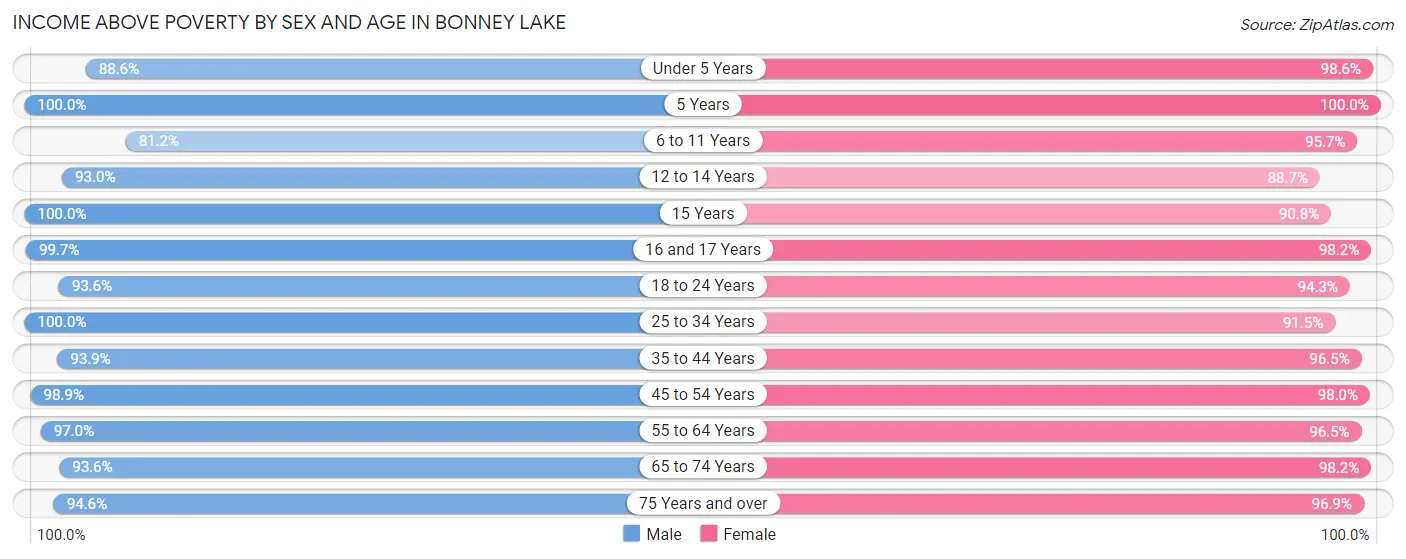
| Age Bracket | Male | Female |
| Under 5 Years | 601 (88.6%) | 691 (98.6%) |
| 5 Years | 225 (100.0%) | 159 (100.0%) |
| 6 to 11 Years | 870 (81.2%) | 1,085 (95.7%) |
| 12 to 14 Years | 468 (93.0%) | 432 (88.7%) |
| 15 Years | 229 (100.0%) | 168 (90.8%) |
| 16 and 17 Years | 357 (99.7%) | 445 (98.2%) |
| 18 to 24 Years | 942 (93.6%) | 662 (94.3%) |
| 25 to 34 Years | 1,277 (100.0%) | 1,287 (91.5%) |
| 35 to 44 Years | 1,741 (93.9%) | 1,742 (96.5%) |
| 45 to 54 Years | 1,598 (98.9%) | 1,625 (98.0%) |
| 55 to 64 Years | 1,514 (97.0%) | 1,031 (96.5%) |
| 65 to 74 Years | 639 (93.6%) | 890 (98.2%) |
| 75 Years and over | 349 (94.6%) | 403 (96.9%) |
| Total | 10,810 (94.6%) | 10,620 (95.8%) |
Income Below Poverty Among Married-Couple Families in Bonney Lake
The poverty statistics for married-couple families in Bonney Lake show that 0.5% or 25 of the total 4,682 families live below the poverty line. Families with no children have the highest poverty rate of 0.8%, comprising of 17 families. On the other hand, families with 3 or 4 children have the lowest poverty rate of 0.0%, which includes 0 families.
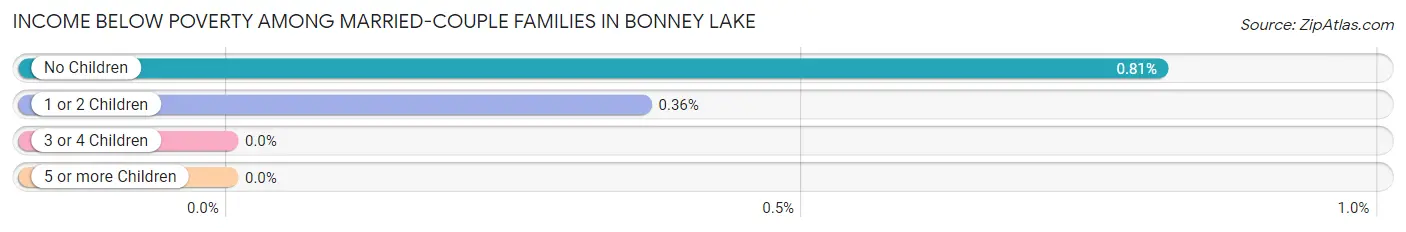
| Children | Above Poverty | Below Poverty |
| No Children | 2,084 (99.2%) | 17 (0.8%) |
| 1 or 2 Children | 2,207 (99.6%) | 8 (0.4%) |
| 3 or 4 Children | 319 (100.0%) | 0 (0.0%) |
| 5 or more Children | 47 (100.0%) | 0 (0.0%) |
| Total | 4,657 (99.5%) | 25 (0.5%) |
Income Below Poverty Among Single-Parent Households in Bonney Lake
According to the poverty data in Bonney Lake, 22.1% or 104 single-father households and 8.8% or 78 single-mother households are living below the poverty line. Among single-father households, those with 3 or 4 children have the highest poverty rate, with 48 households (38.7%) experiencing poverty. Likewise, among single-mother households, those with 3 or 4 children have the highest poverty rate, with 56 households (76.7%) falling below the poverty line.
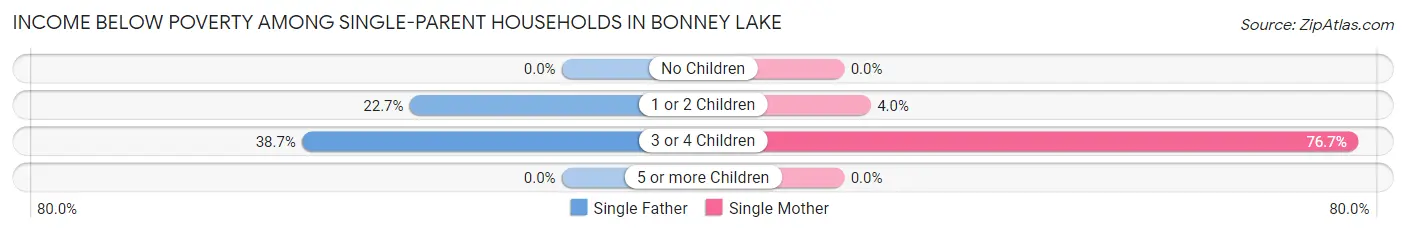
| Children | Single Father | Single Mother |
| No Children | 0 (0.0%) | 0 (0.0%) |
| 1 or 2 Children | 56 (22.7%) | 22 (4.0%) |
| 3 or 4 Children | 48 (38.7%) | 56 (76.7%) |
| 5 or more Children | 0 (0.0%) | 0 (0.0%) |
| Total | 104 (22.1%) | 78 (8.8%) |
Income Below Poverty Among Married-Couple vs Single-Parent Households in Bonney Lake
The poverty data for Bonney Lake shows that 25 of the married-couple family households (0.5%) and 182 of the single-parent households (13.5%) are living below the poverty level. Within the married-couple family households, those with no children have the highest poverty rate, with 17 households (0.8%) falling below the poverty line. Among the single-parent households, those with 3 or 4 children have the highest poverty rate, with 104 household (52.8%) living below poverty.
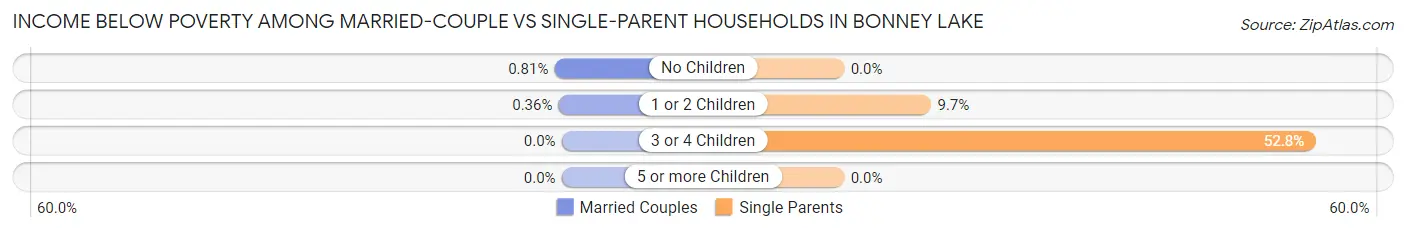
| Children | Married-Couple Families | Single-Parent Households |
| No Children | 17 (0.8%) | 0 (0.0%) |
| 1 or 2 Children | 8 (0.4%) | 78 (9.7%) |
| 3 or 4 Children | 0 (0.0%) | 104 (52.8%) |
| 5 or more Children | 0 (0.0%) | 0 (0.0%) |
| Total | 25 (0.5%) | 182 (13.5%) |
Employment Characteristics in Bonney Lake
Employment by Class of Employer in Bonney Lake
Among the 11,606 employed individuals in Bonney Lake, private company employees (8,373 | 72.1%), local government employees (1,201 | 10.3%), and not-for-profit organizations (511 | 4.4%) make up the most common classes of employment.
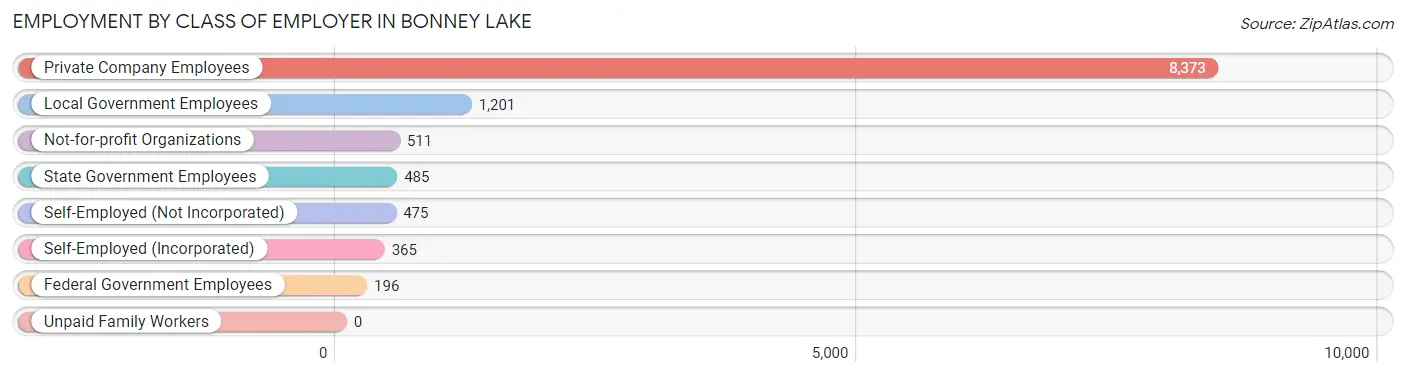
| Employer Class | # Employees | % Employees |
| Private Company Employees | 8,373 | 72.1% |
| Self-Employed (Incorporated) | 365 | 3.1% |
| Self-Employed (Not Incorporated) | 475 | 4.1% |
| Not-for-profit Organizations | 511 | 4.4% |
| Local Government Employees | 1,201 | 10.3% |
| State Government Employees | 485 | 4.2% |
| Federal Government Employees | 196 | 1.7% |
| Unpaid Family Workers | 0 | 0.0% |
| Total | 11,606 | 100.0% |
Employment Status by Age in Bonney Lake
According to the labor force statistics for Bonney Lake, out of the total population over 16 years of age (17,140), 70.6% or 12,101 individuals are in the labor force, with 2.8% or 339 of them unemployed. The age group with the highest labor force participation rate is 45 to 54 years, with 91.7% or 3,002 individuals in the labor force. Within the labor force, the 16 to 19 years age range has the highest percentage of unemployed individuals, with 7.4% or 49 of them being unemployed.
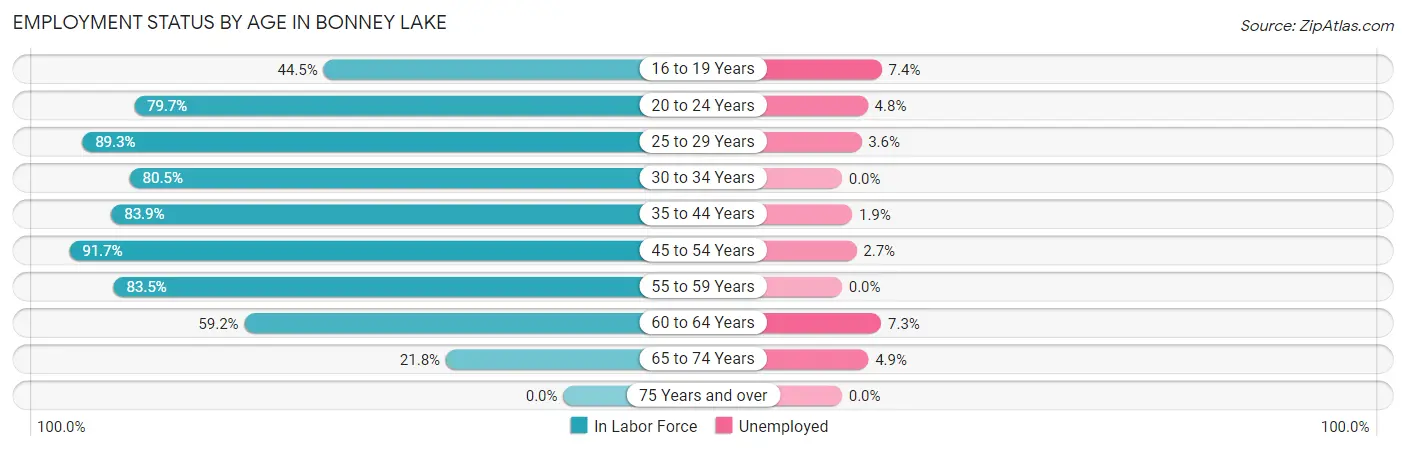
| Age Bracket | In Labor Force | Unemployed |
| 16 to 19 Years | 659 (44.5%) | 49 (7.4%) |
| 20 to 24 Years | 826 (79.7%) | 40 (4.8%) |
| 25 to 29 Years | 1,143 (89.3%) | 41 (3.6%) |
| 30 to 34 Years | 1,129 (80.5%) | 0 (0.0%) |
| 35 to 44 Years | 3,071 (83.9%) | 58 (1.9%) |
| 45 to 54 Years | 3,002 (91.7%) | 81 (2.7%) |
| 55 to 59 Years | 1,228 (83.5%) | 0 (0.0%) |
| 60 to 64 Years | 686 (59.2%) | 50 (7.3%) |
| 65 to 74 Years | 346 (21.8%) | 17 (4.9%) |
| 75 Years and over | 0 (0.0%) | 0 (0.0%) |
| Total | 12,101 (70.6%) | 339 (2.8%) |
Employment Status by Educational Attainment in Bonney Lake
According to labor force statistics for Bonney Lake, 83.8% of individuals (10,263) out of the total population between 25 and 64 years of age (12,247) are in the labor force, with 2.3% or 236 of them being unemployed. The group with the highest labor force participation rate are those with the educational attainment of less than high school, with 91.5% or 496 individuals in the labor force. Within the labor force, individuals with less than high school education have the highest percentage of unemployment, with 14.5% or 72 of them being unemployed.
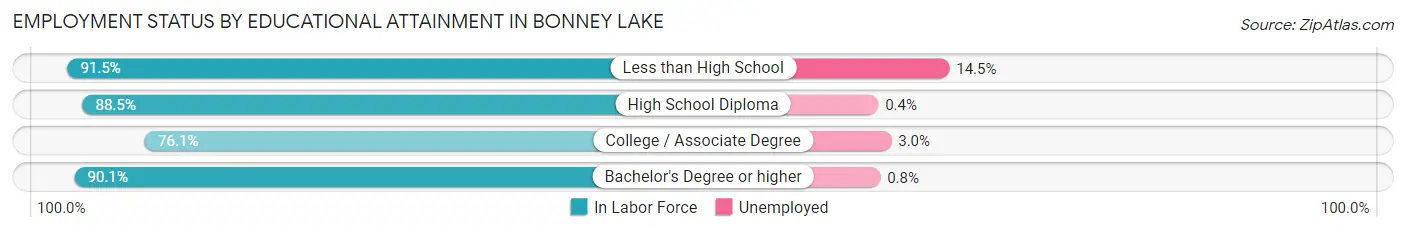
| Educational Attainment | In Labor Force | Unemployed |
| Less than High School | 496 (91.5%) | 79 (14.5%) |
| High School Diploma | 2,532 (88.5%) | 11 (0.4%) |
| College / Associate Degree | 4,002 (76.1%) | 158 (3.0%) |
| Bachelor's Degree or higher | 3,230 (90.1%) | 29 (0.8%) |
| Total | 10,263 (83.8%) | 282 (2.3%) |
Employment Occupations by Sex in Bonney Lake
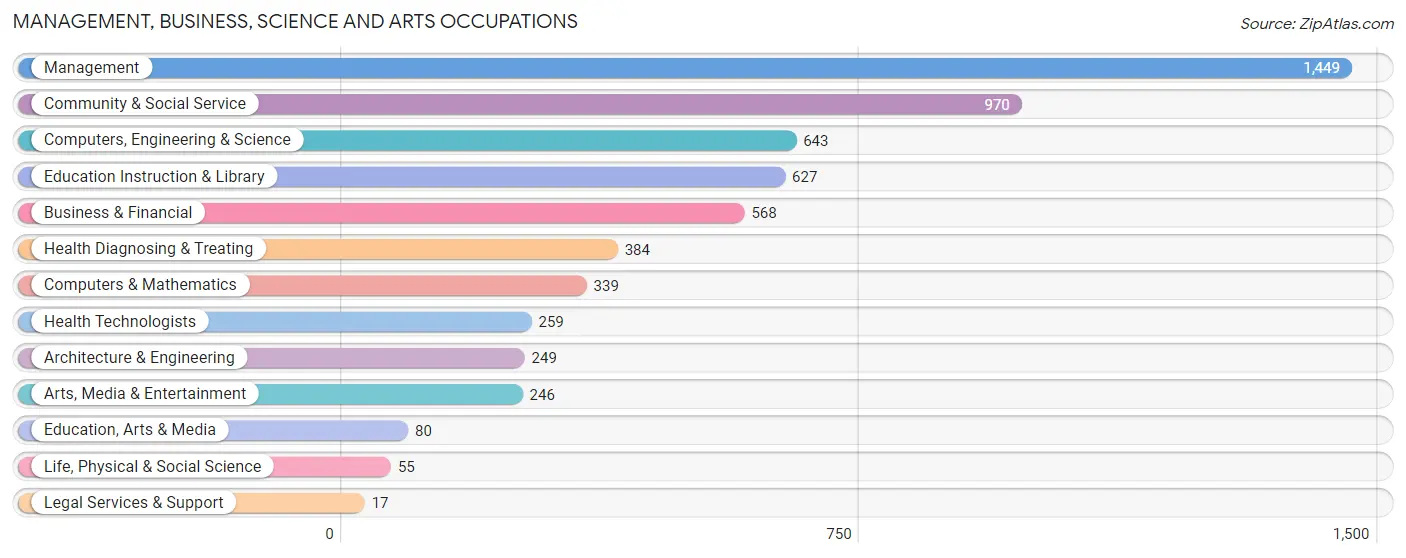
Management, Business, Science and Arts Occupations
The most common Management, Business, Science and Arts occupations in Bonney Lake are Management (1,449 | 12.3%), Community & Social Service (970 | 8.3%), Computers, Engineering & Science (643 | 5.5%), Education Instruction & Library (627 | 5.3%), and Business & Financial (568 | 4.8%).
Management, Business, Science and Arts Occupations by Sex
Within the Management, Business, Science and Arts occupations in Bonney Lake, the most male-oriented occupations are Computers & Mathematics (90.3%), Architecture & Engineering (86.4%), and Computers, Engineering & Science (84.1%), while the most female-oriented occupations are Legal Services & Support (100.0%), Health Technologists (92.3%), and Health Diagnosing & Treating (89.6%).
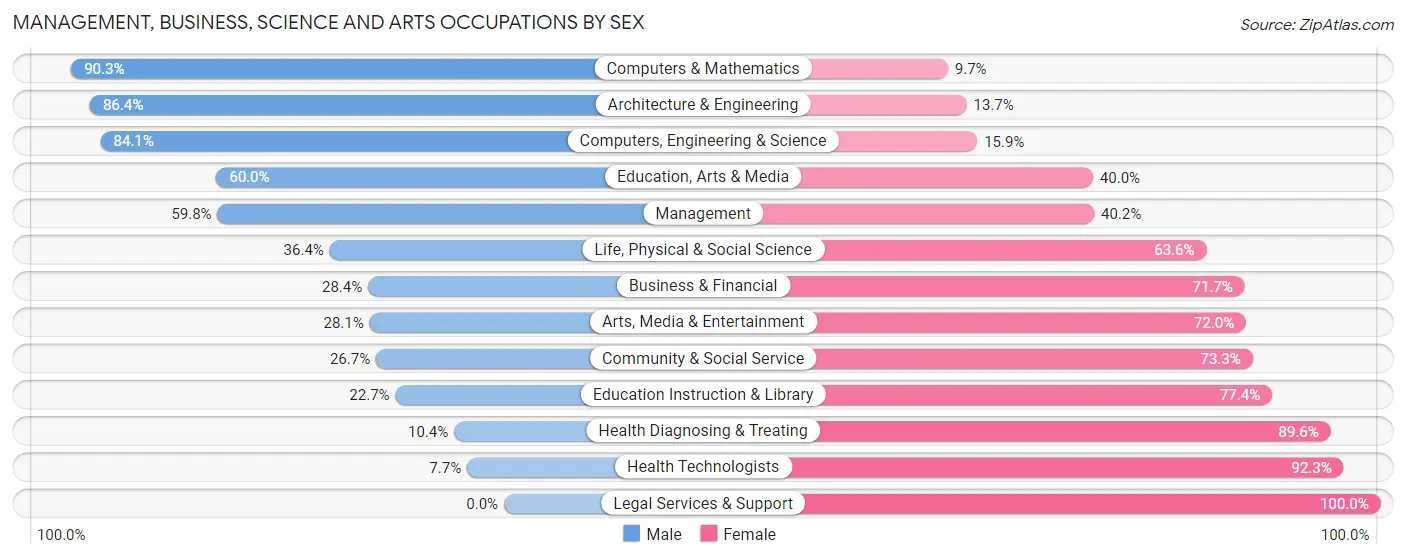
| Occupation | Male | Female |
| Management | 866 (59.8%) | 583 (40.2%) |
| Business & Financial | 161 (28.3%) | 407 (71.7%) |
| Computers, Engineering & Science | 541 (84.1%) | 102 (15.9%) |
| Computers & Mathematics | 306 (90.3%) | 33 (9.7%) |
| Architecture & Engineering | 215 (86.4%) | 34 (13.7%) |
| Life, Physical & Social Science | 20 (36.4%) | 35 (63.6%) |
| Community & Social Service | 259 (26.7%) | 711 (73.3%) |
| Education, Arts & Media | 48 (60.0%) | 32 (40.0%) |
| Legal Services & Support | 0 (0.0%) | 17 (100.0%) |
| Education Instruction & Library | 142 (22.7%) | 485 (77.3%) |
| Arts, Media & Entertainment | 69 (28.1%) | 177 (72.0%) |
| Health Diagnosing & Treating | 40 (10.4%) | 344 (89.6%) |
| Health Technologists | 20 (7.7%) | 239 (92.3%) |
| Total (Category) | 1,867 (46.5%) | 2,147 (53.5%) |
| Total (Overall) | 6,679 (56.9%) | 5,065 (43.1%) |
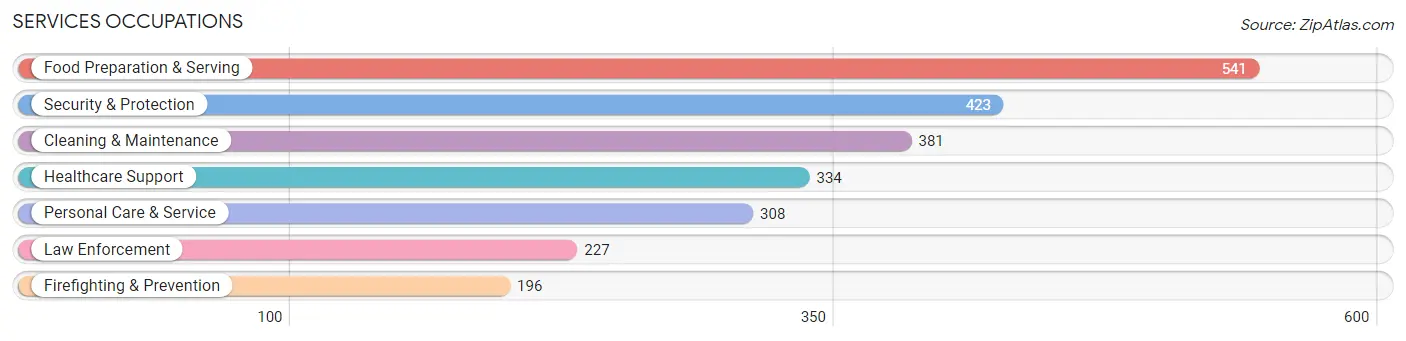
Services Occupations
The most common Services occupations in Bonney Lake are Food Preparation & Serving (541 | 4.6%), Security & Protection (423 | 3.6%), Cleaning & Maintenance (381 | 3.2%), Healthcare Support (334 | 2.8%), and Personal Care & Service (308 | 2.6%).
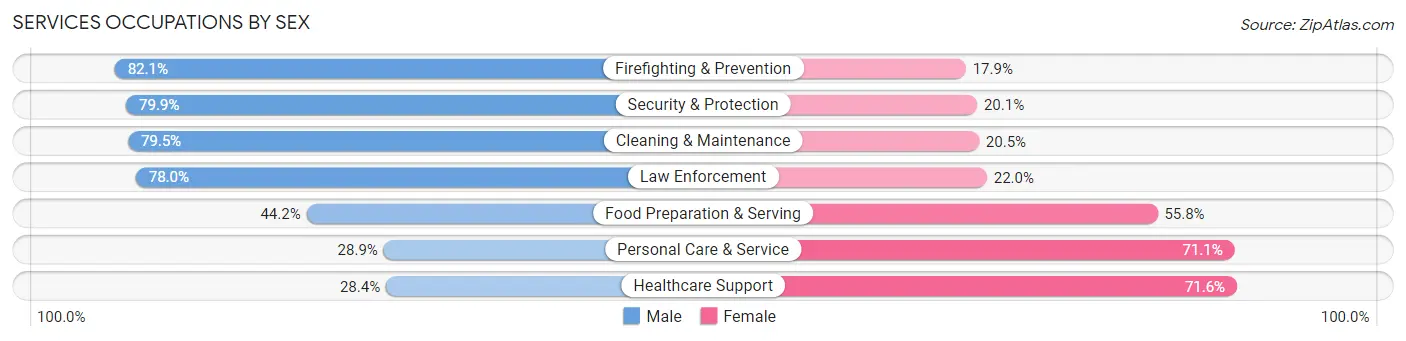
Services Occupations by Sex
Within the Services occupations in Bonney Lake, the most male-oriented occupations are Firefighting & Prevention (82.1%), Security & Protection (79.9%), and Cleaning & Maintenance (79.5%), while the most female-oriented occupations are Healthcare Support (71.6%), Personal Care & Service (71.1%), and Food Preparation & Serving (55.8%).
| Occupation | Male | Female |
| Healthcare Support | 95 (28.4%) | 239 (71.6%) |
| Security & Protection | 338 (79.9%) | 85 (20.1%) |
| Firefighting & Prevention | 161 (82.1%) | 35 (17.9%) |
| Law Enforcement | 177 (78.0%) | 50 (22.0%) |
| Food Preparation & Serving | 239 (44.2%) | 302 (55.8%) |
| Cleaning & Maintenance | 303 (79.5%) | 78 (20.5%) |
| Personal Care & Service | 89 (28.9%) | 219 (71.1%) |
| Total (Category) | 1,064 (53.5%) | 923 (46.5%) |
| Total (Overall) | 6,679 (56.9%) | 5,065 (43.1%) |
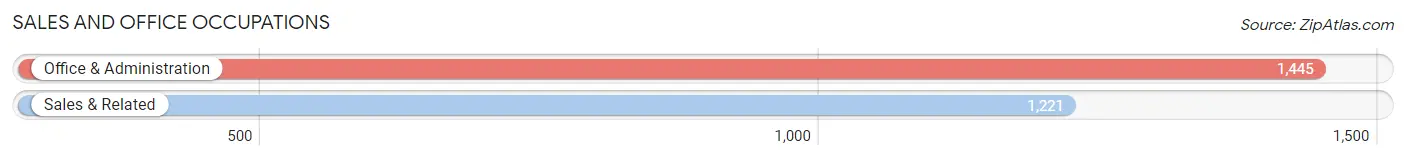
Sales and Office Occupations
The most common Sales and Office occupations in Bonney Lake are Office & Administration (1,445 | 12.3%), and Sales & Related (1,221 | 10.4%).
Sales and Office Occupations by Sex

| Occupation | Male | Female |
| Sales & Related | 703 (57.6%) | 518 (42.4%) |
| Office & Administration | 330 (22.8%) | 1,115 (77.2%) |
| Total (Category) | 1,033 (38.8%) | 1,633 (61.3%) |
| Total (Overall) | 6,679 (56.9%) | 5,065 (43.1%) |
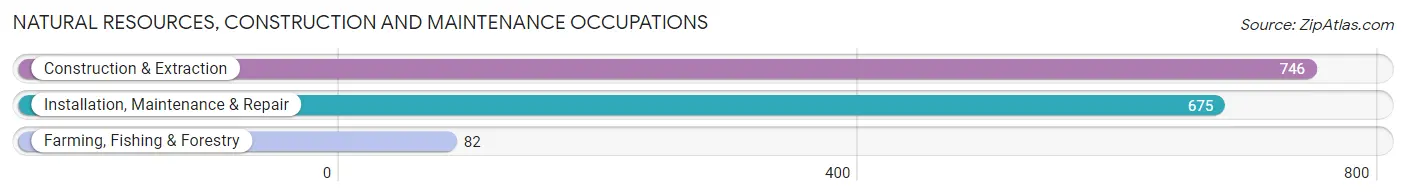
Natural Resources, Construction and Maintenance Occupations
The most common Natural Resources, Construction and Maintenance occupations in Bonney Lake are Construction & Extraction (746 | 6.4%), Installation, Maintenance & Repair (675 | 5.8%), and Farming, Fishing & Forestry (82 | 0.7%).
Natural Resources, Construction and Maintenance Occupations by Sex
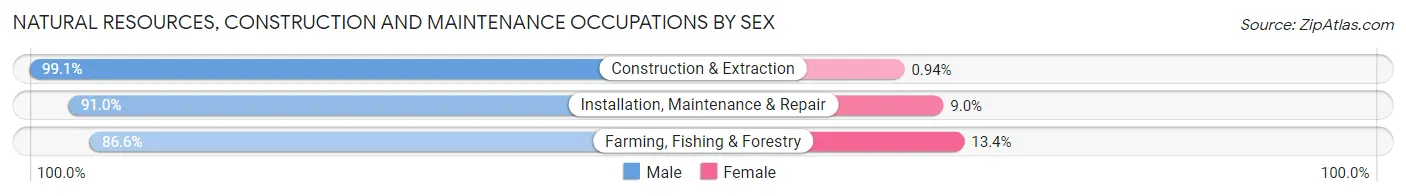
| Occupation | Male | Female |
| Farming, Fishing & Forestry | 71 (86.6%) | 11 (13.4%) |
| Construction & Extraction | 739 (99.1%) | 7 (0.9%) |
| Installation, Maintenance & Repair | 614 (91.0%) | 61 (9.0%) |
| Total (Category) | 1,424 (94.7%) | 79 (5.3%) |
| Total (Overall) | 6,679 (56.9%) | 5,065 (43.1%) |
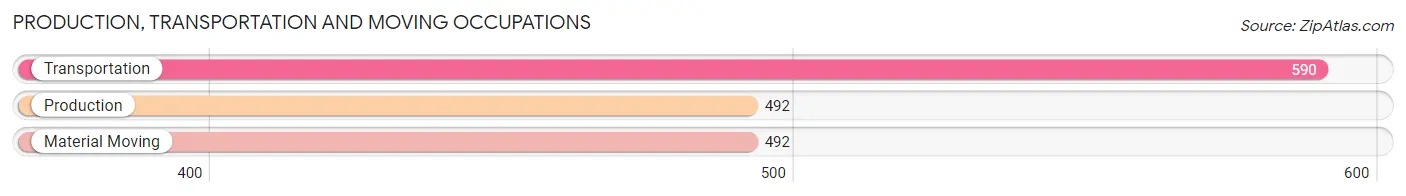
Production, Transportation and Moving Occupations
The most common Production, Transportation and Moving occupations in Bonney Lake are Transportation (590 | 5.0%), Production (492 | 4.2%), and Material Moving (492 | 4.2%).
Production, Transportation and Moving Occupations by Sex
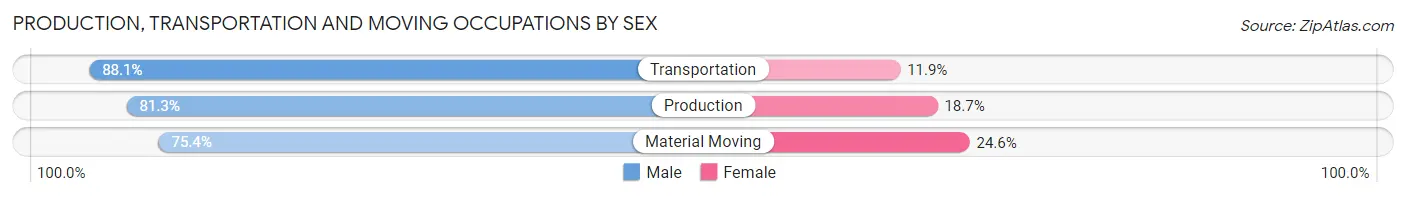
| Occupation | Male | Female |
| Production | 400 (81.3%) | 92 (18.7%) |
| Transportation | 520 (88.1%) | 70 (11.9%) |
| Material Moving | 371 (75.4%) | 121 (24.6%) |
| Total (Category) | 1,291 (82.0%) | 283 (18.0%) |
| Total (Overall) | 6,679 (56.9%) | 5,065 (43.1%) |
Employment Industries by Sex in Bonney Lake
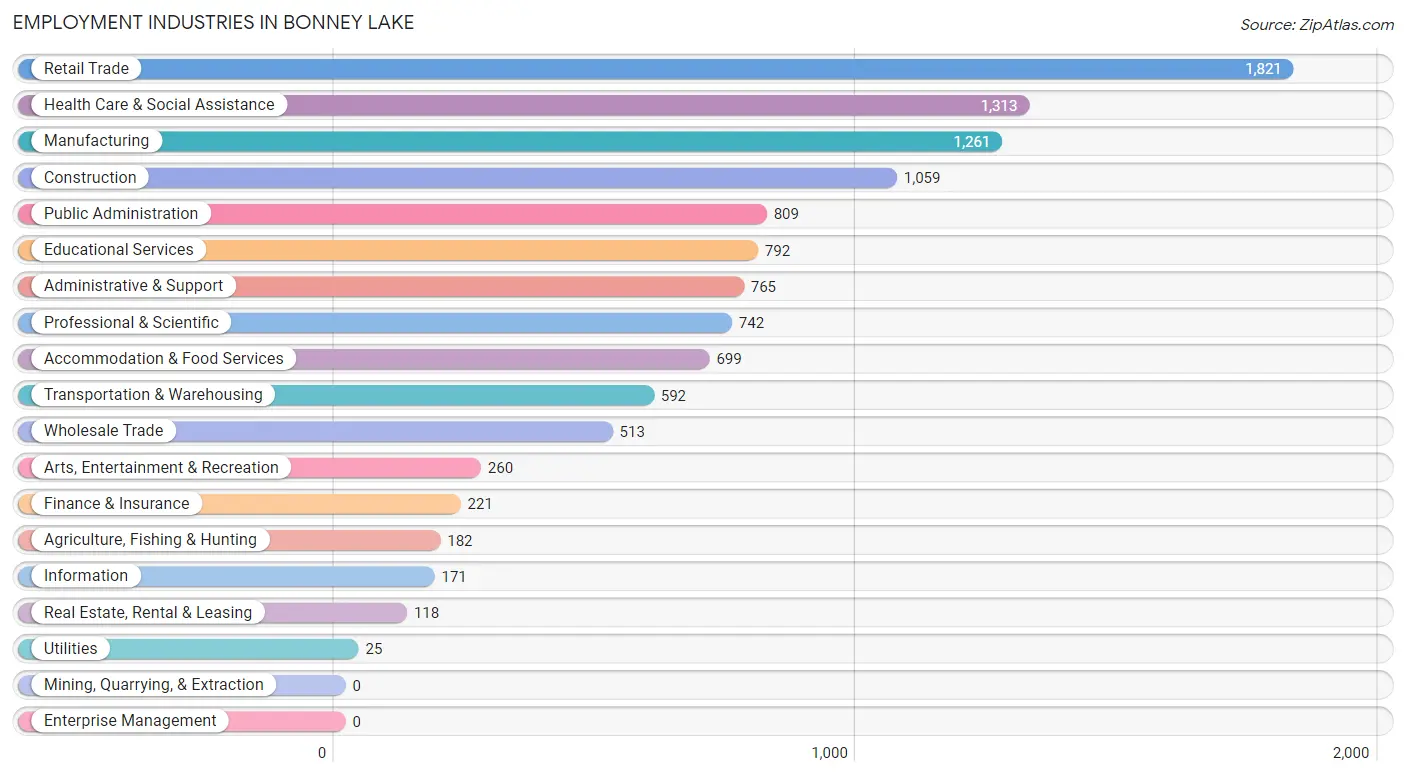
Employment Industries in Bonney Lake
The major employment industries in Bonney Lake include Retail Trade (1,821 | 15.5%), Health Care & Social Assistance (1,313 | 11.2%), Manufacturing (1,261 | 10.7%), Construction (1,059 | 9.0%), and Public Administration (809 | 6.9%).
Employment Industries by Sex in Bonney Lake
The Bonney Lake industries that see more men than women are Information (100.0%), Construction (85.0%), and Agriculture, Fishing & Hunting (82.4%), whereas the industries that tend to have a higher number of women are Utilities (100.0%), Educational Services (79.8%), and Health Care & Social Assistance (78.2%).
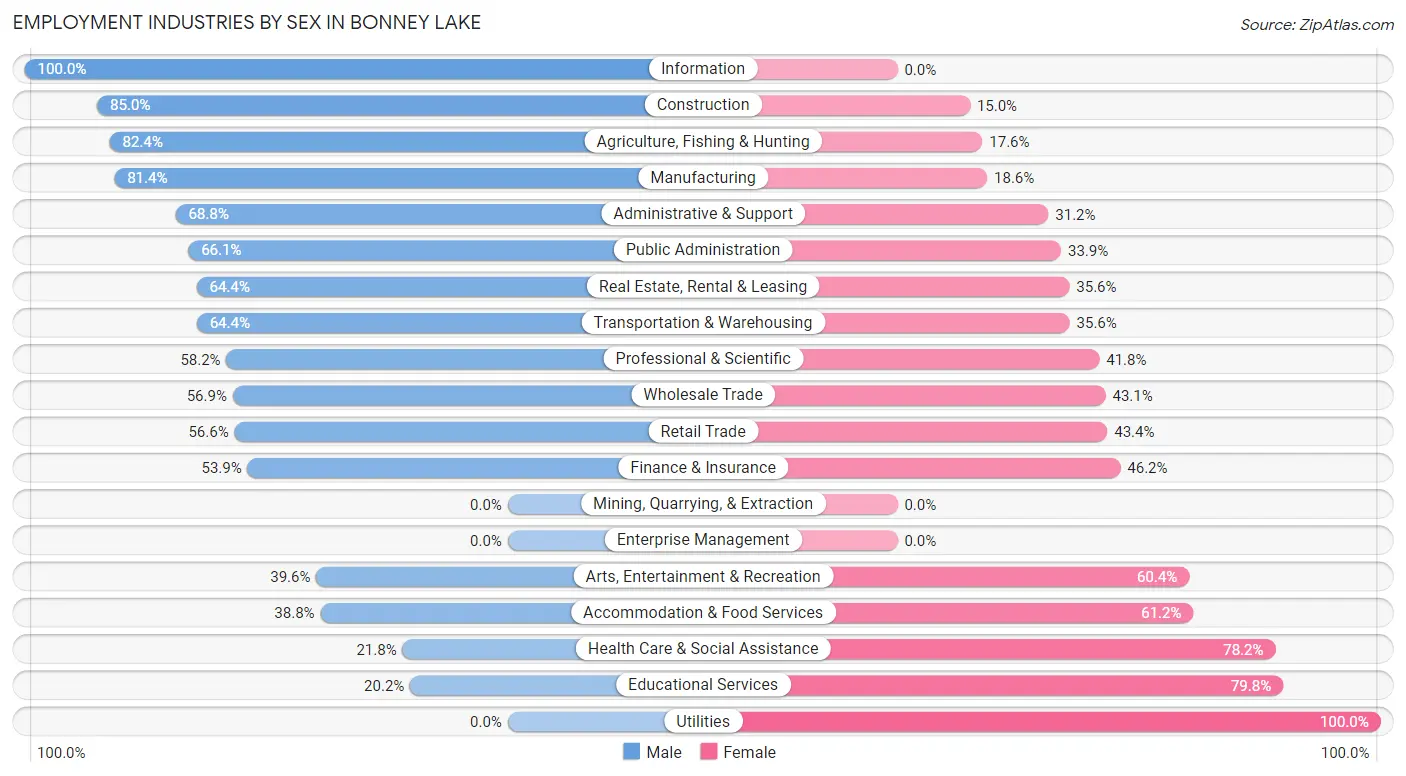
| Industry | Male | Female |
| Agriculture, Fishing & Hunting | 150 (82.4%) | 32 (17.6%) |
| Mining, Quarrying, & Extraction | 0 (0.0%) | 0 (0.0%) |
| Construction | 900 (85.0%) | 159 (15.0%) |
| Manufacturing | 1,027 (81.4%) | 234 (18.6%) |
| Wholesale Trade | 292 (56.9%) | 221 (43.1%) |
| Retail Trade | 1,030 (56.6%) | 791 (43.4%) |
| Transportation & Warehousing | 381 (64.4%) | 211 (35.6%) |
| Utilities | 0 (0.0%) | 25 (100.0%) |
| Information | 171 (100.0%) | 0 (0.0%) |
| Finance & Insurance | 119 (53.8%) | 102 (46.2%) |
| Real Estate, Rental & Leasing | 76 (64.4%) | 42 (35.6%) |
| Professional & Scientific | 432 (58.2%) | 310 (41.8%) |
| Enterprise Management | 0 (0.0%) | 0 (0.0%) |
| Administrative & Support | 526 (68.8%) | 239 (31.2%) |
| Educational Services | 160 (20.2%) | 632 (79.8%) |
| Health Care & Social Assistance | 286 (21.8%) | 1,027 (78.2%) |
| Arts, Entertainment & Recreation | 103 (39.6%) | 157 (60.4%) |
| Accommodation & Food Services | 271 (38.8%) | 428 (61.2%) |
| Public Administration | 535 (66.1%) | 274 (33.9%) |
| Total | 6,679 (56.9%) | 5,065 (43.1%) |
Education in Bonney Lake
School Enrollment in Bonney Lake
The most common levels of schooling among the 6,197 students in Bonney Lake are middle school (1,520 | 24.5%), high school (1,482 | 23.9%), and elementary school (1,447 | 23.4%).
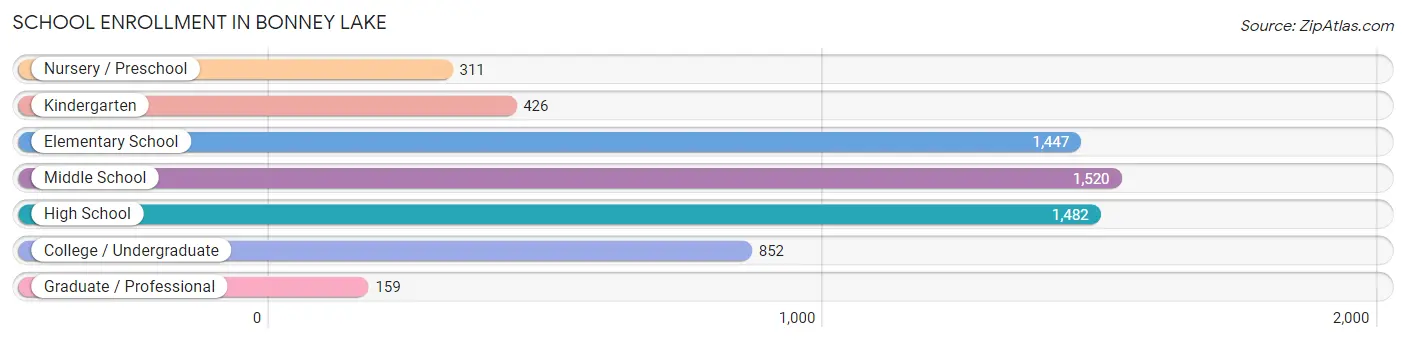
| School Level | # Students | % Students |
| Nursery / Preschool | 311 | 5.0% |
| Kindergarten | 426 | 6.9% |
| Elementary School | 1,447 | 23.4% |
| Middle School | 1,520 | 24.5% |
| High School | 1,482 | 23.9% |
| College / Undergraduate | 852 | 13.8% |
| Graduate / Professional | 159 | 2.6% |
| Total | 6,197 | 100.0% |
School Enrollment by Age by Funding Source in Bonney Lake
Out of a total of 6,197 students who are enrolled in schools in Bonney Lake, 651 (10.5%) attend a private institution, while the remaining 5,546 (89.5%) are enrolled in public schools. The age group of 20 to 24 year olds has the highest likelihood of being enrolled in private schools, with 90 (33.3% in the age bracket) enrolled. Conversely, the age group of 15 to 17 year olds has the lowest likelihood of being enrolled in a private school, with 1,188 (97.0% in the age bracket) attending a public institution.
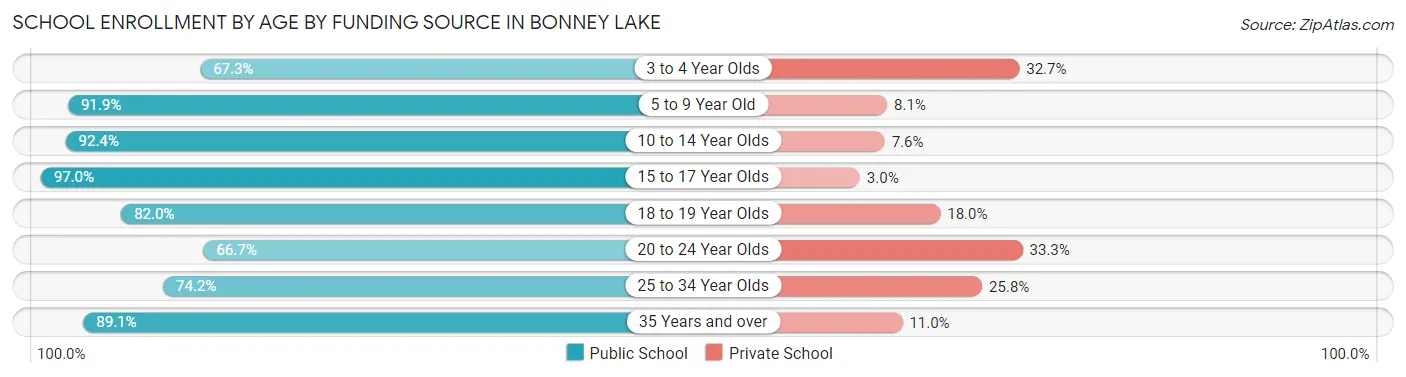
| Age Bracket | Public School | Private School |
| 3 to 4 Year Olds | 181 (67.3%) | 88 (32.7%) |
| 5 to 9 Year Old | 1,511 (91.9%) | 133 (8.1%) |
| 10 to 14 Year Olds | 1,716 (92.4%) | 142 (7.6%) |
| 15 to 17 Year Olds | 1,188 (97.0%) | 37 (3.0%) |
| 18 to 19 Year Olds | 401 (82.0%) | 88 (18.0%) |
| 20 to 24 Year Olds | 180 (66.7%) | 90 (33.3%) |
| 25 to 34 Year Olds | 118 (74.2%) | 41 (25.8%) |
| 35 Years and over | 252 (89.0%) | 31 (11.0%) |
| Total | 5,546 (89.5%) | 651 (10.5%) |
Educational Attainment by Field of Study in Bonney Lake
Business (876 | 20.1%), education (620 | 14.2%), arts & humanities (403 | 9.2%), social sciences (327 | 7.5%), and psychology (309 | 7.1%) are the most common fields of study among 4,360 individuals in Bonney Lake who have obtained a bachelor's degree or higher.

| Field of Study | # Graduates | % Graduates |
| Computers & Mathematics | 131 | 3.0% |
| Bio, Nature & Agricultural | 246 | 5.6% |
| Physical & Health Sciences | 88 | 2.0% |
| Psychology | 309 | 7.1% |
| Social Sciences | 327 | 7.5% |
| Engineering | 211 | 4.8% |
| Multidisciplinary Studies | 63 | 1.4% |
| Science & Technology | 247 | 5.7% |
| Business | 876 | 20.1% |
| Education | 620 | 14.2% |
| Literature & Languages | 206 | 4.7% |
| Liberal Arts & History | 297 | 6.8% |
| Visual & Performing Arts | 182 | 4.2% |
| Communications | 154 | 3.5% |
| Arts & Humanities | 403 | 9.2% |
| Total | 4,360 | 100.0% |
Transportation & Commute in Bonney Lake
Vehicle Availability by Sex in Bonney Lake
The most prevalent vehicle ownership categories in Bonney Lake are males with 2 vehicles (2,615, accounting for 39.7%) and females with 2 vehicles (1,788, making up 52.0%).
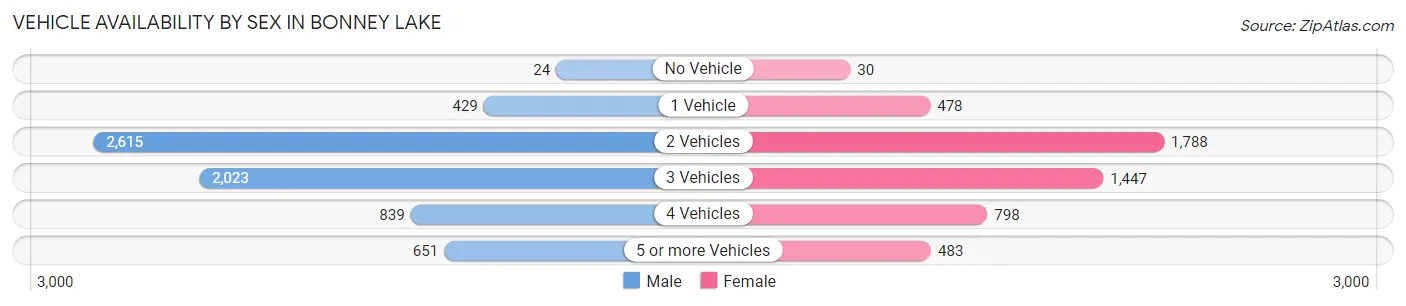
| Vehicles Available | Male | Female |
| No Vehicle | 24 (0.4%) | 30 (0.6%) |
| 1 Vehicle | 429 (6.5%) | 478 (9.5%) |
| 2 Vehicles | 2,615 (39.7%) | 1,788 (35.6%) |
| 3 Vehicles | 2,023 (30.7%) | 1,447 (28.8%) |
| 4 Vehicles | 839 (12.8%) | 798 (15.9%) |
| 5 or more Vehicles | 651 (9.9%) | 483 (9.6%) |
| Total | 6,581 (100.0%) | 5,024 (100.0%) |
Commute Time in Bonney Lake
The most frequently occuring commute durations in Bonney Lake are 30 to 34 minutes (1,701 commuters, 17.2%), 45 to 59 minutes (1,644 commuters, 16.6%), and 20 to 24 minutes (1,383 commuters, 14.0%).
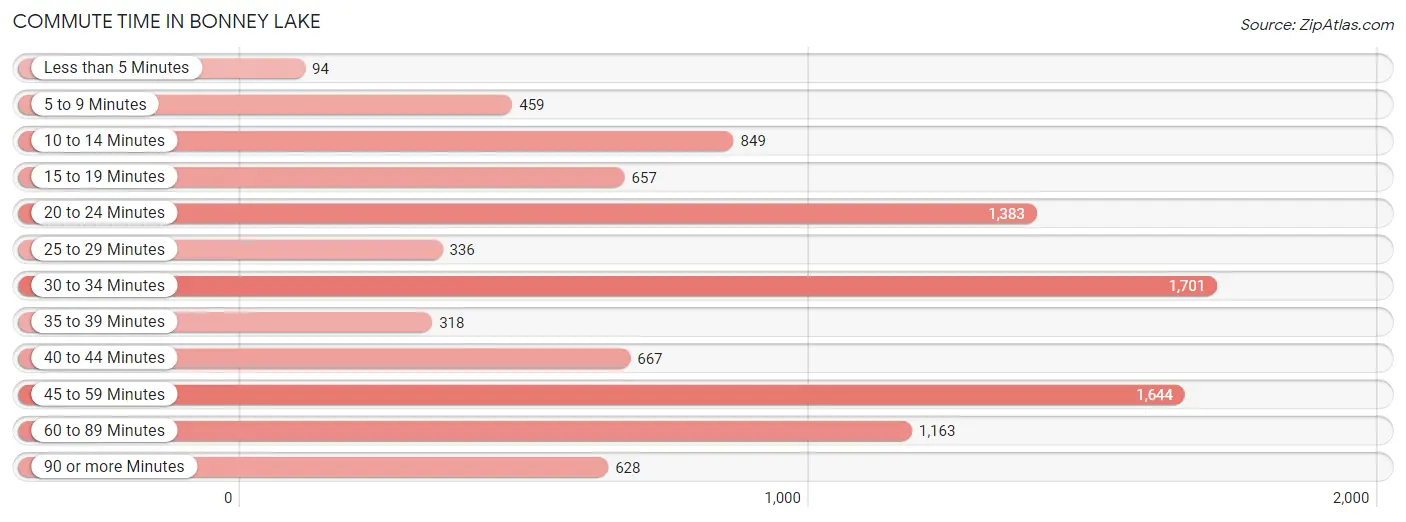
| Commute Time | # Commuters | % Commuters |
| Less than 5 Minutes | 94 | 0.9% |
| 5 to 9 Minutes | 459 | 4.6% |
| 10 to 14 Minutes | 849 | 8.6% |
| 15 to 19 Minutes | 657 | 6.6% |
| 20 to 24 Minutes | 1,383 | 14.0% |
| 25 to 29 Minutes | 336 | 3.4% |
| 30 to 34 Minutes | 1,701 | 17.2% |
| 35 to 39 Minutes | 318 | 3.2% |
| 40 to 44 Minutes | 667 | 6.7% |
| 45 to 59 Minutes | 1,644 | 16.6% |
| 60 to 89 Minutes | 1,163 | 11.7% |
| 90 or more Minutes | 628 | 6.3% |
Commute Time by Sex in Bonney Lake
The most common commute times in Bonney Lake are 30 to 34 minutes (1,087 commuters, 19.0%) for males and 30 to 34 minutes (614 commuters, 14.7%) for females.
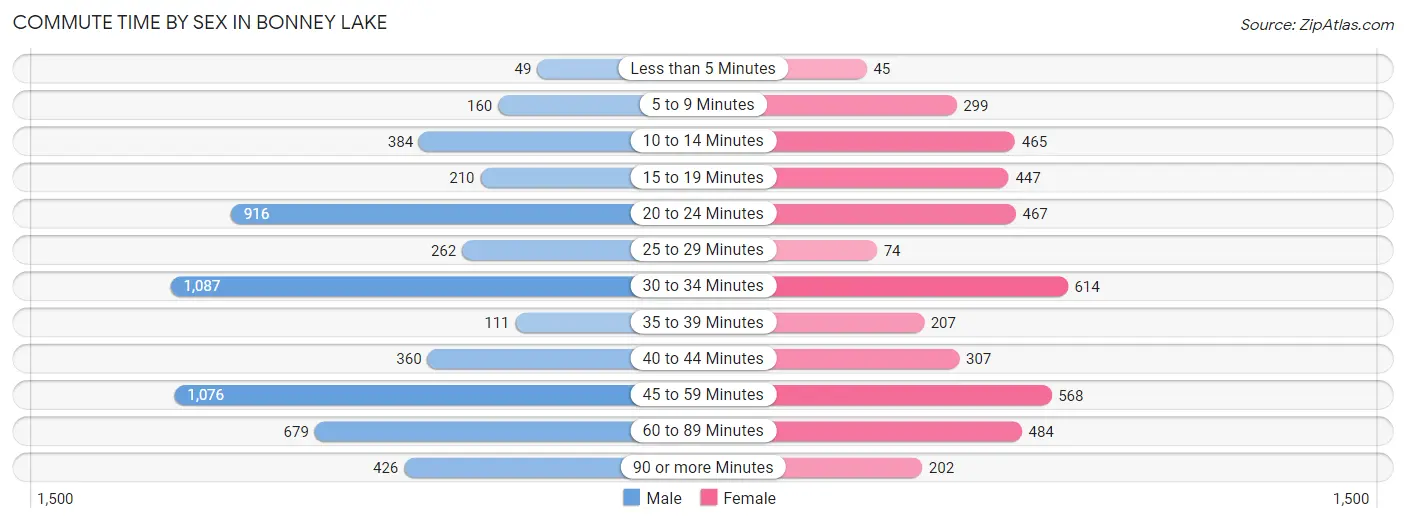
| Commute Time | Male | Female |
| Less than 5 Minutes | 49 (0.9%) | 45 (1.1%) |
| 5 to 9 Minutes | 160 (2.8%) | 299 (7.1%) |
| 10 to 14 Minutes | 384 (6.7%) | 465 (11.1%) |
| 15 to 19 Minutes | 210 (3.7%) | 447 (10.7%) |
| 20 to 24 Minutes | 916 (16.0%) | 467 (11.2%) |
| 25 to 29 Minutes | 262 (4.6%) | 74 (1.8%) |
| 30 to 34 Minutes | 1,087 (19.0%) | 614 (14.7%) |
| 35 to 39 Minutes | 111 (1.9%) | 207 (5.0%) |
| 40 to 44 Minutes | 360 (6.3%) | 307 (7.3%) |
| 45 to 59 Minutes | 1,076 (18.8%) | 568 (13.6%) |
| 60 to 89 Minutes | 679 (11.9%) | 484 (11.6%) |
| 90 or more Minutes | 426 (7.4%) | 202 (4.8%) |
Time of Departure to Work by Sex in Bonney Lake
The most frequent times of departure to work in Bonney Lake are 12:00 AM to 4:59 AM (1,172, 20.5%) for males and 7:00 AM to 7:29 AM (838, 20.1%) for females.
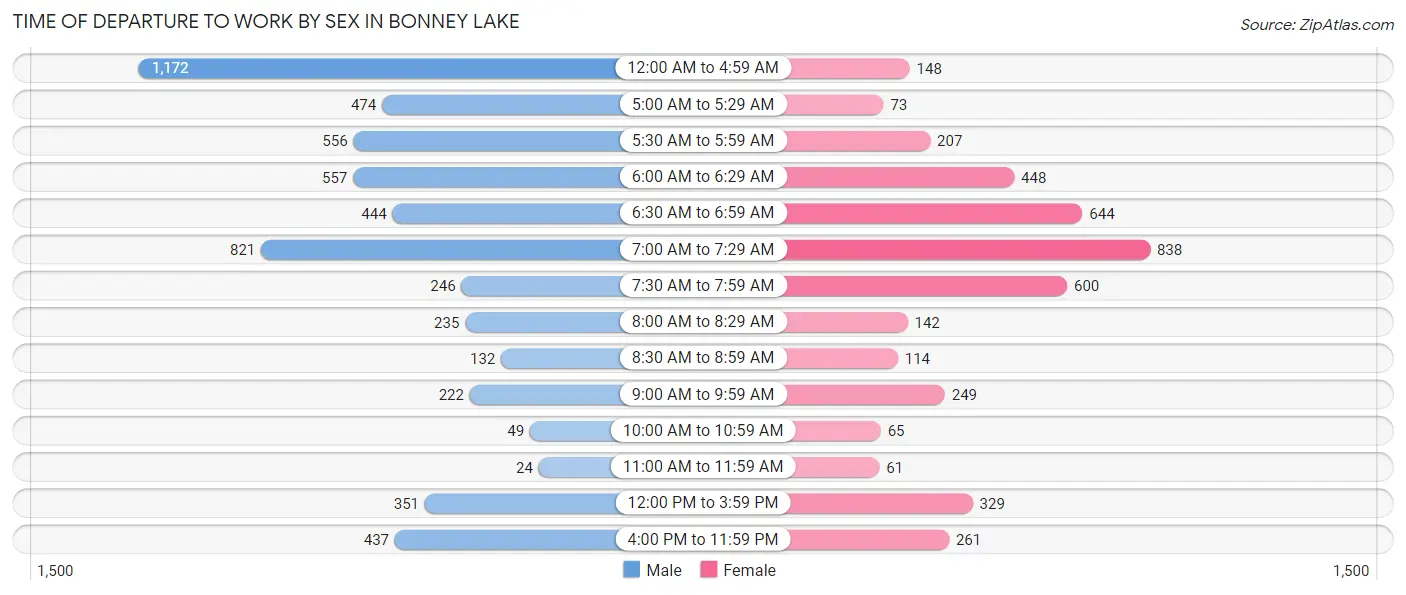
| Time of Departure | Male | Female |
| 12:00 AM to 4:59 AM | 1,172 (20.5%) | 148 (3.5%) |
| 5:00 AM to 5:29 AM | 474 (8.3%) | 73 (1.8%) |
| 5:30 AM to 5:59 AM | 556 (9.7%) | 207 (5.0%) |
| 6:00 AM to 6:29 AM | 557 (9.7%) | 448 (10.7%) |
| 6:30 AM to 6:59 AM | 444 (7.8%) | 644 (15.4%) |
| 7:00 AM to 7:29 AM | 821 (14.3%) | 838 (20.1%) |
| 7:30 AM to 7:59 AM | 246 (4.3%) | 600 (14.4%) |
| 8:00 AM to 8:29 AM | 235 (4.1%) | 142 (3.4%) |
| 8:30 AM to 8:59 AM | 132 (2.3%) | 114 (2.7%) |
| 9:00 AM to 9:59 AM | 222 (3.9%) | 249 (6.0%) |
| 10:00 AM to 10:59 AM | 49 (0.9%) | 65 (1.6%) |
| 11:00 AM to 11:59 AM | 24 (0.4%) | 61 (1.5%) |
| 12:00 PM to 3:59 PM | 351 (6.1%) | 329 (7.9%) |
| 4:00 PM to 11:59 PM | 437 (7.6%) | 261 (6.2%) |
| Total | 5,720 (100.0%) | 4,179 (100.0%) |
Housing Occupancy in Bonney Lake
Occupancy by Ownership in Bonney Lake
Of the total 7,800 dwellings in Bonney Lake, owner-occupied units account for 6,194 (79.4%), while renter-occupied units make up 1,606 (20.6%).
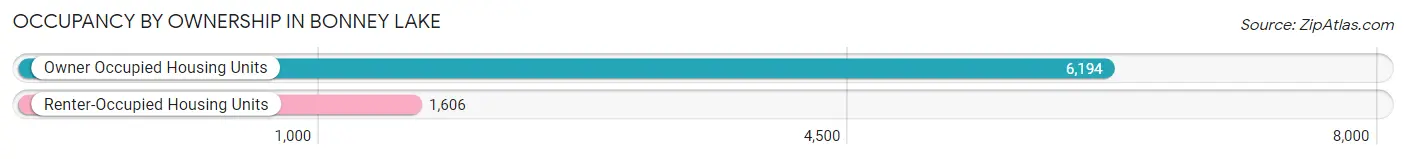
| Occupancy | # Housing Units | % Housing Units |
| Owner Occupied Housing Units | 6,194 | 79.4% |
| Renter-Occupied Housing Units | 1,606 | 20.6% |
| Total Occupied Housing Units | 7,800 | 100.0% |
Occupancy by Household Size in Bonney Lake
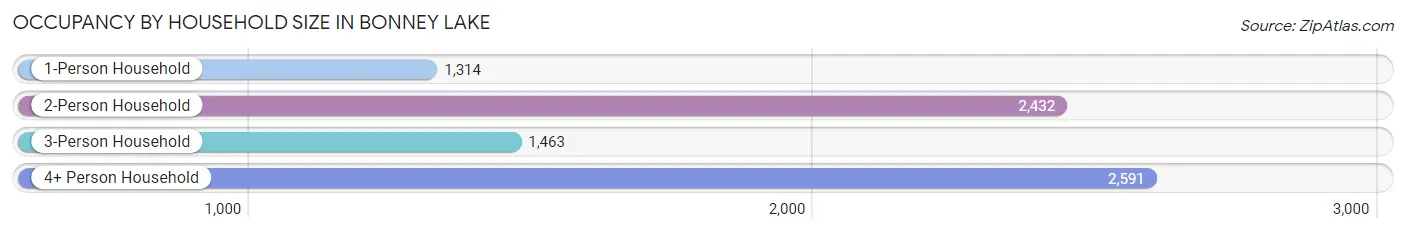
| Household Size | # Housing Units | % Housing Units |
| 1-Person Household | 1,314 | 16.9% |
| 2-Person Household | 2,432 | 31.2% |
| 3-Person Household | 1,463 | 18.8% |
| 4+ Person Household | 2,591 | 33.2% |
| Total Housing Units | 7,800 | 100.0% |
Occupancy by Ownership by Household Size in Bonney Lake
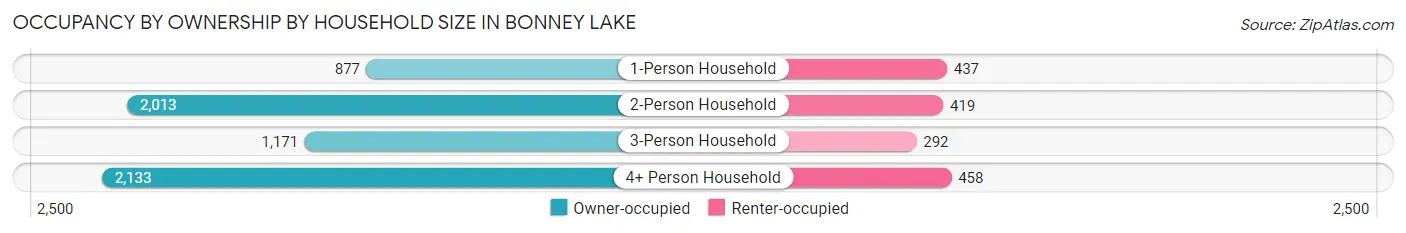
| Household Size | Owner-occupied | Renter-occupied |
| 1-Person Household | 877 (66.7%) | 437 (33.3%) |
| 2-Person Household | 2,013 (82.8%) | 419 (17.2%) |
| 3-Person Household | 1,171 (80.0%) | 292 (20.0%) |
| 4+ Person Household | 2,133 (82.3%) | 458 (17.7%) |
| Total Housing Units | 6,194 (79.4%) | 1,606 (20.6%) |
Occupancy by Educational Attainment in Bonney Lake
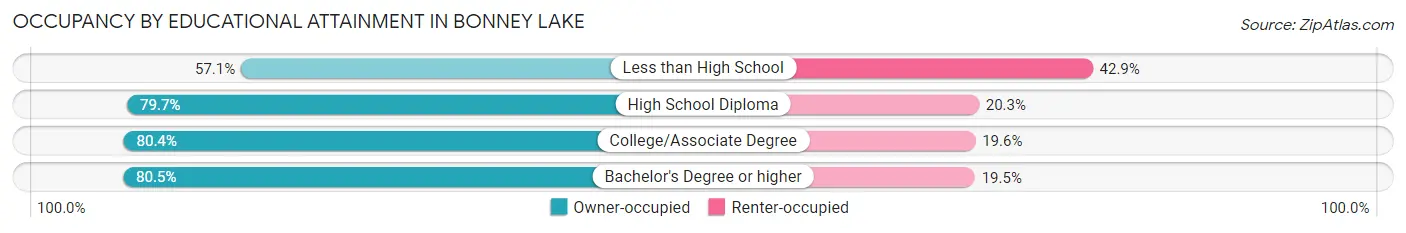
| Household Size | Owner-occupied | Renter-occupied |
| Less than High School | 157 (57.1%) | 118 (42.9%) |
| High School Diploma | 1,402 (79.7%) | 358 (20.3%) |
| College/Associate Degree | 2,860 (80.4%) | 699 (19.6%) |
| Bachelor's Degree or higher | 1,775 (80.5%) | 431 (19.5%) |
Occupancy by Age of Householder in Bonney Lake
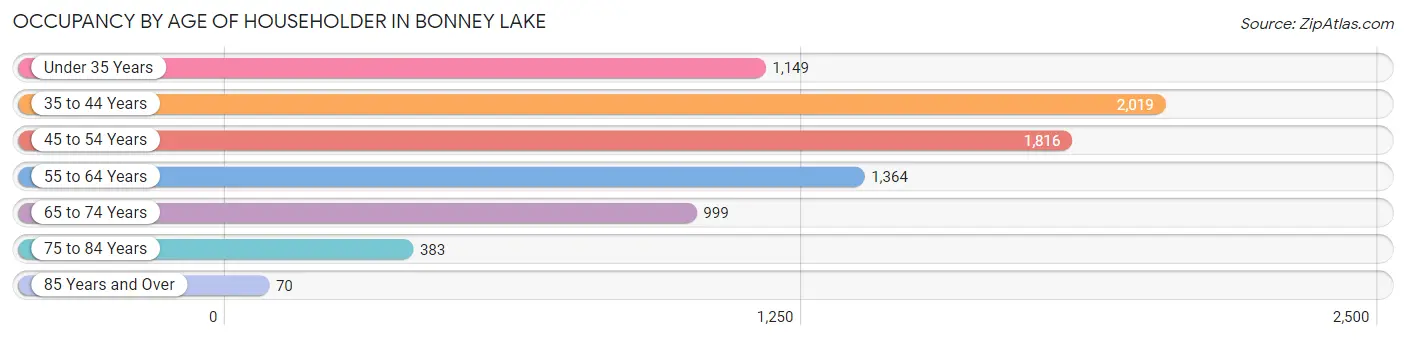
| Age Bracket | # Households | % Households |
| Under 35 Years | 1,149 | 14.7% |
| 35 to 44 Years | 2,019 | 25.9% |
| 45 to 54 Years | 1,816 | 23.3% |
| 55 to 64 Years | 1,364 | 17.5% |
| 65 to 74 Years | 999 | 12.8% |
| 75 to 84 Years | 383 | 4.9% |
| 85 Years and Over | 70 | 0.9% |
| Total | 7,800 | 100.0% |
Housing Finances in Bonney Lake
Median Income by Occupancy in Bonney Lake
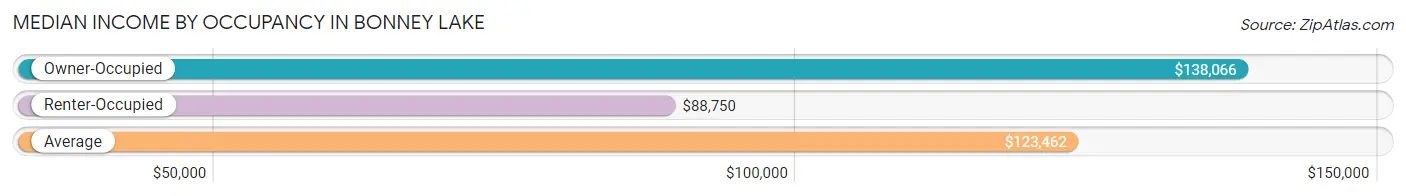
| Occupancy Type | # Households | Median Income |
| Owner-Occupied | 6,194 (79.4%) | $138,066 |
| Renter-Occupied | 1,606 (20.6%) | $88,750 |
| Average | 7,800 (100.0%) | $123,462 |
Occupancy by Householder Income Bracket in Bonney Lake
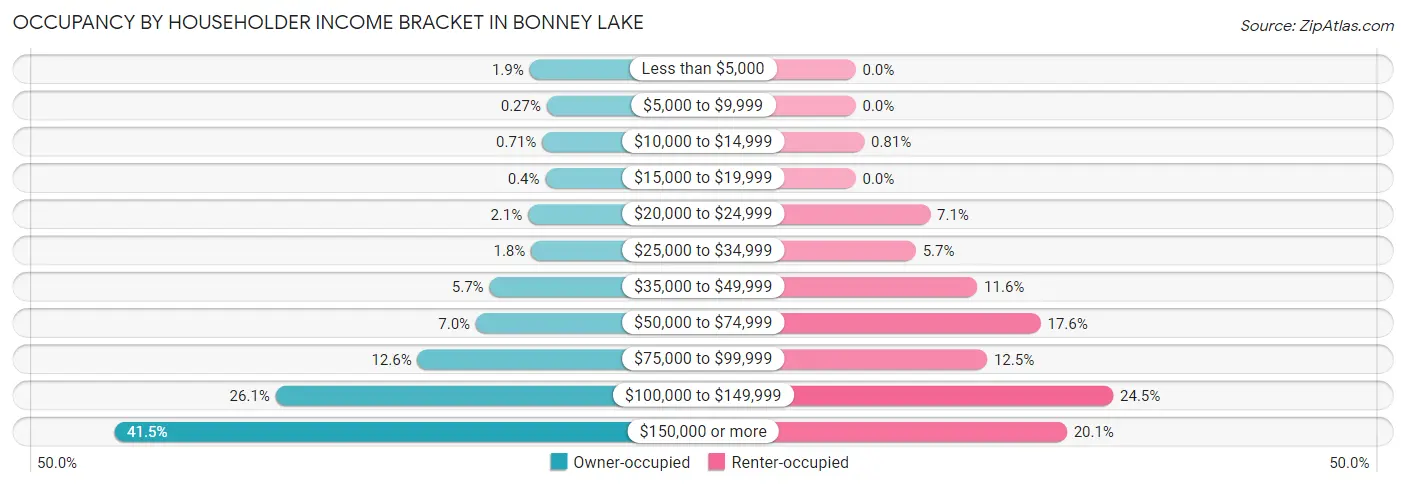
| Income Bracket | Owner-occupied | Renter-occupied |
| Less than $5,000 | 118 (1.9%) | 0 (0.0%) |
| $5,000 to $9,999 | 17 (0.3%) | 0 (0.0%) |
| $10,000 to $14,999 | 44 (0.7%) | 13 (0.8%) |
| $15,000 to $19,999 | 25 (0.4%) | 0 (0.0%) |
| $20,000 to $24,999 | 127 (2.1%) | 114 (7.1%) |
| $25,000 to $34,999 | 109 (1.8%) | 92 (5.7%) |
| $35,000 to $49,999 | 355 (5.7%) | 186 (11.6%) |
| $50,000 to $74,999 | 435 (7.0%) | 283 (17.6%) |
| $75,000 to $99,999 | 779 (12.6%) | 201 (12.5%) |
| $100,000 to $149,999 | 1,616 (26.1%) | 394 (24.5%) |
| $150,000 or more | 2,569 (41.5%) | 323 (20.1%) |
| Total | 6,194 (100.0%) | 1,606 (100.0%) |
Monthly Housing Cost Tiers in Bonney Lake
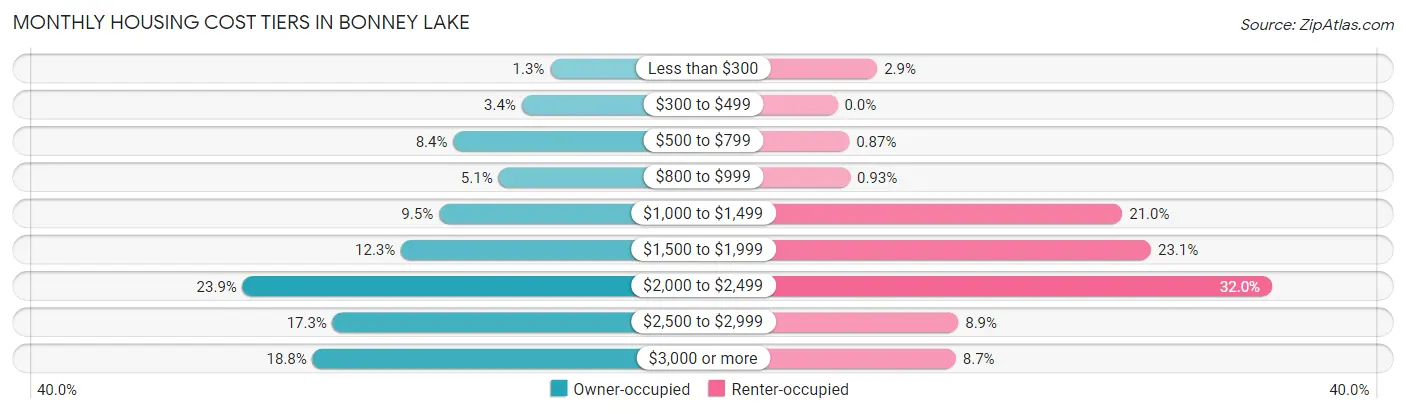
| Monthly Cost | Owner-occupied | Renter-occupied |
| Less than $300 | 80 (1.3%) | 47 (2.9%) |
| $300 to $499 | 210 (3.4%) | 0 (0.0%) |
| $500 to $799 | 522 (8.4%) | 14 (0.9%) |
| $800 to $999 | 316 (5.1%) | 15 (0.9%) |
| $1,000 to $1,499 | 587 (9.5%) | 337 (21.0%) |
| $1,500 to $1,999 | 760 (12.3%) | 371 (23.1%) |
| $2,000 to $2,499 | 1,483 (23.9%) | 514 (32.0%) |
| $2,500 to $2,999 | 1,072 (17.3%) | 143 (8.9%) |
| $3,000 or more | 1,164 (18.8%) | 140 (8.7%) |
| Total | 6,194 (100.0%) | 1,606 (100.0%) |
Physical Housing Characteristics in Bonney Lake
Housing Structures in Bonney Lake
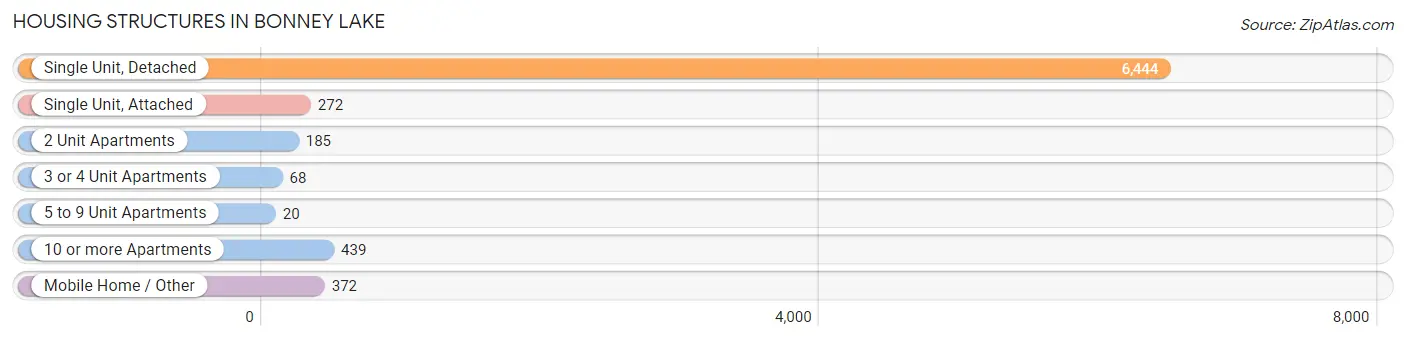
| Structure Type | # Housing Units | % Housing Units |
| Single Unit, Detached | 6,444 | 82.6% |
| Single Unit, Attached | 272 | 3.5% |
| 2 Unit Apartments | 185 | 2.4% |
| 3 or 4 Unit Apartments | 68 | 0.9% |
| 5 to 9 Unit Apartments | 20 | 0.3% |
| 10 or more Apartments | 439 | 5.6% |
| Mobile Home / Other | 372 | 4.8% |
| Total | 7,800 | 100.0% |
Housing Structures by Occupancy in Bonney Lake
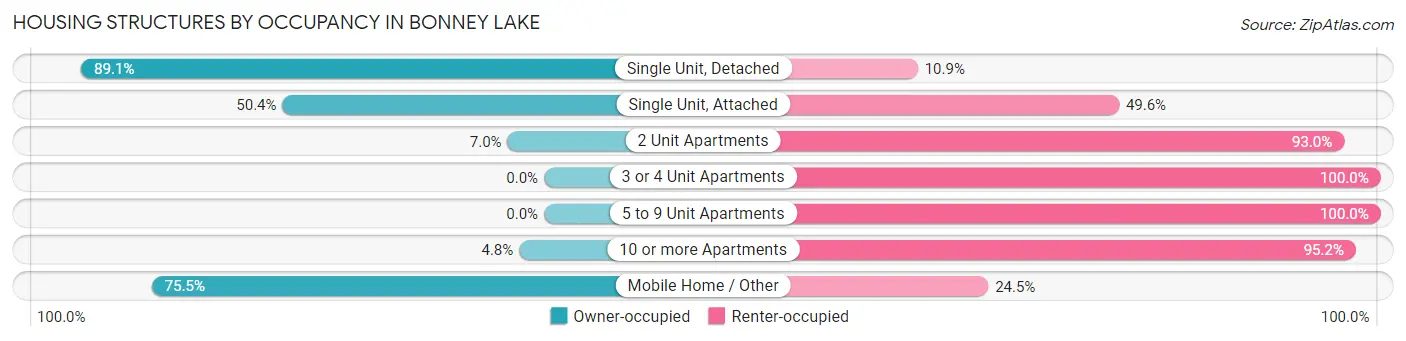
| Structure Type | Owner-occupied | Renter-occupied |
| Single Unit, Detached | 5,742 (89.1%) | 702 (10.9%) |
| Single Unit, Attached | 137 (50.4%) | 135 (49.6%) |
| 2 Unit Apartments | 13 (7.0%) | 172 (93.0%) |
| 3 or 4 Unit Apartments | 0 (0.0%) | 68 (100.0%) |
| 5 to 9 Unit Apartments | 0 (0.0%) | 20 (100.0%) |
| 10 or more Apartments | 21 (4.8%) | 418 (95.2%) |
| Mobile Home / Other | 281 (75.5%) | 91 (24.5%) |
| Total | 6,194 (79.4%) | 1,606 (20.6%) |
Housing Structures by Number of Rooms in Bonney Lake
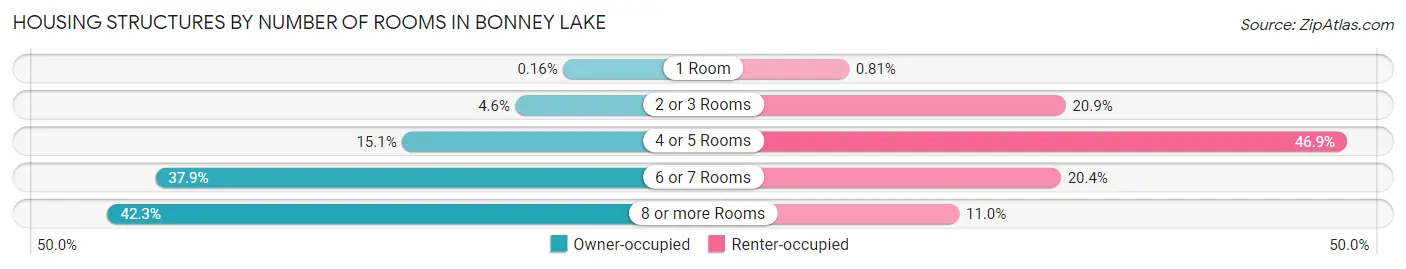
| Number of Rooms | Owner-occupied | Renter-occupied |
| 1 Room | 10 (0.2%) | 13 (0.8%) |
| 2 or 3 Rooms | 283 (4.6%) | 335 (20.9%) |
| 4 or 5 Rooms | 932 (15.0%) | 753 (46.9%) |
| 6 or 7 Rooms | 2,348 (37.9%) | 328 (20.4%) |
| 8 or more Rooms | 2,621 (42.3%) | 177 (11.0%) |
| Total | 6,194 (100.0%) | 1,606 (100.0%) |
Housing Structure by Heating Type in Bonney Lake

| Heating Type | Owner-occupied | Renter-occupied |
| Utility Gas | 3,645 (58.9%) | 542 (33.8%) |
| Bottled, Tank, or LP Gas | 114 (1.8%) | 38 (2.4%) |
| Electricity | 2,194 (35.4%) | 1,026 (63.9%) |
| Fuel Oil or Kerosene | 0 (0.0%) | 0 (0.0%) |
| Coal or Coke | 16 (0.3%) | 0 (0.0%) |
| All other Fuels | 225 (3.6%) | 0 (0.0%) |
| No Fuel Used | 0 (0.0%) | 0 (0.0%) |
| Total | 6,194 (100.0%) | 1,606 (100.0%) |
Household Vehicle Usage in Bonney Lake
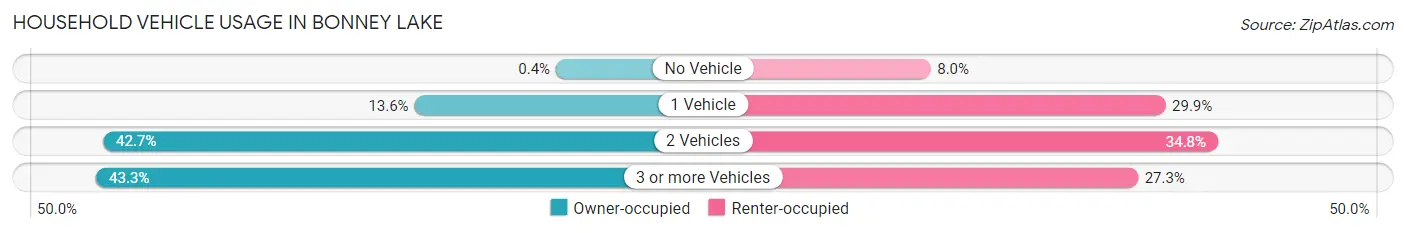
| Vehicles per Household | Owner-occupied | Renter-occupied |
| No Vehicle | 25 (0.4%) | 128 (8.0%) |
| 1 Vehicle | 843 (13.6%) | 480 (29.9%) |
| 2 Vehicles | 2,643 (42.7%) | 559 (34.8%) |
| 3 or more Vehicles | 2,683 (43.3%) | 439 (27.3%) |
| Total | 6,194 (100.0%) | 1,606 (100.0%) |
Real Estate & Mortgages in Bonney Lake
Real Estate and Mortgage Overview in Bonney Lake
| Characteristic | Without Mortgage | With Mortgage |
| Housing Units | 1,468 | 4,726 |
| Median Property Value | $525,700 | $491,300 |
| Median Household Income | $85,375 | $2,193 |
| Monthly Housing Costs | $791 | $1,164 |
| Real Estate Taxes | $4,727 | $66 |
Property Value by Mortgage Status in Bonney Lake
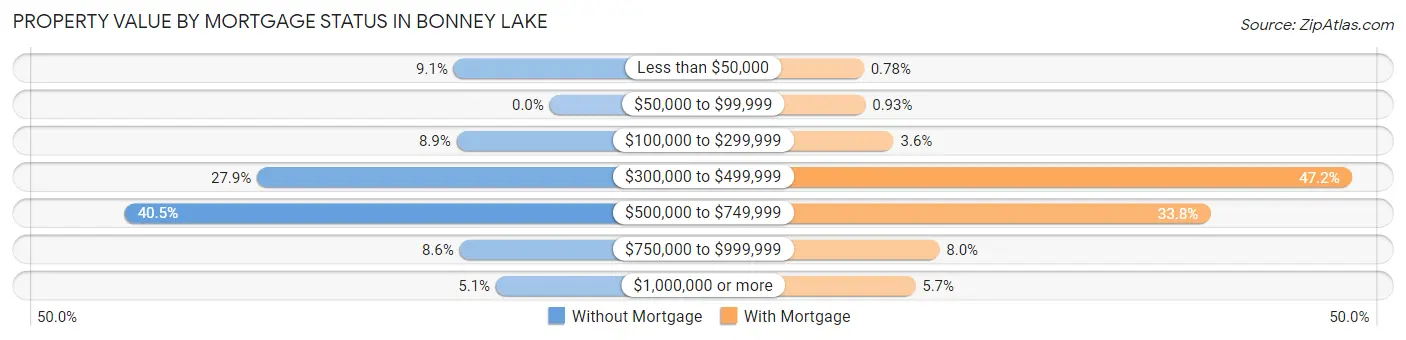
| Property Value | Without Mortgage | With Mortgage |
| Less than $50,000 | 134 (9.1%) | 37 (0.8%) |
| $50,000 to $99,999 | 0 (0.0%) | 44 (0.9%) |
| $100,000 to $299,999 | 130 (8.9%) | 171 (3.6%) |
| $300,000 to $499,999 | 409 (27.9%) | 2,232 (47.2%) |
| $500,000 to $749,999 | 594 (40.5%) | 1,596 (33.8%) |
| $750,000 to $999,999 | 126 (8.6%) | 377 (8.0%) |
| $1,000,000 or more | 75 (5.1%) | 269 (5.7%) |
| Total | 1,468 (100.0%) | 4,726 (100.0%) |
Household Income by Mortgage Status in Bonney Lake
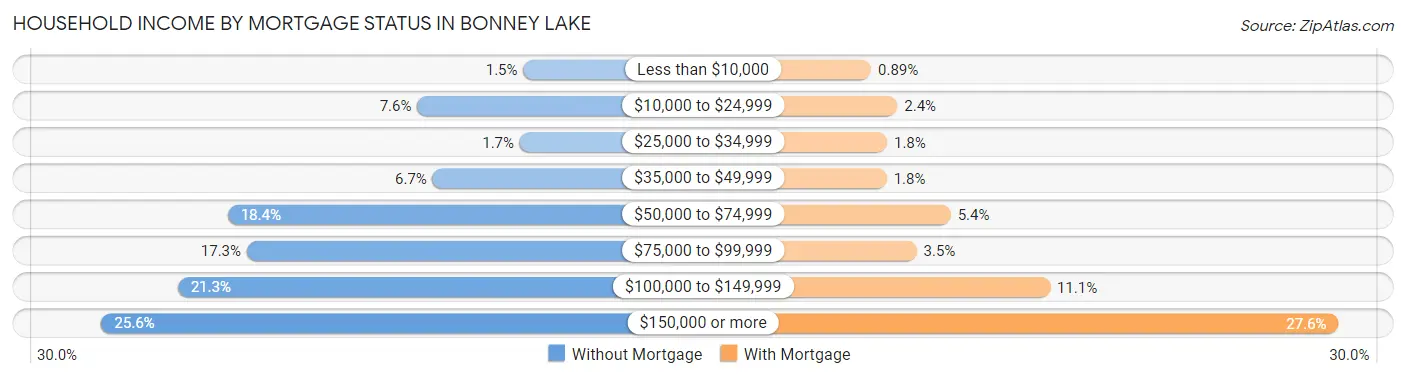
| Household Income | Without Mortgage | With Mortgage |
| Less than $10,000 | 22 (1.5%) | 42 (0.9%) |
| $10,000 to $24,999 | 111 (7.6%) | 113 (2.4%) |
| $25,000 to $34,999 | 25 (1.7%) | 85 (1.8%) |
| $35,000 to $49,999 | 98 (6.7%) | 84 (1.8%) |
| $50,000 to $74,999 | 270 (18.4%) | 257 (5.4%) |
| $75,000 to $99,999 | 254 (17.3%) | 165 (3.5%) |
| $100,000 to $149,999 | 312 (21.2%) | 525 (11.1%) |
| $150,000 or more | 376 (25.6%) | 1,304 (27.6%) |
| Total | 1,468 (100.0%) | 4,726 (100.0%) |
Property Value to Household Income Ratio in Bonney Lake
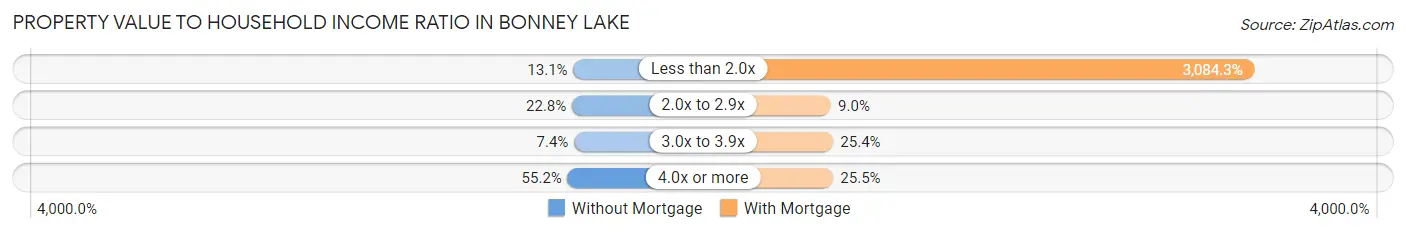
| Value-to-Income Ratio | Without Mortgage | With Mortgage |
| Less than 2.0x | 192 (13.1%) | 145,764 (3,084.3%) |
| 2.0x to 2.9x | 335 (22.8%) | 426 (9.0%) |
| 3.0x to 3.9x | 109 (7.4%) | 1,201 (25.4%) |
| 4.0x or more | 810 (55.2%) | 1,204 (25.5%) |
| Total | 1,468 (100.0%) | 4,726 (100.0%) |
Real Estate Taxes by Mortgage Status in Bonney Lake
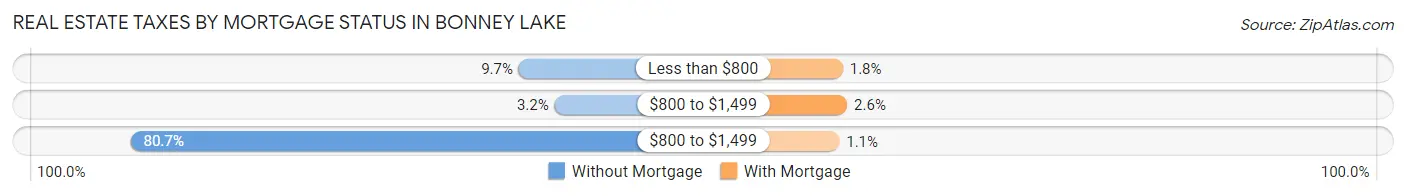
| Property Taxes | Without Mortgage | With Mortgage |
| Less than $800 | 143 (9.7%) | 84 (1.8%) |
| $800 to $1,499 | 47 (3.2%) | 122 (2.6%) |
| $800 to $1,499 | 1,184 (80.6%) | 54 (1.1%) |
| Total | 1,468 (100.0%) | 4,726 (100.0%) |
Health & Disability in Bonney Lake
Health Insurance Coverage by Age in Bonney Lake
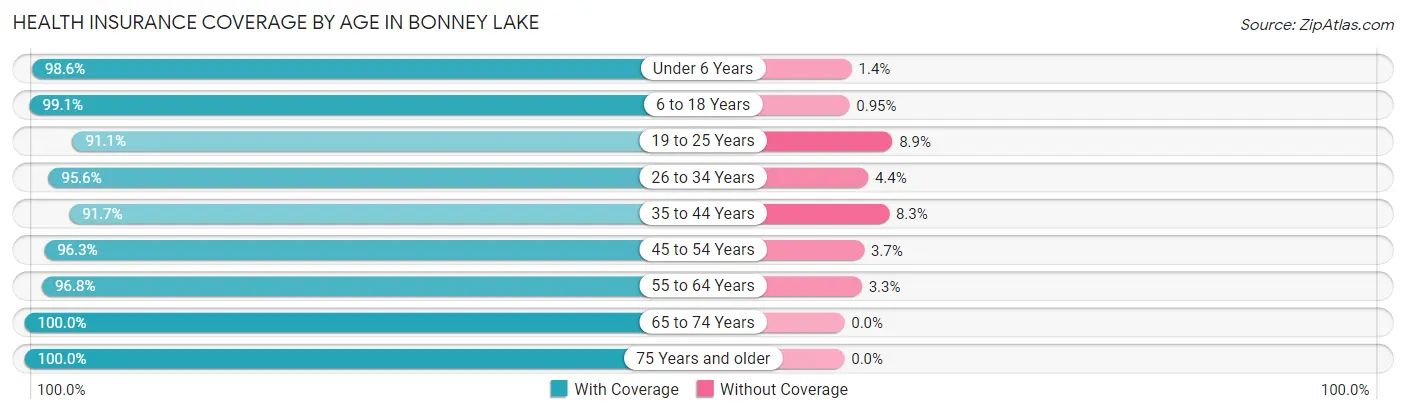
| Age Bracket | With Coverage | Without Coverage |
| Under 6 Years | 1,739 (98.6%) | 24 (1.4%) |
| 6 to 18 Years | 4,802 (99.1%) | 46 (0.9%) |
| 19 to 25 Years | 1,457 (91.1%) | 143 (8.9%) |
| 26 to 34 Years | 2,333 (95.6%) | 108 (4.4%) |
| 35 to 44 Years | 3,355 (91.7%) | 305 (8.3%) |
| 45 to 54 Years | 3,154 (96.3%) | 120 (3.7%) |
| 55 to 64 Years | 2,532 (96.8%) | 85 (3.3%) |
| 65 to 74 Years | 1,589 (100.0%) | 0 (0.0%) |
| 75 Years and older | 785 (100.0%) | 0 (0.0%) |
| Total | 21,746 (96.3%) | 831 (3.7%) |
Health Insurance Coverage by Citizenship Status in Bonney Lake
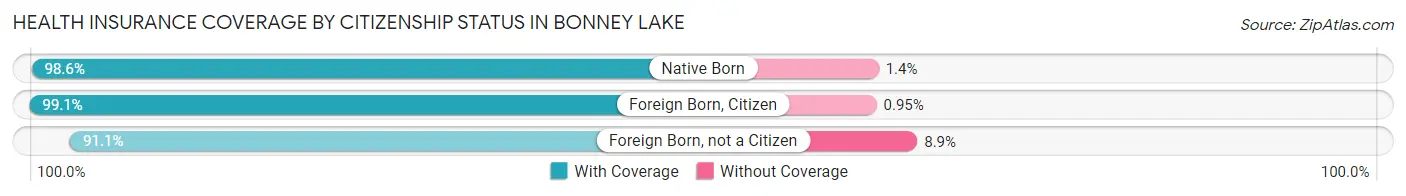
| Citizenship Status | With Coverage | Without Coverage |
| Native Born | 1,739 (98.6%) | 24 (1.4%) |
| Foreign Born, Citizen | 4,802 (99.1%) | 46 (0.9%) |
| Foreign Born, not a Citizen | 1,457 (91.1%) | 143 (8.9%) |
Health Insurance Coverage by Household Income in Bonney Lake
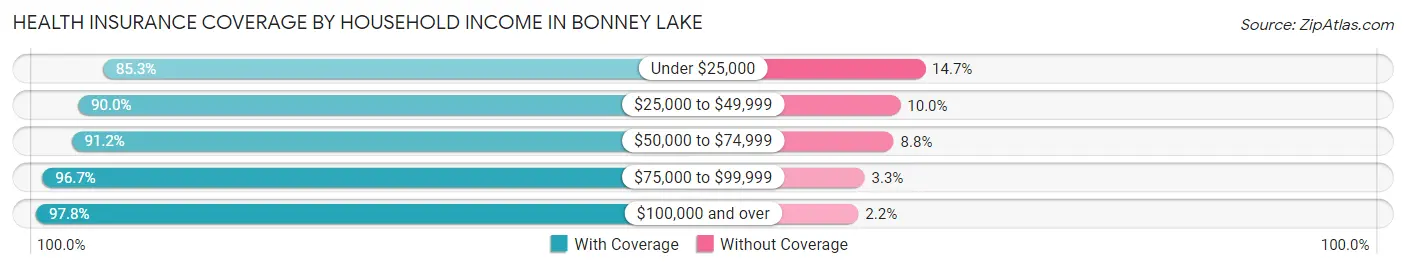
| Household Income | With Coverage | Without Coverage |
| Under $25,000 | 715 (85.3%) | 123 (14.7%) |
| $25,000 to $49,999 | 1,255 (90.0%) | 140 (10.0%) |
| $50,000 to $74,999 | 1,372 (91.2%) | 132 (8.8%) |
| $75,000 to $99,999 | 2,316 (96.7%) | 80 (3.3%) |
| $100,000 and over | 16,048 (97.8%) | 356 (2.2%) |
Public vs Private Health Insurance Coverage by Age in Bonney Lake
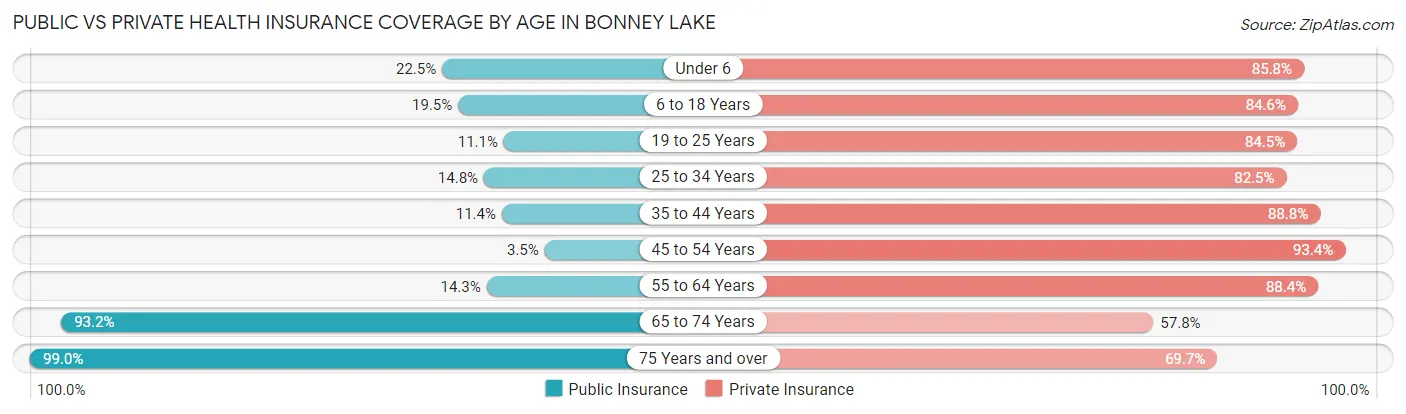
| Age Bracket | Public Insurance | Private Insurance |
| Under 6 | 397 (22.5%) | 1,512 (85.8%) |
| 6 to 18 Years | 947 (19.5%) | 4,103 (84.6%) |
| 19 to 25 Years | 177 (11.1%) | 1,352 (84.5%) |
| 25 to 34 Years | 360 (14.7%) | 2,014 (82.5%) |
| 35 to 44 Years | 418 (11.4%) | 3,249 (88.8%) |
| 45 to 54 Years | 114 (3.5%) | 3,058 (93.4%) |
| 55 to 64 Years | 373 (14.2%) | 2,313 (88.4%) |
| 65 to 74 Years | 1,481 (93.2%) | 919 (57.8%) |
| 75 Years and over | 777 (99.0%) | 547 (69.7%) |
| Total | 5,044 (22.3%) | 19,067 (84.5%) |
Disability Status by Sex by Age in Bonney Lake
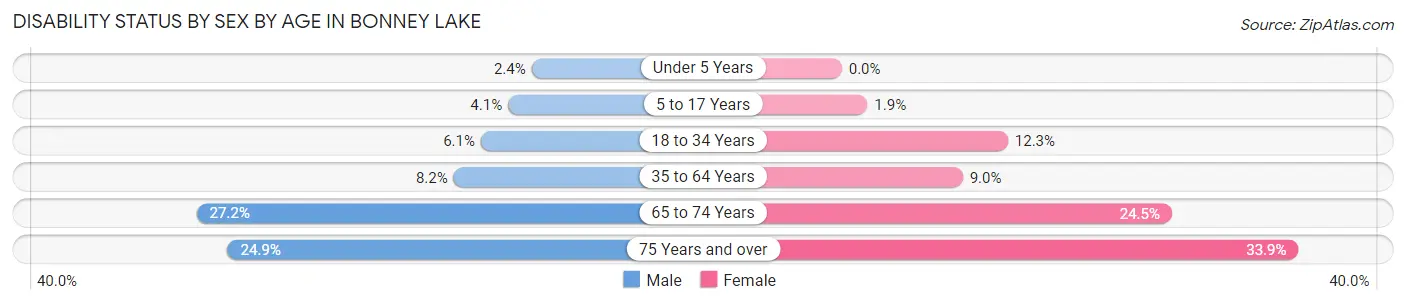
| Age Bracket | Male | Female |
| Under 5 Years | 16 (2.4%) | 0 (0.0%) |
| 5 to 17 Years | 99 (4.1%) | 47 (1.9%) |
| 18 to 34 Years | 140 (6.1%) | 260 (12.3%) |
| 35 to 64 Years | 409 (8.2%) | 407 (9.0%) |
| 65 to 74 Years | 186 (27.2%) | 222 (24.5%) |
| 75 Years and over | 92 (24.9%) | 141 (33.9%) |
Disability Class by Sex by Age in Bonney Lake
Disability Class: Hearing Difficulty
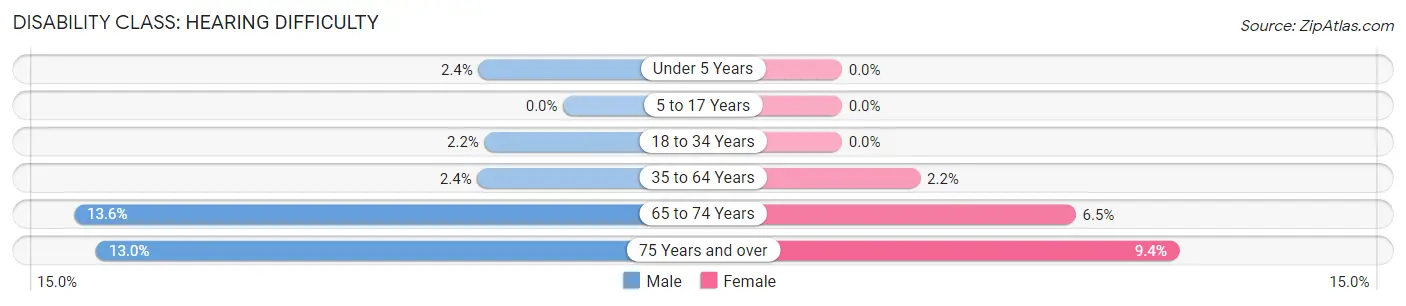
| Age Bracket | Male | Female |
| Under 5 Years | 16 (2.4%) | 0 (0.0%) |
| 5 to 17 Years | 0 (0.0%) | 0 (0.0%) |
| 18 to 34 Years | 50 (2.2%) | 0 (0.0%) |
| 35 to 64 Years | 120 (2.4%) | 99 (2.2%) |
| 65 to 74 Years | 93 (13.6%) | 59 (6.5%) |
| 75 Years and over | 48 (13.0%) | 39 (9.4%) |
Disability Class: Vision Difficulty
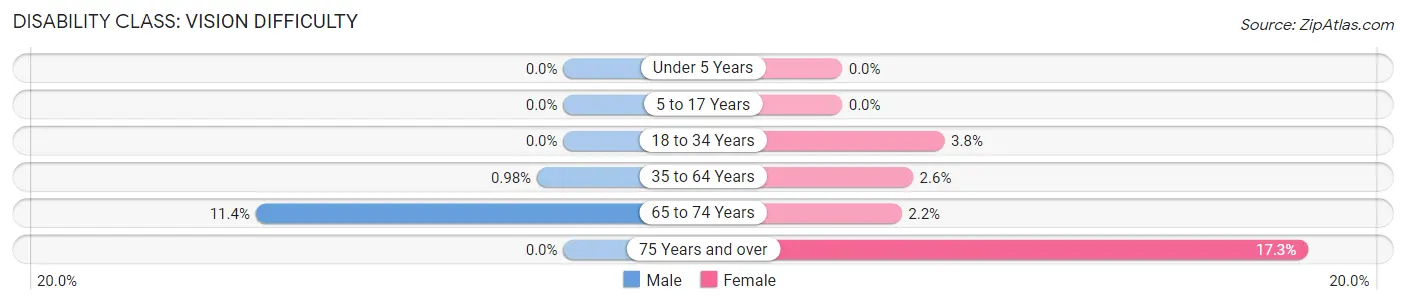
| Age Bracket | Male | Female |
| Under 5 Years | 0 (0.0%) | 0 (0.0%) |
| 5 to 17 Years | 0 (0.0%) | 0 (0.0%) |
| 18 to 34 Years | 0 (0.0%) | 80 (3.8%) |
| 35 to 64 Years | 49 (1.0%) | 119 (2.6%) |
| 65 to 74 Years | 78 (11.4%) | 20 (2.2%) |
| 75 Years and over | 0 (0.0%) | 72 (17.3%) |
Disability Class: Cognitive Difficulty
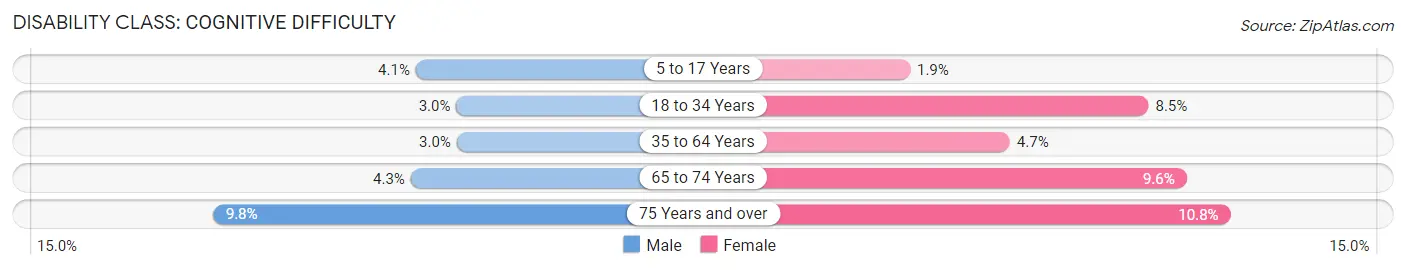
| Age Bracket | Male | Female |
| 5 to 17 Years | 99 (4.1%) | 47 (1.9%) |
| 18 to 34 Years | 68 (3.0%) | 180 (8.5%) |
| 35 to 64 Years | 149 (3.0%) | 212 (4.7%) |
| 65 to 74 Years | 29 (4.3%) | 87 (9.6%) |
| 75 Years and over | 36 (9.8%) | 45 (10.8%) |
Disability Class: Ambulatory Difficulty
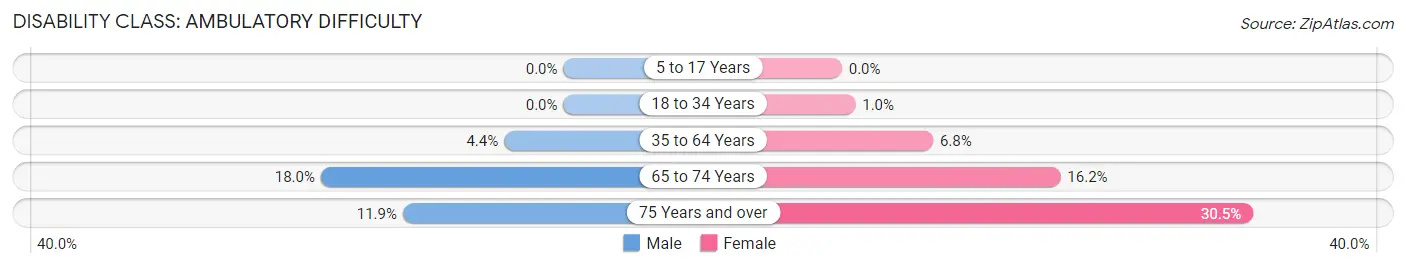
| Age Bracket | Male | Female |
| 5 to 17 Years | 0 (0.0%) | 0 (0.0%) |
| 18 to 34 Years | 0 (0.0%) | 21 (1.0%) |
| 35 to 64 Years | 221 (4.4%) | 307 (6.8%) |
| 65 to 74 Years | 123 (18.0%) | 147 (16.2%) |
| 75 Years and over | 44 (11.9%) | 127 (30.5%) |
Disability Class: Self-Care Difficulty
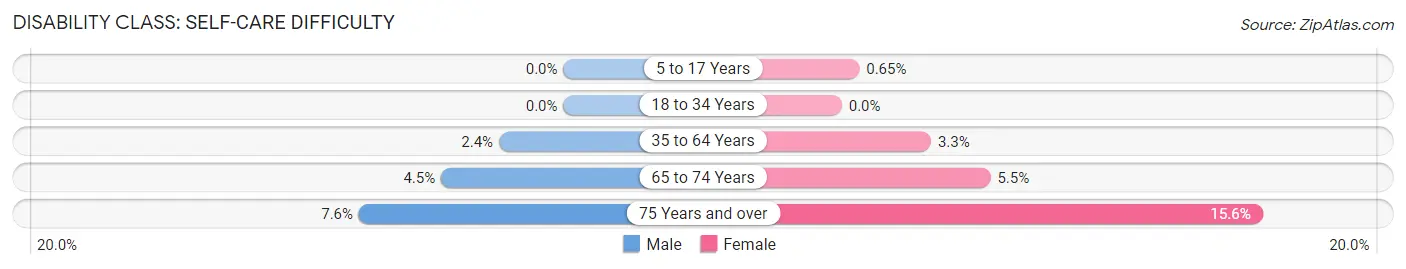
| Age Bracket | Male | Female |
| 5 to 17 Years | 0 (0.0%) | 16 (0.6%) |
| 18 to 34 Years | 0 (0.0%) | 0 (0.0%) |
| 35 to 64 Years | 120 (2.4%) | 150 (3.3%) |
| 65 to 74 Years | 31 (4.5%) | 50 (5.5%) |
| 75 Years and over | 28 (7.6%) | 65 (15.6%) |
Technology Access in Bonney Lake
Computing Device Access in Bonney Lake
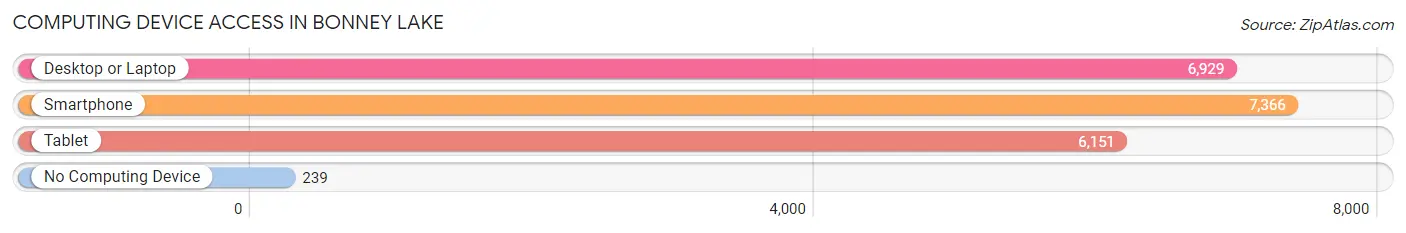
| Device Type | # Households | % Households |
| Desktop or Laptop | 6,929 | 88.8% |
| Smartphone | 7,366 | 94.4% |
| Tablet | 6,151 | 78.9% |
| No Computing Device | 239 | 3.1% |
| Total | 7,800 | 100.0% |
Internet Access in Bonney Lake
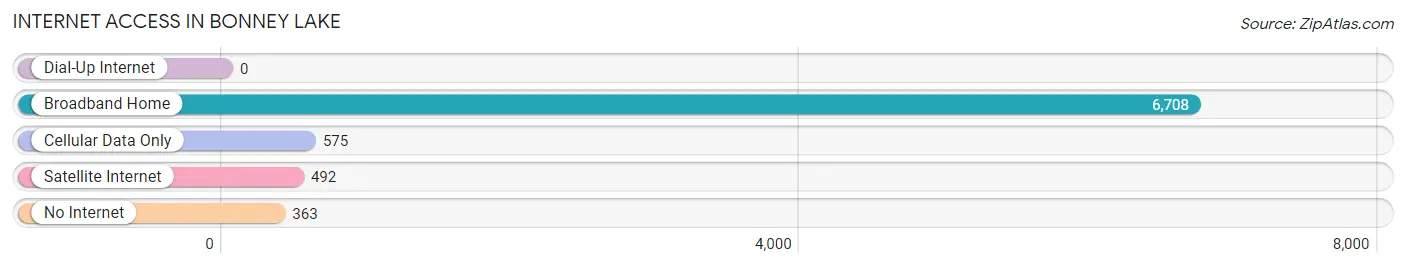
| Internet Type | # Households | % Households |
| Dial-Up Internet | 0 | 0.0% |
| Broadband Home | 6,708 | 86.0% |
| Cellular Data Only | 575 | 7.4% |
| Satellite Internet | 492 | 6.3% |
| No Internet | 363 | 4.6% |
| Total | 7,800 | 100.0% |
Bonney Lake Summary
Bonney Lake, Washington is a city located in Pierce County, Washington, United States. The population was 17,374 at the 2010 census. Bonney Lake is located in the foothills of the Cascade Mountains, approximately 25 miles southeast of Tacoma and 35 miles east of Seattle.
History
The area that is now Bonney Lake was first settled in the late 1800s by homesteaders. The area was originally known as "Tehaleh", which is a Chinook Jargon word meaning "high land". The area was later renamed "Bonney Lake" after the first postmaster, William Bonney. The area was officially incorporated as a city in 1949.
Geography
Bonney Lake is located at 47°10'25"N 122°10'17"W (47.173611, -122.171389). According to the United States Census Bureau, the city has a total area of 8.9 square miles, of which 8.7 square miles is land and 0.2 square miles is water.
Economy
Bonney Lake is home to a variety of businesses, including retail stores, restaurants, and professional services. The city is also home to several industrial and manufacturing companies, including Boeing, which has a large facility in the city.
Demographics
As of the 2010 census, there were 17,374 people, 6,541 households, and 4,845 families residing in the city. The population density was 1,988.3 people per square mile. The racial makeup of the city was 81.3% White, 5.2% African American, 0.9% Native American, 4.2% Asian, 0.3% Pacific Islander, 4.2% from other races, and 4.1% from two or more races. Hispanic or Latino of any race were 8.7% of the population.
The median income for a household in the city was $60,945, and the median income for a family was $71,945. The per capita income for the city was $27,945. About 5.2% of families and 7.2% of the population were below the poverty line, including 9.2% of those under age 18 and 5.2% of those age 65 or over.
Conclusion
Bonney Lake, Washington is a city located in Pierce County, Washington, United States. The city has a rich history, and is home to a variety of businesses, including retail stores, restaurants, and professional services. The population of the city is 17,374, and the median income for a household is $60,945. Bonney Lake is located in the foothills of the Cascade Mountains, approximately 25 miles southeast of Tacoma and 35 miles east of Seattle.
Common Questions
What is the Total Population of Bonney Lake?
Total Population of Bonney Lake is 22,590.
What is the Total Male Population of Bonney Lake?
Total Male Population of Bonney Lake is 11,450.
What is the Total Female Population of Bonney Lake?
Total Female Population of Bonney Lake is 11,140.
What is the Ratio of Males per 100 Females in Bonney Lake?
There are 102.78 Males per 100 Females in Bonney Lake.
What is the Ratio of Females per 100 Males in Bonney Lake?
There are 97.29 Females per 100 Males in Bonney Lake.
What is the Median Population Age in Bonney Lake?
Median Population Age in Bonney Lake is 37.2 Years.
What is the Average Family Size in Bonney Lake
Average Family Size in Bonney Lake is 3.3 People.
What is the Average Household Size in Bonney Lake
Average Household Size in Bonney Lake is 2.9 People.
What is Per Capita Income in Bonney Lake?
Per Capita income in Bonney Lake is $49,627.
What is the Median Family Income in Bonney Lake?
Median Family Income in Bonney Lake is $139,419.
What is the Median Household income in Bonney Lake?
Median Household Income in Bonney Lake is $123,462.
What is Income or Wage Gap in Bonney Lake?
Income or Wage Gap in Bonney Lake is 38.3%.
Women in Bonney Lake earn 61.7 cents for every dollar earned by a man.
What is Inequality or Gini Index in Bonney Lake?
Inequality or Gini Index in Bonney Lake is 0.37.
How Large is the Labor Force in Bonney Lake?
There are 12,101 People in the Labor Forcein in Bonney Lake.
What is the Percentage of People in the Labor Force in Bonney Lake?
70.6% of People are in the Labor Force in Bonney Lake.
What is the Unemployment Rate in Bonney Lake?
Unemployment Rate in Bonney Lake is 2.8%.