Rock Island, WA
Rock Island Map
Rock Island Overview
1,259
TOTAL POPULATION
568
MALE POPULATION
691
FEMALE POPULATION
82.20
MALES / 100 FEMALES
121.65
FEMALES / 100 MALES
33.9
MEDIAN AGE
3.6
AVG FAMILY SIZE
3.0
AVG HOUSEHOLD SIZE
$20,929
PER CAPITA INCOME
$64,091
AVG FAMILY INCOME
$53,359
AVG HOUSEHOLD INCOME
24.8%
WAGE / INCOME GAP [ % ]
75.2¢/ $1
WAGE / INCOME GAP [ $ ]
0.33
INEQUALITY / GINI INDEX
517
LABOR FORCE [ PEOPLE ]
54.2%
PERCENT IN LABOR FORCE
7.0%
UNEMPLOYMENT RATE
Rock Island Zip Codes
Rock Island Area Codes
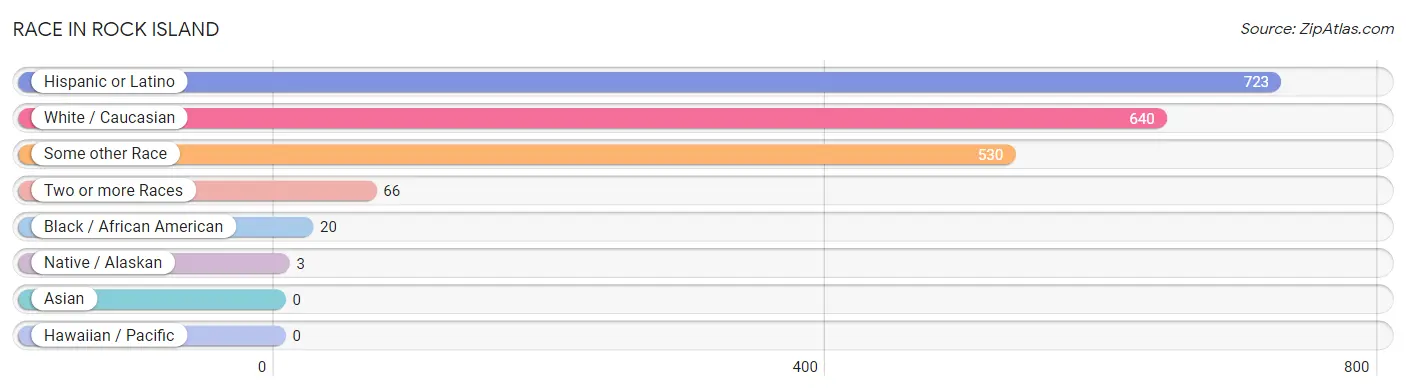
Race in Rock Island
The most populous races in Rock Island are Hispanic or Latino (723 | 57.4%), White / Caucasian (640 | 50.8%), and Some other Race (530 | 42.1%).
| Race | # Population | % Population |
| Asian | 0 | 0.0% |
| Black / African American | 20 | 1.6% |
| Hawaiian / Pacific | 0 | 0.0% |
| Hispanic or Latino | 723 | 57.4% |
| Native / Alaskan | 3 | 0.2% |
| White / Caucasian | 640 | 50.8% |
| Two or more Races | 66 | 5.2% |
| Some other Race | 530 | 42.1% |
| Total | 1,259 | 100.0% |
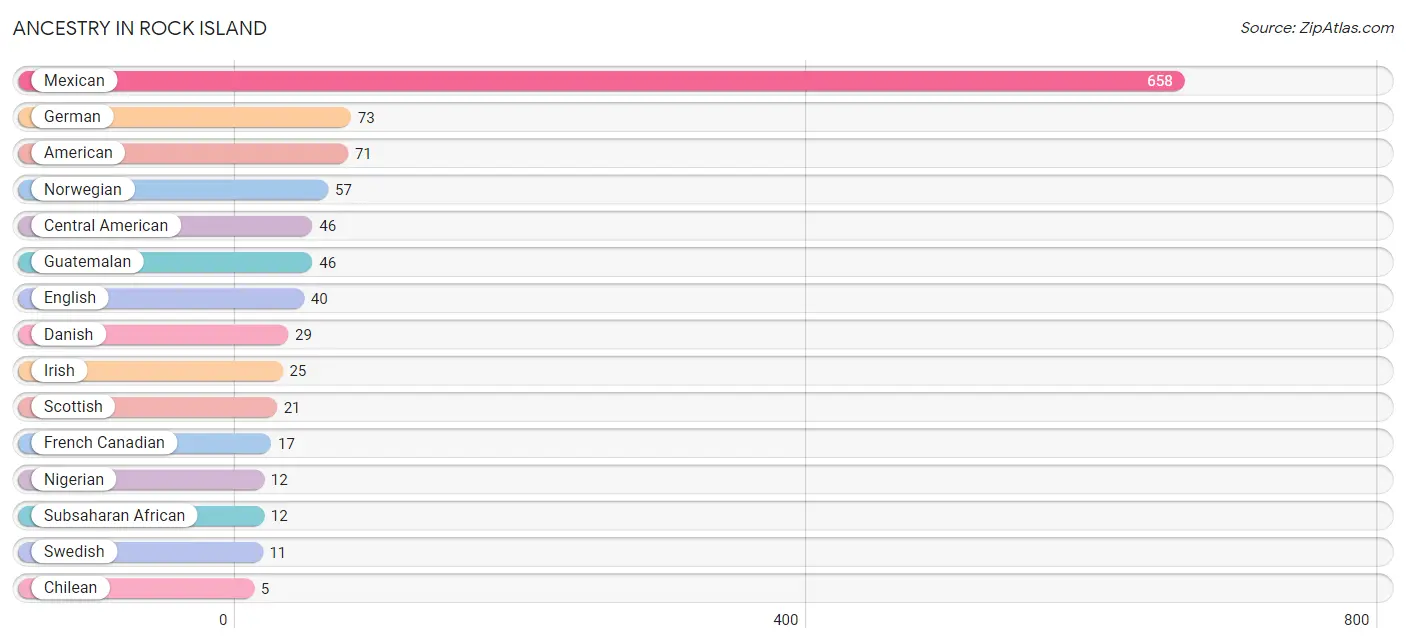
Ancestry in Rock Island
The most populous ancestries reported in Rock Island are Mexican (658 | 52.3%), German (73 | 5.8%), American (71 | 5.6%), Norwegian (57 | 4.5%), and Central American (46 | 3.6%), together accounting for 71.9% of all Rock Island residents.
| Ancestry | # Population | % Population |
| American | 71 | 5.6% |
| Central American | 46 | 3.6% |
| Cherokee | 3 | 0.2% |
| Chilean | 5 | 0.4% |
| Danish | 29 | 2.3% |
| Dutch | 5 | 0.4% |
| English | 40 | 3.2% |
| European | 1 | 0.1% |
| French | 2 | 0.2% |
| French Canadian | 17 | 1.3% |
| German | 73 | 5.8% |
| Guatemalan | 46 | 3.6% |
| Irish | 25 | 2.0% |
| Mexican | 658 | 52.3% |
| Nigerian | 12 | 0.9% |
| Northern European | 2 | 0.2% |
| Norwegian | 57 | 4.5% |
| Puerto Rican | 4 | 0.3% |
| Russian | 3 | 0.2% |
| Scottish | 21 | 1.7% |
| South American | 5 | 0.4% |
| Subsaharan African | 12 | 0.9% |
| Swedish | 11 | 0.9% | View All 23 Rows |
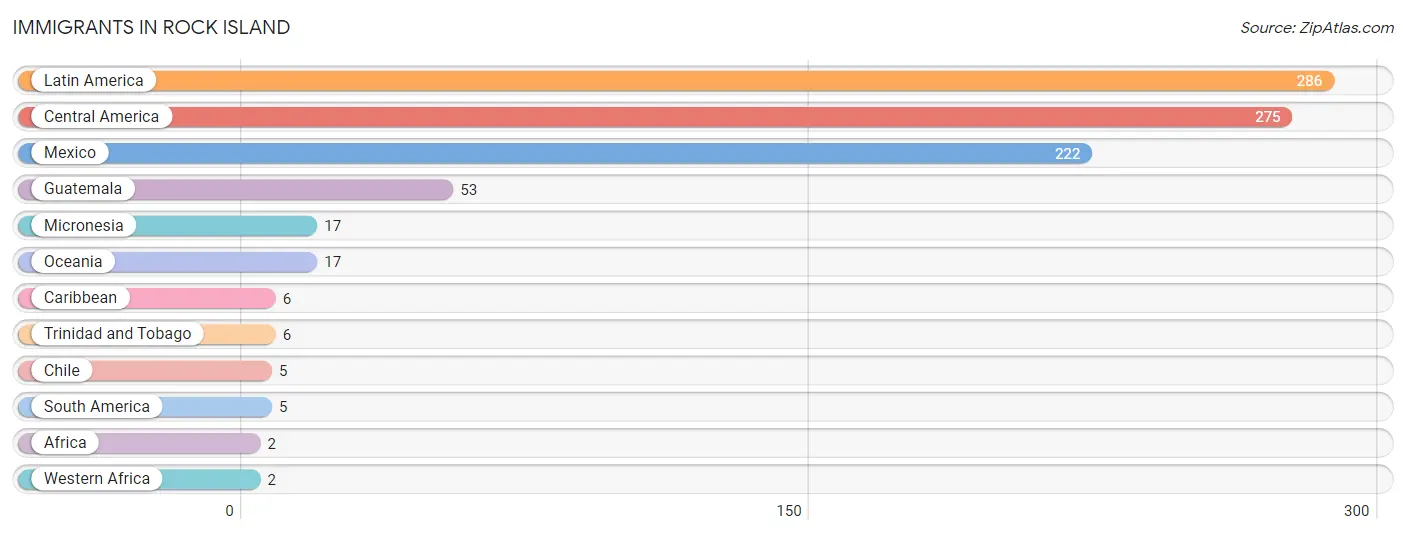
Immigrants in Rock Island
The most numerous immigrant groups reported in Rock Island came from Latin America (286 | 22.7%), Central America (275 | 21.8%), Mexico (222 | 17.6%), Guatemala (53 | 4.2%), and Micronesia (17 | 1.3%), together accounting for 67.7% of all Rock Island residents.
| Immigration Origin | # Population | % Population |
| Africa | 2 | 0.2% |
| Caribbean | 6 | 0.5% |
| Central America | 275 | 21.8% |
| Chile | 5 | 0.4% |
| Guatemala | 53 | 4.2% |
| Latin America | 286 | 22.7% |
| Mexico | 222 | 17.6% |
| Micronesia | 17 | 1.3% |
| Oceania | 17 | 1.3% |
| South America | 5 | 0.4% |
| Trinidad and Tobago | 6 | 0.5% |
| Western Africa | 2 | 0.2% | View All 12 Rows |
Sex and Age in Rock Island
Sex and Age in Rock Island
The most populous age groups in Rock Island are 15 to 19 Years (62 | 10.9%) for men and 10 to 14 Years (84 | 12.2%) for women.
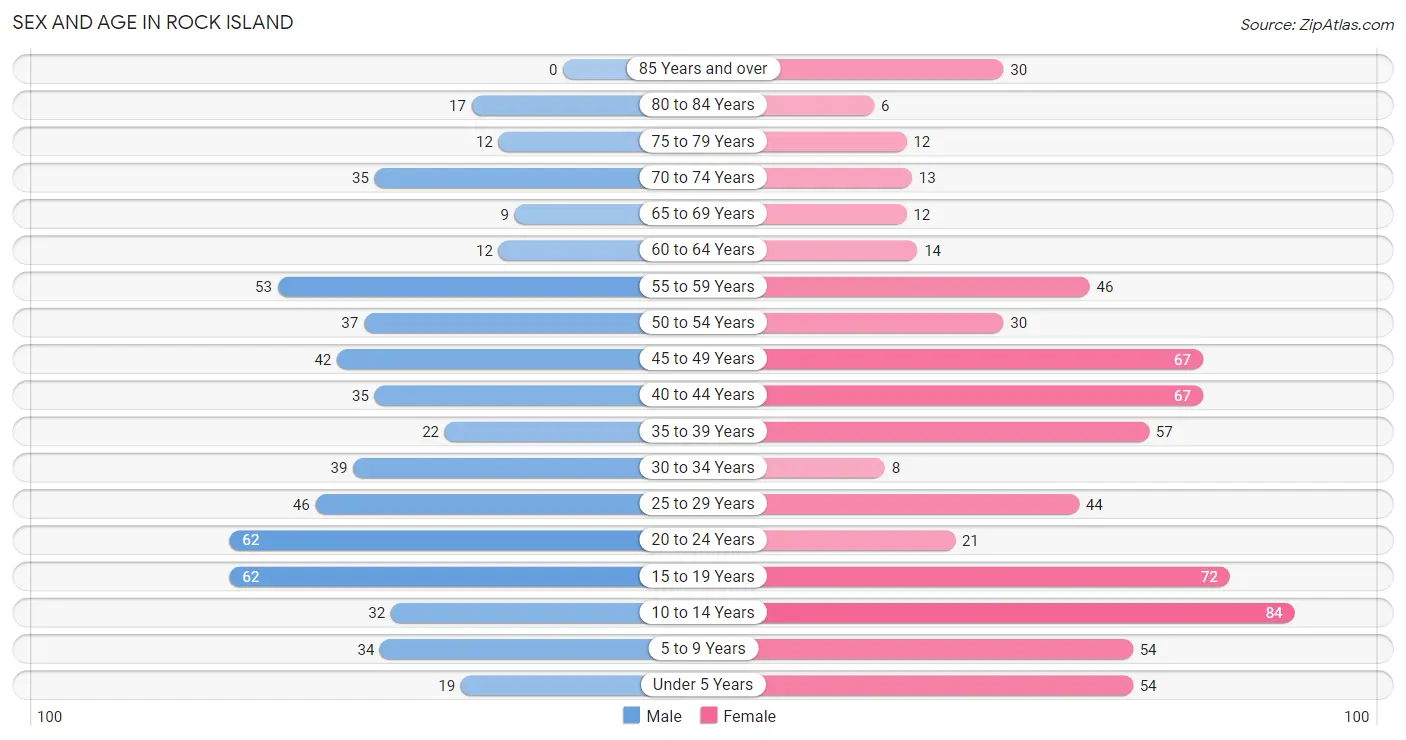
| Age Bracket | Male | Female |
| Under 5 Years | 19 (3.4%) | 54 (7.8%) |
| 5 to 9 Years | 34 (6.0%) | 54 (7.8%) |
| 10 to 14 Years | 32 (5.6%) | 84 (12.2%) |
| 15 to 19 Years | 62 (10.9%) | 72 (10.4%) |
| 20 to 24 Years | 62 (10.9%) | 21 (3.0%) |
| 25 to 29 Years | 46 (8.1%) | 44 (6.4%) |
| 30 to 34 Years | 39 (6.9%) | 8 (1.2%) |
| 35 to 39 Years | 22 (3.9%) | 57 (8.3%) |
| 40 to 44 Years | 35 (6.2%) | 67 (9.7%) |
| 45 to 49 Years | 42 (7.4%) | 67 (9.7%) |
| 50 to 54 Years | 37 (6.5%) | 30 (4.3%) |
| 55 to 59 Years | 53 (9.3%) | 46 (6.7%) |
| 60 to 64 Years | 12 (2.1%) | 14 (2.0%) |
| 65 to 69 Years | 9 (1.6%) | 12 (1.7%) |
| 70 to 74 Years | 35 (6.2%) | 13 (1.9%) |
| 75 to 79 Years | 12 (2.1%) | 12 (1.7%) |
| 80 to 84 Years | 17 (3.0%) | 6 (0.9%) |
| 85 Years and over | 0 (0.0%) | 30 (4.3%) |
| Total | 568 (100.0%) | 691 (100.0%) |
Families and Households in Rock Island
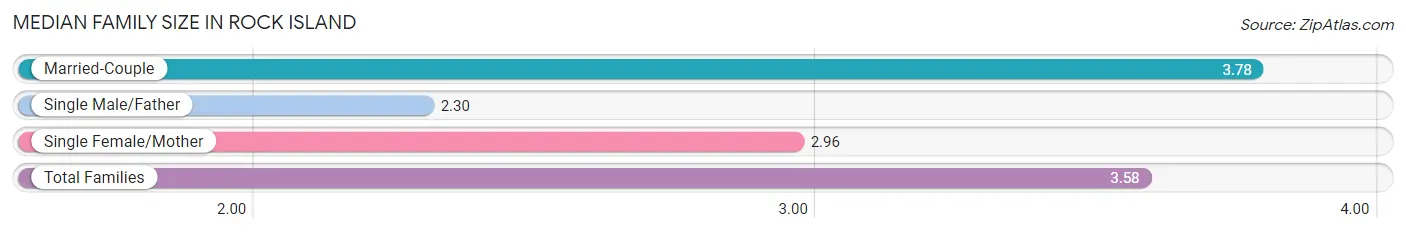
Median Family Size in Rock Island
The median family size in Rock Island is 3.58 persons per family, with married-couple families (232 | 77.8%) accounting for the largest median family size of 3.78 persons per family. On the other hand, single male/father families (10 | 3.4%) represent the smallest median family size with 2.30 persons per family.
| Family Type | # Families | Family Size |
| Married-Couple | 232 (77.8%) | 3.78 |
| Single Male/Father | 10 (3.4%) | 2.30 |
| Single Female/Mother | 56 (18.8%) | 2.96 |
| Total Families | 298 (100.0%) | 3.58 |
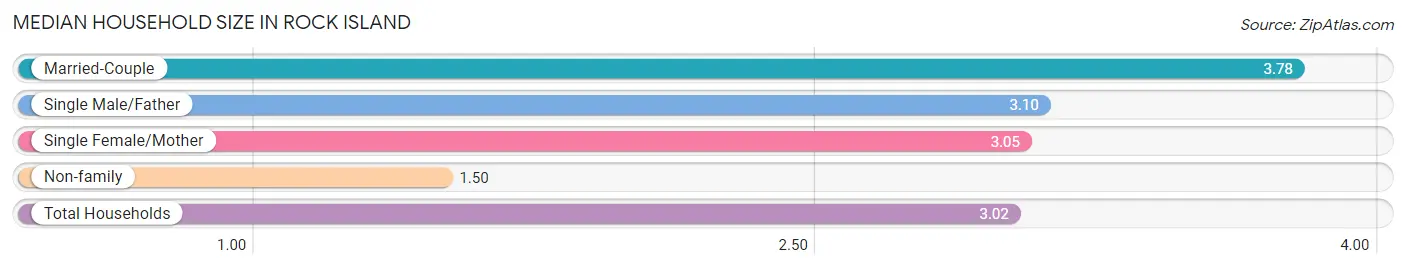
Median Household Size in Rock Island
The median household size in Rock Island is 3.02 persons per household, with married-couple households (232 | 55.6%) accounting for the largest median household size of 3.78 persons per household. non-family households (119 | 28.5%) represent the smallest median household size with 1.50 persons per household.
| Household Type | # Households | Household Size |
| Married-Couple | 232 (55.6%) | 3.78 |
| Single Male/Father | 10 (2.4%) | 3.10 |
| Single Female/Mother | 56 (13.4%) | 3.05 |
| Non-family | 119 (28.5%) | 1.50 |
| Total Households | 417 (100.0%) | 3.02 |
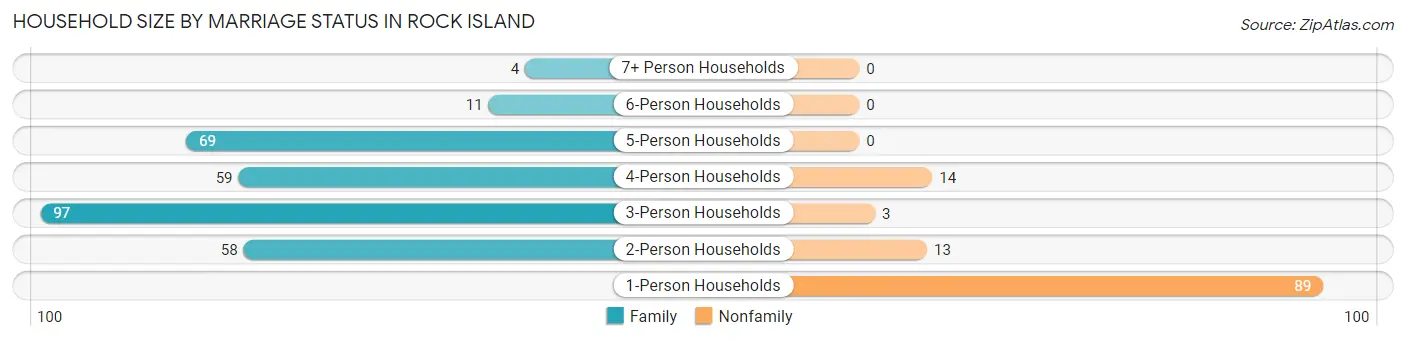
Household Size by Marriage Status in Rock Island
Out of a total of 417 households in Rock Island, 298 (71.5%) are family households, while 119 (28.5%) are nonfamily households. The most numerous type of family households are 3-person households, comprising 97, and the most common type of nonfamily households are 1-person households, comprising 89.
| Household Size | Family Households | Nonfamily Households |
| 1-Person Households | - | 89 (21.3%) |
| 2-Person Households | 58 (13.9%) | 13 (3.1%) |
| 3-Person Households | 97 (23.3%) | 3 (0.7%) |
| 4-Person Households | 59 (14.1%) | 14 (3.4%) |
| 5-Person Households | 69 (16.6%) | 0 (0.0%) |
| 6-Person Households | 11 (2.6%) | 0 (0.0%) |
| 7+ Person Households | 4 (1.0%) | 0 (0.0%) |
| Total | 298 (71.5%) | 119 (28.5%) |
Female Fertility in Rock Island
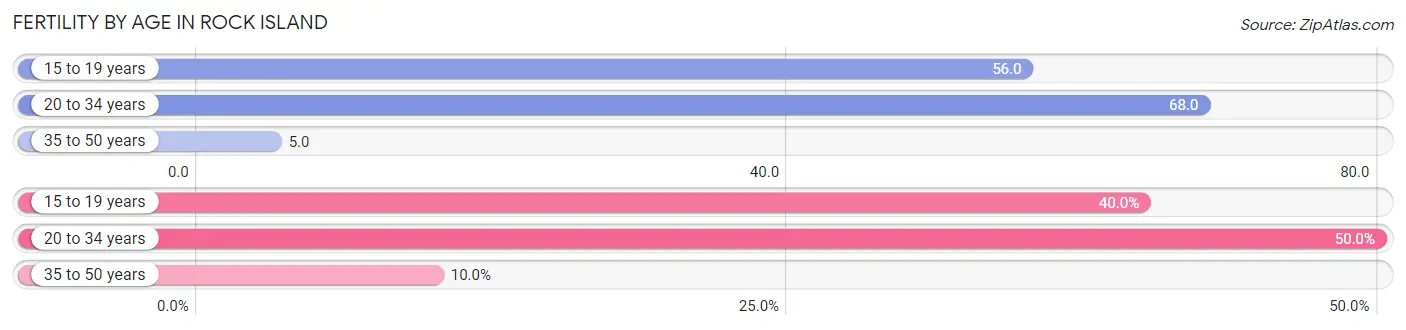
Fertility by Age in Rock Island
Average fertility rate in Rock Island is 30.0 births per 1,000 women. Women in the age bracket of 20 to 34 years have the highest fertility rate with 68.0 births per 1,000 women. Women in the age bracket of 20 to 34 years acount for 50.0% of all women with births.
| Age Bracket | Women with Births | Births / 1,000 Women |
| 15 to 19 years | 4 (40.0%) | 56.0 |
| 20 to 34 years | 5 (50.0%) | 68.0 |
| 35 to 50 years | 1 (10.0%) | 5.0 |
| Total | 10 (100.0%) | 30.0 |
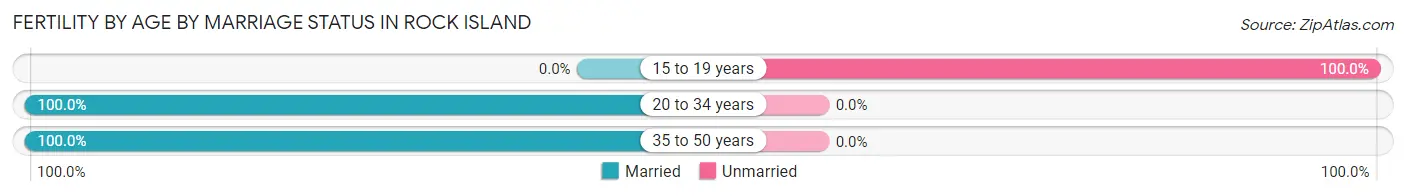
Fertility by Age by Marriage Status in Rock Island
60.0% of women with births (10) in Rock Island are married. The highest percentage of unmarried women with births falls into 15 to 19 years age bracket with 100.0% of them unmarried at the time of birth, while the lowest percentage of unmarried women with births belong to 20 to 34 years age bracket with 0.0% of them unmarried.
| Age Bracket | Married | Unmarried |
| 15 to 19 years | 0 (0.0%) | 4 (100.0%) |
| 20 to 34 years | 5 (100.0%) | 0 (0.0%) |
| 35 to 50 years | 1 (100.0%) | 0 (0.0%) |
| Total | 6 (60.0%) | 4 (40.0%) |
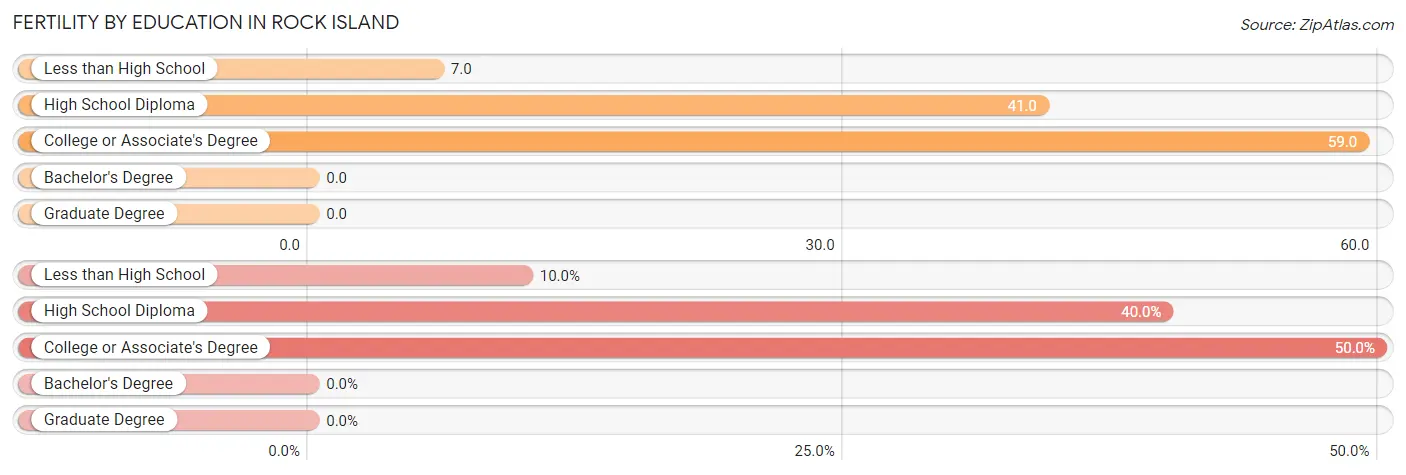
Fertility by Education in Rock Island
| Educational Attainment | Women with Births | Births / 1,000 Women |
| Less than High School | 1 (10.0%) | 7.0 |
| High School Diploma | 4 (40.0%) | 41.0 |
| College or Associate's Degree | 5 (50.0%) | 59.0 |
| Bachelor's Degree | 0 (0.0%) | 0.0 |
| Graduate Degree | 0 (0.0%) | 0.0 |
| Total | 10 (100.0%) | 30.0 |
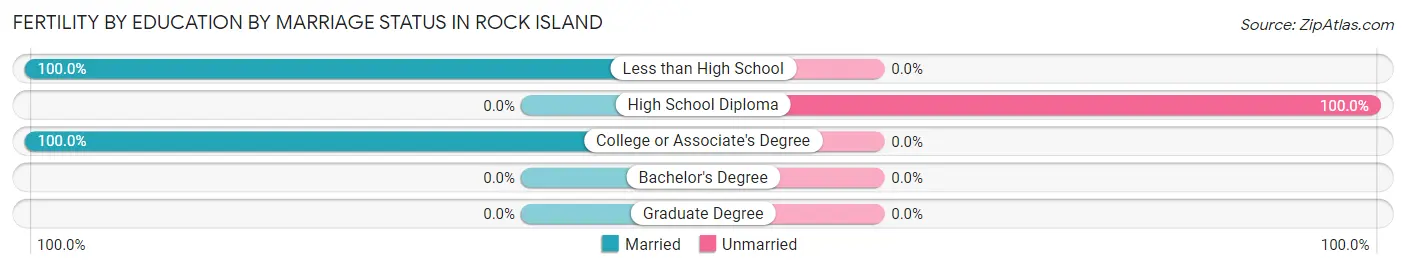
Fertility by Education by Marriage Status in Rock Island
40.0% of women with births in Rock Island are unmarried. Women with the educational attainment of less than high school are most likely to be married with 100.0% of them married at childbirth, while women with the educational attainment of high school diploma are least likely to be married with 100.0% of them unmarried at childbirth.
| Educational Attainment | Married | Unmarried |
| Less than High School | 1 (100.0%) | 0 (0.0%) |
| High School Diploma | 0 (0.0%) | 4 (100.0%) |
| College or Associate's Degree | 5 (100.0%) | 0 (0.0%) |
| Bachelor's Degree | 0 (0.0%) | 0 (0.0%) |
| Graduate Degree | 0 (0.0%) | 0 (0.0%) |
| Total | 6 (60.0%) | 4 (40.0%) |
Income in Rock Island
Income Overview in Rock Island
Per Capita Income in Rock Island is $20,929, while median incomes of families and households are $64,091 and $53,359 respectively.
| Characteristic | Number | Measure |
| Per Capita Income | 1,259 | $20,929 |
| Median Family Income | 298 | $64,091 |
| Mean Family Income | 298 | $68,795 |
| Median Household Income | 417 | $53,359 |
| Mean Household Income | 417 | $61,725 |
| Income Deficit | 298 | $0 |
| Wage / Income Gap (%) | 1,259 | 24.81% |
| Wage / Income Gap ($) | 1,259 | 75.19¢ per $1 |
| Gini / Inequality Index | 1,259 | 0.33 |
Earnings by Sex in Rock Island
Average Earnings in Rock Island are $30,690, $35,536 for men and $26,719 for women, a difference of 24.8%.
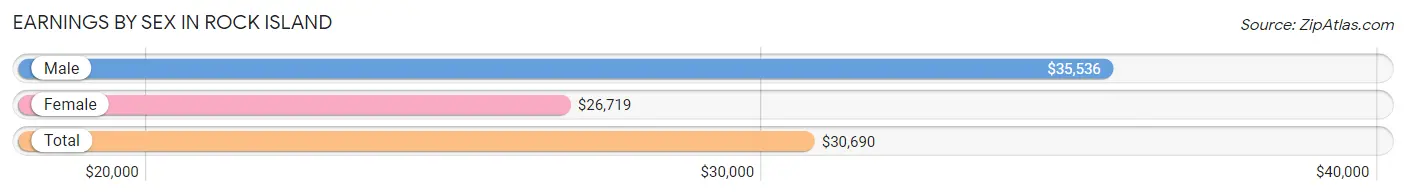
| Sex | Number | Average Earnings |
| Male | 311 (54.2%) | $35,536 |
| Female | 263 (45.8%) | $26,719 |
| Total | 574 (100.0%) | $30,690 |
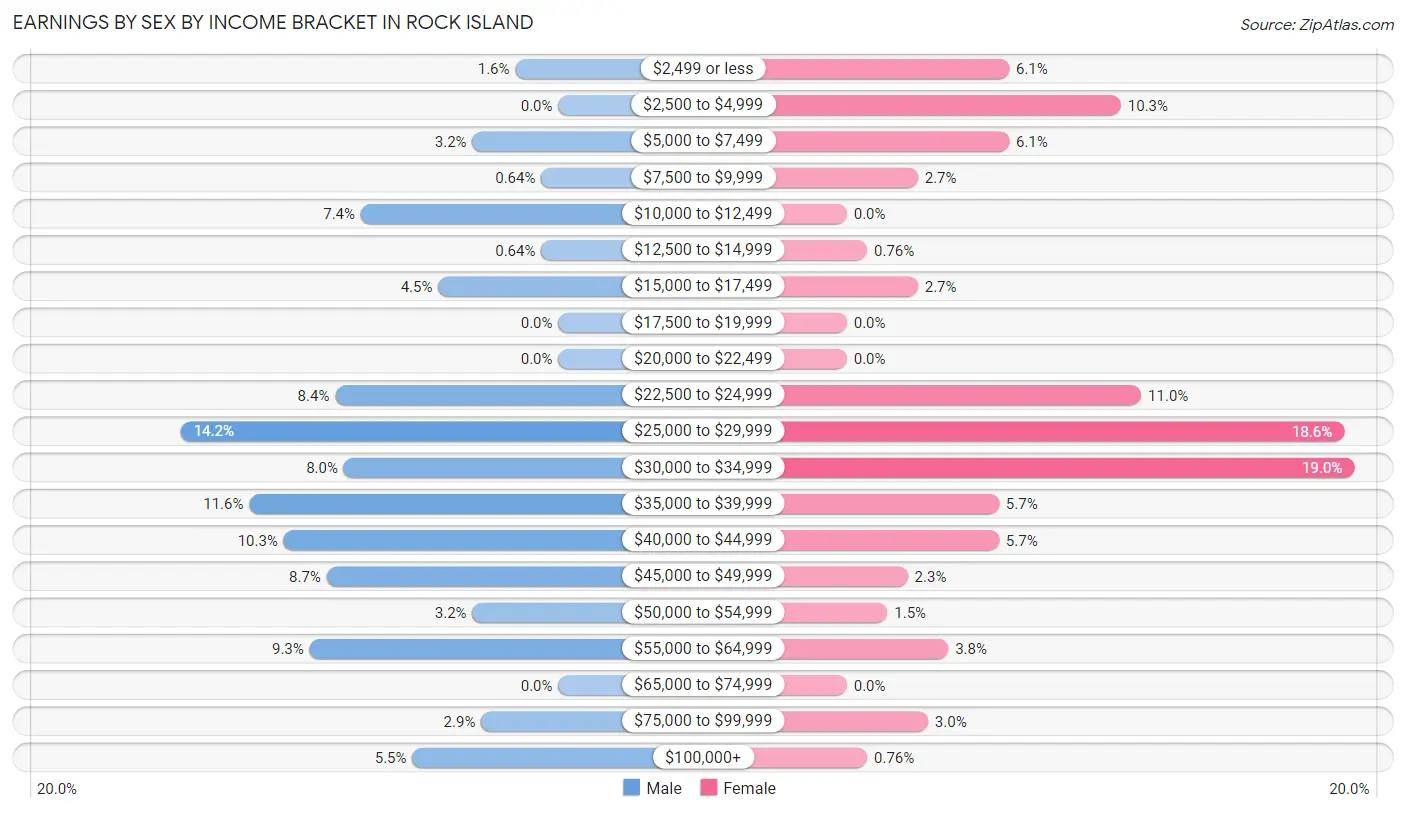
Earnings by Sex by Income Bracket in Rock Island
The most common earnings brackets in Rock Island are $25,000 to $29,999 for men (44 | 14.1%) and $30,000 to $34,999 for women (50 | 19.0%).
| Income | Male | Female |
| $2,499 or less | 5 (1.6%) | 16 (6.1%) |
| $2,500 to $4,999 | 0 (0.0%) | 27 (10.3%) |
| $5,000 to $7,499 | 10 (3.2%) | 16 (6.1%) |
| $7,500 to $9,999 | 2 (0.6%) | 7 (2.7%) |
| $10,000 to $12,499 | 23 (7.4%) | 0 (0.0%) |
| $12,500 to $14,999 | 2 (0.6%) | 2 (0.8%) |
| $15,000 to $17,499 | 14 (4.5%) | 7 (2.7%) |
| $17,500 to $19,999 | 0 (0.0%) | 0 (0.0%) |
| $20,000 to $22,499 | 0 (0.0%) | 0 (0.0%) |
| $22,500 to $24,999 | 26 (8.4%) | 29 (11.0%) |
| $25,000 to $29,999 | 44 (14.1%) | 49 (18.6%) |
| $30,000 to $34,999 | 25 (8.0%) | 50 (19.0%) |
| $35,000 to $39,999 | 36 (11.6%) | 15 (5.7%) |
| $40,000 to $44,999 | 32 (10.3%) | 15 (5.7%) |
| $45,000 to $49,999 | 27 (8.7%) | 6 (2.3%) |
| $50,000 to $54,999 | 10 (3.2%) | 4 (1.5%) |
| $55,000 to $64,999 | 29 (9.3%) | 10 (3.8%) |
| $65,000 to $74,999 | 0 (0.0%) | 0 (0.0%) |
| $75,000 to $99,999 | 9 (2.9%) | 8 (3.0%) |
| $100,000+ | 17 (5.5%) | 2 (0.8%) |
| Total | 311 (100.0%) | 263 (100.0%) |
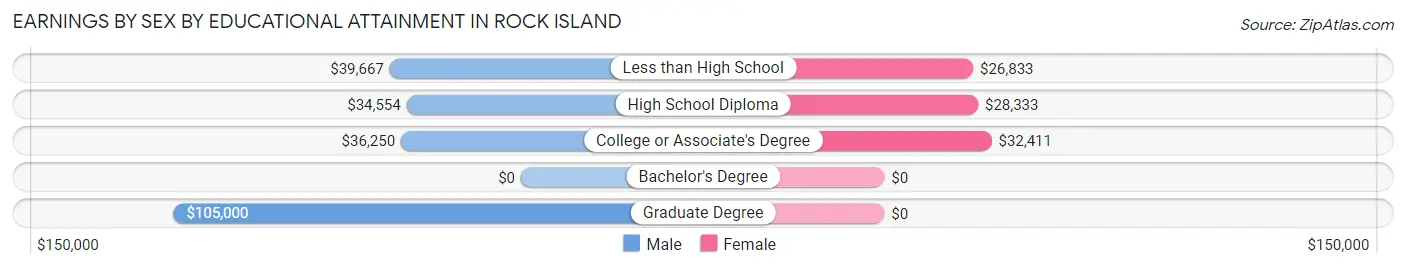
Earnings by Sex by Educational Attainment in Rock Island
Average earnings in Rock Island are $38,583 for men and $30,489 for women, a difference of 21.0%. Men with an educational attainment of graduate degree enjoy the highest average annual earnings of $105,000, while those with high school diploma education earn the least with $34,554. Women with an educational attainment of college or associate's degree earn the most with the average annual earnings of $32,411, while those with less than high school education have the smallest earnings of $26,833.
| Educational Attainment | Male Income | Female Income |
| Less than High School | $39,667 | $26,833 |
| High School Diploma | $34,554 | $28,333 |
| College or Associate's Degree | $36,250 | $32,411 |
| Bachelor's Degree | - | - |
| Graduate Degree | $105,000 | $0 |
| Total | $38,583 | $30,489 |
Family Income in Rock Island
Family Income Brackets in Rock Island
According to the Rock Island family income data, there are 87 families falling into the $75,000 to $99,999 income range, which is the most common income bracket and makes up 29.2% of all families.
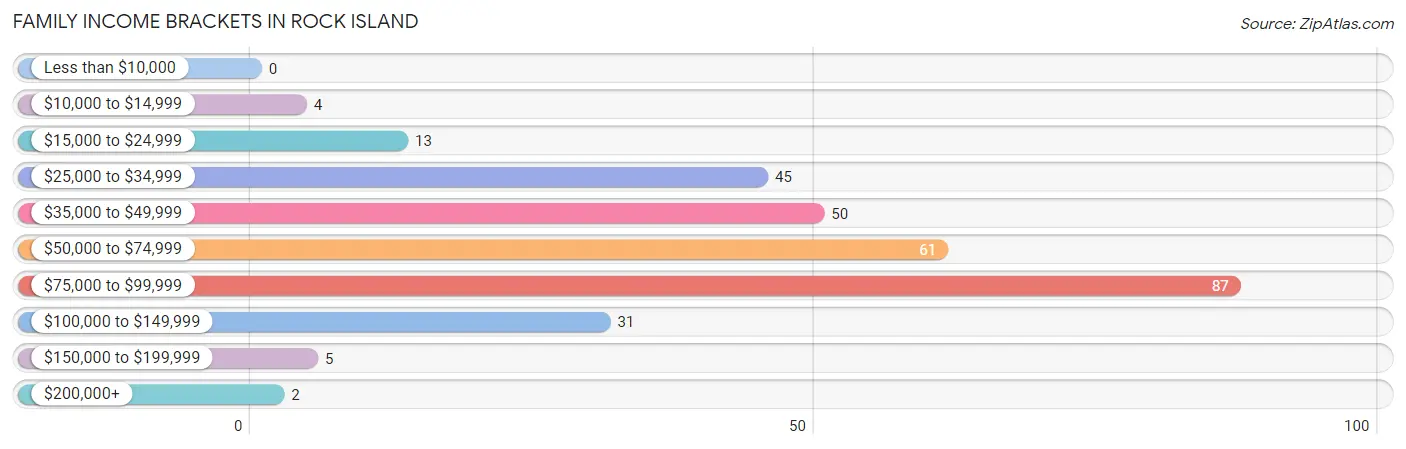
| Income Bracket | # Families | % Families |
| Less than $10,000 | 0 | 0.0% |
| $10,000 to $14,999 | 4 | 1.3% |
| $15,000 to $24,999 | 13 | 4.4% |
| $25,000 to $34,999 | 45 | 15.1% |
| $35,000 to $49,999 | 50 | 16.8% |
| $50,000 to $74,999 | 61 | 20.5% |
| $75,000 to $99,999 | 87 | 29.2% |
| $100,000 to $149,999 | 31 | 10.4% |
| $150,000 to $199,999 | 5 | 1.7% |
| $200,000+ | 2 | 0.7% |
Family Income by Famaliy Size in Rock Island
6-person families (11 | 3.7%) account for the highest median family income in Rock Island with $123,542 per family, while 2-person families (66 | 22.2%) have the highest median income of $24,375 per family member.
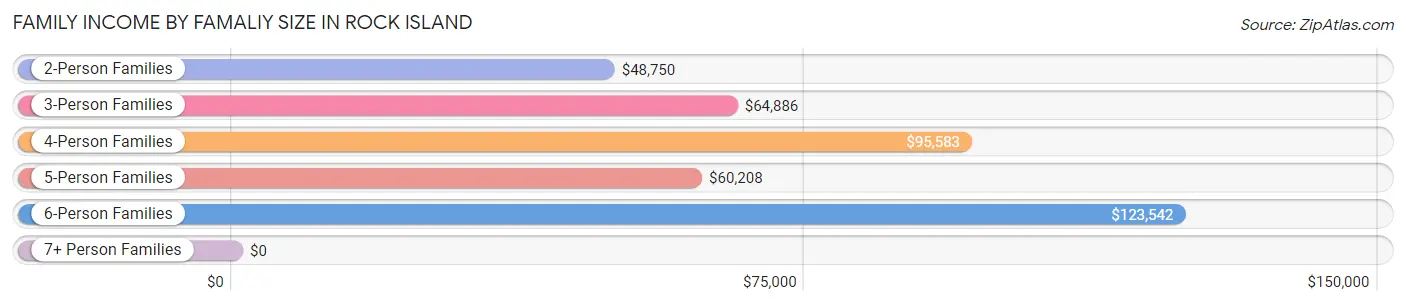
| Income Bracket | # Families | Median Income |
| 2-Person Families | 66 (22.2%) | $48,750 |
| 3-Person Families | 93 (31.2%) | $64,886 |
| 4-Person Families | 55 (18.5%) | $95,583 |
| 5-Person Families | 69 (23.2%) | $60,208 |
| 6-Person Families | 11 (3.7%) | $123,542 |
| 7+ Person Families | 4 (1.3%) | $0 |
| Total | 298 (100.0%) | $64,091 |
Family Income by Number of Earners in Rock Island
The median family income in Rock Island is $64,091, with families comprising 3+ earners (66) having the highest median family income of $87,917, while families with no earners (31) have the lowest median family income of $26,339, accounting for 22.2% and 10.4% of families, respectively.
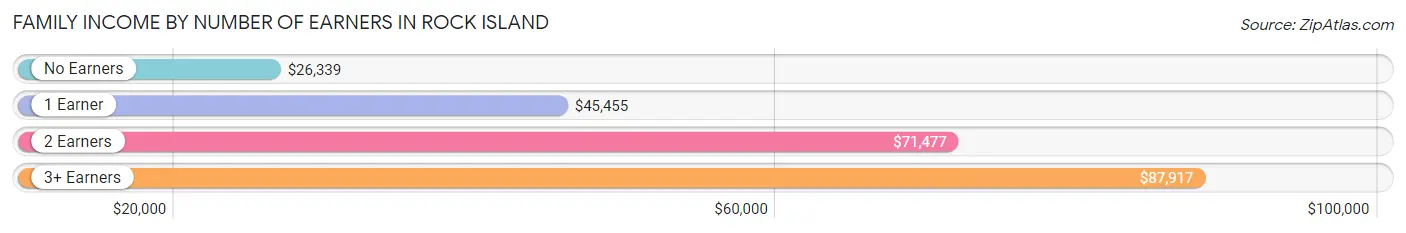
| Number of Earners | # Families | Median Income |
| No Earners | 31 (10.4%) | $26,339 |
| 1 Earner | 112 (37.6%) | $45,455 |
| 2 Earners | 89 (29.9%) | $71,477 |
| 3+ Earners | 66 (22.2%) | $87,917 |
| Total | 298 (100.0%) | $64,091 |
Household Income in Rock Island
Household Income Brackets in Rock Island
With 108 households falling in the category, the $75,000 to $99,999 income range is the most frequent in Rock Island, accounting for 25.9% of all households.
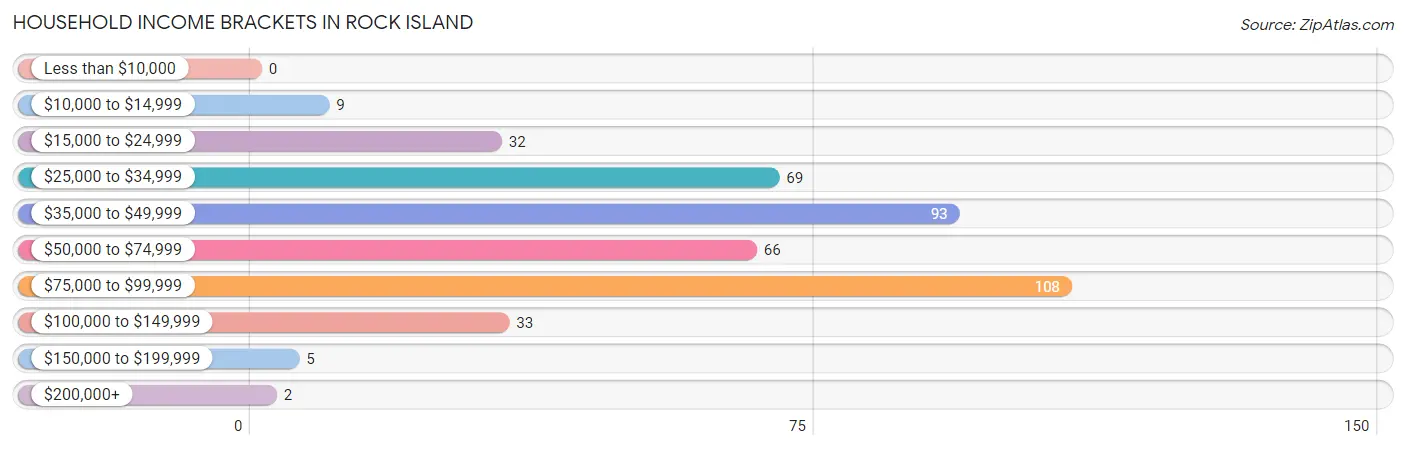
| Income Bracket | # Households | % Households |
| Less than $10,000 | 0 | 0.0% |
| $10,000 to $14,999 | 9 | 2.2% |
| $15,000 to $24,999 | 32 | 7.7% |
| $25,000 to $34,999 | 69 | 16.5% |
| $35,000 to $49,999 | 93 | 22.3% |
| $50,000 to $74,999 | 66 | 15.8% |
| $75,000 to $99,999 | 108 | 25.9% |
| $100,000 to $149,999 | 33 | 7.9% |
| $150,000 to $199,999 | 5 | 1.2% |
| $200,000+ | 2 | 0.5% |
Household Income by Householder Age in Rock Island
The median household income in Rock Island is $53,359, with the highest median household income of $96,563 found in the 15 to 24 years age bracket for the primary householder. A total of 9 households (2.2%) fall into this category. Meanwhile, the 65+ years age bracket for the primary householder has the lowest median household income of $38,346, with 101 households (24.2%) in this group.
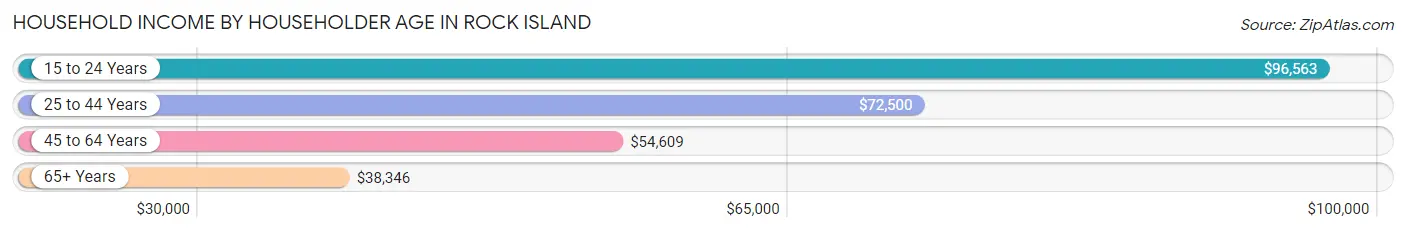
| Income Bracket | # Households | Median Income |
| 15 to 24 Years | 9 (2.2%) | $96,563 |
| 25 to 44 Years | 152 (36.4%) | $72,500 |
| 45 to 64 Years | 155 (37.2%) | $54,609 |
| 65+ Years | 101 (24.2%) | $38,346 |
| Total | 417 (100.0%) | $53,359 |
Poverty in Rock Island
Income Below Poverty by Sex and Age in Rock Island
With 6.3% poverty level for males and 5.7% for females among the residents of Rock Island, 5 year old males and 15 year old females are the most vulnerable to poverty, with 2 males (100.0%) and 14 females (58.3%) in their respective age groups living below the poverty level.
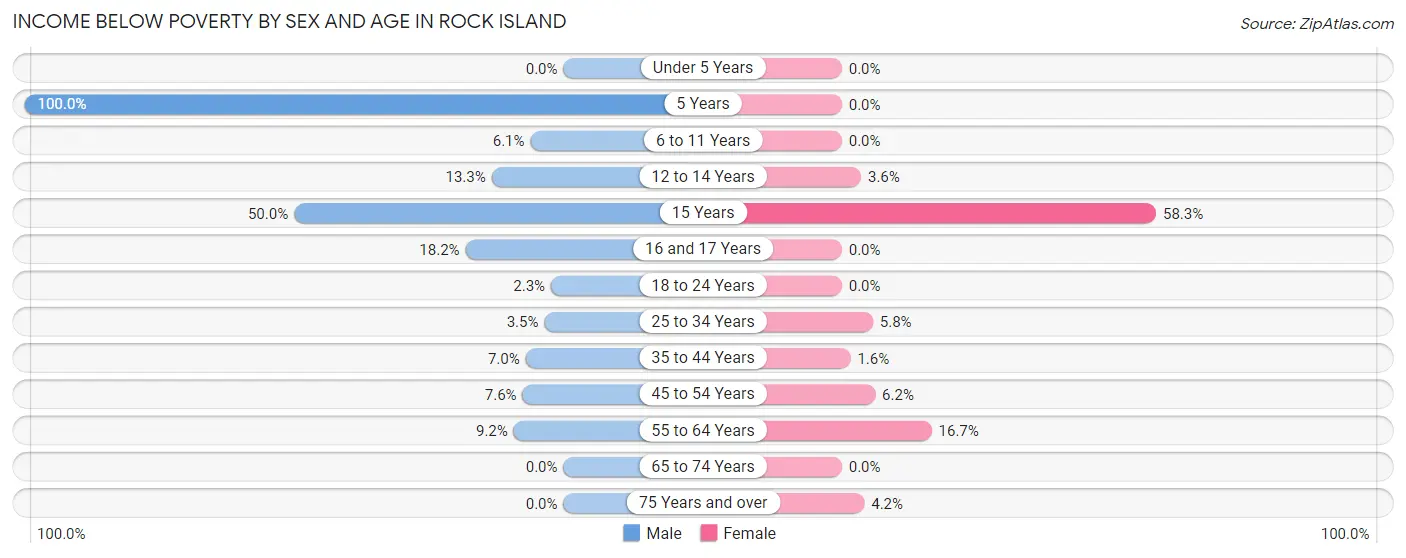
| Age Bracket | Male | Female |
| Under 5 Years | 0 (0.0%) | 0 (0.0%) |
| 5 Years | 2 (100.0%) | 0 (0.0%) |
| 6 to 11 Years | 3 (6.1%) | 0 (0.0%) |
| 12 to 14 Years | 2 (13.3%) | 2 (3.6%) |
| 15 Years | 2 (50.0%) | 14 (58.3%) |
| 16 and 17 Years | 6 (18.2%) | 0 (0.0%) |
| 18 to 24 Years | 2 (2.3%) | 0 (0.0%) |
| 25 to 34 Years | 3 (3.5%) | 3 (5.8%) |
| 35 to 44 Years | 4 (7.0%) | 2 (1.6%) |
| 45 to 54 Years | 6 (7.6%) | 6 (6.2%) |
| 55 to 64 Years | 6 (9.2%) | 10 (16.7%) |
| 65 to 74 Years | 0 (0.0%) | 0 (0.0%) |
| 75 Years and over | 0 (0.0%) | 2 (4.2%) |
| Total | 36 (6.3%) | 39 (5.7%) |
Income Above Poverty by Sex and Age in Rock Island
According to the poverty statistics in Rock Island, males aged under 5 years and females aged under 5 years are the age groups that are most secure financially, with 100.0% of males and 100.0% of females in these age groups living above the poverty line.
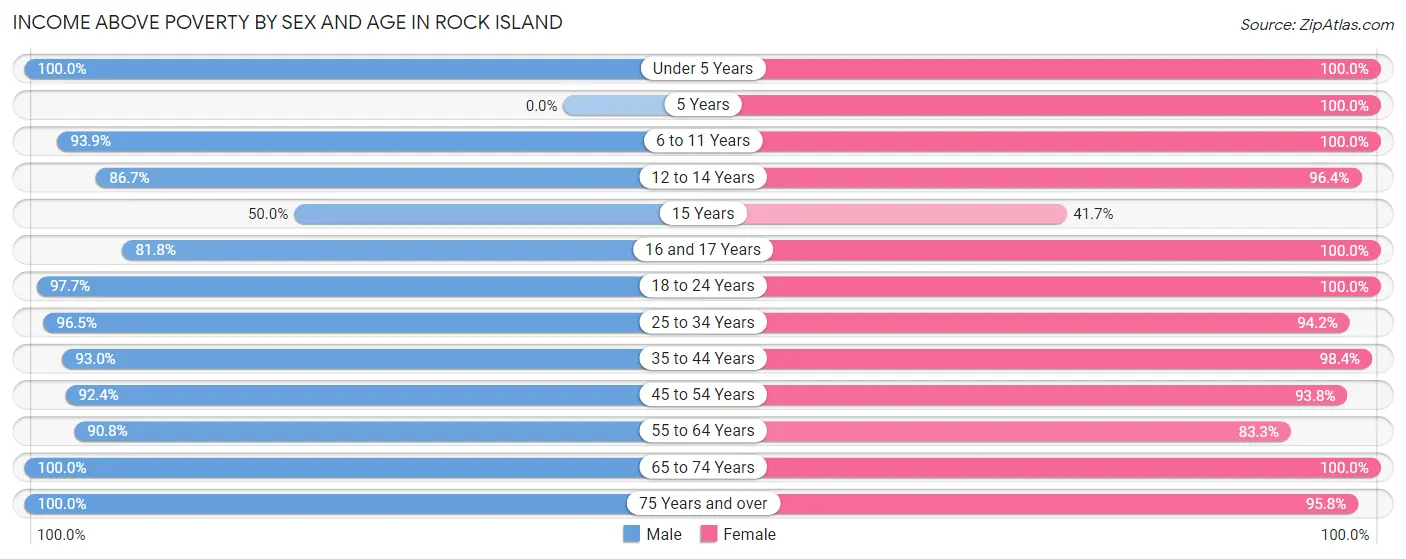
| Age Bracket | Male | Female |
| Under 5 Years | 19 (100.0%) | 54 (100.0%) |
| 5 Years | 0 (0.0%) | 23 (100.0%) |
| 6 to 11 Years | 46 (93.9%) | 49 (100.0%) |
| 12 to 14 Years | 13 (86.7%) | 54 (96.4%) |
| 15 Years | 2 (50.0%) | 10 (41.7%) |
| 16 and 17 Years | 27 (81.8%) | 32 (100.0%) |
| 18 to 24 Years | 85 (97.7%) | 37 (100.0%) |
| 25 to 34 Years | 82 (96.5%) | 49 (94.2%) |
| 35 to 44 Years | 53 (93.0%) | 122 (98.4%) |
| 45 to 54 Years | 73 (92.4%) | 91 (93.8%) |
| 55 to 64 Years | 59 (90.8%) | 50 (83.3%) |
| 65 to 74 Years | 44 (100.0%) | 25 (100.0%) |
| 75 Years and over | 29 (100.0%) | 46 (95.8%) |
| Total | 532 (93.7%) | 642 (94.3%) |
Income Below Poverty Among Married-Couple Families in Rock Island
The poverty statistics for married-couple families in Rock Island show that 6.0% or 14 of the total 232 families live below the poverty line. Families with 5 or more children have the highest poverty rate of 100.0%, comprising of 4 families. On the other hand, families with 3 or 4 children have the lowest poverty rate of 0.0%, which includes 0 families.
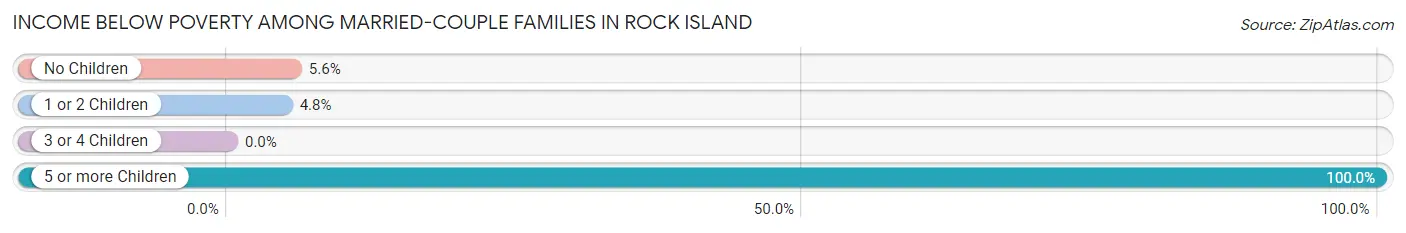
| Children | Above Poverty | Below Poverty |
| No Children | 68 (94.4%) | 4 (5.6%) |
| 1 or 2 Children | 120 (95.2%) | 6 (4.8%) |
| 3 or 4 Children | 30 (100.0%) | 0 (0.0%) |
| 5 or more Children | 0 (0.0%) | 4 (100.0%) |
| Total | 218 (94.0%) | 14 (6.0%) |
Income Below Poverty Among Single-Parent Households in Rock Island
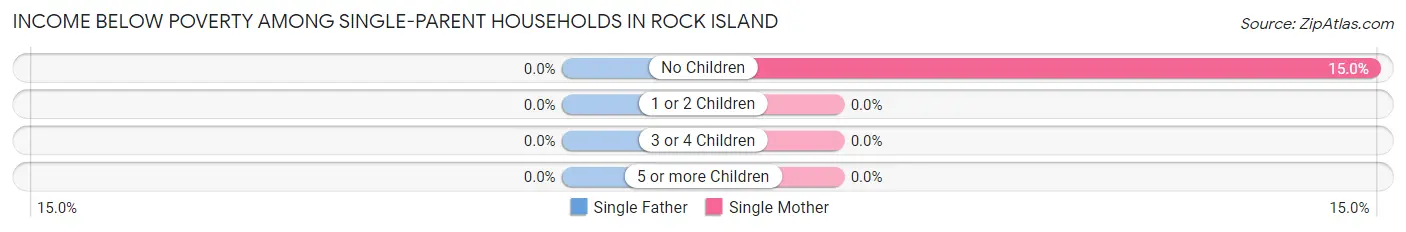
| Children | Single Father | Single Mother |
| No Children | 0 (0.0%) | 3 (15.0%) |
| 1 or 2 Children | 0 (0.0%) | 0 (0.0%) |
| 3 or 4 Children | 0 (0.0%) | 0 (0.0%) |
| 5 or more Children | 0 (0.0%) | 0 (0.0%) |
| Total | 0 (0.0%) | 3 (5.4%) |
Income Below Poverty Among Married-Couple vs Single-Parent Households in Rock Island
The poverty data for Rock Island shows that 14 of the married-couple family households (6.0%) and 3 of the single-parent households (4.5%) are living below the poverty level. Within the married-couple family households, those with 5 or more children have the highest poverty rate, with 4 households (100.0%) falling below the poverty line. Among the single-parent households, those with no children have the highest poverty rate, with 3 household (10.0%) living below poverty.
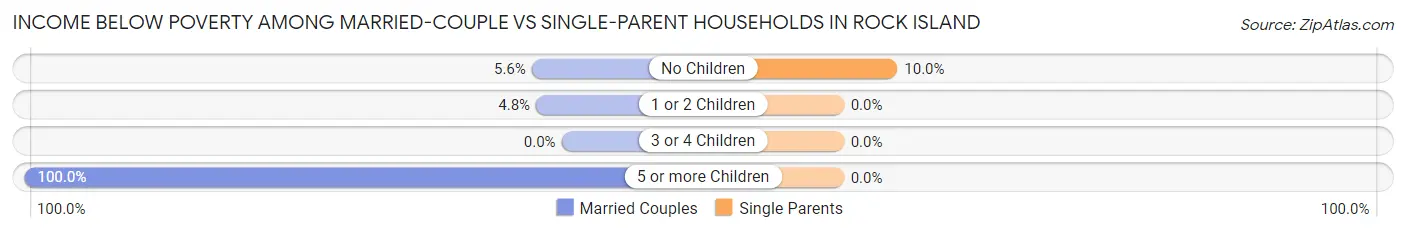
| Children | Married-Couple Families | Single-Parent Households |
| No Children | 4 (5.6%) | 3 (10.0%) |
| 1 or 2 Children | 6 (4.8%) | 0 (0.0%) |
| 3 or 4 Children | 0 (0.0%) | 0 (0.0%) |
| 5 or more Children | 4 (100.0%) | 0 (0.0%) |
| Total | 14 (6.0%) | 3 (4.5%) |
Employment Characteristics in Rock Island
Employment by Class of Employer in Rock Island
Among the 481 employed individuals in Rock Island, private company employees (340 | 70.7%), self-employed (not incorporated) (43 | 8.9%), and local government employees (38 | 7.9%) make up the most common classes of employment.
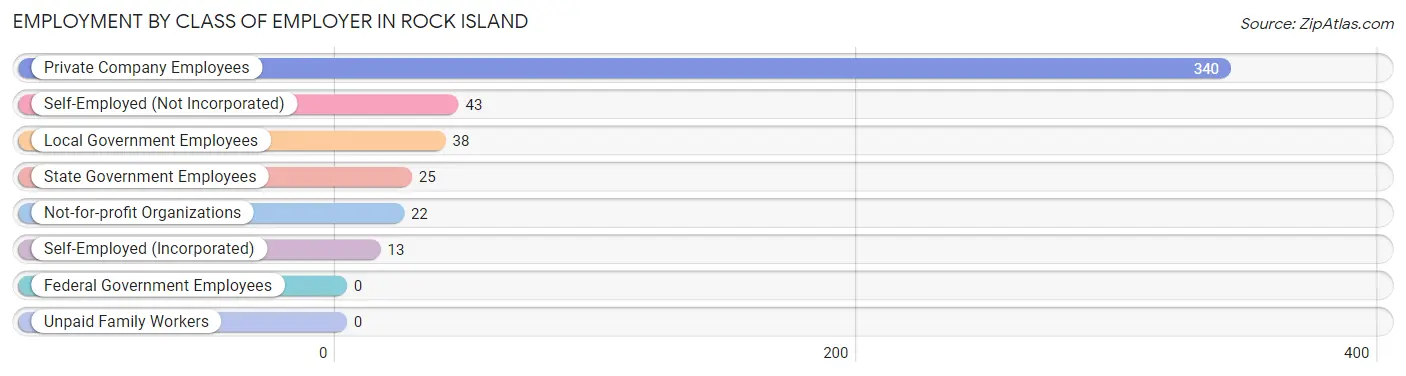
| Employer Class | # Employees | % Employees |
| Private Company Employees | 340 | 70.7% |
| Self-Employed (Incorporated) | 13 | 2.7% |
| Self-Employed (Not Incorporated) | 43 | 8.9% |
| Not-for-profit Organizations | 22 | 4.6% |
| Local Government Employees | 38 | 7.9% |
| State Government Employees | 25 | 5.2% |
| Federal Government Employees | 0 | 0.0% |
| Unpaid Family Workers | 0 | 0.0% |
| Total | 481 | 100.0% |
Employment Status by Age in Rock Island
According to the labor force statistics for Rock Island, out of the total population over 16 years of age (954), 54.2% or 517 individuals are in the labor force, with 7.0% or 36 of them unemployed. The age group with the highest labor force participation rate is 25 to 29 years, with 78.9% or 71 individuals in the labor force. Within the labor force, the 20 to 24 years age range has the highest percentage of unemployed individuals, with 37.0% or 17 of them being unemployed.
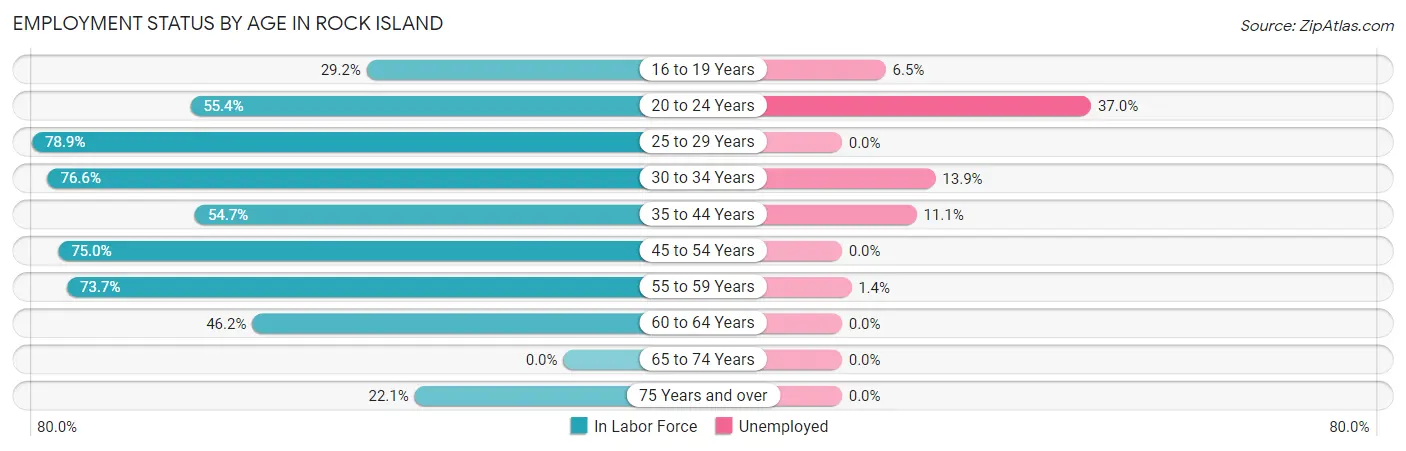
| Age Bracket | In Labor Force | Unemployed |
| 16 to 19 Years | 31 (29.2%) | 2 (6.5%) |
| 20 to 24 Years | 46 (55.4%) | 17 (37.0%) |
| 25 to 29 Years | 71 (78.9%) | 0 (0.0%) |
| 30 to 34 Years | 36 (76.6%) | 5 (13.9%) |
| 35 to 44 Years | 99 (54.7%) | 11 (11.1%) |
| 45 to 54 Years | 132 (75.0%) | 0 (0.0%) |
| 55 to 59 Years | 73 (73.7%) | 1 (1.4%) |
| 60 to 64 Years | 12 (46.2%) | 0 (0.0%) |
| 65 to 74 Years | 0 (0.0%) | 0 (0.0%) |
| 75 Years and over | 17 (22.1%) | 0 (0.0%) |
| Total | 517 (54.2%) | 36 (7.0%) |
Employment Status by Educational Attainment in Rock Island
According to labor force statistics for Rock Island, 68.3% of individuals (423) out of the total population between 25 and 64 years of age (619) are in the labor force, with 4.0% or 17 of them being unemployed. The group with the highest labor force participation rate are those with the educational attainment of less than high school, with 73.8% or 206 individuals in the labor force. Within the labor force, individuals with less than high school education have the highest percentage of unemployment, with 7.8% or 16 of them being unemployed.
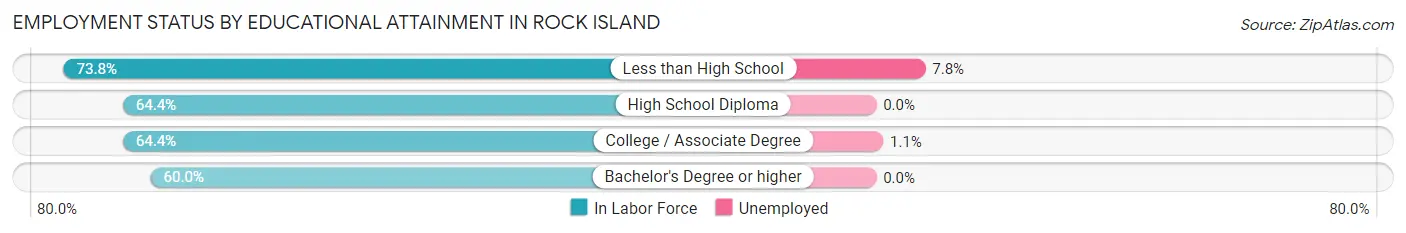
| Educational Attainment | In Labor Force | Unemployed |
| Less than High School | 206 (73.8%) | 22 (7.8%) |
| High School Diploma | 103 (64.4%) | 0 (0.0%) |
| College / Associate Degree | 87 (64.4%) | 1 (1.1%) |
| Bachelor's Degree or higher | 27 (60.0%) | 0 (0.0%) |
| Total | 423 (68.3%) | 25 (4.0%) |
Employment Occupations by Sex in Rock Island
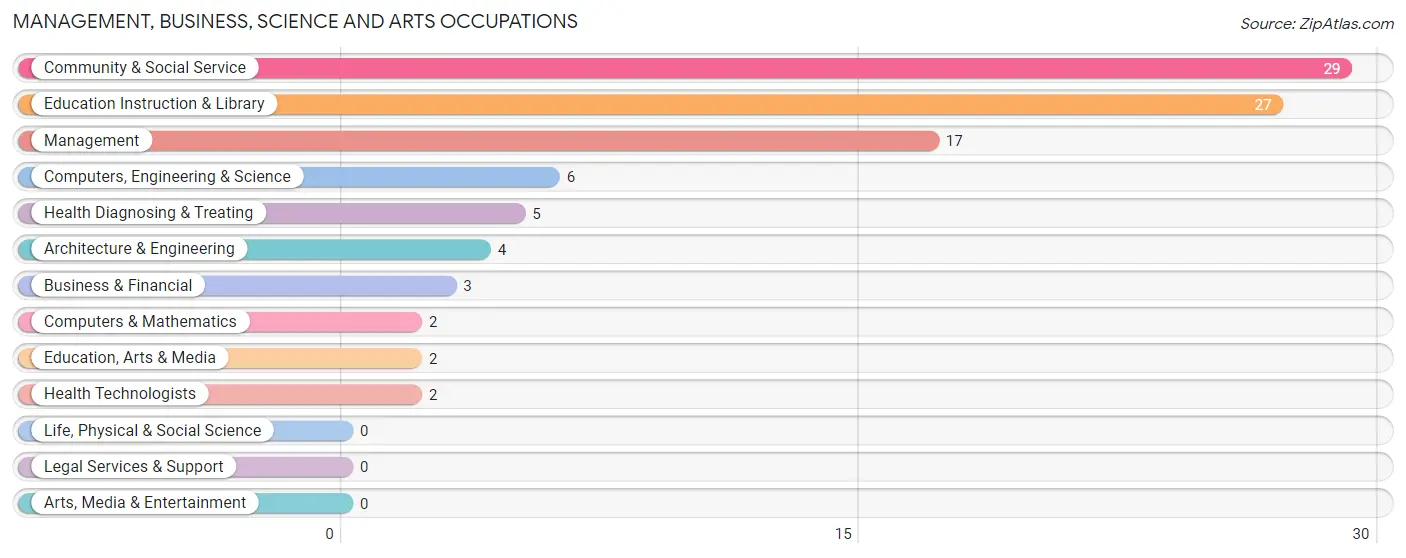
Management, Business, Science and Arts Occupations
The most common Management, Business, Science and Arts occupations in Rock Island are Community & Social Service (29 | 6.0%), Education Instruction & Library (27 | 5.6%), Management (17 | 3.5%), Computers, Engineering & Science (6 | 1.3%), and Health Diagnosing & Treating (5 | 1.0%).
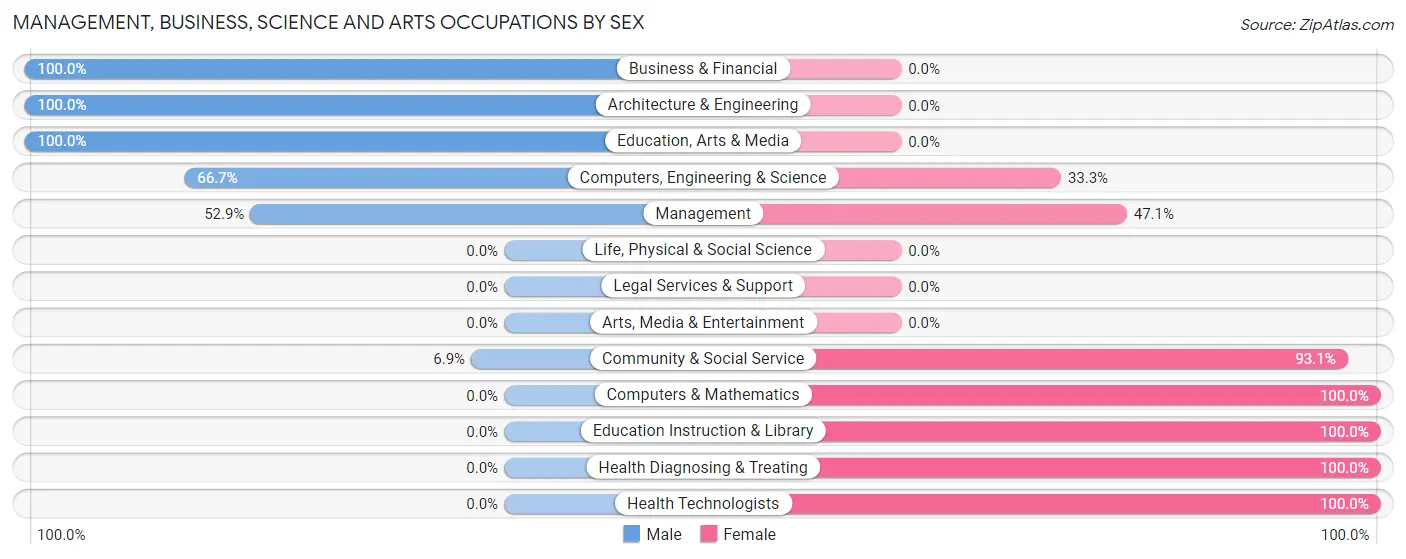
Management, Business, Science and Arts Occupations by Sex
Within the Management, Business, Science and Arts occupations in Rock Island, the most male-oriented occupations are Business & Financial (100.0%), Architecture & Engineering (100.0%), and Education, Arts & Media (100.0%), while the most female-oriented occupations are Computers & Mathematics (100.0%), Education Instruction & Library (100.0%), and Health Diagnosing & Treating (100.0%).
| Occupation | Male | Female |
| Management | 9 (52.9%) | 8 (47.1%) |
| Business & Financial | 3 (100.0%) | 0 (0.0%) |
| Computers, Engineering & Science | 4 (66.7%) | 2 (33.3%) |
| Computers & Mathematics | 0 (0.0%) | 2 (100.0%) |
| Architecture & Engineering | 4 (100.0%) | 0 (0.0%) |
| Life, Physical & Social Science | 0 (0.0%) | 0 (0.0%) |
| Community & Social Service | 2 (6.9%) | 27 (93.1%) |
| Education, Arts & Media | 2 (100.0%) | 0 (0.0%) |
| Legal Services & Support | 0 (0.0%) | 0 (0.0%) |
| Education Instruction & Library | 0 (0.0%) | 27 (100.0%) |
| Arts, Media & Entertainment | 0 (0.0%) | 0 (0.0%) |
| Health Diagnosing & Treating | 0 (0.0%) | 5 (100.0%) |
| Health Technologists | 0 (0.0%) | 2 (100.0%) |
| Total (Category) | 18 (30.0%) | 42 (70.0%) |
| Total (Overall) | 247 (51.3%) | 234 (48.6%) |
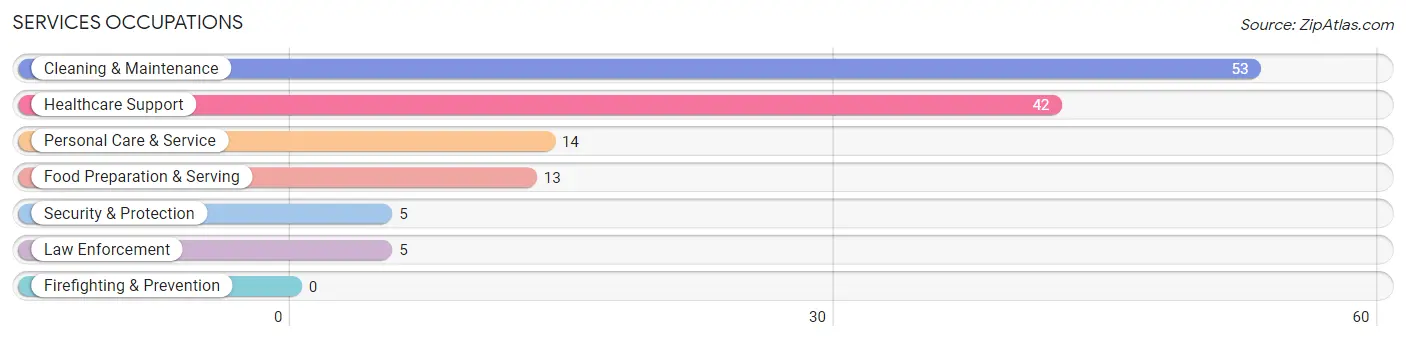
Services Occupations
The most common Services occupations in Rock Island are Cleaning & Maintenance (53 | 11.0%), Healthcare Support (42 | 8.7%), Personal Care & Service (14 | 2.9%), Food Preparation & Serving (13 | 2.7%), and Security & Protection (5 | 1.0%).
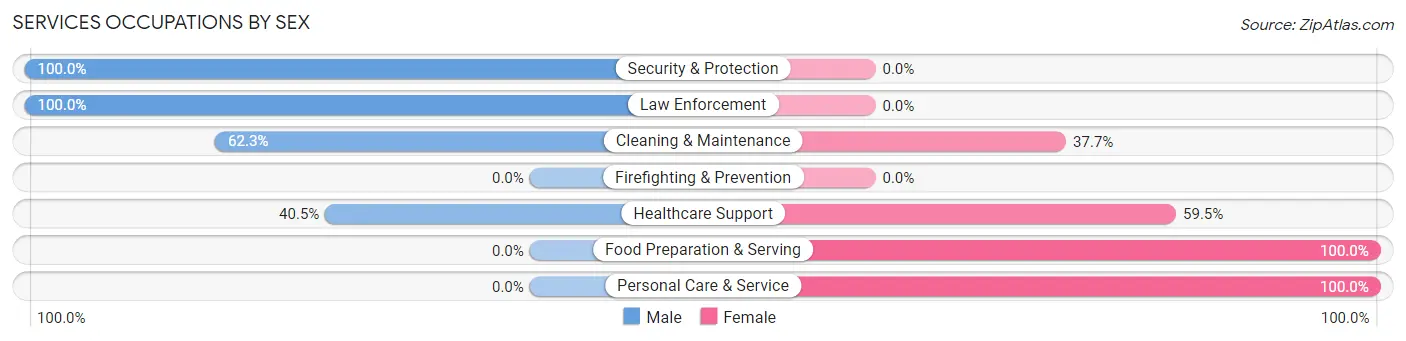
Services Occupations by Sex
Within the Services occupations in Rock Island, the most male-oriented occupations are Security & Protection (100.0%), Law Enforcement (100.0%), and Cleaning & Maintenance (62.3%), while the most female-oriented occupations are Food Preparation & Serving (100.0%), Personal Care & Service (100.0%), and Healthcare Support (59.5%).
| Occupation | Male | Female |
| Healthcare Support | 17 (40.5%) | 25 (59.5%) |
| Security & Protection | 5 (100.0%) | 0 (0.0%) |
| Firefighting & Prevention | 0 (0.0%) | 0 (0.0%) |
| Law Enforcement | 5 (100.0%) | 0 (0.0%) |
| Food Preparation & Serving | 0 (0.0%) | 13 (100.0%) |
| Cleaning & Maintenance | 33 (62.3%) | 20 (37.7%) |
| Personal Care & Service | 0 (0.0%) | 14 (100.0%) |
| Total (Category) | 55 (43.3%) | 72 (56.7%) |
| Total (Overall) | 247 (51.3%) | 234 (48.6%) |
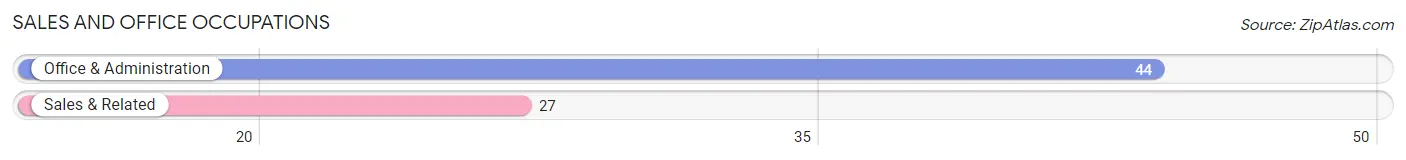
Sales and Office Occupations
The most common Sales and Office occupations in Rock Island are Office & Administration (44 | 9.1%), and Sales & Related (27 | 5.6%).
Sales and Office Occupations by Sex
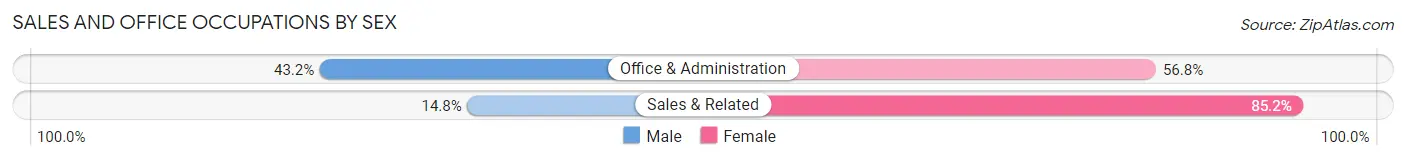
| Occupation | Male | Female |
| Sales & Related | 4 (14.8%) | 23 (85.2%) |
| Office & Administration | 19 (43.2%) | 25 (56.8%) |
| Total (Category) | 23 (32.4%) | 48 (67.6%) |
| Total (Overall) | 247 (51.3%) | 234 (48.6%) |
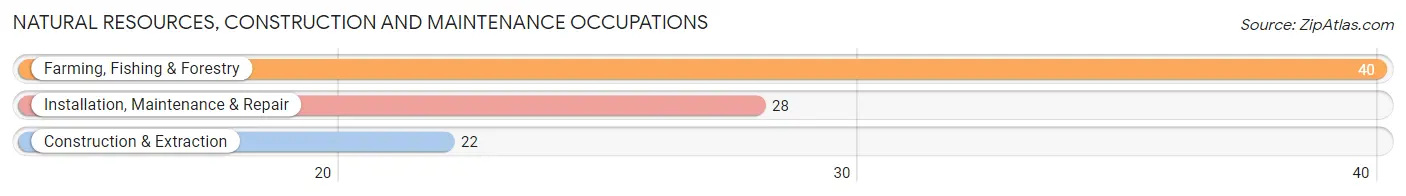
Natural Resources, Construction and Maintenance Occupations
The most common Natural Resources, Construction and Maintenance occupations in Rock Island are Farming, Fishing & Forestry (40 | 8.3%), Installation, Maintenance & Repair (28 | 5.8%), and Construction & Extraction (22 | 4.6%).
Natural Resources, Construction and Maintenance Occupations by Sex
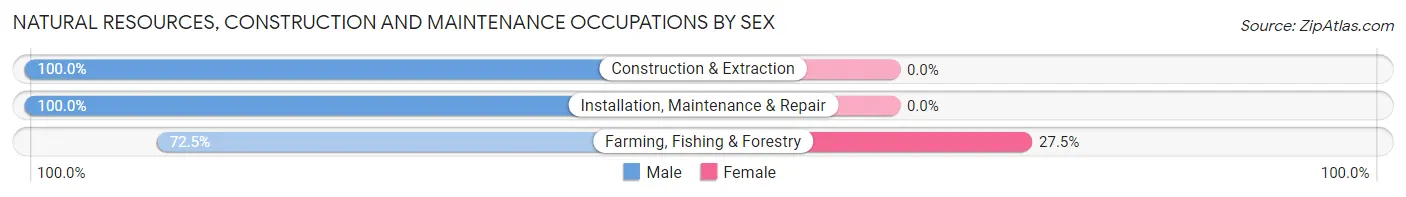
| Occupation | Male | Female |
| Farming, Fishing & Forestry | 29 (72.5%) | 11 (27.5%) |
| Construction & Extraction | 22 (100.0%) | 0 (0.0%) |
| Installation, Maintenance & Repair | 28 (100.0%) | 0 (0.0%) |
| Total (Category) | 79 (87.8%) | 11 (12.2%) |
| Total (Overall) | 247 (51.3%) | 234 (48.6%) |
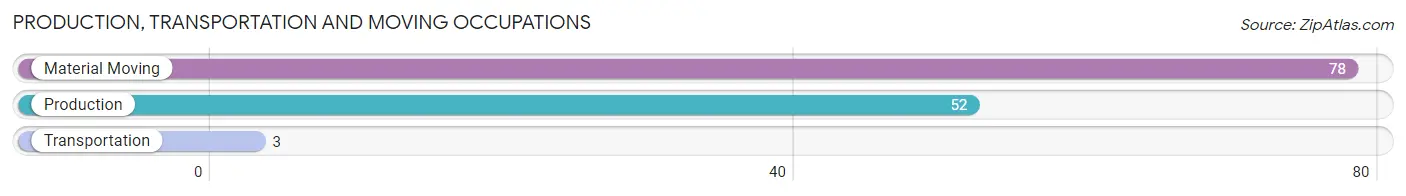
Production, Transportation and Moving Occupations
The most common Production, Transportation and Moving occupations in Rock Island are Material Moving (78 | 16.2%), Production (52 | 10.8%), and Transportation (3 | 0.6%).
Production, Transportation and Moving Occupations by Sex
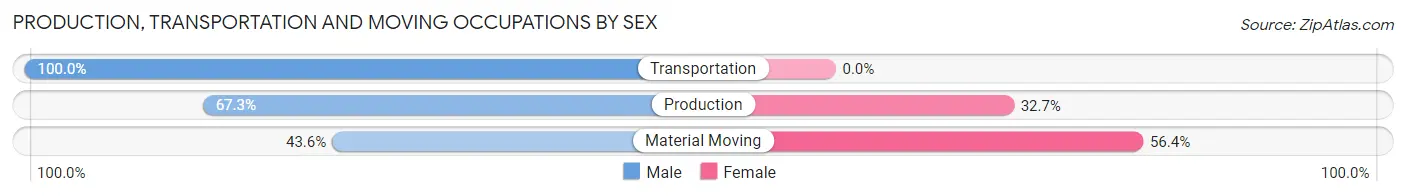
| Occupation | Male | Female |
| Production | 35 (67.3%) | 17 (32.7%) |
| Transportation | 3 (100.0%) | 0 (0.0%) |
| Material Moving | 34 (43.6%) | 44 (56.4%) |
| Total (Category) | 72 (54.1%) | 61 (45.9%) |
| Total (Overall) | 247 (51.3%) | 234 (48.6%) |
Employment Industries by Sex in Rock Island
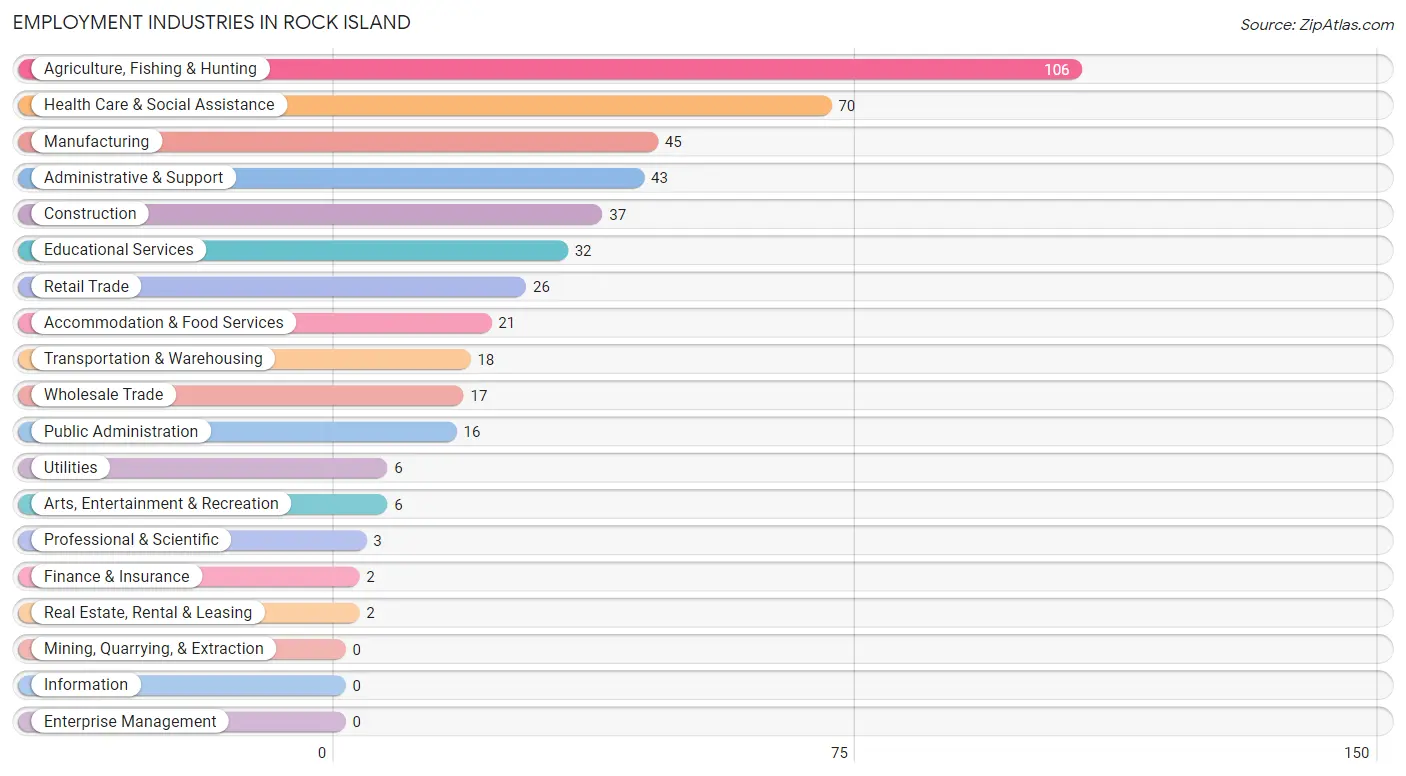
Employment Industries in Rock Island
The major employment industries in Rock Island include Agriculture, Fishing & Hunting (106 | 22.0%), Health Care & Social Assistance (70 | 14.5%), Manufacturing (45 | 9.4%), Administrative & Support (43 | 8.9%), and Construction (37 | 7.7%).
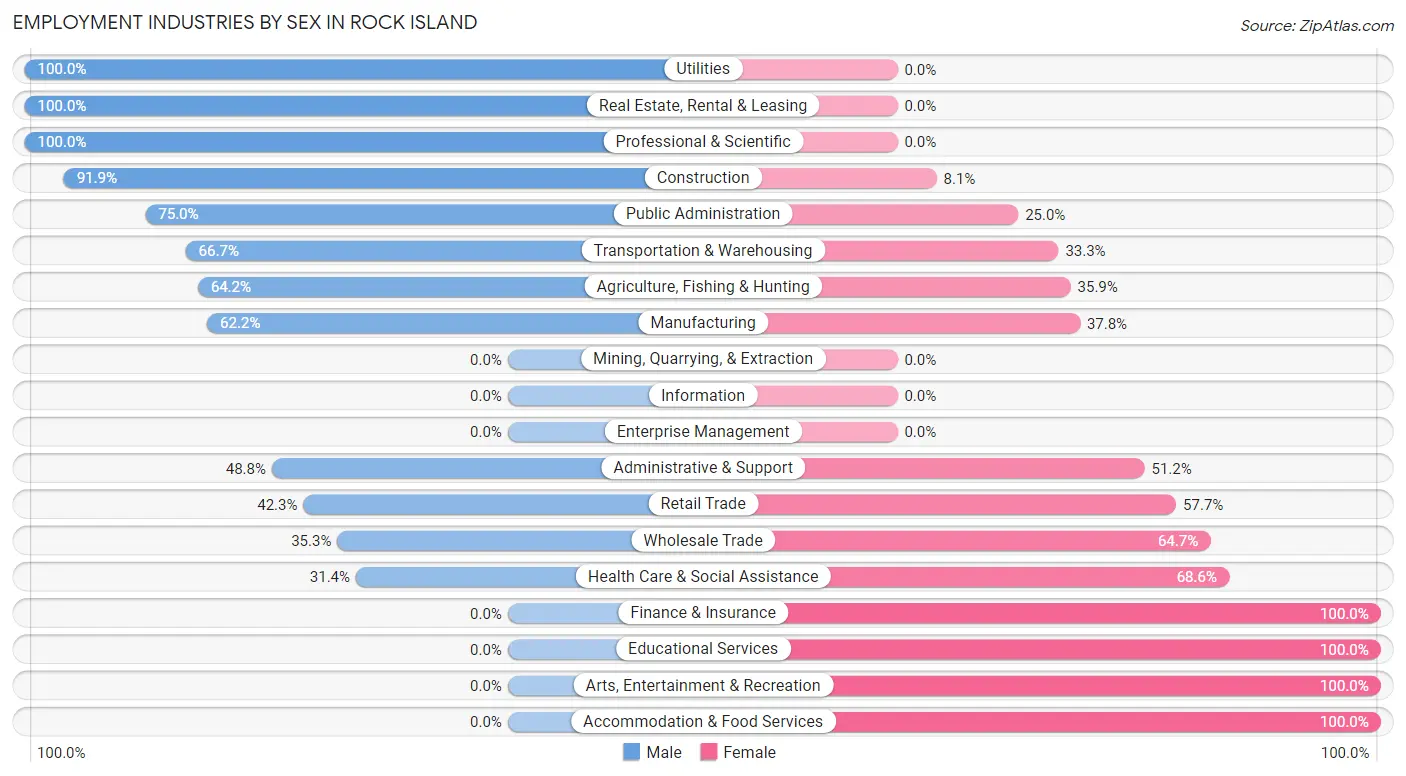
Employment Industries by Sex in Rock Island
The Rock Island industries that see more men than women are Utilities (100.0%), Real Estate, Rental & Leasing (100.0%), and Professional & Scientific (100.0%), whereas the industries that tend to have a higher number of women are Finance & Insurance (100.0%), Educational Services (100.0%), and Arts, Entertainment & Recreation (100.0%).
| Industry | Male | Female |
| Agriculture, Fishing & Hunting | 68 (64.1%) | 38 (35.8%) |
| Mining, Quarrying, & Extraction | 0 (0.0%) | 0 (0.0%) |
| Construction | 34 (91.9%) | 3 (8.1%) |
| Manufacturing | 28 (62.2%) | 17 (37.8%) |
| Wholesale Trade | 6 (35.3%) | 11 (64.7%) |
| Retail Trade | 11 (42.3%) | 15 (57.7%) |
| Transportation & Warehousing | 12 (66.7%) | 6 (33.3%) |
| Utilities | 6 (100.0%) | 0 (0.0%) |
| Information | 0 (0.0%) | 0 (0.0%) |
| Finance & Insurance | 0 (0.0%) | 2 (100.0%) |
| Real Estate, Rental & Leasing | 2 (100.0%) | 0 (0.0%) |
| Professional & Scientific | 3 (100.0%) | 0 (0.0%) |
| Enterprise Management | 0 (0.0%) | 0 (0.0%) |
| Administrative & Support | 21 (48.8%) | 22 (51.2%) |
| Educational Services | 0 (0.0%) | 32 (100.0%) |
| Health Care & Social Assistance | 22 (31.4%) | 48 (68.6%) |
| Arts, Entertainment & Recreation | 0 (0.0%) | 6 (100.0%) |
| Accommodation & Food Services | 0 (0.0%) | 21 (100.0%) |
| Public Administration | 12 (75.0%) | 4 (25.0%) |
| Total | 247 (51.3%) | 234 (48.6%) |
Education in Rock Island
School Enrollment in Rock Island
The most common levels of schooling among the 343 students in Rock Island are high school (135 | 39.4%), middle school (100 | 29.1%), and elementary school (57 | 16.6%).
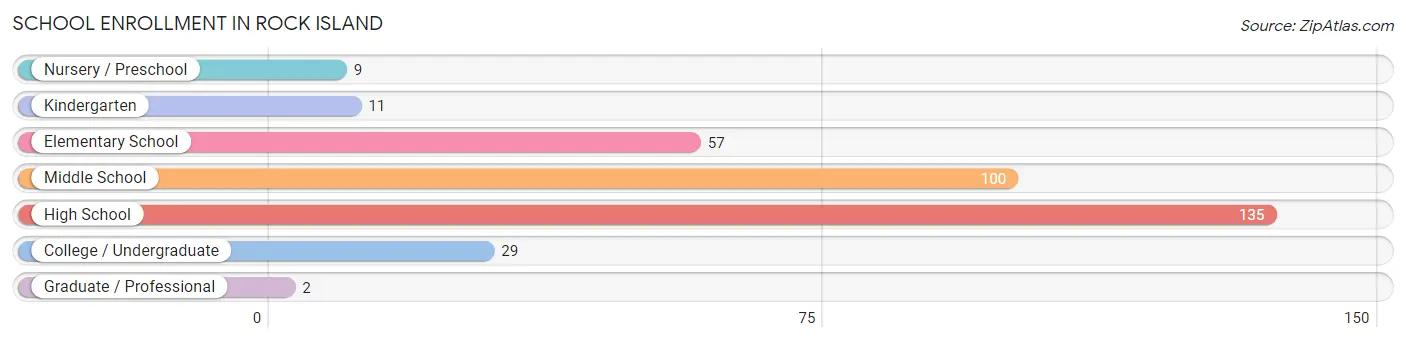
| School Level | # Students | % Students |
| Nursery / Preschool | 9 | 2.6% |
| Kindergarten | 11 | 3.2% |
| Elementary School | 57 | 16.6% |
| Middle School | 100 | 29.1% |
| High School | 135 | 39.4% |
| College / Undergraduate | 29 | 8.5% |
| Graduate / Professional | 2 | 0.6% |
| Total | 343 | 100.0% |
School Enrollment by Age by Funding Source in Rock Island
Out of a total of 343 students who are enrolled in schools in Rock Island, 17 (5.0%) attend a private institution, while the remaining 326 (95.0%) are enrolled in public schools. The age group of 25 to 34 year olds has the highest likelihood of being enrolled in private schools, with 5 (71.4% in the age bracket) enrolled. Conversely, the age group of 3 to 4 year olds has the lowest likelihood of being enrolled in a private school, with 1 (100.0% in the age bracket) attending a public institution.
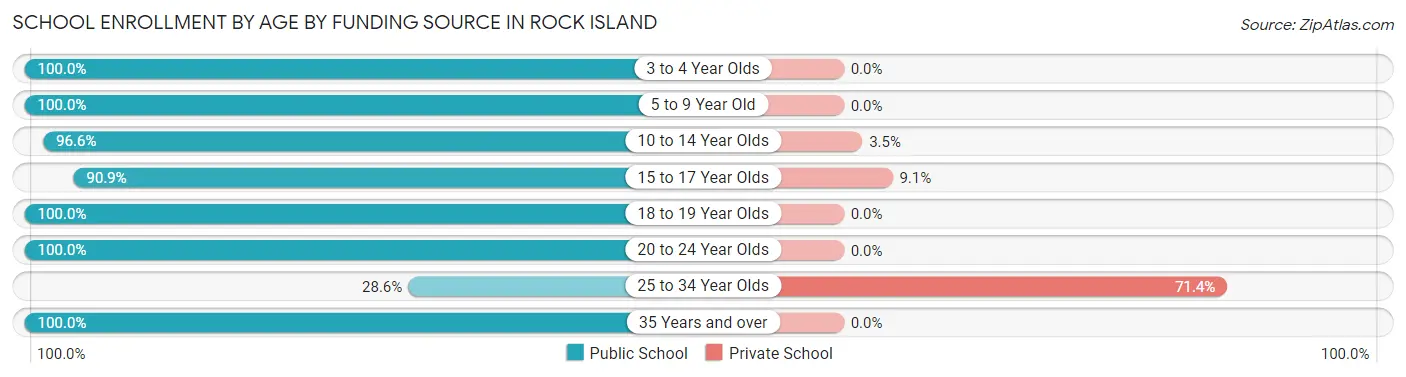
| Age Bracket | Public School | Private School |
| 3 to 4 Year Olds | 1 (100.0%) | 0 (0.0%) |
| 5 to 9 Year Old | 73 (100.0%) | 0 (0.0%) |
| 10 to 14 Year Olds | 112 (96.6%) | 4 (3.5%) |
| 15 to 17 Year Olds | 80 (90.9%) | 8 (9.1%) |
| 18 to 19 Year Olds | 31 (100.0%) | 0 (0.0%) |
| 20 to 24 Year Olds | 19 (100.0%) | 0 (0.0%) |
| 25 to 34 Year Olds | 2 (28.6%) | 5 (71.4%) |
| 35 Years and over | 8 (100.0%) | 0 (0.0%) |
| Total | 326 (95.0%) | 17 (5.0%) |
Educational Attainment by Field of Study in Rock Island
Visual & performing arts (25 | 40.3%), bio, nature & agricultural (9 | 14.5%), business (9 | 14.5%), arts & humanities (6 | 9.7%), and education (5 | 8.1%) are the most common fields of study among 62 individuals in Rock Island who have obtained a bachelor's degree or higher.
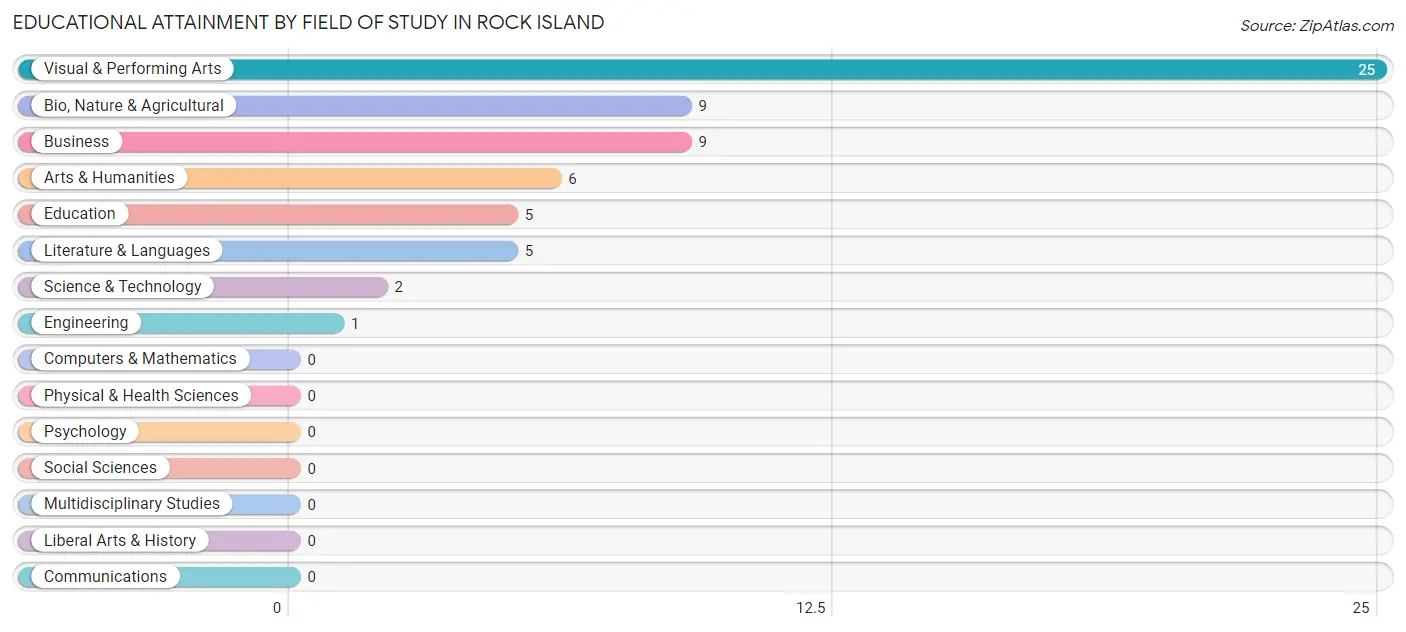
| Field of Study | # Graduates | % Graduates |
| Computers & Mathematics | 0 | 0.0% |
| Bio, Nature & Agricultural | 9 | 14.5% |
| Physical & Health Sciences | 0 | 0.0% |
| Psychology | 0 | 0.0% |
| Social Sciences | 0 | 0.0% |
| Engineering | 1 | 1.6% |
| Multidisciplinary Studies | 0 | 0.0% |
| Science & Technology | 2 | 3.2% |
| Business | 9 | 14.5% |
| Education | 5 | 8.1% |
| Literature & Languages | 5 | 8.1% |
| Liberal Arts & History | 0 | 0.0% |
| Visual & Performing Arts | 25 | 40.3% |
| Communications | 0 | 0.0% |
| Arts & Humanities | 6 | 9.7% |
| Total | 62 | 100.0% |
Transportation & Commute in Rock Island
Vehicle Availability by Sex in Rock Island
The most prevalent vehicle ownership categories in Rock Island are males with 2 vehicles (96, accounting for 38.9%) and females with 2 vehicles (115, making up 41.0%).
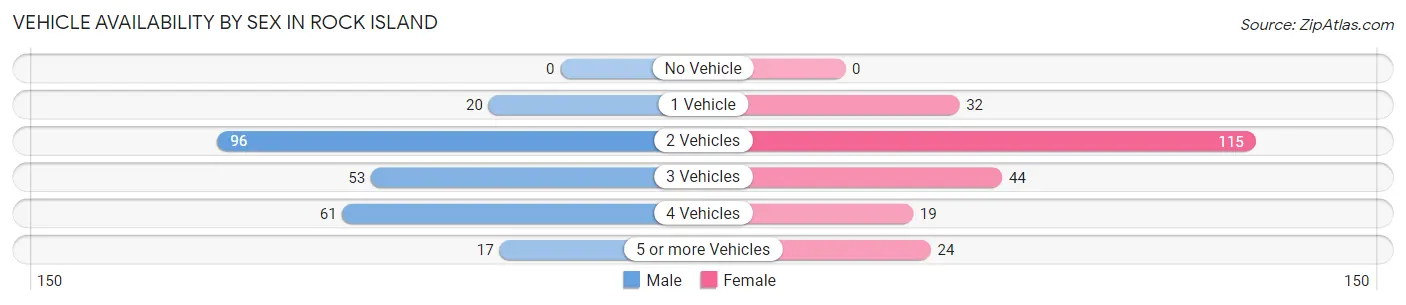
| Vehicles Available | Male | Female |
| No Vehicle | 0 (0.0%) | 0 (0.0%) |
| 1 Vehicle | 20 (8.1%) | 32 (13.7%) |
| 2 Vehicles | 96 (38.9%) | 115 (49.1%) |
| 3 Vehicles | 53 (21.5%) | 44 (18.8%) |
| 4 Vehicles | 61 (24.7%) | 19 (8.1%) |
| 5 or more Vehicles | 17 (6.9%) | 24 (10.3%) |
| Total | 247 (100.0%) | 234 (100.0%) |
Commute Time in Rock Island
The most frequently occuring commute durations in Rock Island are 15 to 19 minutes (123 commuters, 26.7%), 30 to 34 minutes (92 commuters, 20.0%), and 20 to 24 minutes (89 commuters, 19.4%).
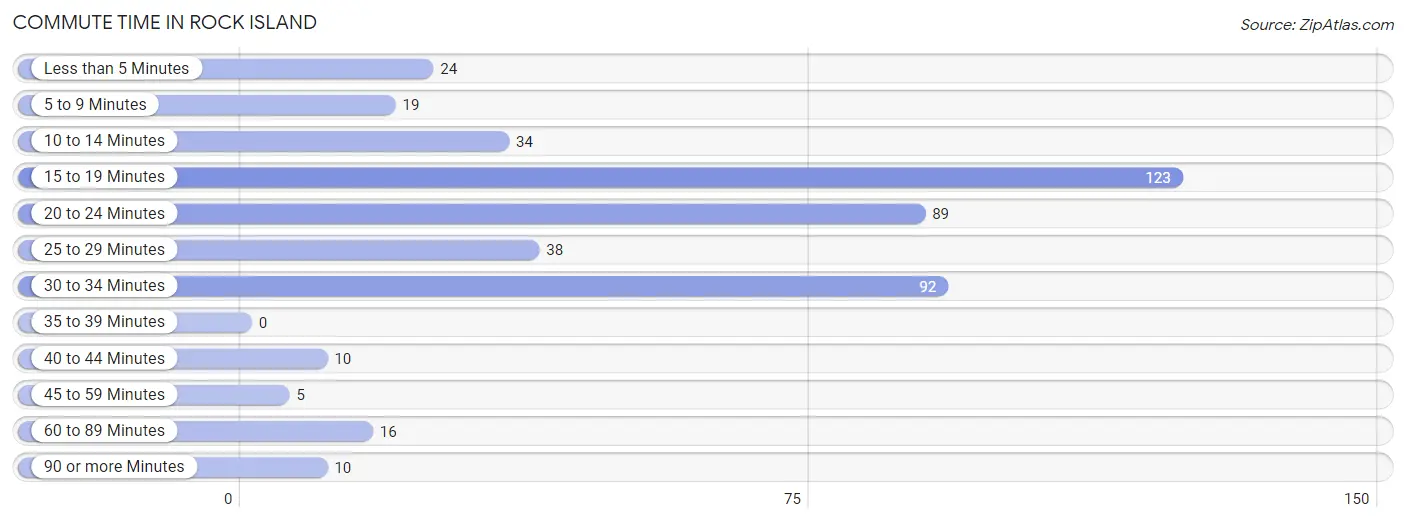
| Commute Time | # Commuters | % Commuters |
| Less than 5 Minutes | 24 | 5.2% |
| 5 to 9 Minutes | 19 | 4.1% |
| 10 to 14 Minutes | 34 | 7.4% |
| 15 to 19 Minutes | 123 | 26.7% |
| 20 to 24 Minutes | 89 | 19.4% |
| 25 to 29 Minutes | 38 | 8.3% |
| 30 to 34 Minutes | 92 | 20.0% |
| 35 to 39 Minutes | 0 | 0.0% |
| 40 to 44 Minutes | 10 | 2.2% |
| 45 to 59 Minutes | 5 | 1.1% |
| 60 to 89 Minutes | 16 | 3.5% |
| 90 or more Minutes | 10 | 2.2% |
Commute Time by Sex in Rock Island
The most common commute times in Rock Island are 15 to 19 minutes (73 commuters, 32.0%) for males and 15 to 19 minutes (50 commuters, 21.5%) for females.
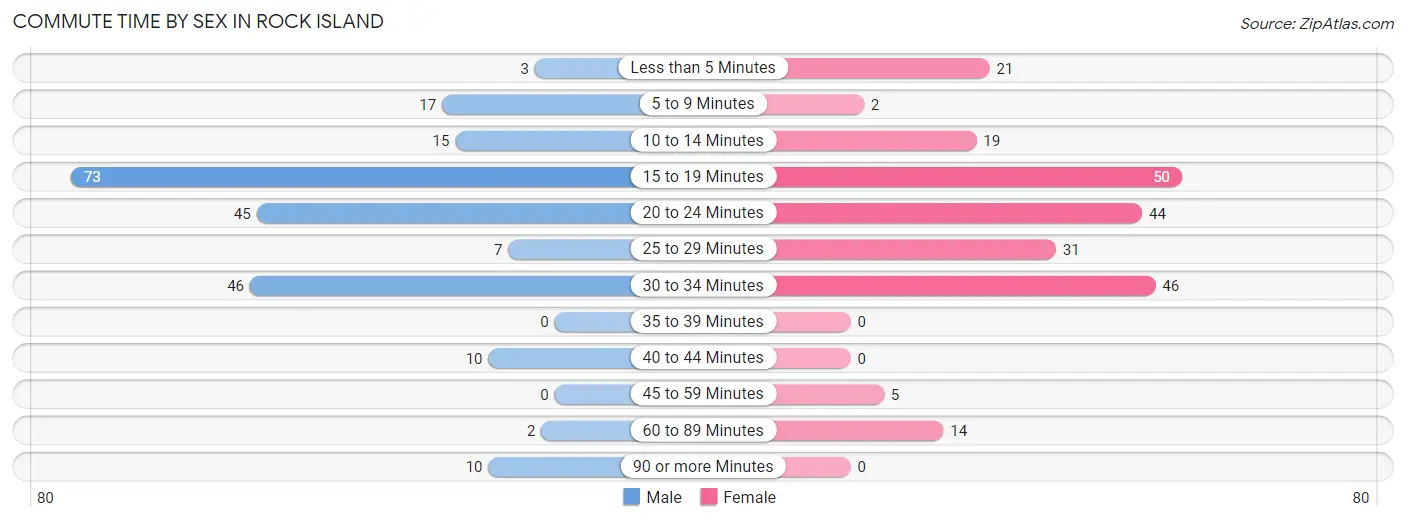
| Commute Time | Male | Female |
| Less than 5 Minutes | 3 (1.3%) | 21 (9.0%) |
| 5 to 9 Minutes | 17 (7.5%) | 2 (0.9%) |
| 10 to 14 Minutes | 15 (6.6%) | 19 (8.2%) |
| 15 to 19 Minutes | 73 (32.0%) | 50 (21.5%) |
| 20 to 24 Minutes | 45 (19.7%) | 44 (19.0%) |
| 25 to 29 Minutes | 7 (3.1%) | 31 (13.4%) |
| 30 to 34 Minutes | 46 (20.2%) | 46 (19.8%) |
| 35 to 39 Minutes | 0 (0.0%) | 0 (0.0%) |
| 40 to 44 Minutes | 10 (4.4%) | 0 (0.0%) |
| 45 to 59 Minutes | 0 (0.0%) | 5 (2.2%) |
| 60 to 89 Minutes | 2 (0.9%) | 14 (6.0%) |
| 90 or more Minutes | 10 (4.4%) | 0 (0.0%) |
Time of Departure to Work by Sex in Rock Island
The most frequent times of departure to work in Rock Island are 6:00 AM to 6:29 AM (58, 25.4%) for males and 6:30 AM to 6:59 AM (57, 24.6%) for females.
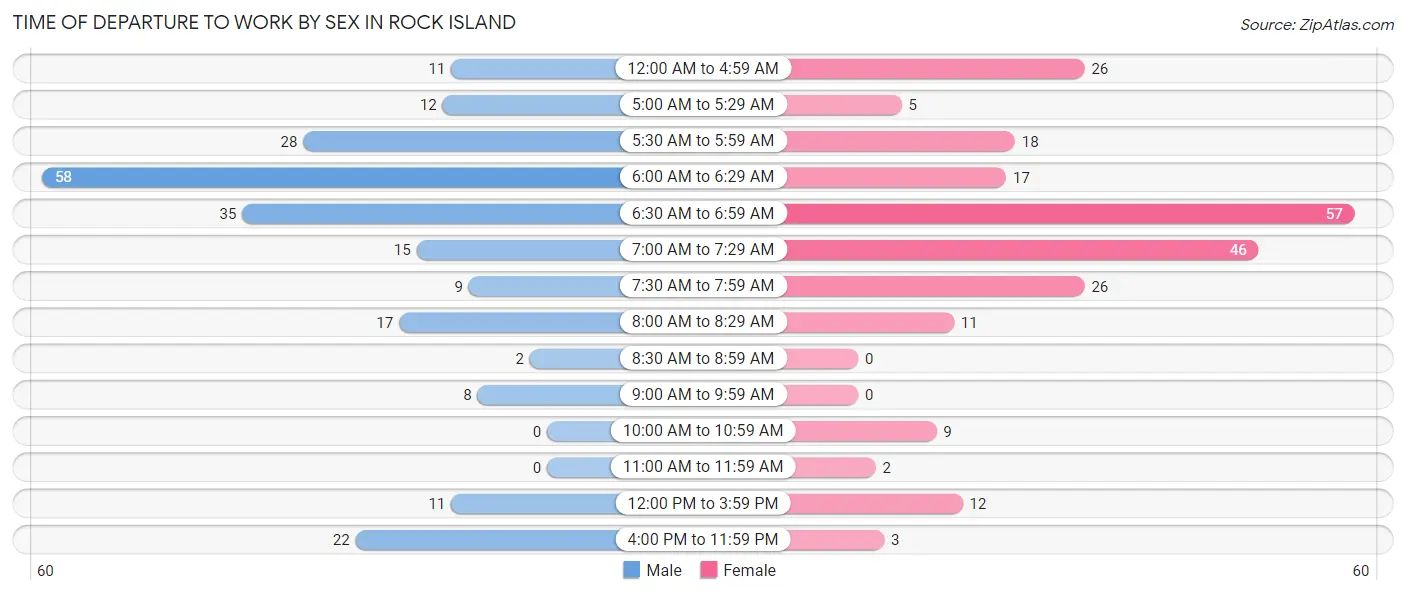
| Time of Departure | Male | Female |
| 12:00 AM to 4:59 AM | 11 (4.8%) | 26 (11.2%) |
| 5:00 AM to 5:29 AM | 12 (5.3%) | 5 (2.2%) |
| 5:30 AM to 5:59 AM | 28 (12.3%) | 18 (7.8%) |
| 6:00 AM to 6:29 AM | 58 (25.4%) | 17 (7.3%) |
| 6:30 AM to 6:59 AM | 35 (15.3%) | 57 (24.6%) |
| 7:00 AM to 7:29 AM | 15 (6.6%) | 46 (19.8%) |
| 7:30 AM to 7:59 AM | 9 (4.0%) | 26 (11.2%) |
| 8:00 AM to 8:29 AM | 17 (7.5%) | 11 (4.7%) |
| 8:30 AM to 8:59 AM | 2 (0.9%) | 0 (0.0%) |
| 9:00 AM to 9:59 AM | 8 (3.5%) | 0 (0.0%) |
| 10:00 AM to 10:59 AM | 0 (0.0%) | 9 (3.9%) |
| 11:00 AM to 11:59 AM | 0 (0.0%) | 2 (0.9%) |
| 12:00 PM to 3:59 PM | 11 (4.8%) | 12 (5.2%) |
| 4:00 PM to 11:59 PM | 22 (9.7%) | 3 (1.3%) |
| Total | 228 (100.0%) | 232 (100.0%) |
Housing Occupancy in Rock Island
Occupancy by Ownership in Rock Island
Of the total 417 dwellings in Rock Island, owner-occupied units account for 351 (84.2%), while renter-occupied units make up 66 (15.8%).
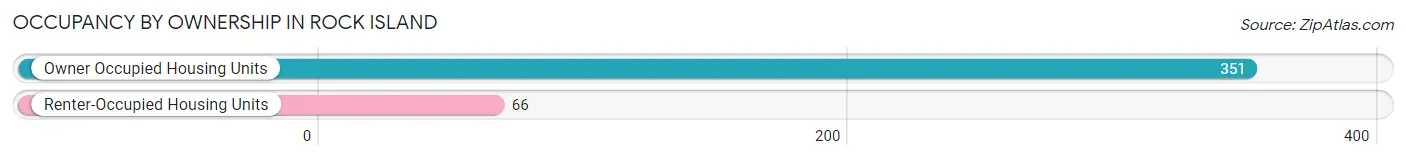
| Occupancy | # Housing Units | % Housing Units |
| Owner Occupied Housing Units | 351 | 84.2% |
| Renter-Occupied Housing Units | 66 | 15.8% |
| Total Occupied Housing Units | 417 | 100.0% |
Occupancy by Household Size in Rock Island
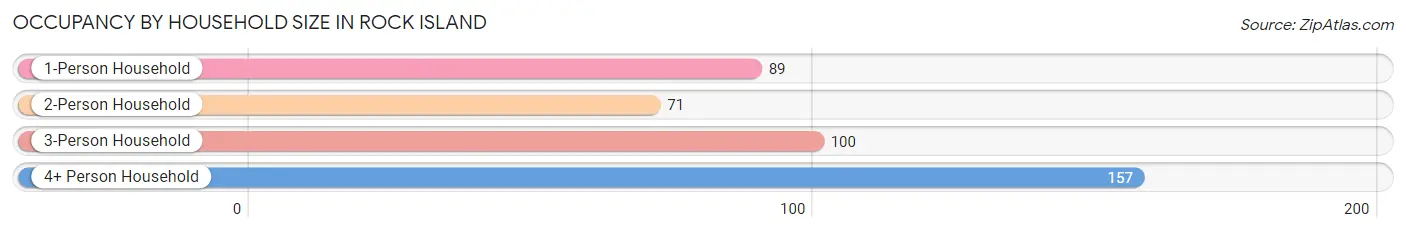
| Household Size | # Housing Units | % Housing Units |
| 1-Person Household | 89 | 21.3% |
| 2-Person Household | 71 | 17.0% |
| 3-Person Household | 100 | 24.0% |
| 4+ Person Household | 157 | 37.7% |
| Total Housing Units | 417 | 100.0% |
Occupancy by Ownership by Household Size in Rock Island
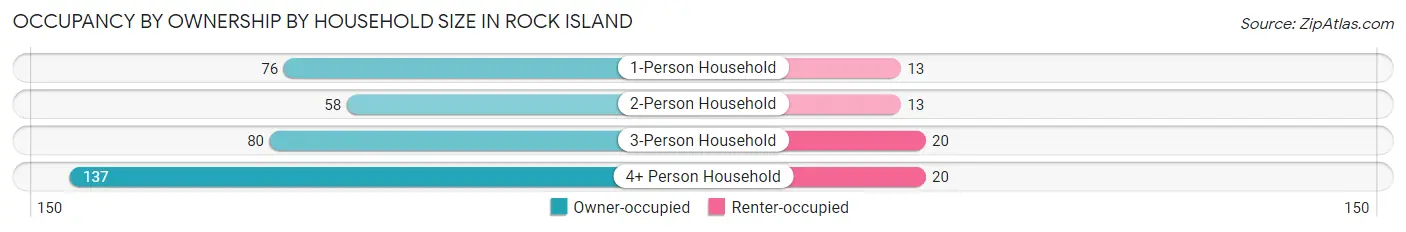
| Household Size | Owner-occupied | Renter-occupied |
| 1-Person Household | 76 (85.4%) | 13 (14.6%) |
| 2-Person Household | 58 (81.7%) | 13 (18.3%) |
| 3-Person Household | 80 (80.0%) | 20 (20.0%) |
| 4+ Person Household | 137 (87.3%) | 20 (12.7%) |
| Total Housing Units | 351 (84.2%) | 66 (15.8%) |
Occupancy by Educational Attainment in Rock Island
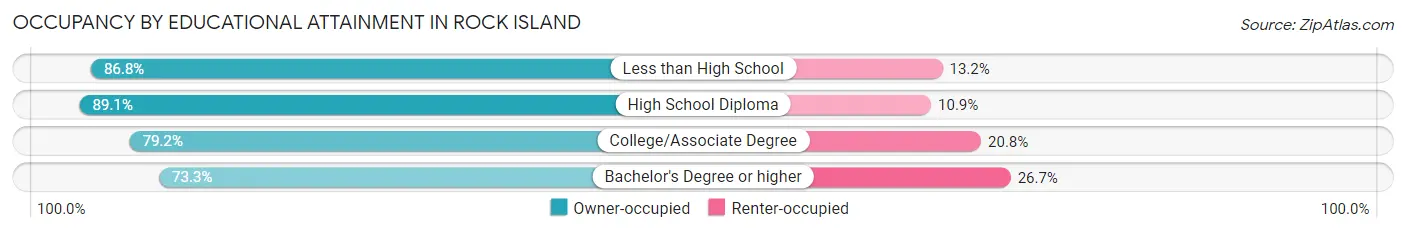
| Household Size | Owner-occupied | Renter-occupied |
| Less than High School | 132 (86.8%) | 20 (13.2%) |
| High School Diploma | 90 (89.1%) | 11 (10.9%) |
| College/Associate Degree | 118 (79.2%) | 31 (20.8%) |
| Bachelor's Degree or higher | 11 (73.3%) | 4 (26.7%) |
Occupancy by Age of Householder in Rock Island
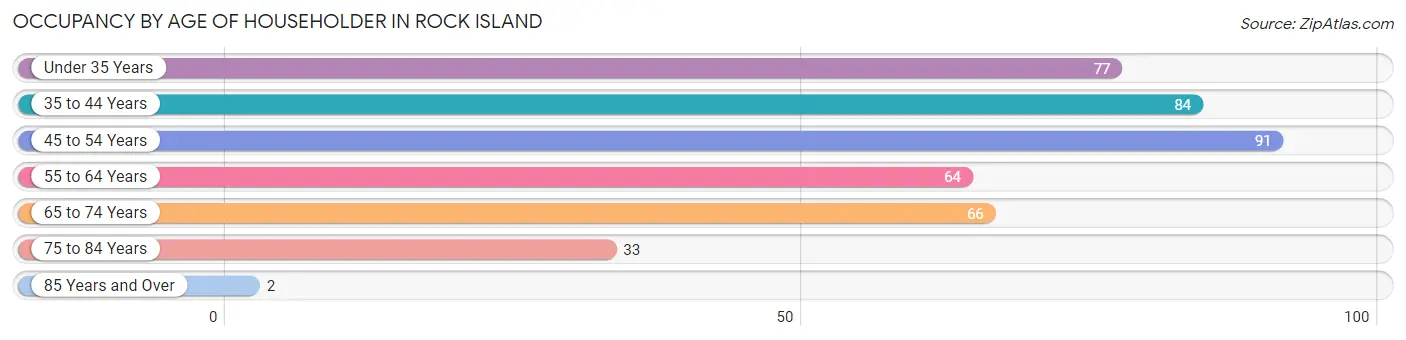
| Age Bracket | # Households | % Households |
| Under 35 Years | 77 | 18.5% |
| 35 to 44 Years | 84 | 20.1% |
| 45 to 54 Years | 91 | 21.8% |
| 55 to 64 Years | 64 | 15.3% |
| 65 to 74 Years | 66 | 15.8% |
| 75 to 84 Years | 33 | 7.9% |
| 85 Years and Over | 2 | 0.5% |
| Total | 417 | 100.0% |
Housing Finances in Rock Island
Median Income by Occupancy in Rock Island
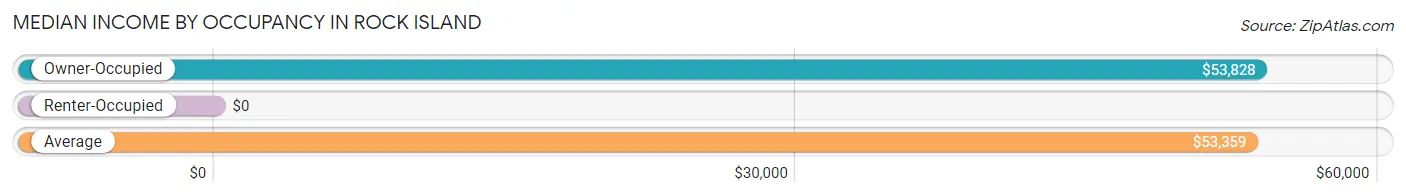
| Occupancy Type | # Households | Median Income |
| Owner-Occupied | 351 (84.2%) | $53,828 |
| Renter-Occupied | 66 (15.8%) | $0 |
| Average | 417 (100.0%) | $53,359 |
Occupancy by Householder Income Bracket in Rock Island
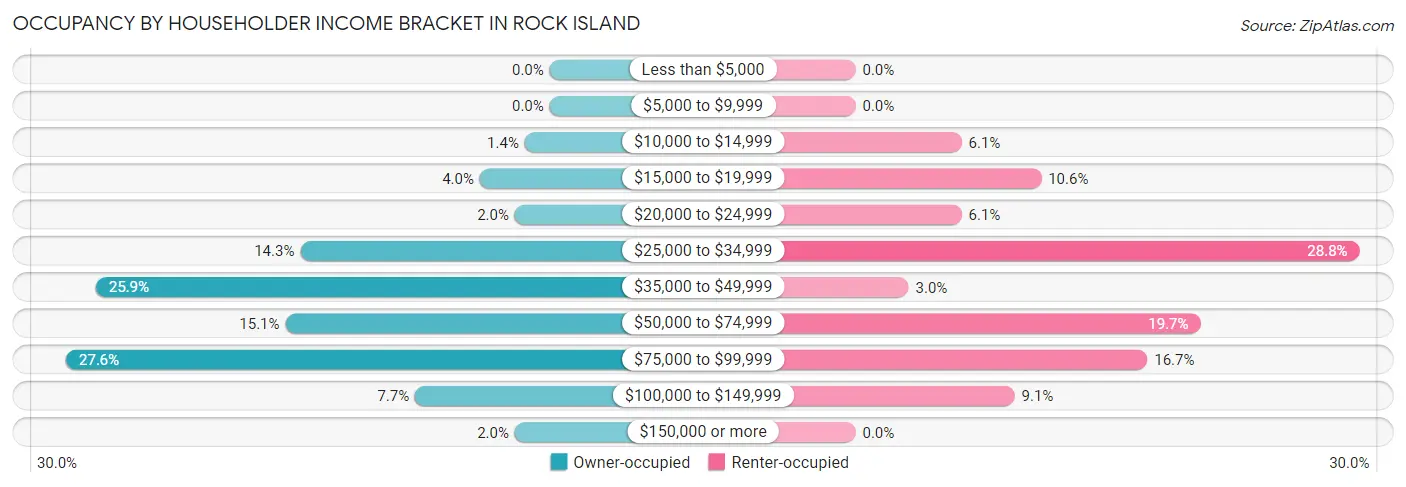
| Income Bracket | Owner-occupied | Renter-occupied |
| Less than $5,000 | 0 (0.0%) | 0 (0.0%) |
| $5,000 to $9,999 | 0 (0.0%) | 0 (0.0%) |
| $10,000 to $14,999 | 5 (1.4%) | 4 (6.1%) |
| $15,000 to $19,999 | 14 (4.0%) | 7 (10.6%) |
| $20,000 to $24,999 | 7 (2.0%) | 4 (6.1%) |
| $25,000 to $34,999 | 50 (14.2%) | 19 (28.8%) |
| $35,000 to $49,999 | 91 (25.9%) | 2 (3.0%) |
| $50,000 to $74,999 | 53 (15.1%) | 13 (19.7%) |
| $75,000 to $99,999 | 97 (27.6%) | 11 (16.7%) |
| $100,000 to $149,999 | 27 (7.7%) | 6 (9.1%) |
| $150,000 or more | 7 (2.0%) | 0 (0.0%) |
| Total | 351 (100.0%) | 66 (100.0%) |
Monthly Housing Cost Tiers in Rock Island
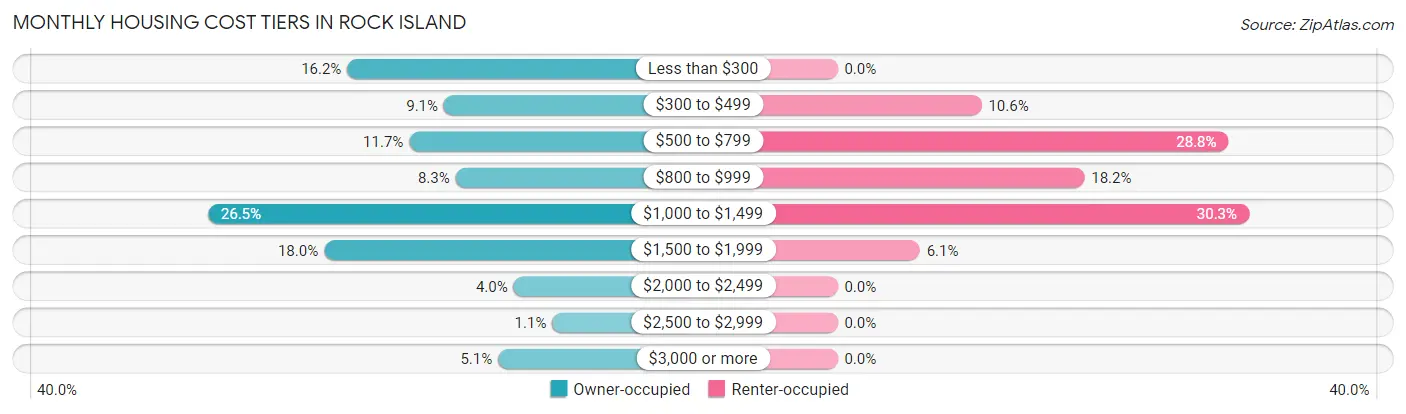
| Monthly Cost | Owner-occupied | Renter-occupied |
| Less than $300 | 57 (16.2%) | 0 (0.0%) |
| $300 to $499 | 32 (9.1%) | 7 (10.6%) |
| $500 to $799 | 41 (11.7%) | 19 (28.8%) |
| $800 to $999 | 29 (8.3%) | 12 (18.2%) |
| $1,000 to $1,499 | 93 (26.5%) | 20 (30.3%) |
| $1,500 to $1,999 | 63 (17.9%) | 4 (6.1%) |
| $2,000 to $2,499 | 14 (4.0%) | 0 (0.0%) |
| $2,500 to $2,999 | 4 (1.1%) | 0 (0.0%) |
| $3,000 or more | 18 (5.1%) | 0 (0.0%) |
| Total | 351 (100.0%) | 66 (100.0%) |
Physical Housing Characteristics in Rock Island
Housing Structures in Rock Island
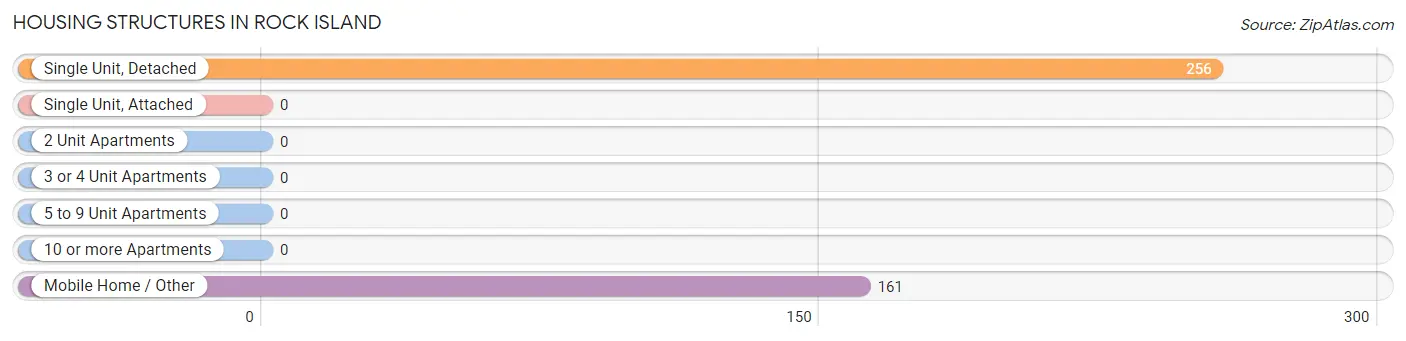
| Structure Type | # Housing Units | % Housing Units |
| Single Unit, Detached | 256 | 61.4% |
| Single Unit, Attached | 0 | 0.0% |
| 2 Unit Apartments | 0 | 0.0% |
| 3 or 4 Unit Apartments | 0 | 0.0% |
| 5 to 9 Unit Apartments | 0 | 0.0% |
| 10 or more Apartments | 0 | 0.0% |
| Mobile Home / Other | 161 | 38.6% |
| Total | 417 | 100.0% |
Housing Structures by Occupancy in Rock Island
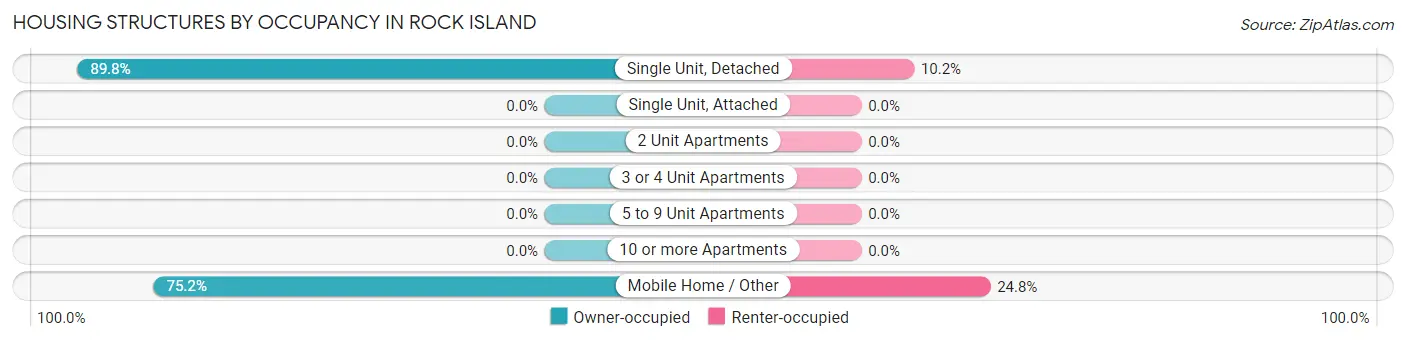
| Structure Type | Owner-occupied | Renter-occupied |
| Single Unit, Detached | 230 (89.8%) | 26 (10.2%) |
| Single Unit, Attached | 0 (0.0%) | 0 (0.0%) |
| 2 Unit Apartments | 0 (0.0%) | 0 (0.0%) |
| 3 or 4 Unit Apartments | 0 (0.0%) | 0 (0.0%) |
| 5 to 9 Unit Apartments | 0 (0.0%) | 0 (0.0%) |
| 10 or more Apartments | 0 (0.0%) | 0 (0.0%) |
| Mobile Home / Other | 121 (75.2%) | 40 (24.8%) |
| Total | 351 (84.2%) | 66 (15.8%) |
Housing Structures by Number of Rooms in Rock Island
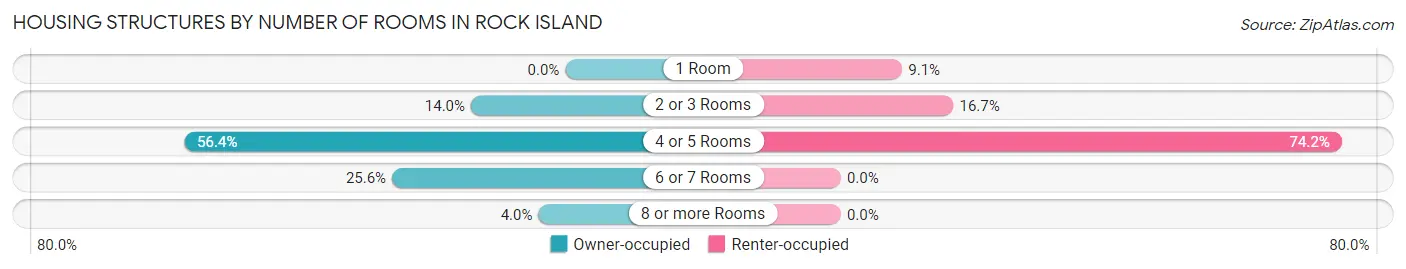
| Number of Rooms | Owner-occupied | Renter-occupied |
| 1 Room | 0 (0.0%) | 6 (9.1%) |
| 2 or 3 Rooms | 49 (14.0%) | 11 (16.7%) |
| 4 or 5 Rooms | 198 (56.4%) | 49 (74.2%) |
| 6 or 7 Rooms | 90 (25.6%) | 0 (0.0%) |
| 8 or more Rooms | 14 (4.0%) | 0 (0.0%) |
| Total | 351 (100.0%) | 66 (100.0%) |
Housing Structure by Heating Type in Rock Island
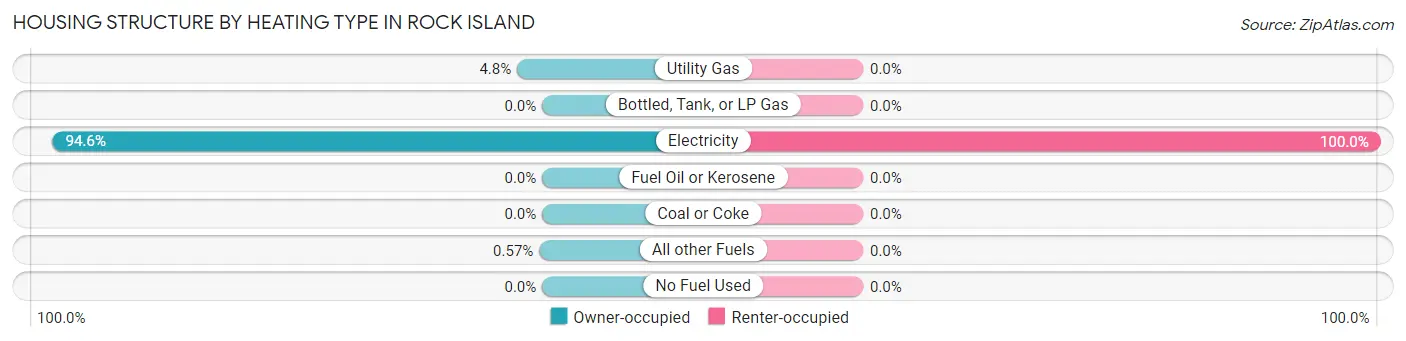
| Heating Type | Owner-occupied | Renter-occupied |
| Utility Gas | 17 (4.8%) | 0 (0.0%) |
| Bottled, Tank, or LP Gas | 0 (0.0%) | 0 (0.0%) |
| Electricity | 332 (94.6%) | 66 (100.0%) |
| Fuel Oil or Kerosene | 0 (0.0%) | 0 (0.0%) |
| Coal or Coke | 0 (0.0%) | 0 (0.0%) |
| All other Fuels | 2 (0.6%) | 0 (0.0%) |
| No Fuel Used | 0 (0.0%) | 0 (0.0%) |
| Total | 351 (100.0%) | 66 (100.0%) |
Household Vehicle Usage in Rock Island
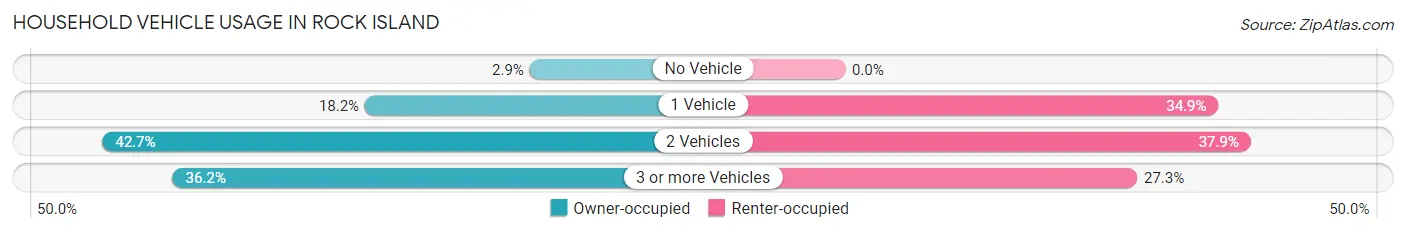
| Vehicles per Household | Owner-occupied | Renter-occupied |
| No Vehicle | 10 (2.9%) | 0 (0.0%) |
| 1 Vehicle | 64 (18.2%) | 23 (34.8%) |
| 2 Vehicles | 150 (42.7%) | 25 (37.9%) |
| 3 or more Vehicles | 127 (36.2%) | 18 (27.3%) |
| Total | 351 (100.0%) | 66 (100.0%) |
Real Estate & Mortgages in Rock Island
Real Estate and Mortgage Overview in Rock Island
| Characteristic | Without Mortgage | With Mortgage |
| Housing Units | 136 | 215 |
| Median Property Value | - | - |
| Median Household Income | $46,719 | $7 |
| Monthly Housing Costs | $416 | $8 |
| Real Estate Taxes | - | - |
Property Value by Mortgage Status in Rock Island
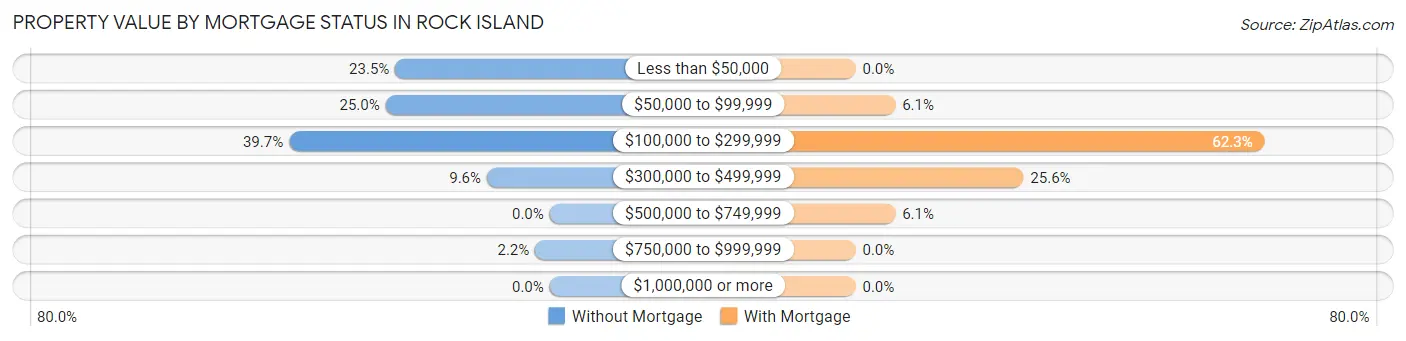
| Property Value | Without Mortgage | With Mortgage |
| Less than $50,000 | 32 (23.5%) | 0 (0.0%) |
| $50,000 to $99,999 | 34 (25.0%) | 13 (6.0%) |
| $100,000 to $299,999 | 54 (39.7%) | 134 (62.3%) |
| $300,000 to $499,999 | 13 (9.6%) | 55 (25.6%) |
| $500,000 to $749,999 | 0 (0.0%) | 13 (6.0%) |
| $750,000 to $999,999 | 3 (2.2%) | 0 (0.0%) |
| $1,000,000 or more | 0 (0.0%) | 0 (0.0%) |
| Total | 136 (100.0%) | 215 (100.0%) |
Household Income by Mortgage Status in Rock Island
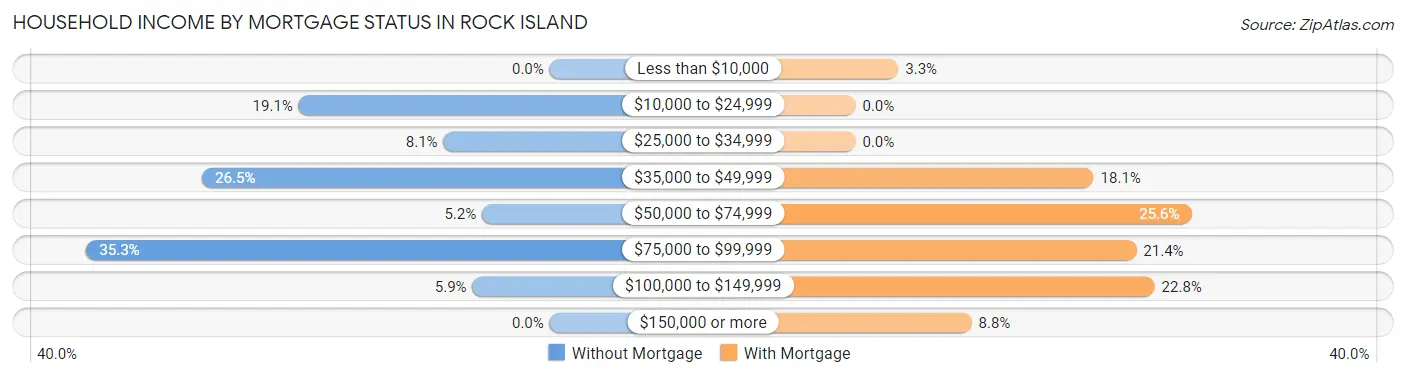
| Household Income | Without Mortgage | With Mortgage |
| Less than $10,000 | 0 (0.0%) | 7 (3.3%) |
| $10,000 to $24,999 | 26 (19.1%) | 0 (0.0%) |
| $25,000 to $34,999 | 11 (8.1%) | 0 (0.0%) |
| $35,000 to $49,999 | 36 (26.5%) | 39 (18.1%) |
| $50,000 to $74,999 | 7 (5.1%) | 55 (25.6%) |
| $75,000 to $99,999 | 48 (35.3%) | 46 (21.4%) |
| $100,000 to $149,999 | 8 (5.9%) | 49 (22.8%) |
| $150,000 or more | 0 (0.0%) | 19 (8.8%) |
| Total | 136 (100.0%) | 215 (100.0%) |
Property Value to Household Income Ratio in Rock Island
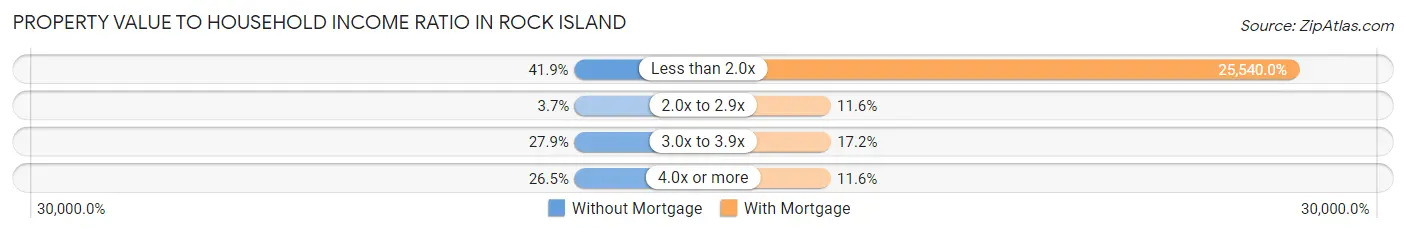
| Value-to-Income Ratio | Without Mortgage | With Mortgage |
| Less than 2.0x | 57 (41.9%) | 54,911 (25,540.0%) |
| 2.0x to 2.9x | 5 (3.7%) | 25 (11.6%) |
| 3.0x to 3.9x | 38 (27.9%) | 37 (17.2%) |
| 4.0x or more | 36 (26.5%) | 25 (11.6%) |
| Total | 136 (100.0%) | 215 (100.0%) |
Real Estate Taxes by Mortgage Status in Rock Island
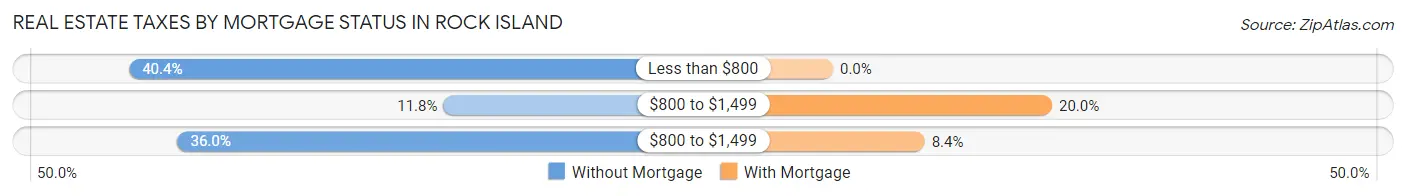
| Property Taxes | Without Mortgage | With Mortgage |
| Less than $800 | 55 (40.4%) | 0 (0.0%) |
| $800 to $1,499 | 16 (11.8%) | 43 (20.0%) |
| $800 to $1,499 | 49 (36.0%) | 18 (8.4%) |
| Total | 136 (100.0%) | 215 (100.0%) |
Health & Disability in Rock Island
Health Insurance Coverage by Age in Rock Island
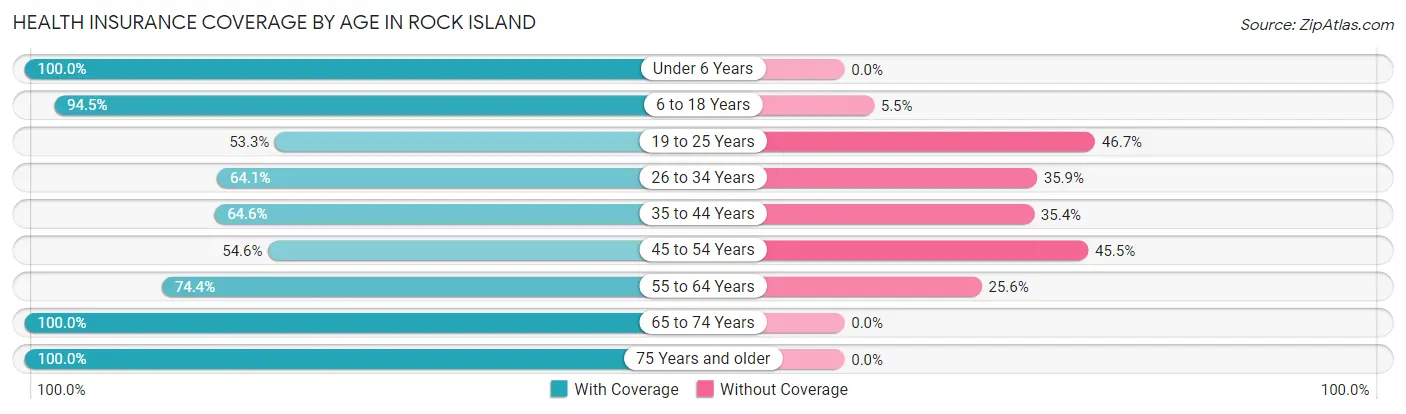
| Age Bracket | With Coverage | Without Coverage |
| Under 6 Years | 98 (100.0%) | 0 (0.0%) |
| 6 to 18 Years | 292 (94.5%) | 17 (5.5%) |
| 19 to 25 Years | 57 (53.3%) | 50 (46.7%) |
| 26 to 34 Years | 75 (64.1%) | 42 (35.9%) |
| 35 to 44 Years | 117 (64.6%) | 64 (35.4%) |
| 45 to 54 Years | 96 (54.5%) | 80 (45.5%) |
| 55 to 64 Years | 93 (74.4%) | 32 (25.6%) |
| 65 to 74 Years | 69 (100.0%) | 0 (0.0%) |
| 75 Years and older | 77 (100.0%) | 0 (0.0%) |
| Total | 974 (77.4%) | 285 (22.6%) |
Health Insurance Coverage by Citizenship Status in Rock Island
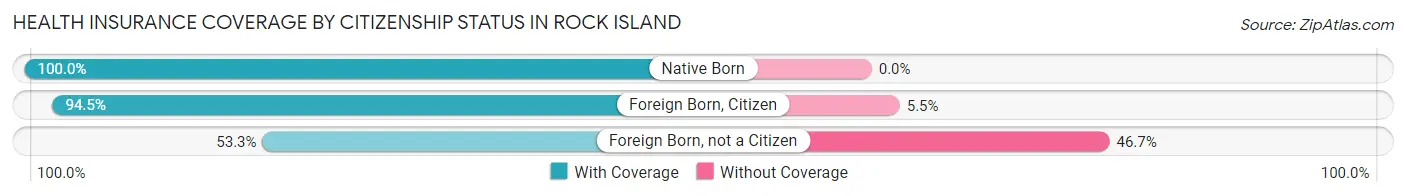
| Citizenship Status | With Coverage | Without Coverage |
| Native Born | 98 (100.0%) | 0 (0.0%) |
| Foreign Born, Citizen | 292 (94.5%) | 17 (5.5%) |
| Foreign Born, not a Citizen | 57 (53.3%) | 50 (46.7%) |
Health Insurance Coverage by Household Income in Rock Island
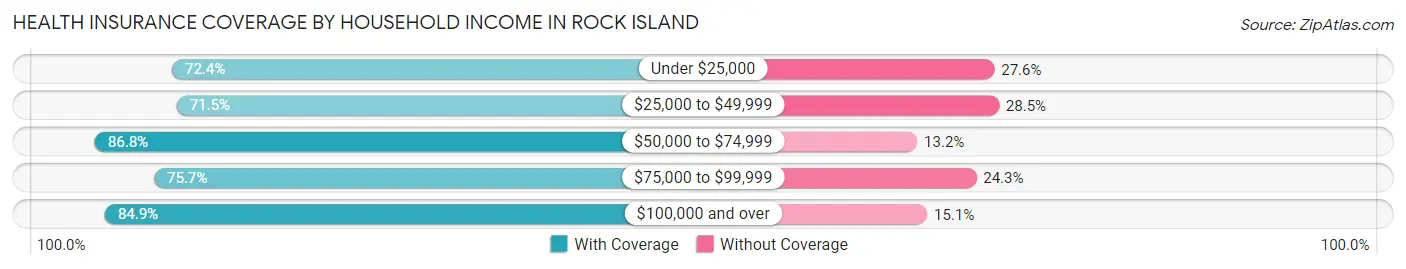
| Household Income | With Coverage | Without Coverage |
| Under $25,000 | 55 (72.4%) | 21 (27.6%) |
| $25,000 to $49,999 | 281 (71.5%) | 112 (28.5%) |
| $50,000 to $74,999 | 191 (86.8%) | 29 (13.2%) |
| $75,000 to $99,999 | 306 (75.7%) | 98 (24.3%) |
| $100,000 and over | 141 (84.9%) | 25 (15.1%) |
Public vs Private Health Insurance Coverage by Age in Rock Island
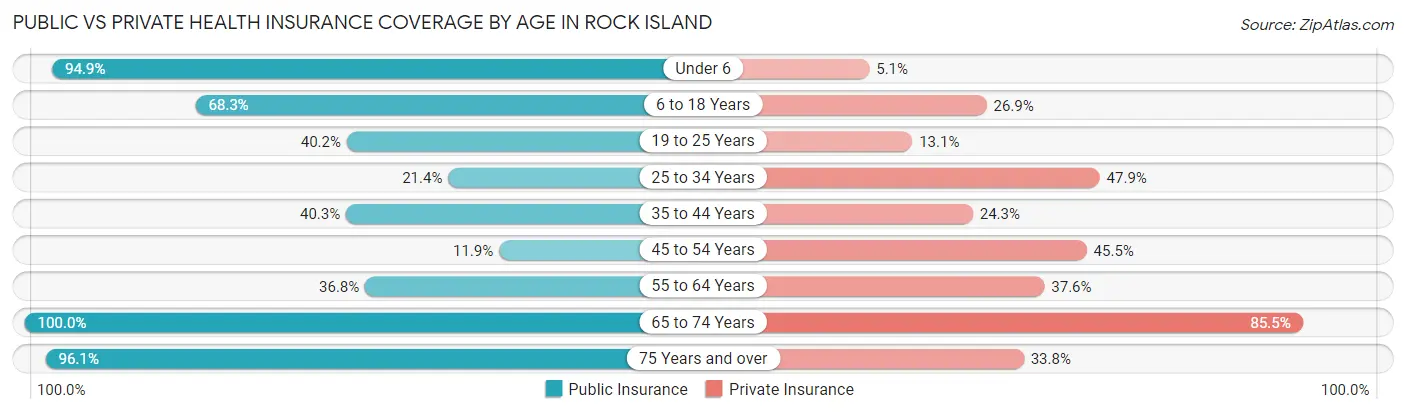
| Age Bracket | Public Insurance | Private Insurance |
| Under 6 | 93 (94.9%) | 5 (5.1%) |
| 6 to 18 Years | 211 (68.3%) | 83 (26.9%) |
| 19 to 25 Years | 43 (40.2%) | 14 (13.1%) |
| 25 to 34 Years | 25 (21.4%) | 56 (47.9%) |
| 35 to 44 Years | 73 (40.3%) | 44 (24.3%) |
| 45 to 54 Years | 21 (11.9%) | 80 (45.5%) |
| 55 to 64 Years | 46 (36.8%) | 47 (37.6%) |
| 65 to 74 Years | 69 (100.0%) | 59 (85.5%) |
| 75 Years and over | 74 (96.1%) | 26 (33.8%) |
| Total | 655 (52.0%) | 414 (32.9%) |
Disability Status by Sex by Age in Rock Island
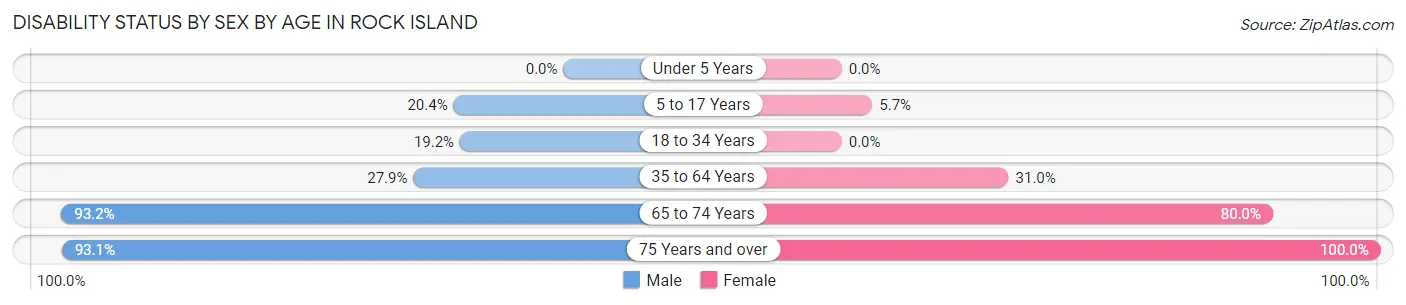
| Age Bracket | Male | Female |
| Under 5 Years | 0 (0.0%) | 0 (0.0%) |
| 5 to 17 Years | 21 (20.4%) | 11 (5.7%) |
| 18 to 34 Years | 33 (19.2%) | 0 (0.0%) |
| 35 to 64 Years | 56 (27.9%) | 87 (31.0%) |
| 65 to 74 Years | 41 (93.2%) | 20 (80.0%) |
| 75 Years and over | 27 (93.1%) | 48 (100.0%) |
Disability Class by Sex by Age in Rock Island
Disability Class: Hearing Difficulty
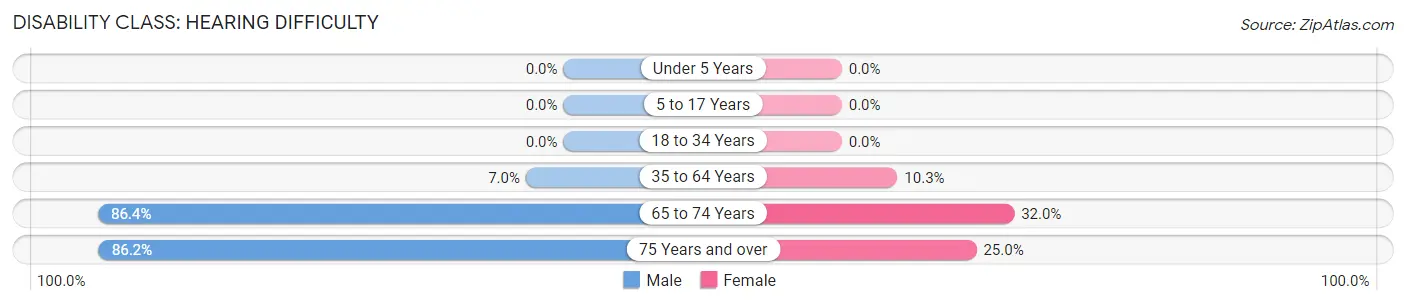
| Age Bracket | Male | Female |
| Under 5 Years | 0 (0.0%) | 0 (0.0%) |
| 5 to 17 Years | 0 (0.0%) | 0 (0.0%) |
| 18 to 34 Years | 0 (0.0%) | 0 (0.0%) |
| 35 to 64 Years | 14 (7.0%) | 29 (10.3%) |
| 65 to 74 Years | 38 (86.4%) | 8 (32.0%) |
| 75 Years and over | 25 (86.2%) | 12 (25.0%) |
Disability Class: Vision Difficulty
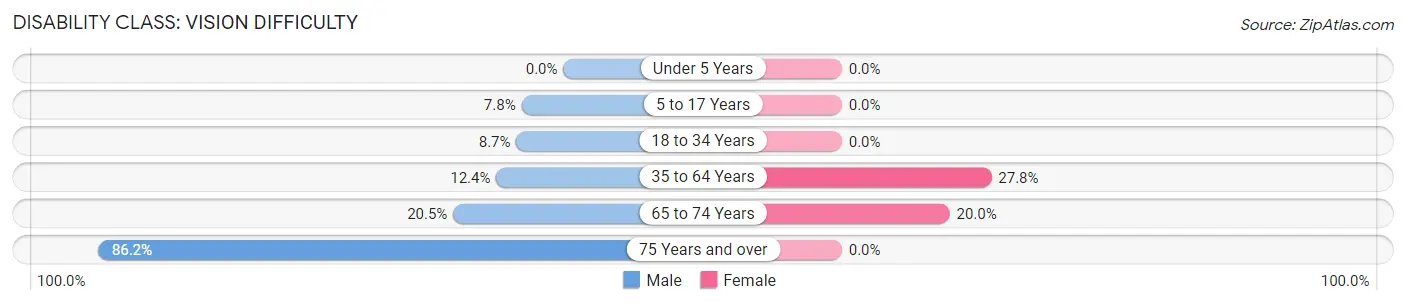
| Age Bracket | Male | Female |
| Under 5 Years | 0 (0.0%) | 0 (0.0%) |
| 5 to 17 Years | 8 (7.8%) | 0 (0.0%) |
| 18 to 34 Years | 15 (8.7%) | 0 (0.0%) |
| 35 to 64 Years | 25 (12.4%) | 78 (27.8%) |
| 65 to 74 Years | 9 (20.4%) | 5 (20.0%) |
| 75 Years and over | 25 (86.2%) | 0 (0.0%) |
Disability Class: Cognitive Difficulty
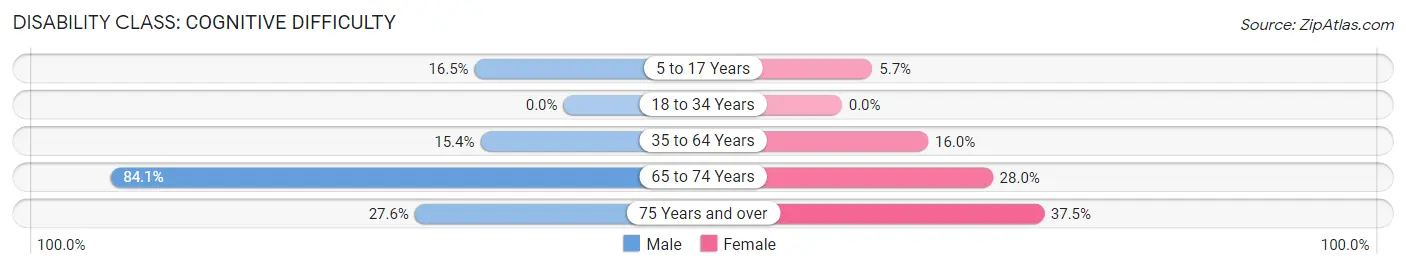
| Age Bracket | Male | Female |
| 5 to 17 Years | 17 (16.5%) | 11 (5.7%) |
| 18 to 34 Years | 0 (0.0%) | 0 (0.0%) |
| 35 to 64 Years | 31 (15.4%) | 45 (16.0%) |
| 65 to 74 Years | 37 (84.1%) | 7 (28.0%) |
| 75 Years and over | 8 (27.6%) | 18 (37.5%) |
Disability Class: Ambulatory Difficulty
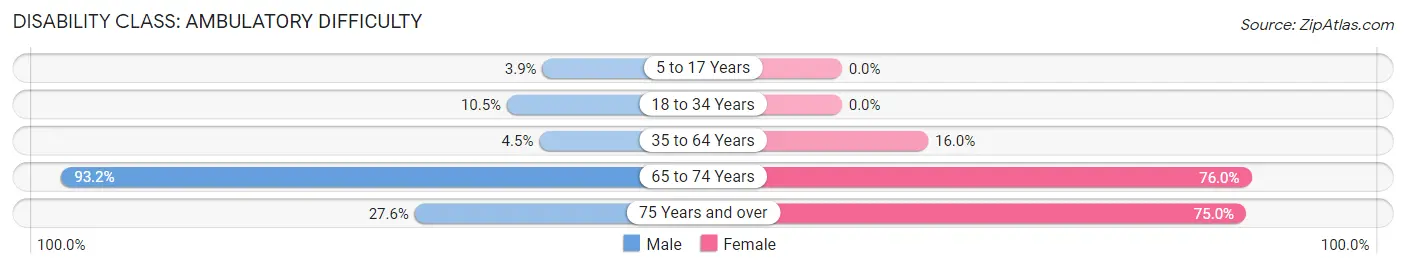
| Age Bracket | Male | Female |
| 5 to 17 Years | 4 (3.9%) | 0 (0.0%) |
| 18 to 34 Years | 18 (10.5%) | 0 (0.0%) |
| 35 to 64 Years | 9 (4.5%) | 45 (16.0%) |
| 65 to 74 Years | 41 (93.2%) | 19 (76.0%) |
| 75 Years and over | 8 (27.6%) | 36 (75.0%) |
Disability Class: Self-Care Difficulty
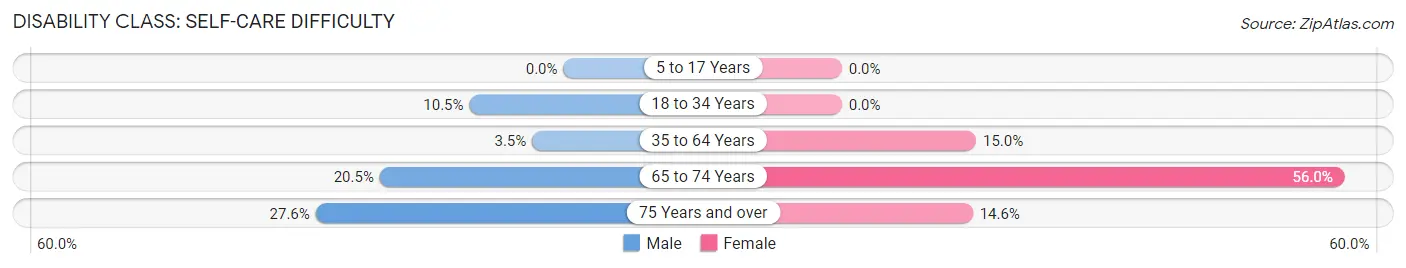
| Age Bracket | Male | Female |
| 5 to 17 Years | 0 (0.0%) | 0 (0.0%) |
| 18 to 34 Years | 18 (10.5%) | 0 (0.0%) |
| 35 to 64 Years | 7 (3.5%) | 42 (14.9%) |
| 65 to 74 Years | 9 (20.4%) | 14 (56.0%) |
| 75 Years and over | 8 (27.6%) | 7 (14.6%) |
Technology Access in Rock Island
Computing Device Access in Rock Island
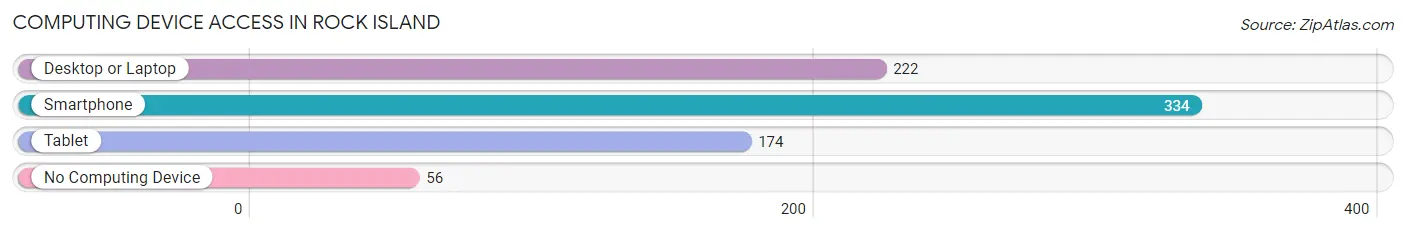
| Device Type | # Households | % Households |
| Desktop or Laptop | 222 | 53.2% |
| Smartphone | 334 | 80.1% |
| Tablet | 174 | 41.7% |
| No Computing Device | 56 | 13.4% |
| Total | 417 | 100.0% |
Internet Access in Rock Island
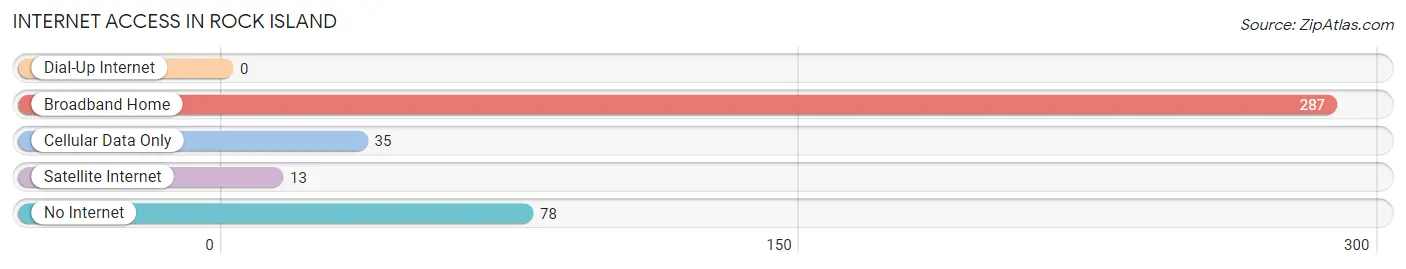
| Internet Type | # Households | % Households |
| Dial-Up Internet | 0 | 0.0% |
| Broadband Home | 287 | 68.8% |
| Cellular Data Only | 35 | 8.4% |
| Satellite Internet | 13 | 3.1% |
| No Internet | 78 | 18.7% |
| Total | 417 | 100.0% |
Rock Island Summary
Rock Island is a small unincorporated community located in the state of Washington, United States. It is situated in the northern part of the state, in the county of Spokane. The community is located on the banks of the Spokane River, near the city of Spokane.
History
Rock Island was first settled in the late 1800s by a group of settlers from the Midwest. The settlers were attracted to the area due to its abundance of natural resources, including timber, fish, and game. The settlers built a sawmill and a gristmill, and the community quickly grew. By the early 1900s, Rock Island had become a thriving community with a population of over 500 people.
The community was named after the nearby Rock Island, which is a large rock formation in the Spokane River. The rock formation was used by the Native Americans as a fishing spot, and it is still a popular spot for fishing today.
Geography
Rock Island is located in the northern part of Washington State, in the county of Spokane. It is situated on the banks of the Spokane River, near the city of Spokane. The community is surrounded by rolling hills and forests, and is located in a rural area. The nearest major city is Spokane, which is located about 20 miles away.
The climate in Rock Island is generally mild, with temperatures ranging from the mid-30s in the winter to the mid-80s in the summer. The area receives an average of about 20 inches of precipitation each year, with most of it falling in the form of snow in the winter months.
Economy
The economy of Rock Island is largely based on agriculture and forestry. The area is home to several farms, which produce a variety of crops, including wheat, barley, and hay. The area is also home to several timber companies, which harvest the area’s abundant forests.
In addition to agriculture and forestry, Rock Island is home to several small businesses, including a grocery store, a hardware store, and a few restaurants. The community also has a post office, a library, and a few churches.
Demographics
As of the 2010 census, the population of Rock Island was 545. The population is mostly white, with a small percentage of African Americans, Native Americans, and Asians. The median household income in the area is $45,000, and the median age is 44.
Conclusion
Rock Island is a small unincorporated community located in the northern part of Washington State, in the county of Spokane. The community was first settled in the late 1800s, and is now home to a population of over 500 people. The economy of Rock Island is largely based on agriculture and forestry, and the area is home to several small businesses. The population of Rock Island is mostly white, with a small percentage of African Americans, Native Americans, and Asians.
Common Questions
What is the Total Population of Rock Island?
Total Population of Rock Island is 1,259.
What is the Total Male Population of Rock Island?
Total Male Population of Rock Island is 568.
What is the Total Female Population of Rock Island?
Total Female Population of Rock Island is 691.
What is the Ratio of Males per 100 Females in Rock Island?
There are 82.20 Males per 100 Females in Rock Island.
What is the Ratio of Females per 100 Males in Rock Island?
There are 121.65 Females per 100 Males in Rock Island.
What is the Median Population Age in Rock Island?
Median Population Age in Rock Island is 33.9 Years.
What is the Average Family Size in Rock Island
Average Family Size in Rock Island is 3.6 People.
What is the Average Household Size in Rock Island
Average Household Size in Rock Island is 3.0 People.
What is Per Capita Income in Rock Island?
Per Capita income in Rock Island is $20,929.
What is the Median Family Income in Rock Island?
Median Family Income in Rock Island is $64,091.
What is the Median Household income in Rock Island?
Median Household Income in Rock Island is $53,359.
What is Income or Wage Gap in Rock Island?
Income or Wage Gap in Rock Island is 24.8%.
Women in Rock Island earn 75.2 cents for every dollar earned by a man.
What is Inequality or Gini Index in Rock Island?
Inequality or Gini Index in Rock Island is 0.33.
How Large is the Labor Force in Rock Island?
There are 517 People in the Labor Forcein in Rock Island.
What is the Percentage of People in the Labor Force in Rock Island?
54.2% of People are in the Labor Force in Rock Island.
What is the Unemployment Rate in Rock Island?
Unemployment Rate in Rock Island is 7.0%.