Whidbey Island Station, WA
Whidbey Island Station Map
Whidbey Island Station Overview
2,482
TOTAL POPULATION
2,053
MALE POPULATION
429
FEMALE POPULATION
478.55
MALES / 100 FEMALES
20.90
FEMALES / 100 MALES
22.2
MEDIAN AGE
2.3
AVG FAMILY SIZE
2.1
AVG HOUSEHOLD SIZE
$27,228
PER CAPITA INCOME
$55,179
AVG FAMILY INCOME
$39,375
AVG HOUSEHOLD INCOME
5.3%
WAGE / INCOME GAP [ % ]
94.7¢/ $1
WAGE / INCOME GAP [ $ ]
0.24
INEQUALITY / GINI INDEX
2,405
LABOR FORCE [ PEOPLE ]
97.6%
PERCENT IN LABOR FORCE
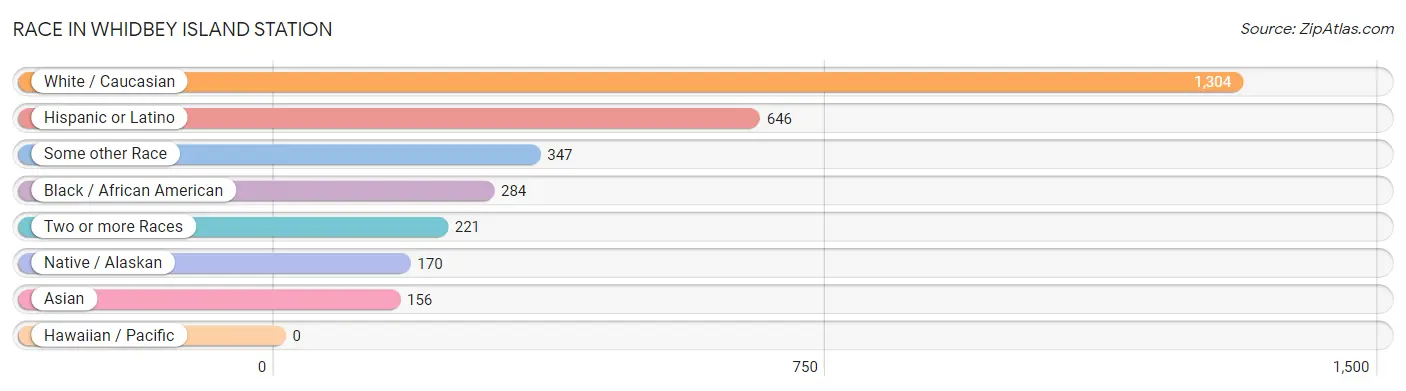
Race in Whidbey Island Station
The most populous races in Whidbey Island Station are White / Caucasian (1,304 | 52.5%), Hispanic or Latino (646 | 26.0%), and Some other Race (347 | 14.0%).
| Race | # Population | % Population |
| Asian | 156 | 6.3% |
| Black / African American | 284 | 11.4% |
| Hawaiian / Pacific | 0 | 0.0% |
| Hispanic or Latino | 646 | 26.0% |
| Native / Alaskan | 170 | 6.9% |
| White / Caucasian | 1,304 | 52.5% |
| Two or more Races | 221 | 8.9% |
| Some other Race | 347 | 14.0% |
| Total | 2,482 | 100.0% |
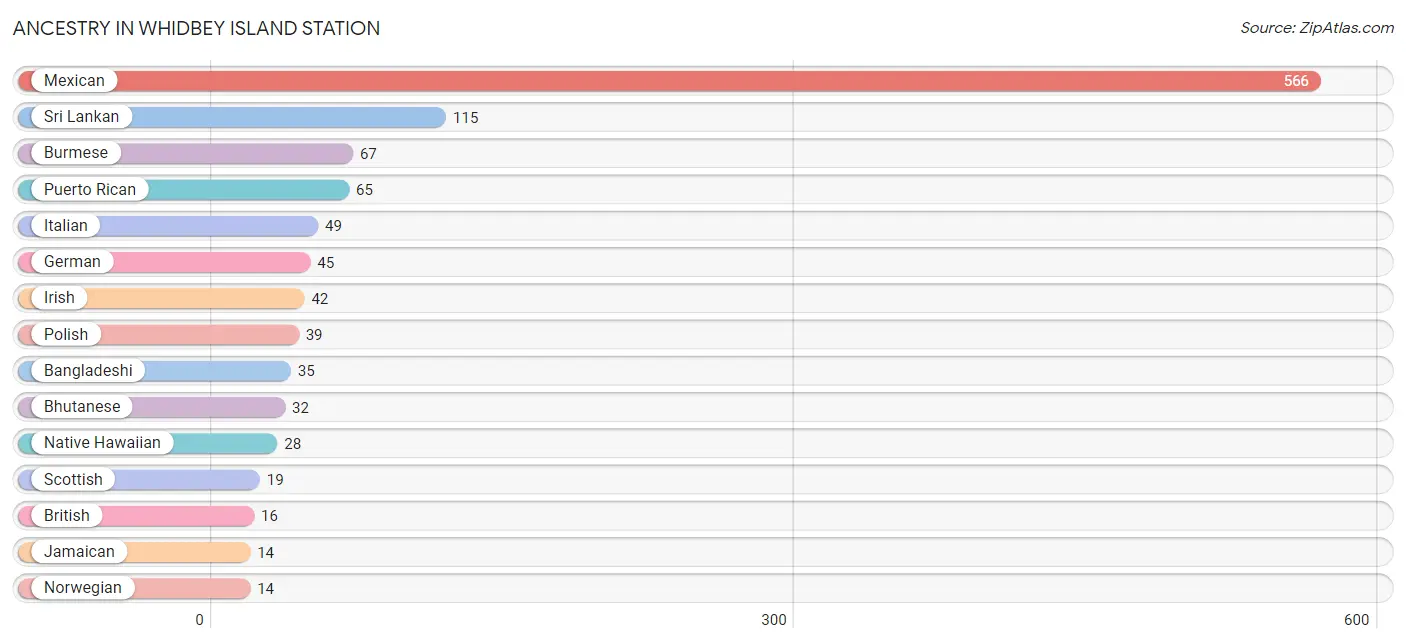
Ancestry in Whidbey Island Station
The most populous ancestries reported in Whidbey Island Station are Mexican (566 | 22.8%), Sri Lankan (115 | 4.6%), Burmese (67 | 2.7%), Puerto Rican (65 | 2.6%), and Italian (49 | 2.0%), together accounting for 34.7% of all Whidbey Island Station residents.
| Ancestry | # Population | % Population |
| American | 9 | 0.4% |
| Bangladeshi | 35 | 1.4% |
| Bhutanese | 32 | 1.3% |
| British | 16 | 0.6% |
| Burmese | 67 | 2.7% |
| Cuban | 4 | 0.2% |
| English | 13 | 0.5% |
| French Canadian | 10 | 0.4% |
| German | 45 | 1.8% |
| Ghanaian | 7 | 0.3% |
| Indian (Asian) | 1 | 0.0% |
| Irish | 42 | 1.7% |
| Italian | 49 | 2.0% |
| Jamaican | 14 | 0.6% |
| Korean | 12 | 0.5% |
| Mexican | 566 | 22.8% |
| Native Hawaiian | 28 | 1.1% |
| Norwegian | 14 | 0.6% |
| Polish | 39 | 1.6% |
| Portuguese | 13 | 0.5% |
| Puerto Rican | 65 | 2.6% |
| Romanian | 5 | 0.2% |
| Russian | 5 | 0.2% |
| Scotch-Irish | 6 | 0.2% |
| Scottish | 19 | 0.8% |
| Spaniard | 11 | 0.4% |
| Sri Lankan | 115 | 4.6% |
| Subsaharan African | 7 | 0.3% | View All 28 Rows |
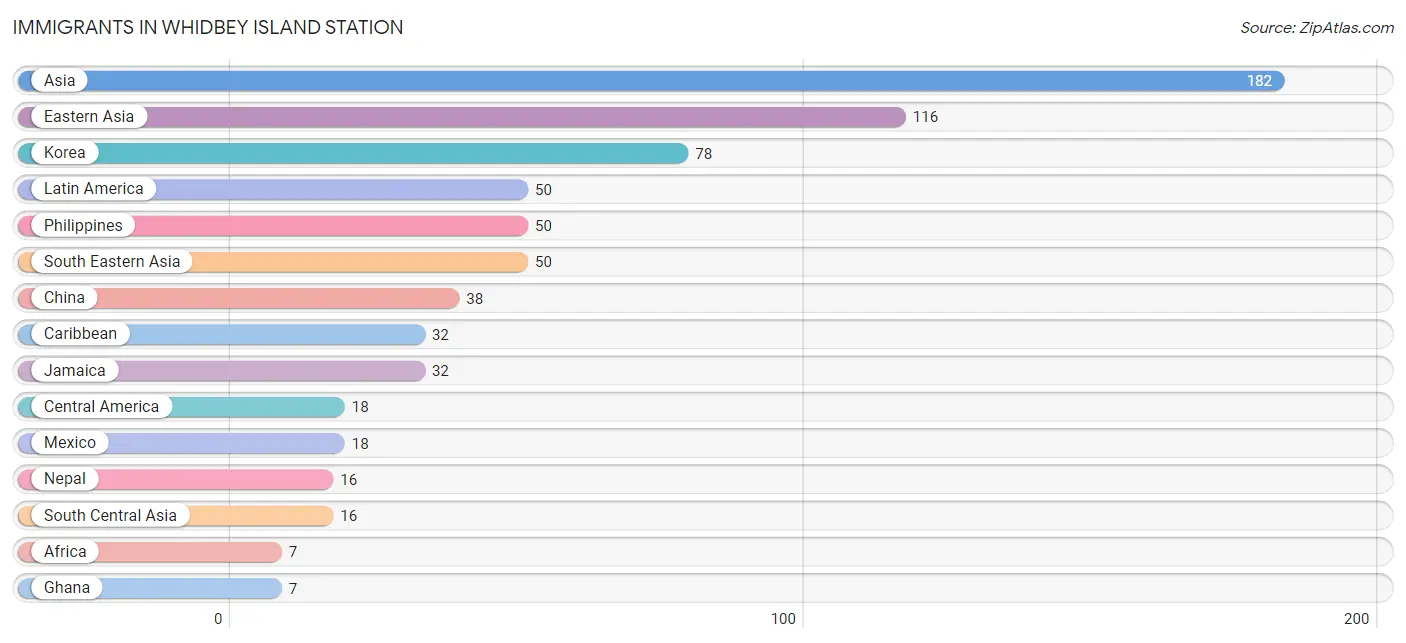
Immigrants in Whidbey Island Station
The most numerous immigrant groups reported in Whidbey Island Station came from Asia (182 | 7.3%), Eastern Asia (116 | 4.7%), Korea (78 | 3.1%), Latin America (50 | 2.0%), and Philippines (50 | 2.0%), together accounting for 19.2% of all Whidbey Island Station residents.
| Immigration Origin | # Population | % Population |
| Africa | 7 | 0.3% |
| Asia | 182 | 7.3% |
| Caribbean | 32 | 1.3% |
| Central America | 18 | 0.7% |
| China | 38 | 1.5% |
| Eastern Asia | 116 | 4.7% |
| Ghana | 7 | 0.3% |
| Jamaica | 32 | 1.3% |
| Korea | 78 | 3.1% |
| Latin America | 50 | 2.0% |
| Mexico | 18 | 0.7% |
| Nepal | 16 | 0.6% |
| Philippines | 50 | 2.0% |
| South Central Asia | 16 | 0.6% |
| South Eastern Asia | 50 | 2.0% |
| Western Africa | 7 | 0.3% | View All 16 Rows |
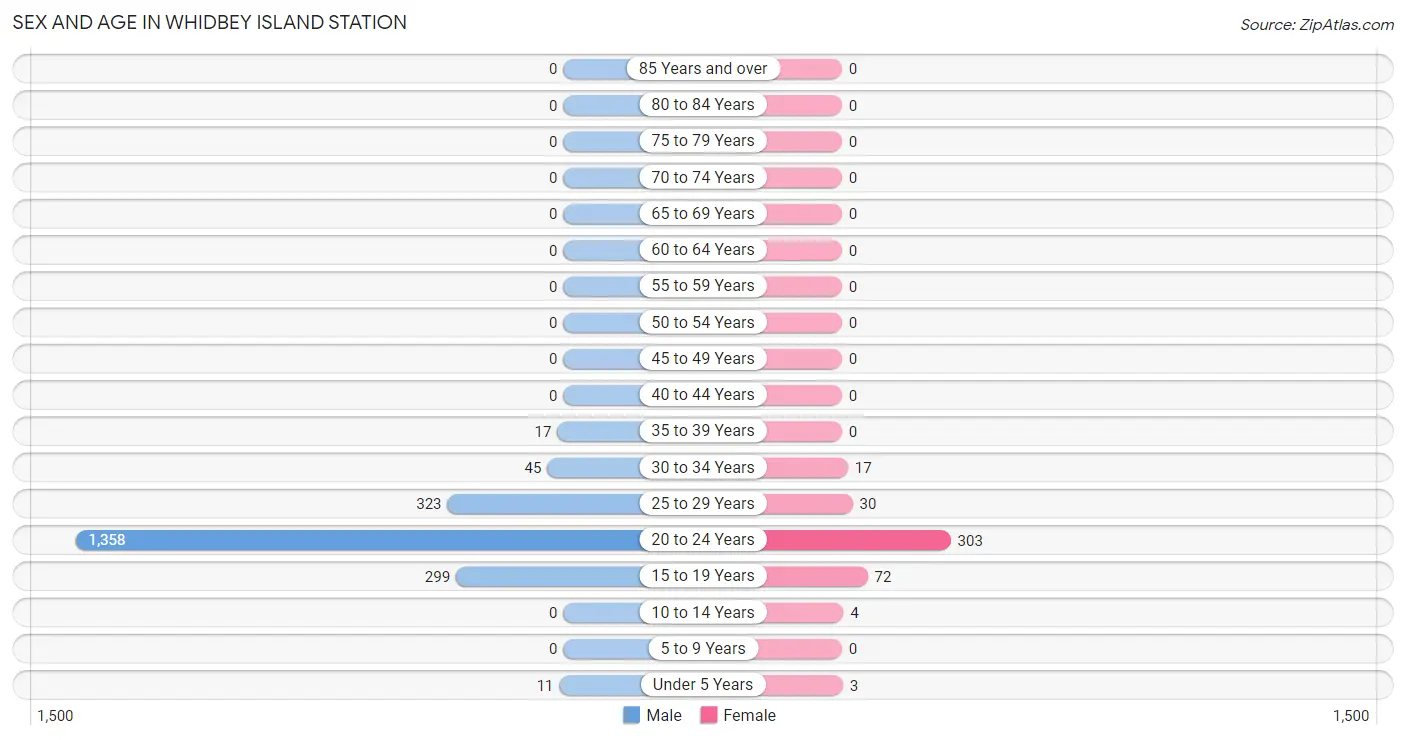
Sex and Age in Whidbey Island Station
Sex and Age in Whidbey Island Station
The most populous age groups in Whidbey Island Station are 20 to 24 Years (1,358 | 66.1%) for men and 20 to 24 Years (303 | 70.6%) for women.
| Age Bracket | Male | Female |
| Under 5 Years | 11 (0.5%) | 3 (0.7%) |
| 5 to 9 Years | 0 (0.0%) | 0 (0.0%) |
| 10 to 14 Years | 0 (0.0%) | 4 (0.9%) |
| 15 to 19 Years | 299 (14.6%) | 72 (16.8%) |
| 20 to 24 Years | 1,358 (66.1%) | 303 (70.6%) |
| 25 to 29 Years | 323 (15.7%) | 30 (7.0%) |
| 30 to 34 Years | 45 (2.2%) | 17 (4.0%) |
| 35 to 39 Years | 17 (0.8%) | 0 (0.0%) |
| 40 to 44 Years | 0 (0.0%) | 0 (0.0%) |
| 45 to 49 Years | 0 (0.0%) | 0 (0.0%) |
| 50 to 54 Years | 0 (0.0%) | 0 (0.0%) |
| 55 to 59 Years | 0 (0.0%) | 0 (0.0%) |
| 60 to 64 Years | 0 (0.0%) | 0 (0.0%) |
| 65 to 69 Years | 0 (0.0%) | 0 (0.0%) |
| 70 to 74 Years | 0 (0.0%) | 0 (0.0%) |
| 75 to 79 Years | 0 (0.0%) | 0 (0.0%) |
| 80 to 84 Years | 0 (0.0%) | 0 (0.0%) |
| 85 Years and over | 0 (0.0%) | 0 (0.0%) |
| Total | 2,053 (100.0%) | 429 (100.0%) |
Families and Households in Whidbey Island Station
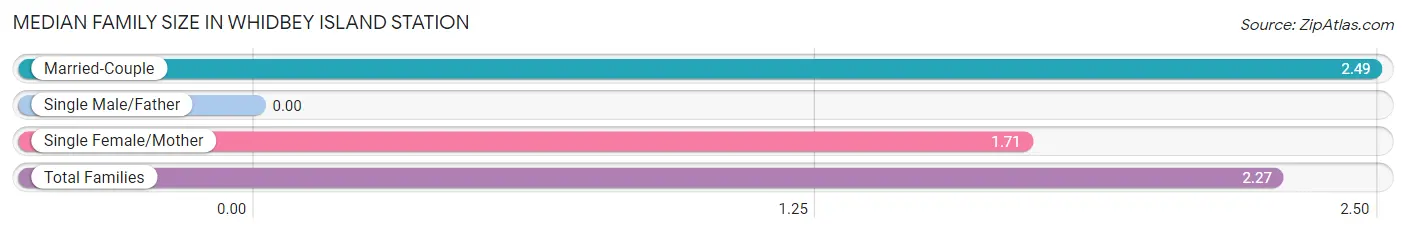
Median Family Size in Whidbey Island Station
| Family Type | # Families | Family Size |
| Married-Couple | 35 (71.4%) | 2.49 |
| Single Male/Father | 0 (0.0%) | - |
| Single Female/Mother | 14 (28.6%) | 1.71 |
| Total Families | 49 (100.0%) | 2.27 |
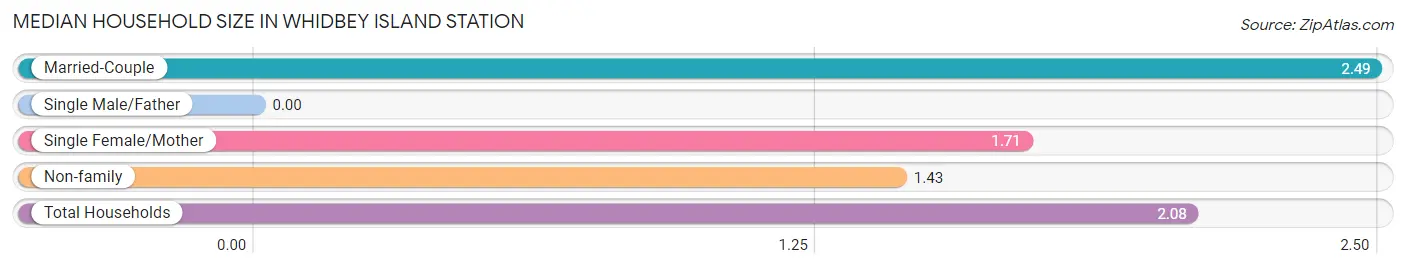
Median Household Size in Whidbey Island Station
| Household Type | # Households | Household Size |
| Married-Couple | 35 (55.6%) | 2.49 |
| Single Male/Father | 0 (0.0%) | - |
| Single Female/Mother | 14 (22.2%) | 1.71 |
| Non-family | 14 (22.2%) | 1.43 |
| Total Households | 63 (100.0%) | 2.08 |
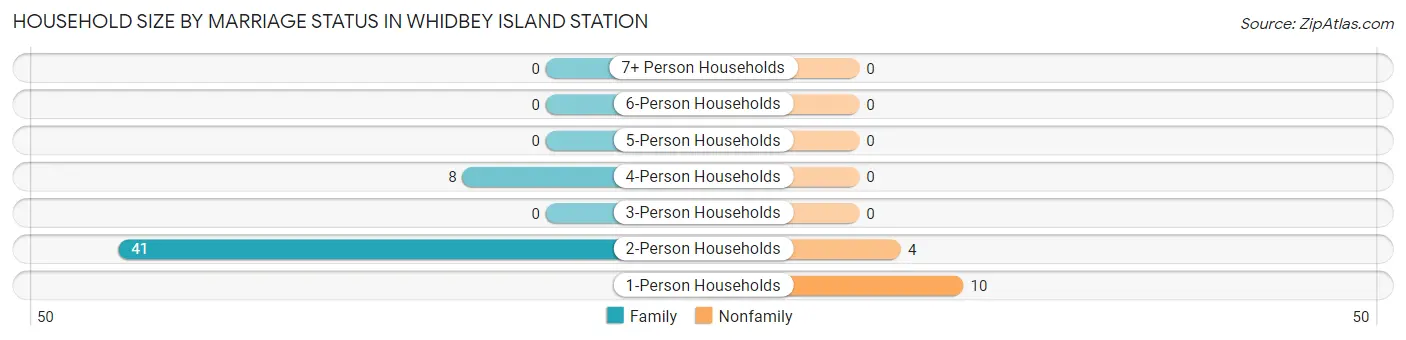
Household Size by Marriage Status in Whidbey Island Station
Out of a total of 63 households in Whidbey Island Station, 49 (77.8%) are family households, while 14 (22.2%) are nonfamily households. The most numerous type of family households are 2-person households, comprising 41, and the most common type of nonfamily households are 1-person households, comprising 10.
| Household Size | Family Households | Nonfamily Households |
| 1-Person Households | - | 10 (15.9%) |
| 2-Person Households | 41 (65.1%) | 4 (6.4%) |
| 3-Person Households | 0 (0.0%) | 0 (0.0%) |
| 4-Person Households | 8 (12.7%) | 0 (0.0%) |
| 5-Person Households | 0 (0.0%) | 0 (0.0%) |
| 6-Person Households | 0 (0.0%) | 0 (0.0%) |
| 7+ Person Households | 0 (0.0%) | 0 (0.0%) |
| Total | 49 (77.8%) | 14 (22.2%) |
Female Fertility in Whidbey Island Station
Fertility by Age in Whidbey Island Station
Average fertility rate in Whidbey Island Station is 31.0 births per 1,000 women. Women in the age bracket of 15 to 19 years have the highest fertility rate with 97.0 births per 1,000 women. Women in the age bracket of 15 to 19 years acount for 53.8% of all women with births.
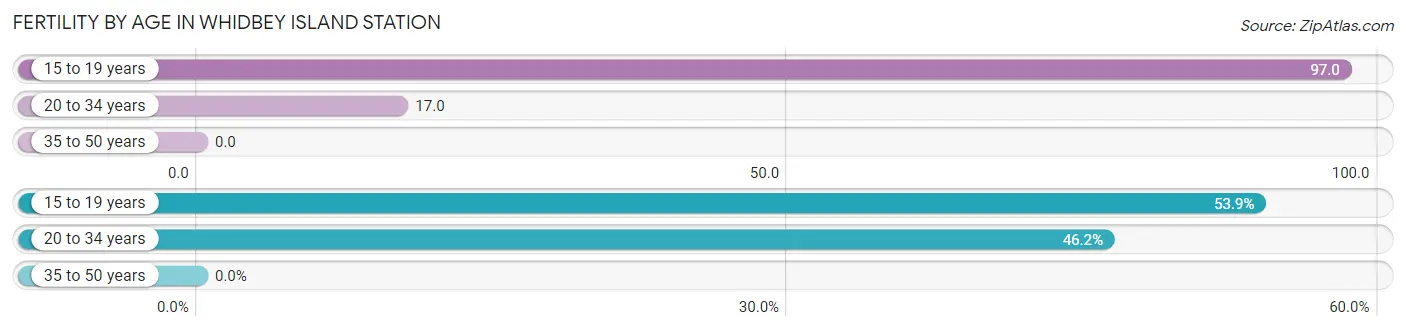
| Age Bracket | Women with Births | Births / 1,000 Women |
| 15 to 19 years | 7 (53.8%) | 97.0 |
| 20 to 34 years | 6 (46.2%) | 17.0 |
| 35 to 50 years | 0 (0.0%) | 0.0 |
| Total | 13 (100.0%) | 31.0 |
Fertility by Age by Marriage Status in Whidbey Island Station
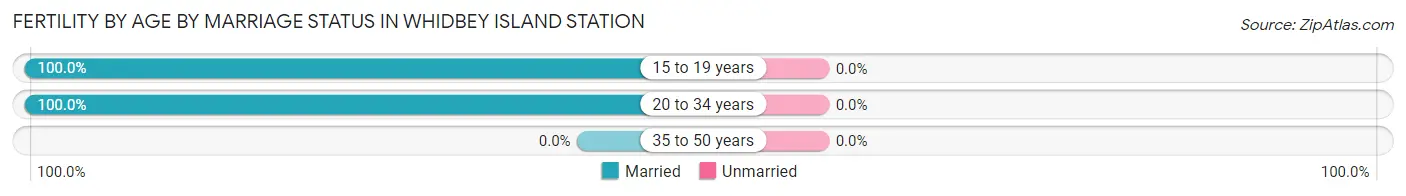
| Age Bracket | Married | Unmarried |
| 15 to 19 years | 7 (100.0%) | 0 (0.0%) |
| 20 to 34 years | 6 (100.0%) | 0 (0.0%) |
| 35 to 50 years | 0 (0.0%) | 0 (0.0%) |
| Total | 13 (100.0%) | 0 (0.0%) |
Fertility by Education in Whidbey Island Station
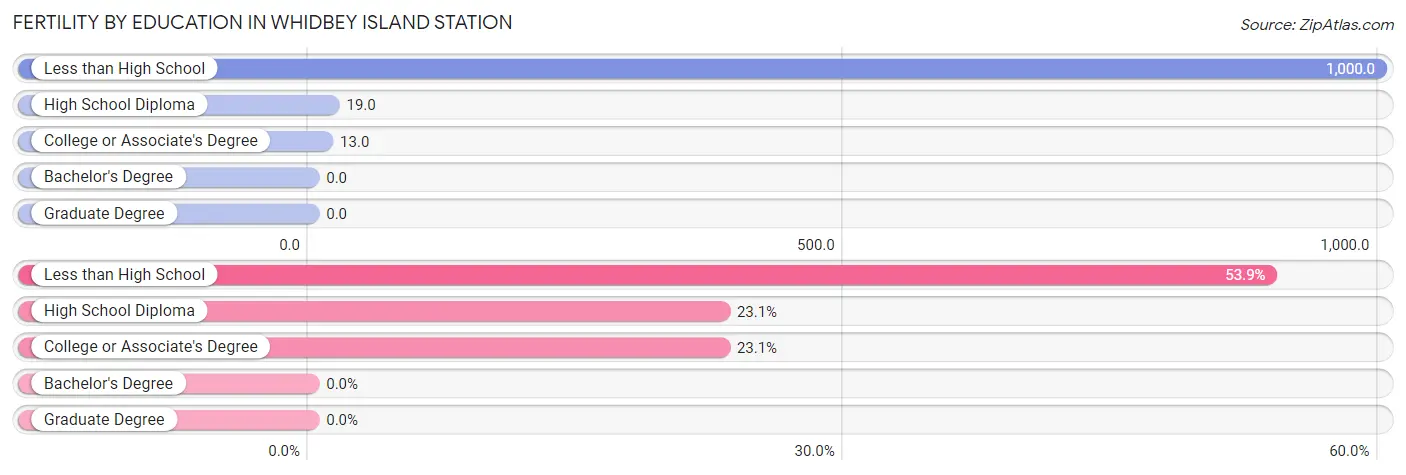
| Educational Attainment | Women with Births | Births / 1,000 Women |
| Less than High School | 7 (53.8%) | 1,000.0 |
| High School Diploma | 3 (23.1%) | 19.0 |
| College or Associate's Degree | 3 (23.1%) | 13.0 |
| Bachelor's Degree | 0 (0.0%) | 0.0 |
| Graduate Degree | 0 (0.0%) | 0.0 |
| Total | 13 (100.0%) | 31.0 |
Fertility by Education by Marriage Status in Whidbey Island Station
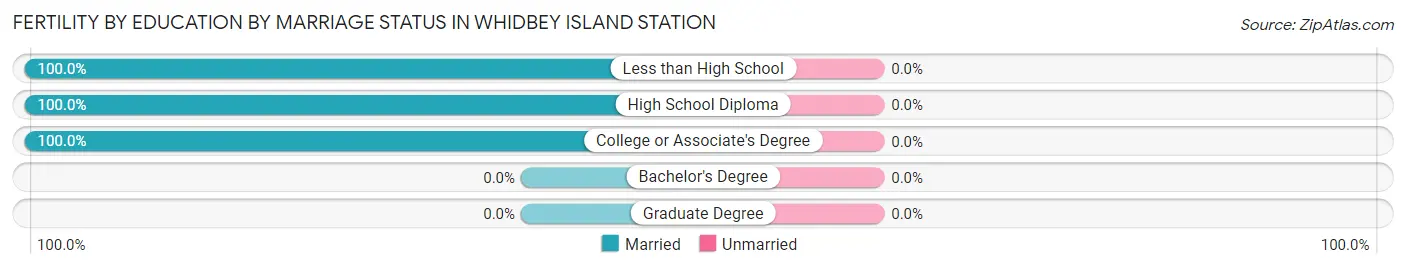
| Educational Attainment | Married | Unmarried |
| Less than High School | 7 (100.0%) | 0 (0.0%) |
| High School Diploma | 3 (100.0%) | 0 (0.0%) |
| College or Associate's Degree | 3 (100.0%) | 0 (0.0%) |
| Bachelor's Degree | 0 (0.0%) | 0 (0.0%) |
| Graduate Degree | 0 (0.0%) | 0 (0.0%) |
| Total | 13 (100.0%) | 0 (0.0%) |
Income in Whidbey Island Station
Income Overview in Whidbey Island Station
Per Capita Income in Whidbey Island Station is $27,228, while median incomes of families and households are $55,179 and $39,375 respectively.
| Characteristic | Number | Measure |
| Per Capita Income | 2,482 | $27,228 |
| Median Family Income | 49 | $55,179 |
| Mean Family Income | 49 | $48,292 |
| Median Household Income | 63 | $39,375 |
| Mean Household Income | 63 | $46,062 |
| Income Deficit | 49 | $0 |
| Wage / Income Gap (%) | 2,482 | 5.28% |
| Wage / Income Gap ($) | 2,482 | 94.72¢ per $1 |
| Gini / Inequality Index | 2,482 | 0.24 |
Earnings by Sex in Whidbey Island Station
Average Earnings in Whidbey Island Station are $24,251, $24,473 for men and $23,180 for women, a difference of 5.3%.
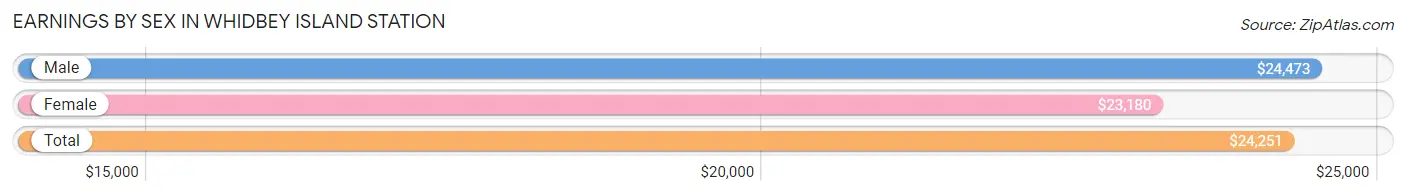
| Sex | Number | Average Earnings |
| Male | 2,005 (82.8%) | $24,473 |
| Female | 416 (17.2%) | $23,180 |
| Total | 2,421 (100.0%) | $24,251 |
Earnings by Sex by Income Bracket in Whidbey Island Station
The most common earnings brackets in Whidbey Island Station are $22,500 to $24,999 for men (709 | 35.4%) and $22,500 to $24,999 for women (147 | 35.3%).
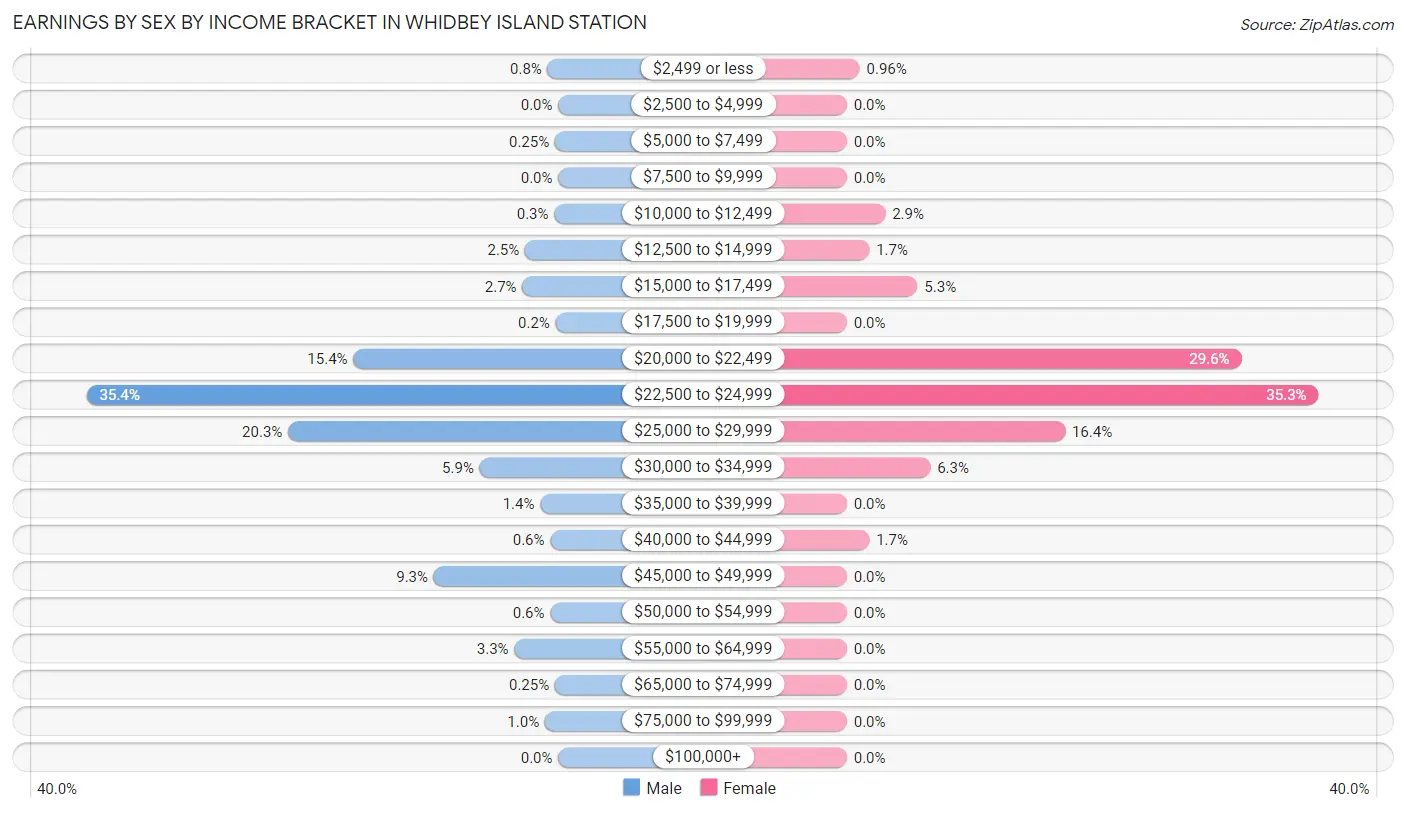
| Income | Male | Female |
| $2,499 or less | 16 (0.8%) | 4 (1.0%) |
| $2,500 to $4,999 | 0 (0.0%) | 0 (0.0%) |
| $5,000 to $7,499 | 5 (0.3%) | 0 (0.0%) |
| $7,500 to $9,999 | 0 (0.0%) | 0 (0.0%) |
| $10,000 to $12,499 | 6 (0.3%) | 12 (2.9%) |
| $12,500 to $14,999 | 50 (2.5%) | 7 (1.7%) |
| $15,000 to $17,499 | 54 (2.7%) | 22 (5.3%) |
| $17,500 to $19,999 | 4 (0.2%) | 0 (0.0%) |
| $20,000 to $22,499 | 308 (15.4%) | 123 (29.6%) |
| $22,500 to $24,999 | 709 (35.4%) | 147 (35.3%) |
| $25,000 to $29,999 | 406 (20.3%) | 68 (16.4%) |
| $30,000 to $34,999 | 118 (5.9%) | 26 (6.2%) |
| $35,000 to $39,999 | 27 (1.3%) | 0 (0.0%) |
| $40,000 to $44,999 | 12 (0.6%) | 7 (1.7%) |
| $45,000 to $49,999 | 187 (9.3%) | 0 (0.0%) |
| $50,000 to $54,999 | 12 (0.6%) | 0 (0.0%) |
| $55,000 to $64,999 | 66 (3.3%) | 0 (0.0%) |
| $65,000 to $74,999 | 5 (0.3%) | 0 (0.0%) |
| $75,000 to $99,999 | 20 (1.0%) | 0 (0.0%) |
| $100,000+ | 0 (0.0%) | 0 (0.0%) |
| Total | 2,005 (100.0%) | 416 (100.0%) |
Earnings by Sex by Educational Attainment in Whidbey Island Station
Average earnings in Whidbey Island Station are $28,648 for men and $26,354 for women, a difference of 8.0%. Men with an educational attainment of college or associate's degree enjoy the highest average annual earnings of $28,463, while those with bachelor's degree education earn the least with $26,771. Women with an educational attainment of college or associate's degree earn the most with the average annual earnings of $27,125, while those with bachelor's degree education have the smallest earnings of $25,804.
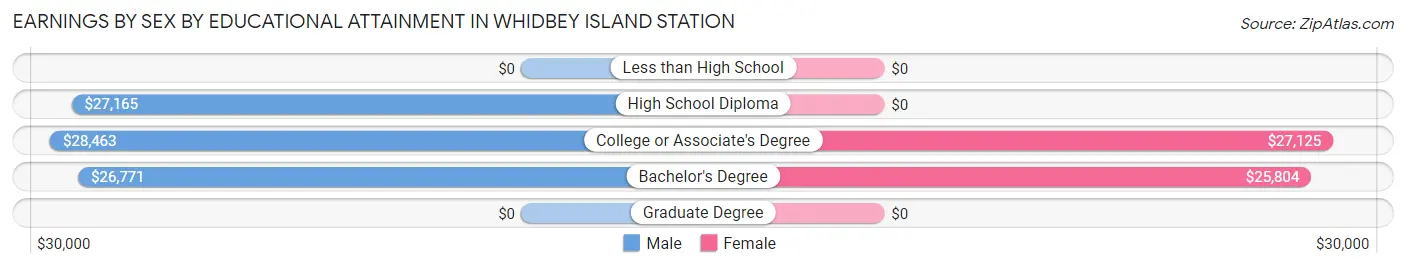
| Educational Attainment | Male Income | Female Income |
| Less than High School | - | - |
| High School Diploma | $27,165 | $0 |
| College or Associate's Degree | $28,463 | $27,125 |
| Bachelor's Degree | $26,771 | $25,804 |
| Graduate Degree | - | - |
| Total | $28,648 | $26,354 |
Family Income in Whidbey Island Station
Family Income Brackets in Whidbey Island Station
According to the Whidbey Island Station family income data, there are 20 families falling into the $35,000 to $49,999 income range, which is the most common income bracket and makes up 40.8% of all families.
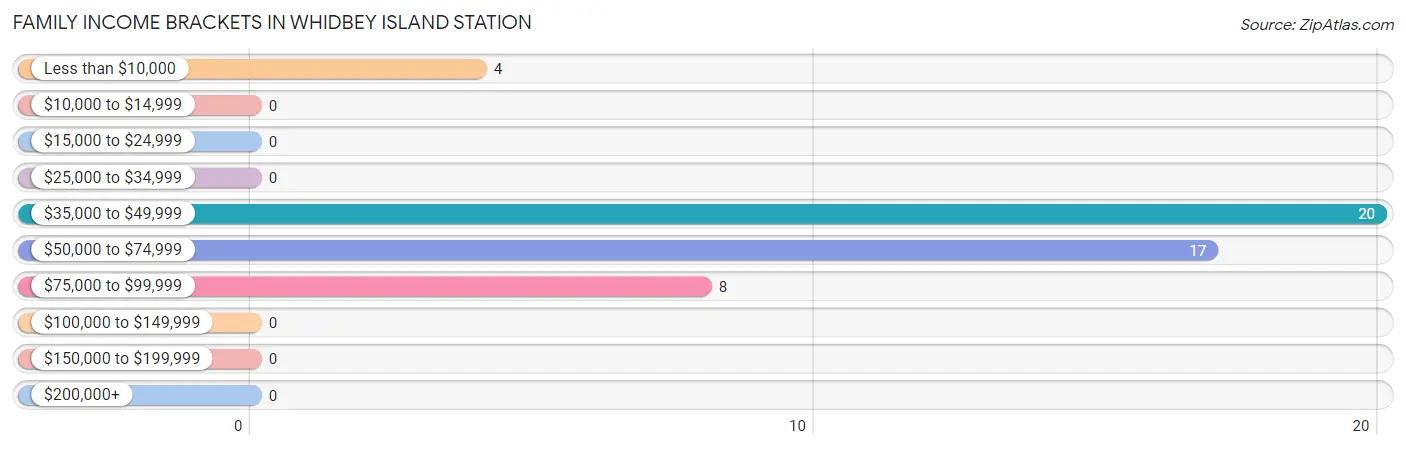
| Income Bracket | # Families | % Families |
| Less than $10,000 | 4 | 8.2% |
| $10,000 to $14,999 | 0 | 0.0% |
| $15,000 to $24,999 | 0 | 0.0% |
| $25,000 to $34,999 | 0 | 0.0% |
| $35,000 to $49,999 | 20 | 40.8% |
| $50,000 to $74,999 | 17 | 34.7% |
| $75,000 to $99,999 | 8 | 16.3% |
| $100,000 to $149,999 | 0 | 0.0% |
| $150,000 to $199,999 | 0 | 0.0% |
| $200,000+ | 0 | 0.0% |
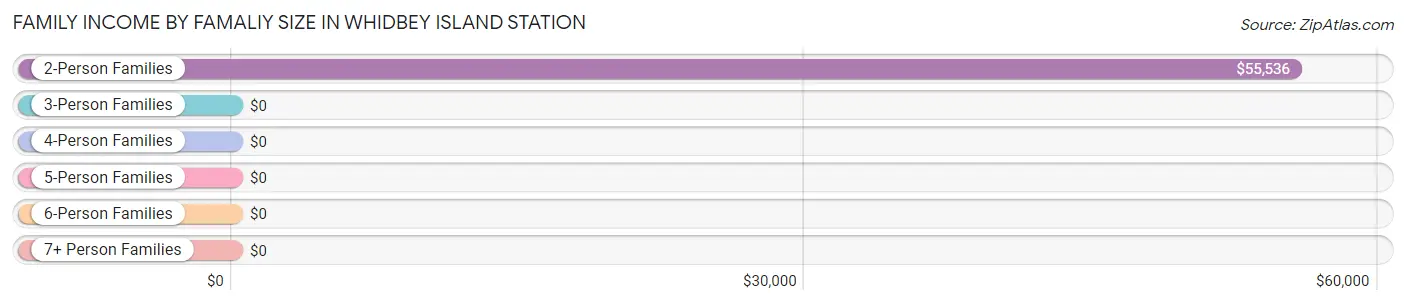
Family Income by Famaliy Size in Whidbey Island Station
2-person families (41 | 83.7%) account for the highest median family income in Whidbey Island Station with $55,536 per family, while 2-person families (41 | 83.7%) have the highest median income of $27,768 per family member.
| Income Bracket | # Families | Median Income |
| 2-Person Families | 41 (83.7%) | $55,536 |
| 3-Person Families | 0 (0.0%) | $0 |
| 4-Person Families | 8 (16.3%) | $0 |
| 5-Person Families | 0 (0.0%) | $0 |
| 6-Person Families | 0 (0.0%) | $0 |
| 7+ Person Families | 0 (0.0%) | $0 |
| Total | 49 (100.0%) | $55,179 |
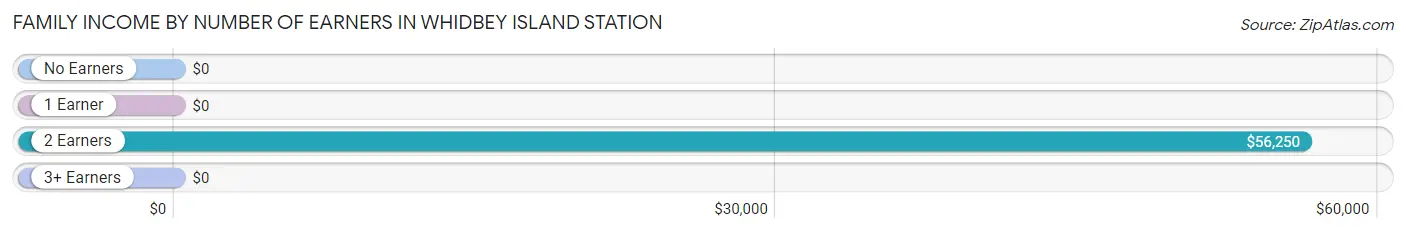
Family Income by Number of Earners in Whidbey Island Station
| Number of Earners | # Families | Median Income |
| No Earners | 0 (0.0%) | $0 |
| 1 Earner | 12 (24.5%) | $0 |
| 2 Earners | 37 (75.5%) | $56,250 |
| 3+ Earners | 0 (0.0%) | $0 |
| Total | 49 (100.0%) | $55,179 |
Household Income in Whidbey Island Station
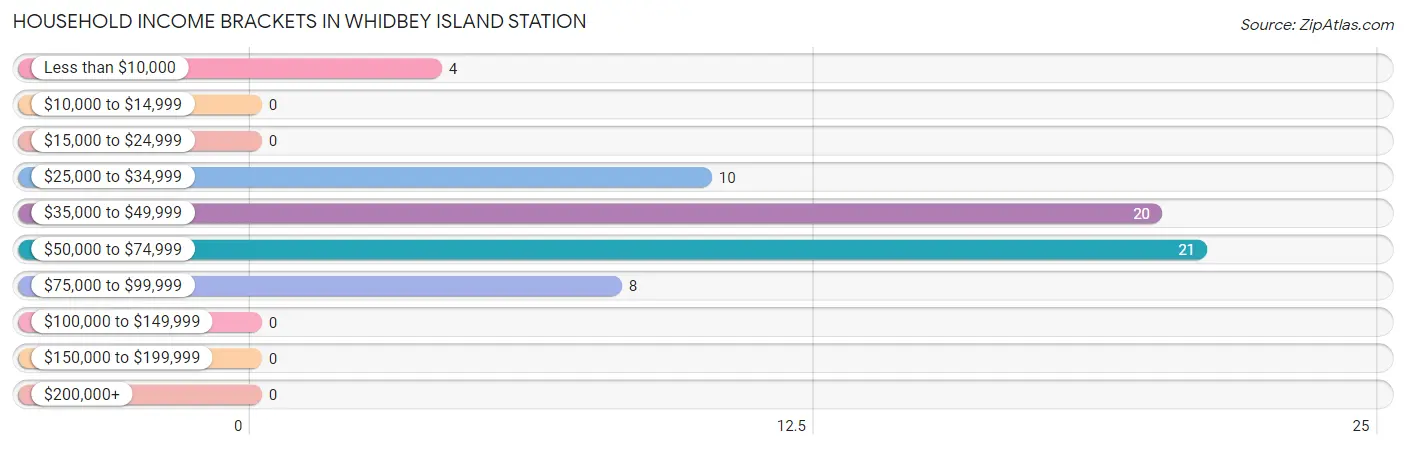
Household Income Brackets in Whidbey Island Station
With 21 households falling in the category, the $50,000 to $74,999 income range is the most frequent in Whidbey Island Station, accounting for 33.3% of all households.
| Income Bracket | # Households | % Households |
| Less than $10,000 | 4 | 6.3% |
| $10,000 to $14,999 | 0 | 0.0% |
| $15,000 to $24,999 | 0 | 0.0% |
| $25,000 to $34,999 | 10 | 15.9% |
| $35,000 to $49,999 | 20 | 31.7% |
| $50,000 to $74,999 | 21 | 33.3% |
| $75,000 to $99,999 | 8 | 12.7% |
| $100,000 to $149,999 | 0 | 0.0% |
| $150,000 to $199,999 | 0 | 0.0% |
| $200,000+ | 0 | 0.0% |
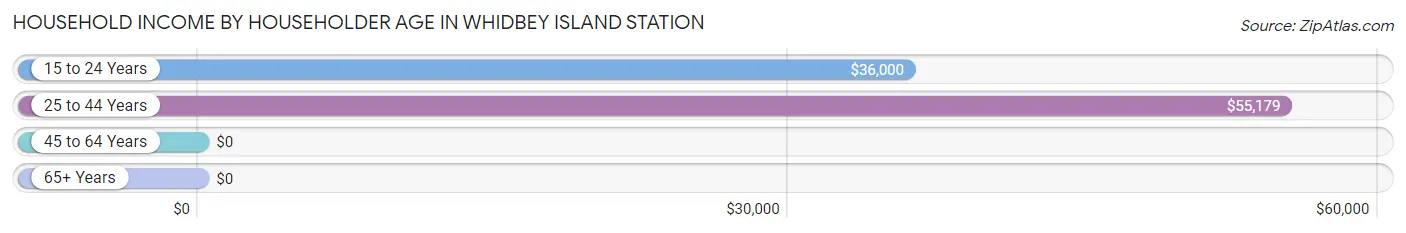
Household Income by Householder Age in Whidbey Island Station
The median household income in Whidbey Island Station is $39,375, with the highest median household income of $55,179 found in the 25 to 44 years age bracket for the primary householder. A total of 39 households (61.9%) fall into this category.
| Income Bracket | # Households | Median Income |
| 15 to 24 Years | 24 (38.1%) | $36,000 |
| 25 to 44 Years | 39 (61.9%) | $55,179 |
| 45 to 64 Years | 0 (0.0%) | $0 |
| 65+ Years | 0 (0.0%) | $0 |
| Total | 63 (100.0%) | $39,375 |
Poverty in Whidbey Island Station
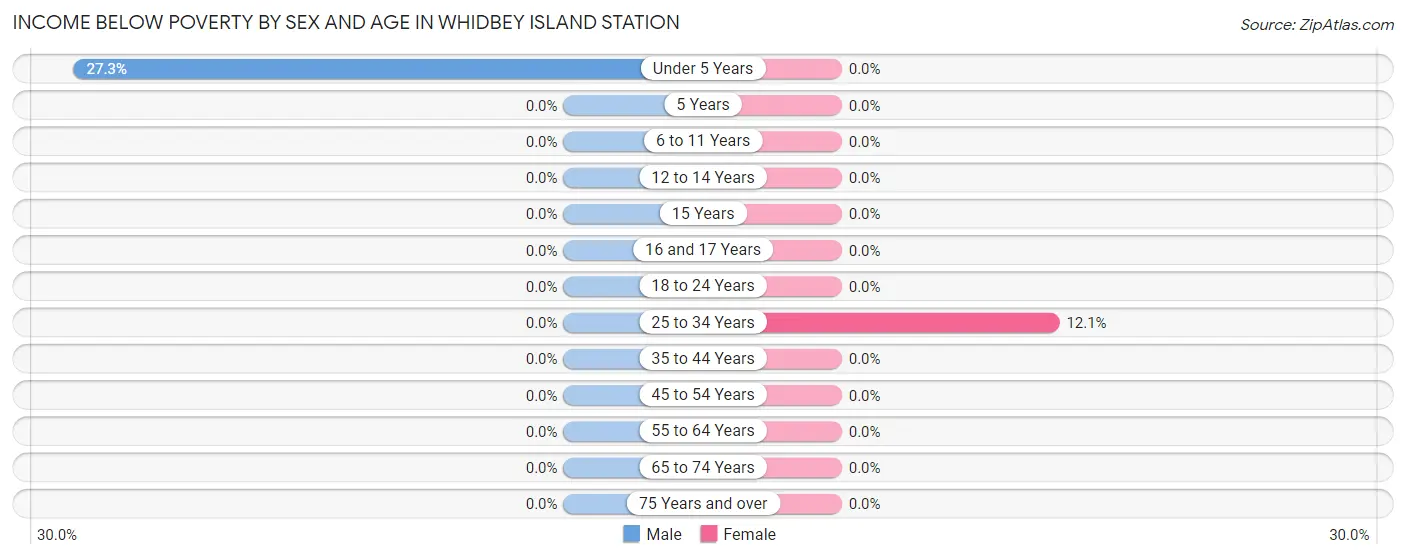
Income Below Poverty by Sex and Age in Whidbey Island Station
With 4.7% poverty level for males and 6.0% for females among the residents of Whidbey Island Station, under 5 year old males and 25 to 34 year old females are the most vulnerable to poverty, with 3 males (27.3%) and 4 females (12.1%) in their respective age groups living below the poverty level.
| Age Bracket | Male | Female |
| Under 5 Years | 3 (27.3%) | 0 (0.0%) |
| 5 Years | 0 (0.0%) | 0 (0.0%) |
| 6 to 11 Years | 0 (0.0%) | 0 (0.0%) |
| 12 to 14 Years | 0 (0.0%) | 0 (0.0%) |
| 15 Years | 0 (0.0%) | 0 (0.0%) |
| 16 and 17 Years | 0 (0.0%) | 0 (0.0%) |
| 18 to 24 Years | 0 (0.0%) | 0 (0.0%) |
| 25 to 34 Years | 0 (0.0%) | 4 (12.1%) |
| 35 to 44 Years | 0 (0.0%) | 0 (0.0%) |
| 45 to 54 Years | 0 (0.0%) | 0 (0.0%) |
| 55 to 64 Years | 0 (0.0%) | 0 (0.0%) |
| 65 to 74 Years | 0 (0.0%) | 0 (0.0%) |
| 75 Years and over | 0 (0.0%) | 0 (0.0%) |
| Total | 3 (4.7%) | 4 (6.0%) |
Income Above Poverty by Sex and Age in Whidbey Island Station
According to the poverty statistics in Whidbey Island Station, males aged 18 to 24 years and females aged under 5 years are the age groups that are most secure financially, with 100.0% of males and 100.0% of females in these age groups living above the poverty line.

| Age Bracket | Male | Female |
| Under 5 Years | 8 (72.7%) | 3 (100.0%) |
| 5 Years | 0 (0.0%) | 0 (0.0%) |
| 6 to 11 Years | 0 (0.0%) | 4 (100.0%) |
| 12 to 14 Years | 0 (0.0%) | 0 (0.0%) |
| 15 Years | 0 (0.0%) | 0 (0.0%) |
| 16 and 17 Years | 0 (0.0%) | 0 (0.0%) |
| 18 to 24 Years | 26 (100.0%) | 27 (100.0%) |
| 25 to 34 Years | 27 (100.0%) | 29 (87.9%) |
| 35 to 44 Years | 0 (0.0%) | 0 (0.0%) |
| 45 to 54 Years | 0 (0.0%) | 0 (0.0%) |
| 55 to 64 Years | 0 (0.0%) | 0 (0.0%) |
| 65 to 74 Years | 0 (0.0%) | 0 (0.0%) |
| 75 Years and over | 0 (0.0%) | 0 (0.0%) |
| Total | 61 (95.3%) | 63 (94.0%) |
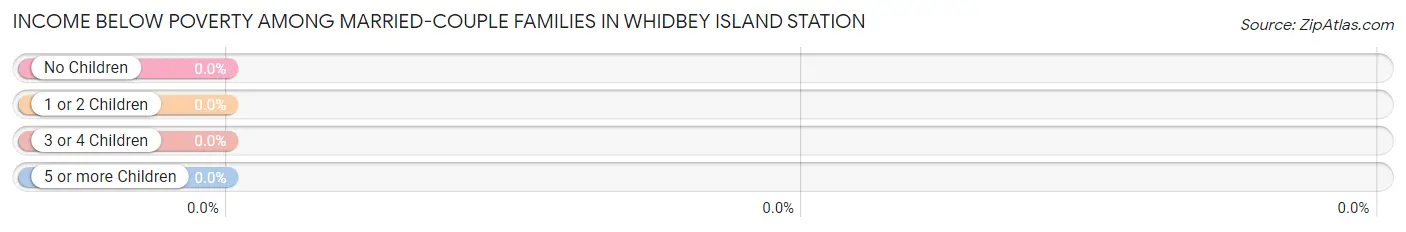
Income Below Poverty Among Married-Couple Families in Whidbey Island Station
| Children | Above Poverty | Below Poverty |
| No Children | 27 (100.0%) | 0 (0.0%) |
| 1 or 2 Children | 8 (100.0%) | 0 (0.0%) |
| 3 or 4 Children | 0 (0.0%) | 0 (0.0%) |
| 5 or more Children | 0 (0.0%) | 0 (0.0%) |
| Total | 35 (100.0%) | 0 (0.0%) |
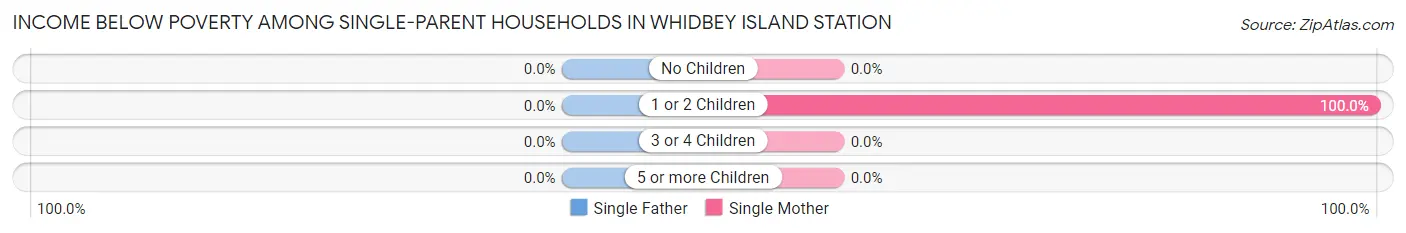
Income Below Poverty Among Single-Parent Households in Whidbey Island Station
| Children | Single Father | Single Mother |
| No Children | 0 (0.0%) | 0 (0.0%) |
| 1 or 2 Children | 0 (0.0%) | 4 (100.0%) |
| 3 or 4 Children | 0 (0.0%) | 0 (0.0%) |
| 5 or more Children | 0 (0.0%) | 0 (0.0%) |
| Total | 0 (0.0%) | 4 (28.6%) |
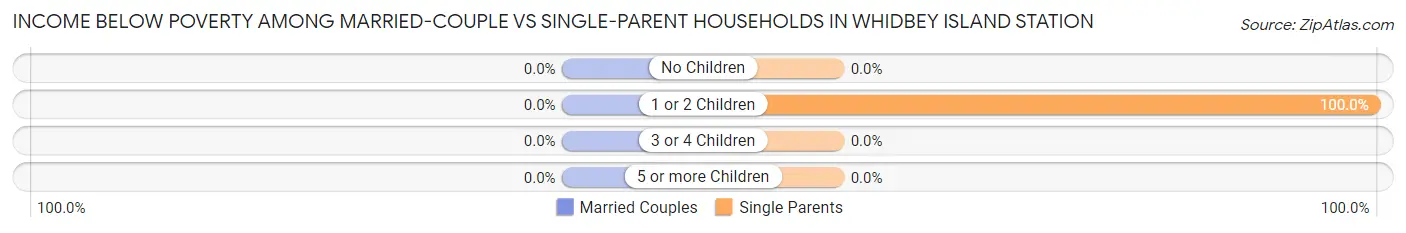
Income Below Poverty Among Married-Couple vs Single-Parent Households in Whidbey Island Station
| Children | Married-Couple Families | Single-Parent Households |
| No Children | 0 (0.0%) | 0 (0.0%) |
| 1 or 2 Children | 0 (0.0%) | 4 (100.0%) |
| 3 or 4 Children | 0 (0.0%) | 0 (0.0%) |
| 5 or more Children | 0 (0.0%) | 0 (0.0%) |
| Total | 0 (0.0%) | 4 (28.6%) |
Employment Characteristics in Whidbey Island Station
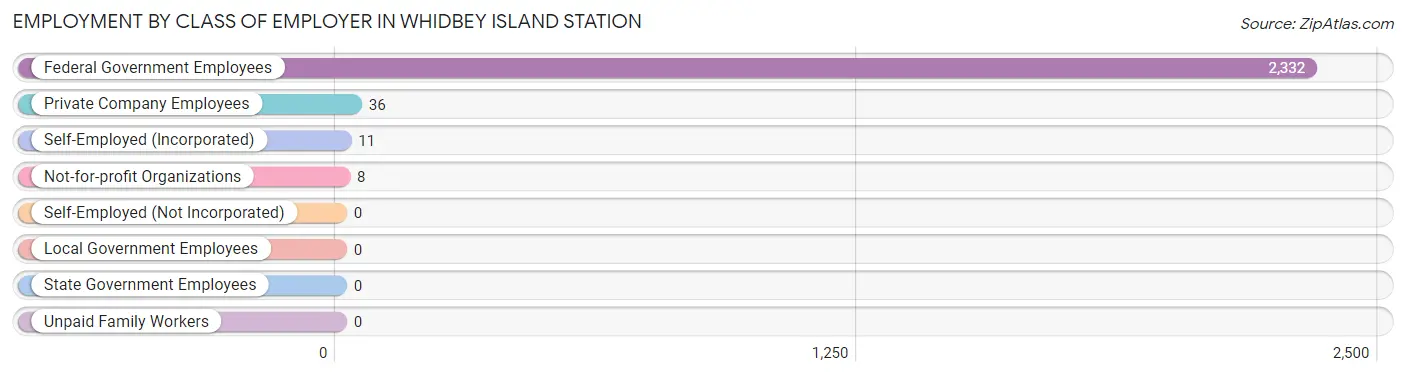
Employment by Class of Employer in Whidbey Island Station
Among the 2,387 employed individuals in Whidbey Island Station, federal government employees (2,332 | 97.7%), private company employees (36 | 1.5%), and self-employed (incorporated) (11 | 0.5%) make up the most common classes of employment.
| Employer Class | # Employees | % Employees |
| Private Company Employees | 36 | 1.5% |
| Self-Employed (Incorporated) | 11 | 0.5% |
| Self-Employed (Not Incorporated) | 0 | 0.0% |
| Not-for-profit Organizations | 8 | 0.3% |
| Local Government Employees | 0 | 0.0% |
| State Government Employees | 0 | 0.0% |
| Federal Government Employees | 2,332 | 97.7% |
| Unpaid Family Workers | 0 | 0.0% |
| Total | 2,387 | 100.0% |
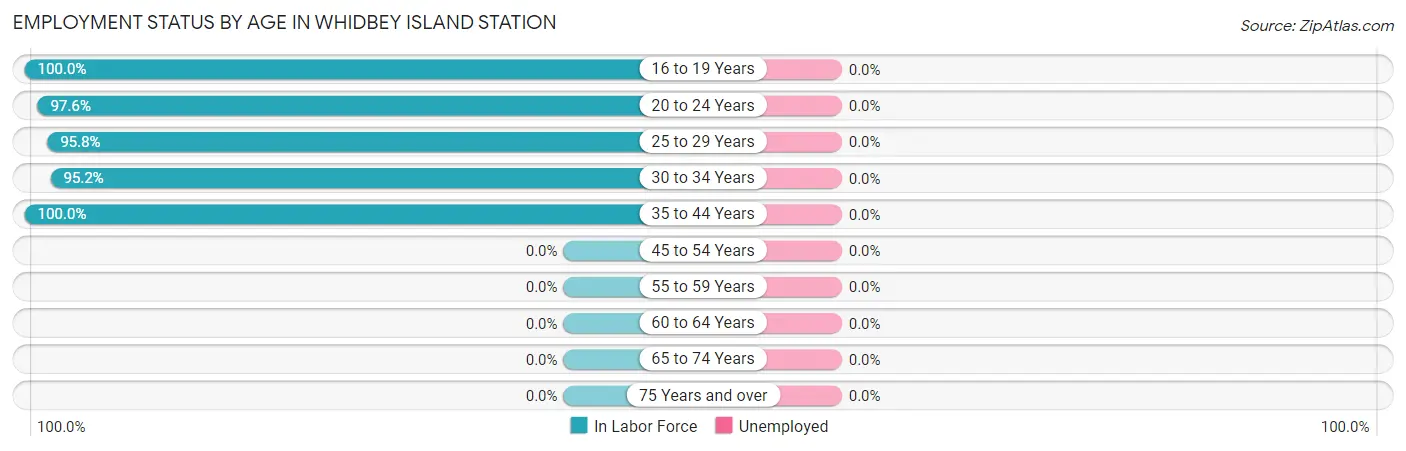
Employment Status by Age in Whidbey Island Station
| Age Bracket | In Labor Force | Unemployed |
| 16 to 19 Years | 371 (100.0%) | 0 (0.0%) |
| 20 to 24 Years | 1,621 (97.6%) | 0 (0.0%) |
| 25 to 29 Years | 338 (95.8%) | 0 (0.0%) |
| 30 to 34 Years | 59 (95.2%) | 0 (0.0%) |
| 35 to 44 Years | 17 (100.0%) | 0 (0.0%) |
| 45 to 54 Years | 0 (0.0%) | 0 (0.0%) |
| 55 to 59 Years | 0 (0.0%) | 0 (0.0%) |
| 60 to 64 Years | 0 (0.0%) | 0 (0.0%) |
| 65 to 74 Years | 0 (0.0%) | 0 (0.0%) |
| 75 Years and over | 0 (0.0%) | 0 (0.0%) |
| Total | 2,405 (97.6%) | 0 (0.0%) |
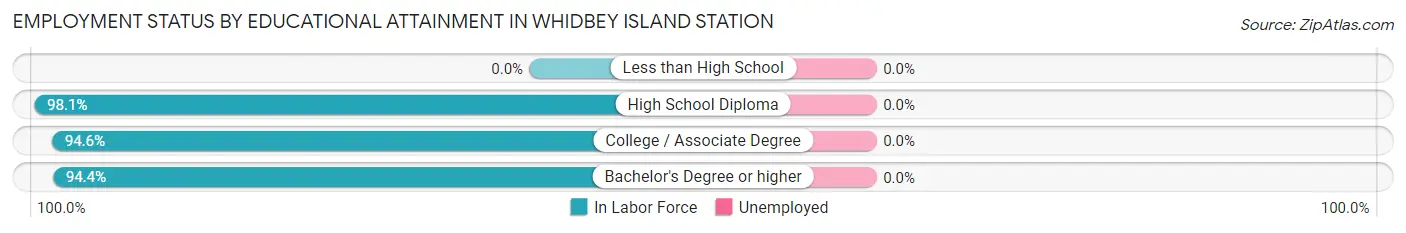
Employment Status by Educational Attainment in Whidbey Island Station
| Educational Attainment | In Labor Force | Unemployed |
| Less than High School | 0 (0.0%) | 0 (0.0%) |
| High School Diploma | 153 (98.1%) | 0 (0.0%) |
| College / Associate Degree | 176 (94.6%) | 0 (0.0%) |
| Bachelor's Degree or higher | 85 (94.4%) | 0 (0.0%) |
| Total | 414 (95.8%) | 0 (0.0%) |
Employment Occupations by Sex in Whidbey Island Station
Management, Business, Science and Arts Occupations
The most common Management, Business, Science and Arts occupations in Whidbey Island Station are , and Management (11 | 16.4%).
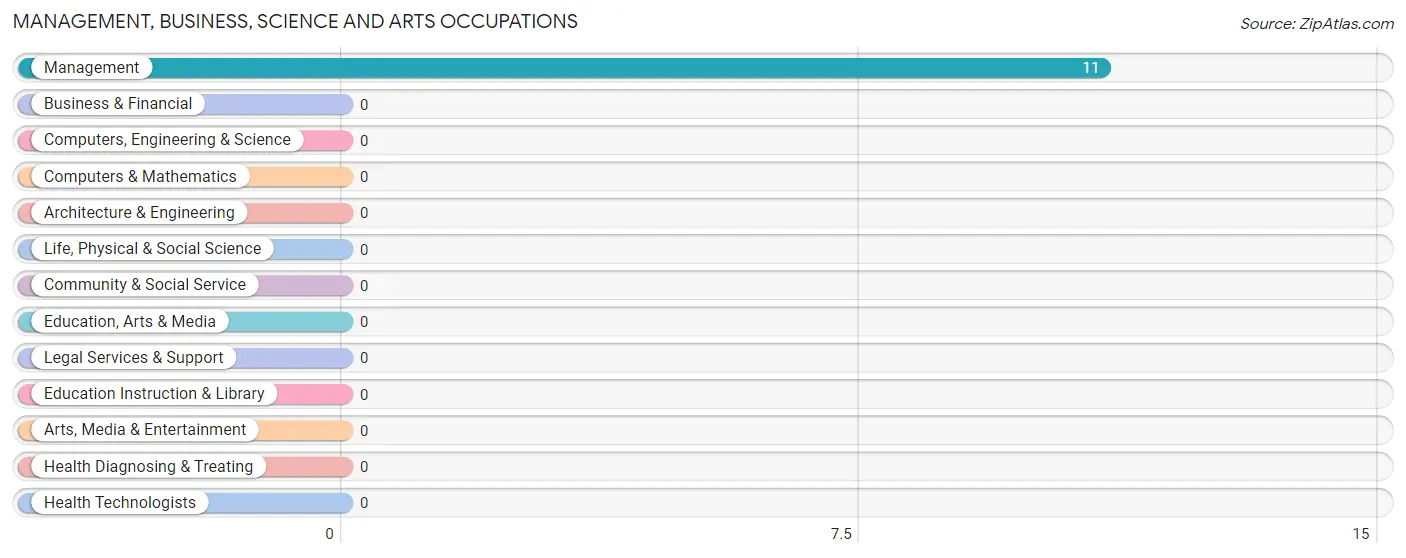
Management, Business, Science and Arts Occupations by Sex
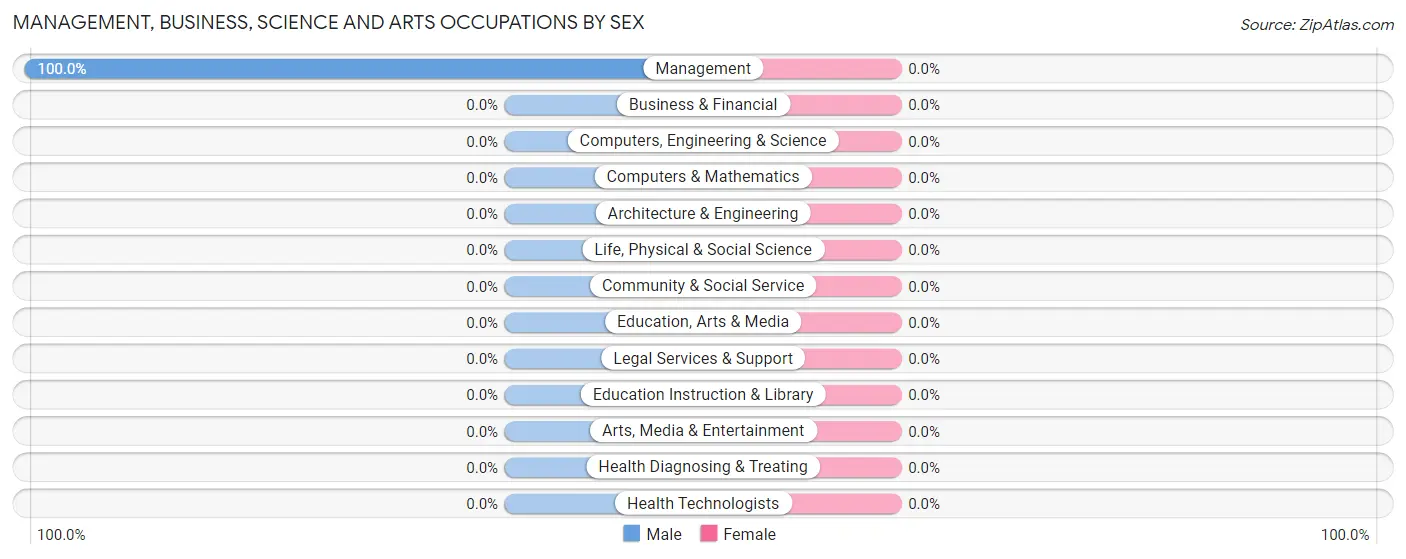
| Occupation | Male | Female |
| Management | 11 (100.0%) | 0 (0.0%) |
| Business & Financial | 0 (0.0%) | 0 (0.0%) |
| Computers, Engineering & Science | 0 (0.0%) | 0 (0.0%) |
| Computers & Mathematics | 0 (0.0%) | 0 (0.0%) |
| Architecture & Engineering | 0 (0.0%) | 0 (0.0%) |
| Life, Physical & Social Science | 0 (0.0%) | 0 (0.0%) |
| Community & Social Service | 0 (0.0%) | 0 (0.0%) |
| Education, Arts & Media | 0 (0.0%) | 0 (0.0%) |
| Legal Services & Support | 0 (0.0%) | 0 (0.0%) |
| Education Instruction & Library | 0 (0.0%) | 0 (0.0%) |
| Arts, Media & Entertainment | 0 (0.0%) | 0 (0.0%) |
| Health Diagnosing & Treating | 0 (0.0%) | 0 (0.0%) |
| Health Technologists | 0 (0.0%) | 0 (0.0%) |
| Total (Category) | 11 (100.0%) | 0 (0.0%) |
| Total (Overall) | 39 (58.2%) | 28 (41.8%) |
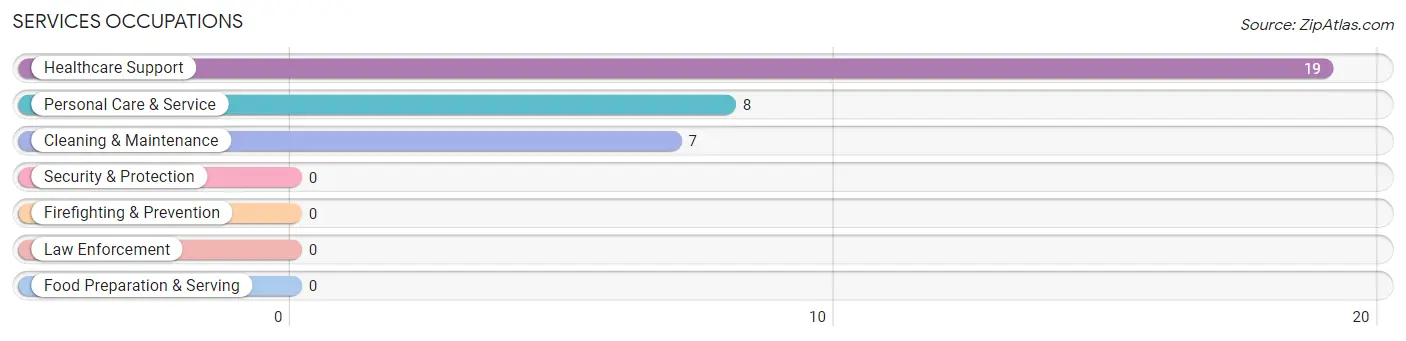
Services Occupations
The most common Services occupations in Whidbey Island Station are Healthcare Support (19 | 28.4%), Personal Care & Service (8 | 11.9%), and Cleaning & Maintenance (7 | 10.4%).
Services Occupations by Sex
Within the Services occupations in Whidbey Island Station, the most male-oriented occupations are Personal Care & Service (100.0%), and Healthcare Support (47.4%), while the most female-oriented occupations are Cleaning & Maintenance (100.0%), and Healthcare Support (52.6%).
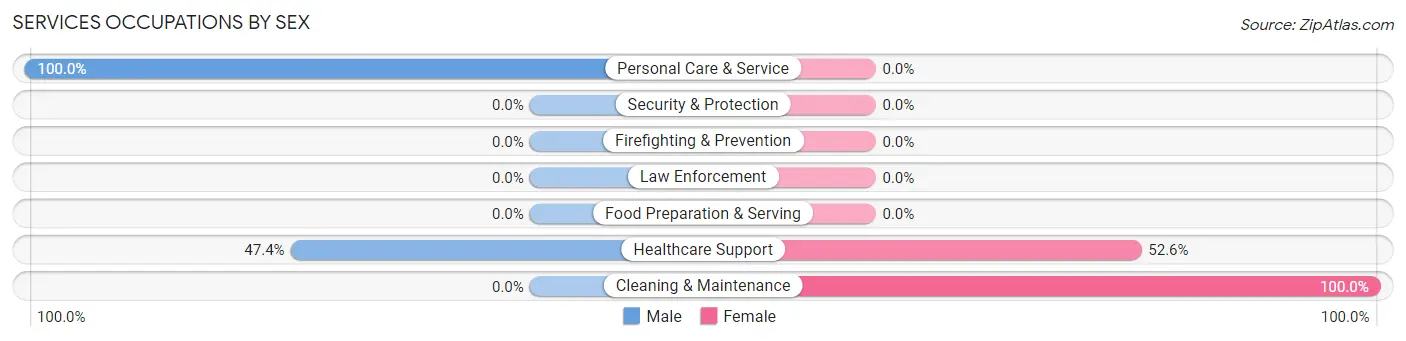
| Occupation | Male | Female |
| Healthcare Support | 9 (47.4%) | 10 (52.6%) |
| Security & Protection | 0 (0.0%) | 0 (0.0%) |
| Firefighting & Prevention | 0 (0.0%) | 0 (0.0%) |
| Law Enforcement | 0 (0.0%) | 0 (0.0%) |
| Food Preparation & Serving | 0 (0.0%) | 0 (0.0%) |
| Cleaning & Maintenance | 0 (0.0%) | 7 (100.0%) |
| Personal Care & Service | 8 (100.0%) | 0 (0.0%) |
| Total (Category) | 17 (50.0%) | 17 (50.0%) |
| Total (Overall) | 39 (58.2%) | 28 (41.8%) |
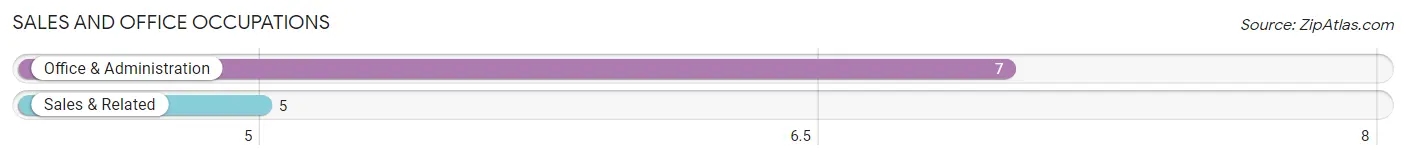
Sales and Office Occupations
The most common Sales and Office occupations in Whidbey Island Station are Office & Administration (7 | 10.4%), and Sales & Related (5 | 7.5%).
Sales and Office Occupations by Sex
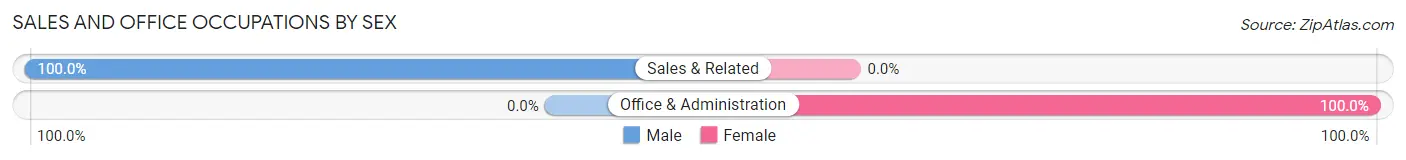
| Occupation | Male | Female |
| Sales & Related | 5 (100.0%) | 0 (0.0%) |
| Office & Administration | 0 (0.0%) | 7 (100.0%) |
| Total (Category) | 5 (41.7%) | 7 (58.3%) |
| Total (Overall) | 39 (58.2%) | 28 (41.8%) |
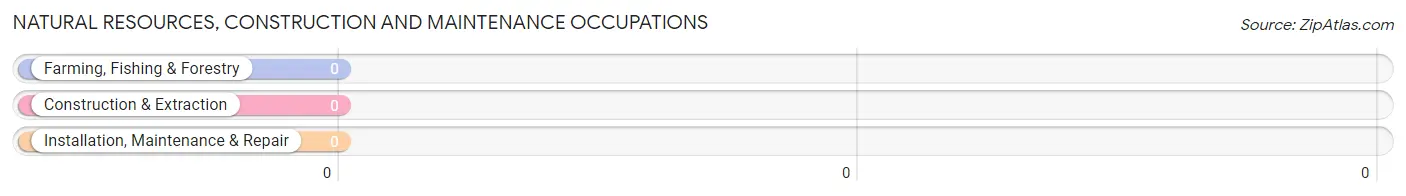
Natural Resources, Construction and Maintenance Occupations
Natural Resources, Construction and Maintenance Occupations by Sex
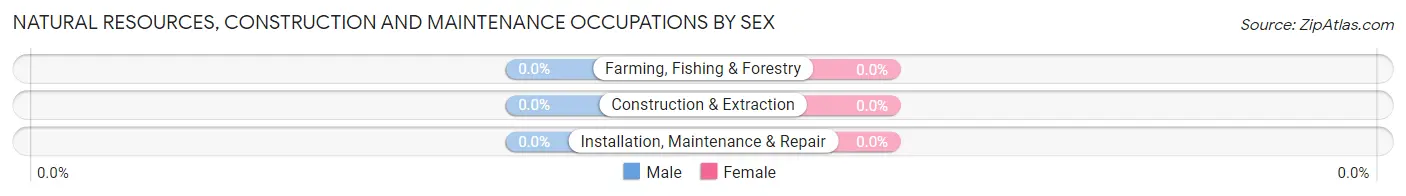
| Occupation | Male | Female |
| Farming, Fishing & Forestry | 0 (0.0%) | 0 (0.0%) |
| Construction & Extraction | 0 (0.0%) | 0 (0.0%) |
| Installation, Maintenance & Repair | 0 (0.0%) | 0 (0.0%) |
| Total (Category) | 0 (0.0%) | 0 (0.0%) |
| Total (Overall) | 39 (58.2%) | 28 (41.8%) |
Production, Transportation and Moving Occupations
The most common Production, Transportation and Moving occupations in Whidbey Island Station are , and Material Moving (10 | 14.9%).
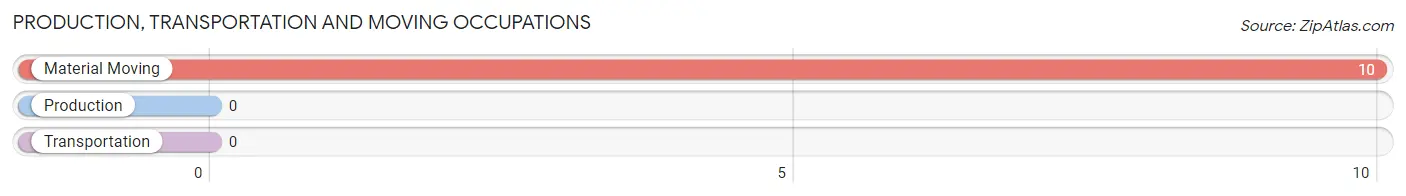
Production, Transportation and Moving Occupations by Sex
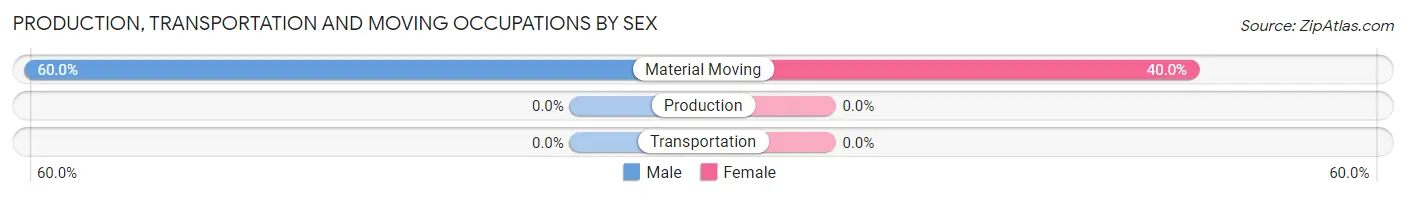
| Occupation | Male | Female |
| Production | 0 (0.0%) | 0 (0.0%) |
| Transportation | 0 (0.0%) | 0 (0.0%) |
| Material Moving | 6 (60.0%) | 4 (40.0%) |
| Total (Category) | 6 (60.0%) | 4 (40.0%) |
| Total (Overall) | 39 (58.2%) | 28 (41.8%) |
Employment Industries by Sex in Whidbey Island Station
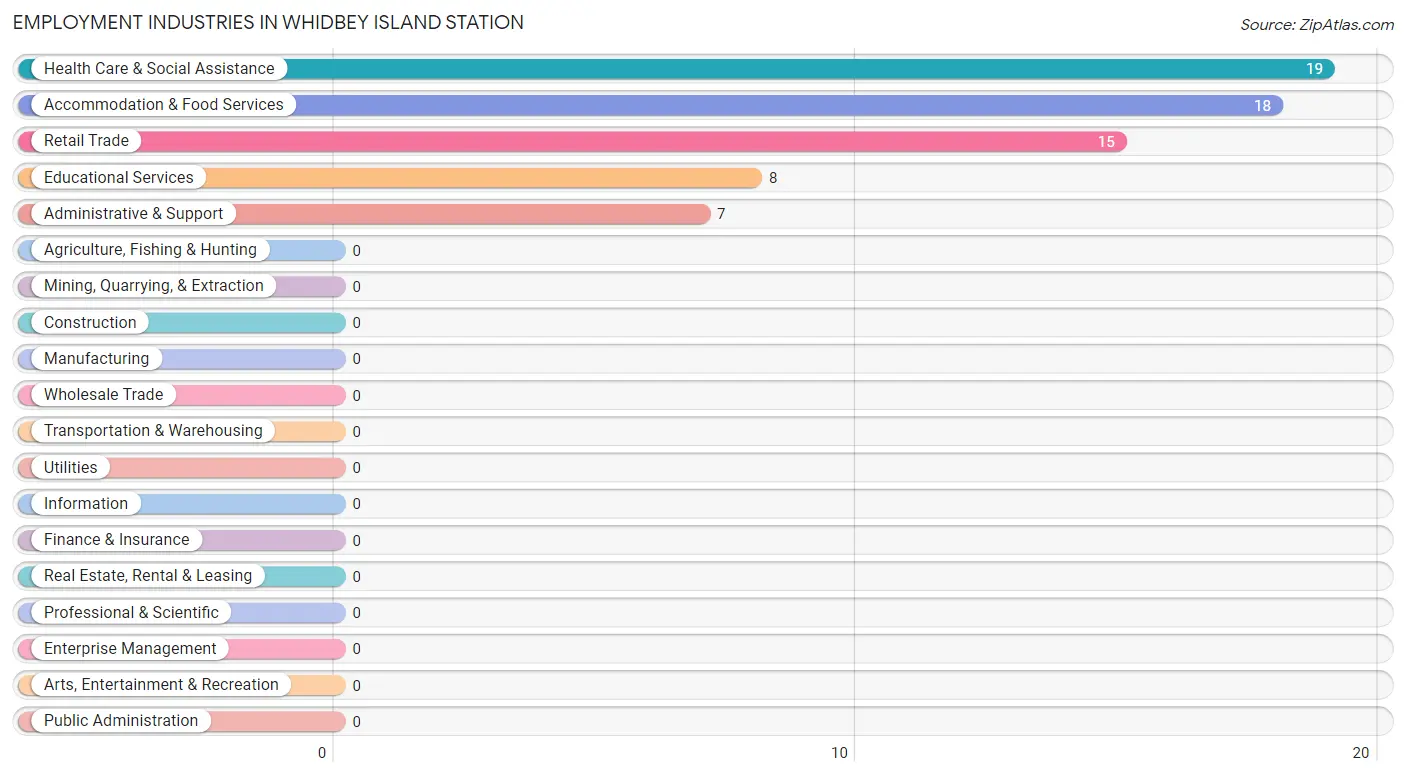
Employment Industries in Whidbey Island Station
The major employment industries in Whidbey Island Station include Health Care & Social Assistance (19 | 28.4%), Accommodation & Food Services (18 | 26.9%), Retail Trade (15 | 22.4%), Educational Services (8 | 11.9%), and Administrative & Support (7 | 10.4%).
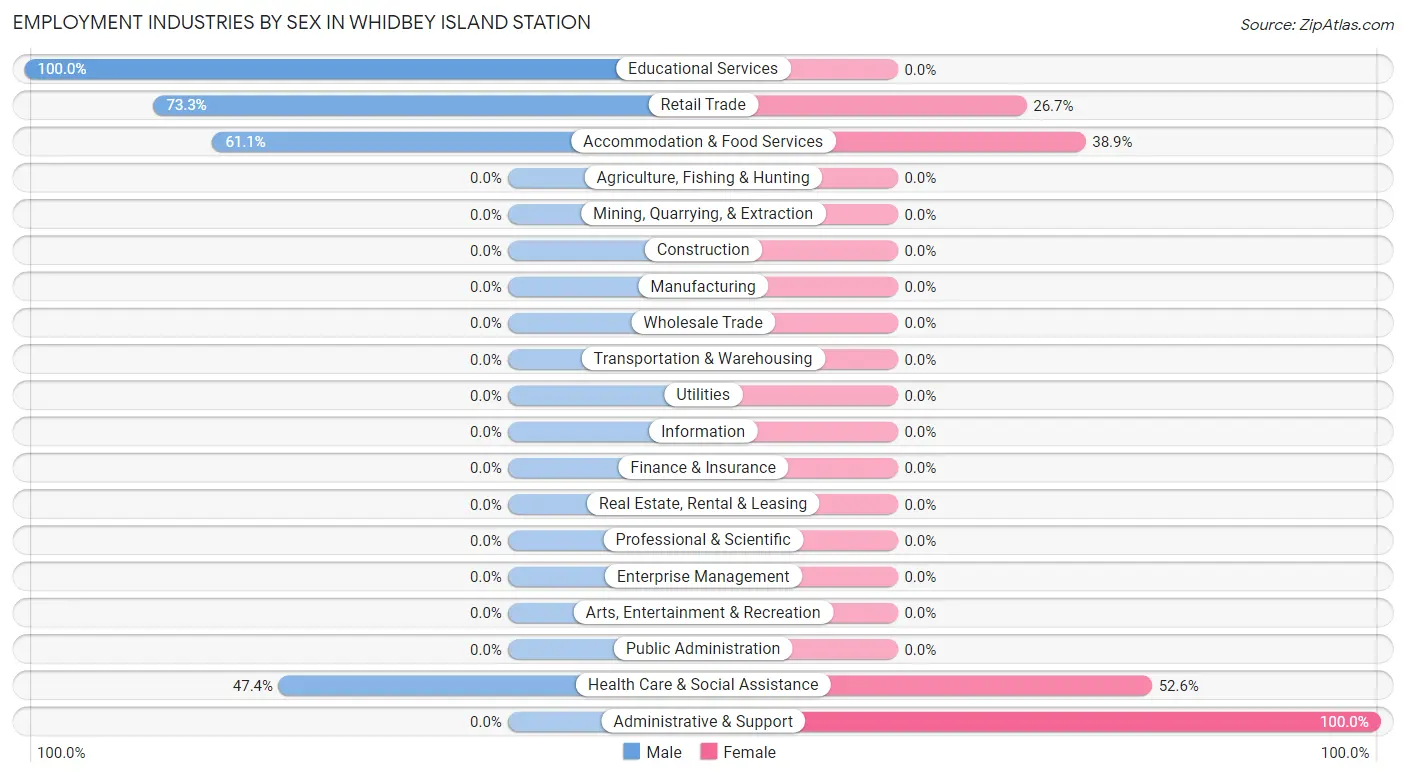
Employment Industries by Sex in Whidbey Island Station
The Whidbey Island Station industries that see more men than women are Educational Services (100.0%), Retail Trade (73.3%), and Accommodation & Food Services (61.1%), whereas the industries that tend to have a higher number of women are Administrative & Support (100.0%), Health Care & Social Assistance (52.6%), and Accommodation & Food Services (38.9%).
| Industry | Male | Female |
| Agriculture, Fishing & Hunting | 0 (0.0%) | 0 (0.0%) |
| Mining, Quarrying, & Extraction | 0 (0.0%) | 0 (0.0%) |
| Construction | 0 (0.0%) | 0 (0.0%) |
| Manufacturing | 0 (0.0%) | 0 (0.0%) |
| Wholesale Trade | 0 (0.0%) | 0 (0.0%) |
| Retail Trade | 11 (73.3%) | 4 (26.7%) |
| Transportation & Warehousing | 0 (0.0%) | 0 (0.0%) |
| Utilities | 0 (0.0%) | 0 (0.0%) |
| Information | 0 (0.0%) | 0 (0.0%) |
| Finance & Insurance | 0 (0.0%) | 0 (0.0%) |
| Real Estate, Rental & Leasing | 0 (0.0%) | 0 (0.0%) |
| Professional & Scientific | 0 (0.0%) | 0 (0.0%) |
| Enterprise Management | 0 (0.0%) | 0 (0.0%) |
| Administrative & Support | 0 (0.0%) | 7 (100.0%) |
| Educational Services | 8 (100.0%) | 0 (0.0%) |
| Health Care & Social Assistance | 9 (47.4%) | 10 (52.6%) |
| Arts, Entertainment & Recreation | 0 (0.0%) | 0 (0.0%) |
| Accommodation & Food Services | 11 (61.1%) | 7 (38.9%) |
| Public Administration | 0 (0.0%) | 0 (0.0%) |
| Total | 39 (58.2%) | 28 (41.8%) |
Education in Whidbey Island Station
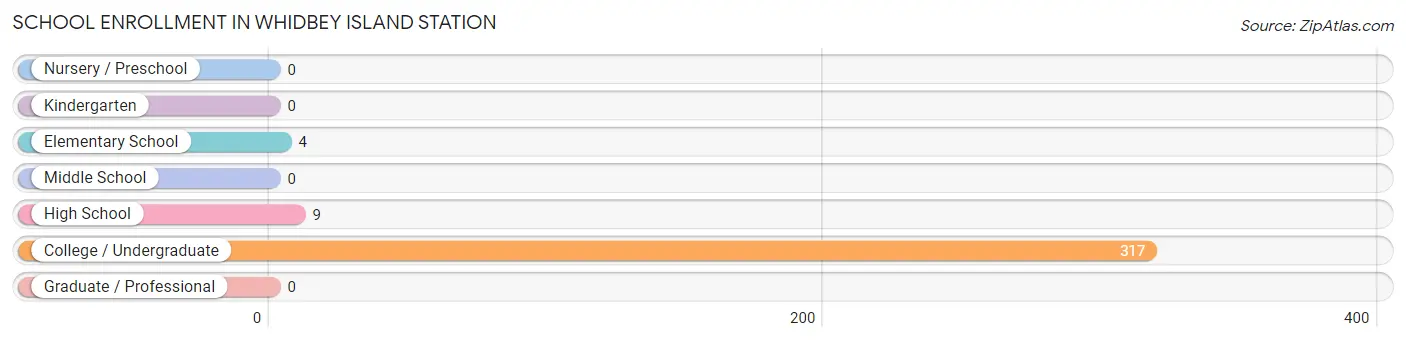
School Enrollment in Whidbey Island Station
The most common levels of schooling among the 330 students in Whidbey Island Station are college / undergraduate (317 | 96.1%), high school (9 | 2.7%), and elementary school (4 | 1.2%).
| School Level | # Students | % Students |
| Nursery / Preschool | 0 | 0.0% |
| Kindergarten | 0 | 0.0% |
| Elementary School | 4 | 1.2% |
| Middle School | 0 | 0.0% |
| High School | 9 | 2.7% |
| College / Undergraduate | 317 | 96.1% |
| Graduate / Professional | 0 | 0.0% |
| Total | 330 | 100.0% |
School Enrollment by Age by Funding Source in Whidbey Island Station
Out of a total of 330 students who are enrolled in schools in Whidbey Island Station, 66 (20.0%) attend a private institution, while the remaining 264 (80.0%) are enrolled in public schools. The age group of 18 to 19 year olds has the highest likelihood of being enrolled in private schools, with 13 (43.3% in the age bracket) enrolled. Conversely, the age group of 10 to 14 year olds has the lowest likelihood of being enrolled in a private school, with 4 (100.0% in the age bracket) attending a public institution.
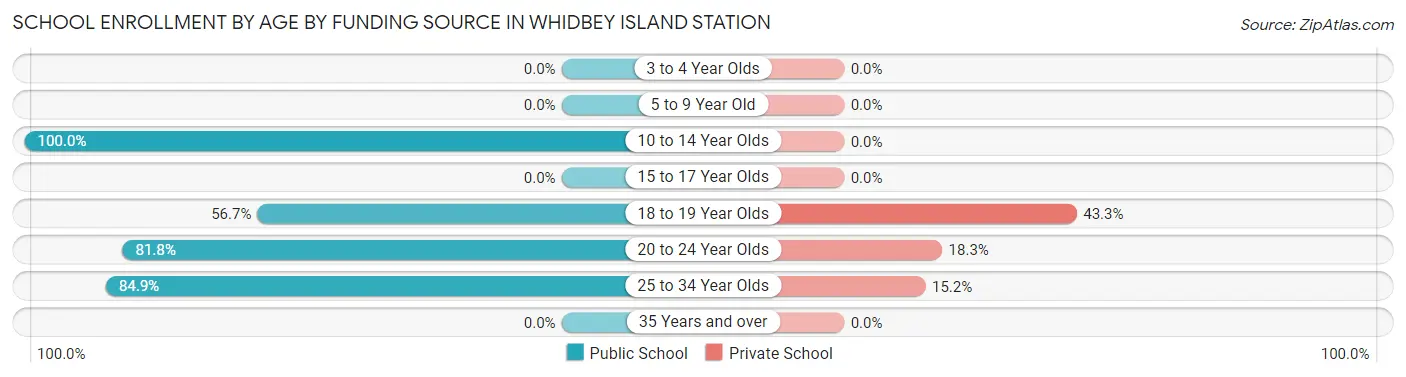
| Age Bracket | Public School | Private School |
| 3 to 4 Year Olds | 0 (0.0%) | 0 (0.0%) |
| 5 to 9 Year Old | 0 (0.0%) | 0 (0.0%) |
| 10 to 14 Year Olds | 4 (100.0%) | 0 (0.0%) |
| 15 to 17 Year Olds | 0 (0.0%) | 0 (0.0%) |
| 18 to 19 Year Olds | 17 (56.7%) | 13 (43.3%) |
| 20 to 24 Year Olds | 215 (81.8%) | 48 (18.2%) |
| 25 to 34 Year Olds | 28 (84.9%) | 5 (15.1%) |
| 35 Years and over | 0 (0.0%) | 0 (0.0%) |
| Total | 264 (80.0%) | 66 (20.0%) |
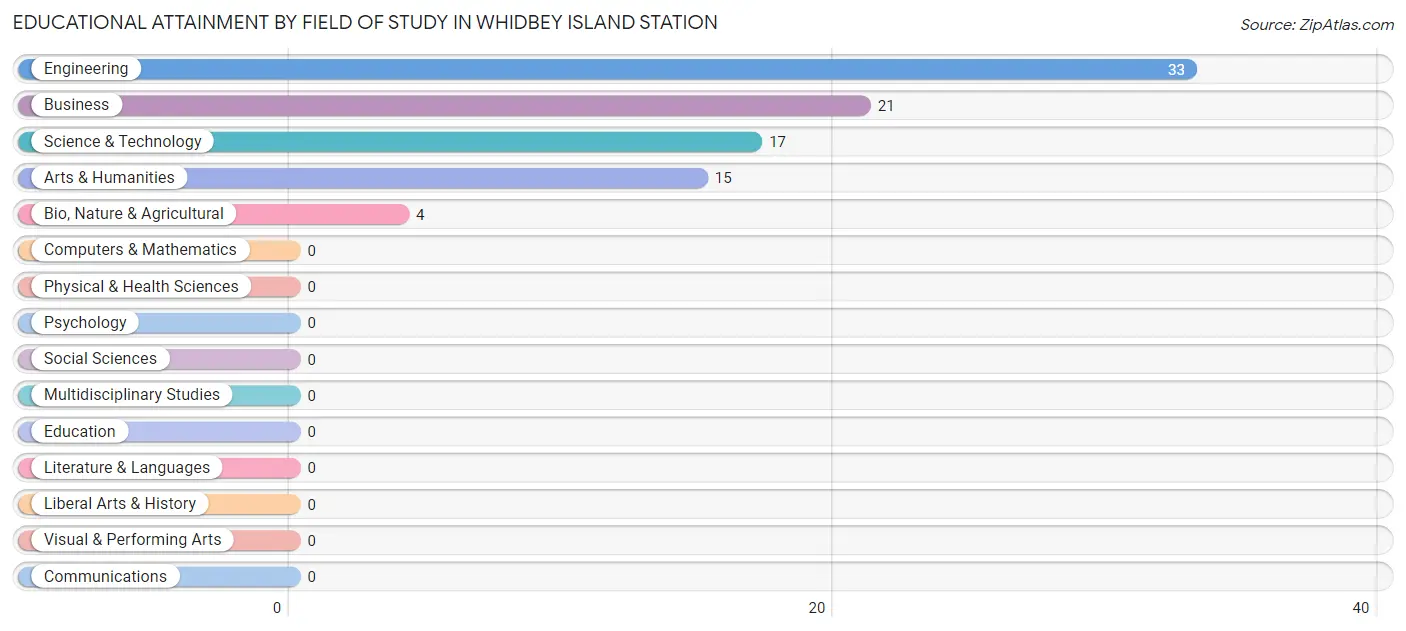
Educational Attainment by Field of Study in Whidbey Island Station
Engineering (33 | 36.7%), business (21 | 23.3%), science & technology (17 | 18.9%), arts & humanities (15 | 16.7%), and bio, nature & agricultural (4 | 4.4%) are the most common fields of study among 90 individuals in Whidbey Island Station who have obtained a bachelor's degree or higher.
| Field of Study | # Graduates | % Graduates |
| Computers & Mathematics | 0 | 0.0% |
| Bio, Nature & Agricultural | 4 | 4.4% |
| Physical & Health Sciences | 0 | 0.0% |
| Psychology | 0 | 0.0% |
| Social Sciences | 0 | 0.0% |
| Engineering | 33 | 36.7% |
| Multidisciplinary Studies | 0 | 0.0% |
| Science & Technology | 17 | 18.9% |
| Business | 21 | 23.3% |
| Education | 0 | 0.0% |
| Literature & Languages | 0 | 0.0% |
| Liberal Arts & History | 0 | 0.0% |
| Visual & Performing Arts | 0 | 0.0% |
| Communications | 0 | 0.0% |
| Arts & Humanities | 15 | 16.7% |
| Total | 90 | 100.0% |
Transportation & Commute in Whidbey Island Station
Vehicle Availability by Sex in Whidbey Island Station
The most prevalent vehicle ownership categories in Whidbey Island Station are males with 2 vehicles (29, accounting for 54.7%) and females with 2 vehicles (17, making up 90.6%).
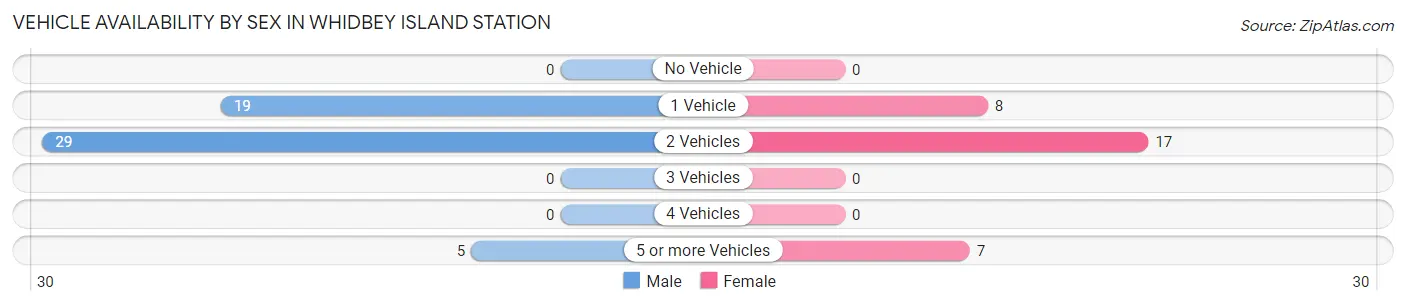
| Vehicles Available | Male | Female |
| No Vehicle | 0 (0.0%) | 0 (0.0%) |
| 1 Vehicle | 19 (35.8%) | 8 (25.0%) |
| 2 Vehicles | 29 (54.7%) | 17 (53.1%) |
| 3 Vehicles | 0 (0.0%) | 0 (0.0%) |
| 4 Vehicles | 0 (0.0%) | 0 (0.0%) |
| 5 or more Vehicles | 5 (9.4%) | 7 (21.9%) |
| Total | 53 (100.0%) | 32 (100.0%) |
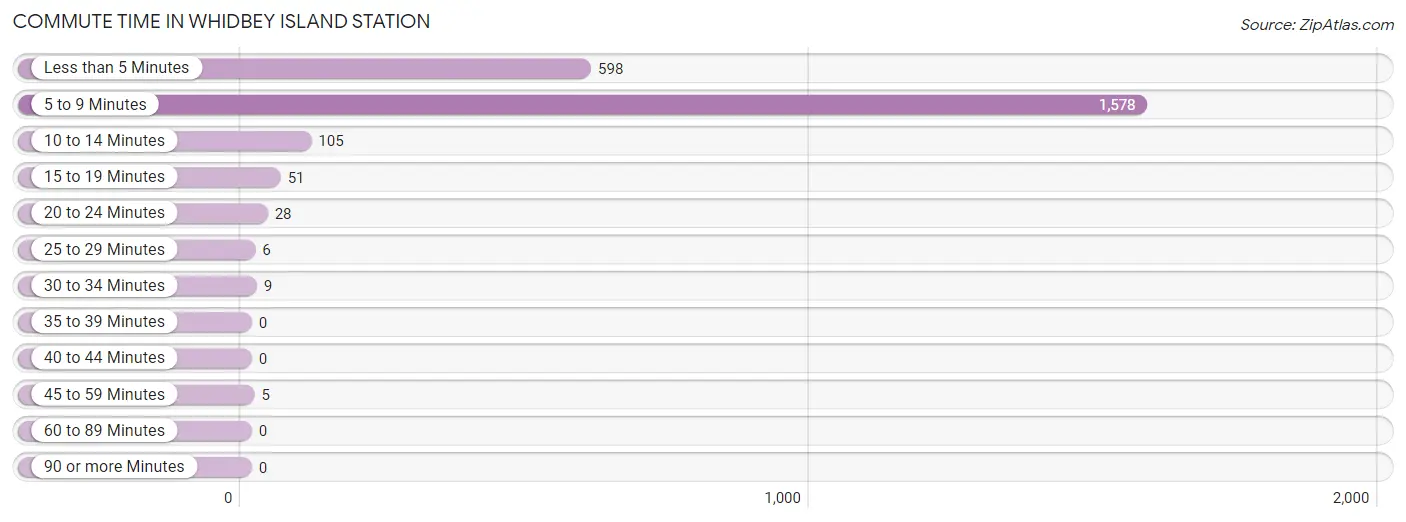
Commute Time in Whidbey Island Station
The most frequently occuring commute durations in Whidbey Island Station are 5 to 9 minutes (1,578 commuters, 66.3%), less than 5 minutes (598 commuters, 25.1%), and 10 to 14 minutes (105 commuters, 4.4%).
| Commute Time | # Commuters | % Commuters |
| Less than 5 Minutes | 598 | 25.1% |
| 5 to 9 Minutes | 1,578 | 66.3% |
| 10 to 14 Minutes | 105 | 4.4% |
| 15 to 19 Minutes | 51 | 2.1% |
| 20 to 24 Minutes | 28 | 1.2% |
| 25 to 29 Minutes | 6 | 0.3% |
| 30 to 34 Minutes | 9 | 0.4% |
| 35 to 39 Minutes | 0 | 0.0% |
| 40 to 44 Minutes | 0 | 0.0% |
| 45 to 59 Minutes | 5 | 0.2% |
| 60 to 89 Minutes | 0 | 0.0% |
| 90 or more Minutes | 0 | 0.0% |
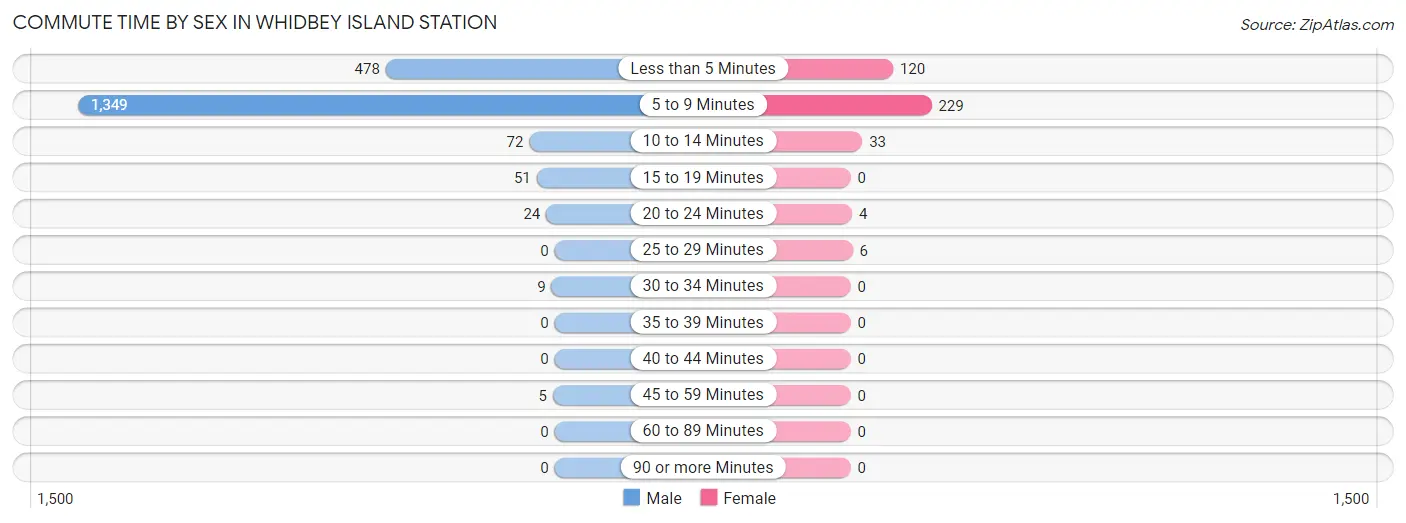
Commute Time by Sex in Whidbey Island Station
The most common commute times in Whidbey Island Station are 5 to 9 minutes (1,349 commuters, 67.9%) for males and 5 to 9 minutes (229 commuters, 58.4%) for females.
| Commute Time | Male | Female |
| Less than 5 Minutes | 478 (24.0%) | 120 (30.6%) |
| 5 to 9 Minutes | 1,349 (67.9%) | 229 (58.4%) |
| 10 to 14 Minutes | 72 (3.6%) | 33 (8.4%) |
| 15 to 19 Minutes | 51 (2.6%) | 0 (0.0%) |
| 20 to 24 Minutes | 24 (1.2%) | 4 (1.0%) |
| 25 to 29 Minutes | 0 (0.0%) | 6 (1.5%) |
| 30 to 34 Minutes | 9 (0.4%) | 0 (0.0%) |
| 35 to 39 Minutes | 0 (0.0%) | 0 (0.0%) |
| 40 to 44 Minutes | 0 (0.0%) | 0 (0.0%) |
| 45 to 59 Minutes | 5 (0.3%) | 0 (0.0%) |
| 60 to 89 Minutes | 0 (0.0%) | 0 (0.0%) |
| 90 or more Minutes | 0 (0.0%) | 0 (0.0%) |
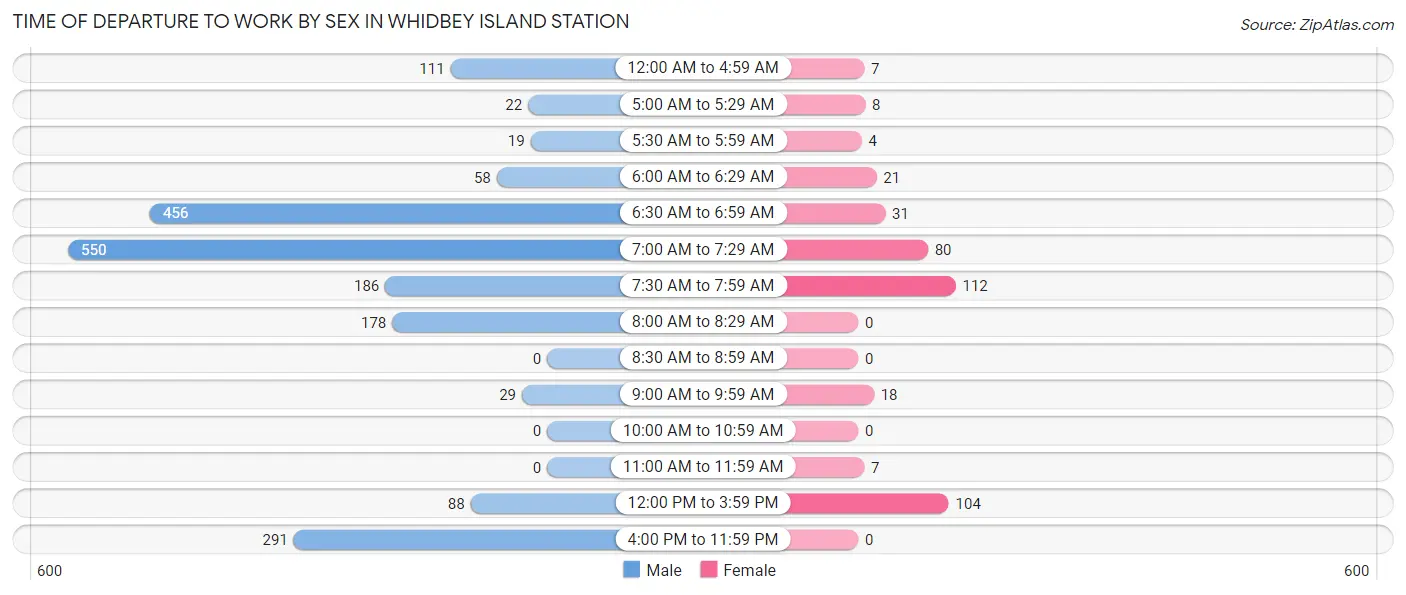
Time of Departure to Work by Sex in Whidbey Island Station
The most frequent times of departure to work in Whidbey Island Station are 7:00 AM to 7:29 AM (550, 27.7%) for males and 7:30 AM to 7:59 AM (112, 28.6%) for females.
| Time of Departure | Male | Female |
| 12:00 AM to 4:59 AM | 111 (5.6%) | 7 (1.8%) |
| 5:00 AM to 5:29 AM | 22 (1.1%) | 8 (2.0%) |
| 5:30 AM to 5:59 AM | 19 (1.0%) | 4 (1.0%) |
| 6:00 AM to 6:29 AM | 58 (2.9%) | 21 (5.4%) |
| 6:30 AM to 6:59 AM | 456 (22.9%) | 31 (7.9%) |
| 7:00 AM to 7:29 AM | 550 (27.7%) | 80 (20.4%) |
| 7:30 AM to 7:59 AM | 186 (9.4%) | 112 (28.6%) |
| 8:00 AM to 8:29 AM | 178 (8.9%) | 0 (0.0%) |
| 8:30 AM to 8:59 AM | 0 (0.0%) | 0 (0.0%) |
| 9:00 AM to 9:59 AM | 29 (1.5%) | 18 (4.6%) |
| 10:00 AM to 10:59 AM | 0 (0.0%) | 0 (0.0%) |
| 11:00 AM to 11:59 AM | 0 (0.0%) | 7 (1.8%) |
| 12:00 PM to 3:59 PM | 88 (4.4%) | 104 (26.5%) |
| 4:00 PM to 11:59 PM | 291 (14.6%) | 0 (0.0%) |
| Total | 1,988 (100.0%) | 392 (100.0%) |
Housing Occupancy in Whidbey Island Station
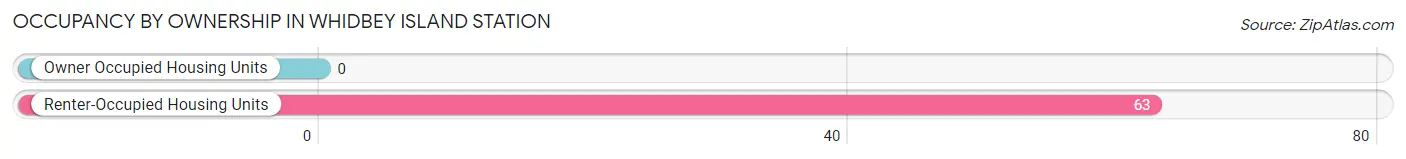
Occupancy by Ownership in Whidbey Island Station
Of the total 63 dwellings in Whidbey Island Station, owner-occupied units account for 0 (0.0%), while renter-occupied units make up 63 (100.0%).
| Occupancy | # Housing Units | % Housing Units |
| Owner Occupied Housing Units | 0 | 0.0% |
| Renter-Occupied Housing Units | 63 | 100.0% |
| Total Occupied Housing Units | 63 | 100.0% |
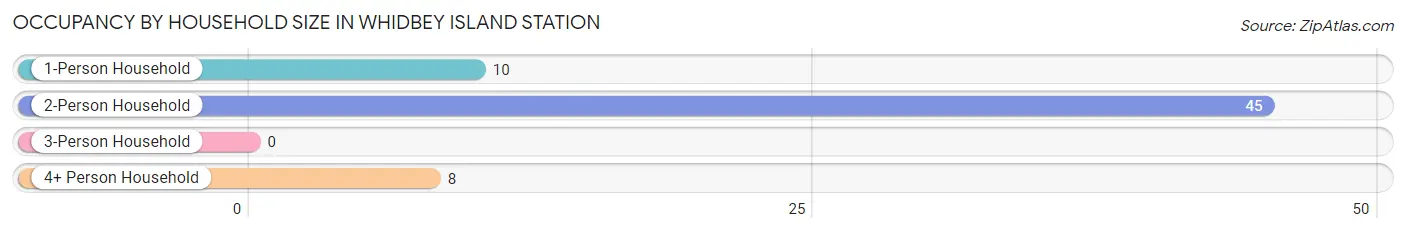
Occupancy by Household Size in Whidbey Island Station
| Household Size | # Housing Units | % Housing Units |
| 1-Person Household | 10 | 15.9% |
| 2-Person Household | 45 | 71.4% |
| 3-Person Household | 0 | 0.0% |
| 4+ Person Household | 8 | 12.7% |
| Total Housing Units | 63 | 100.0% |
Occupancy by Ownership by Household Size in Whidbey Island Station
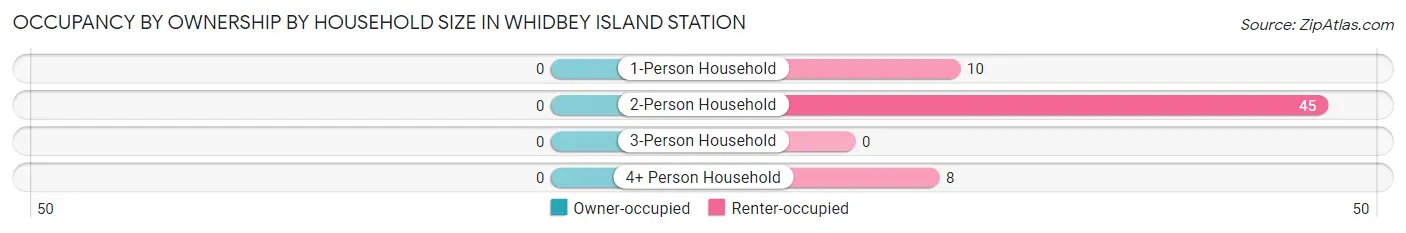
| Household Size | Owner-occupied | Renter-occupied |
| 1-Person Household | 0 (0.0%) | 10 (100.0%) |
| 2-Person Household | 0 (0.0%) | 45 (100.0%) |
| 3-Person Household | 0 (0.0%) | 0 (0.0%) |
| 4+ Person Household | 0 (0.0%) | 8 (100.0%) |
| Total Housing Units | 0 (0.0%) | 63 (100.0%) |
Occupancy by Educational Attainment in Whidbey Island Station
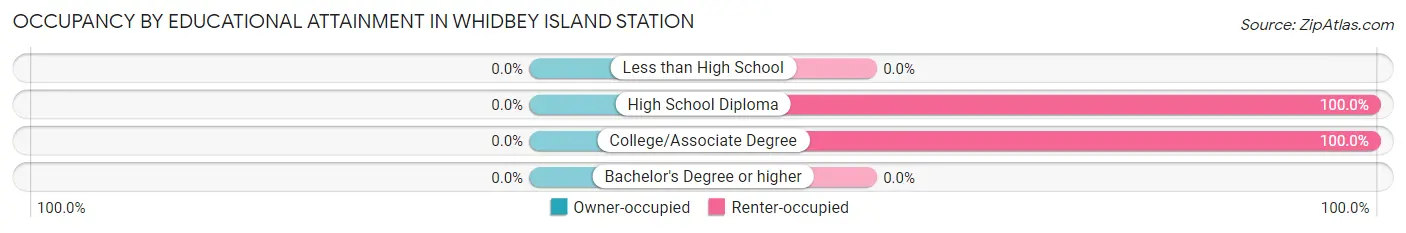
| Household Size | Owner-occupied | Renter-occupied |
| Less than High School | 0 (0.0%) | 0 (0.0%) |
| High School Diploma | 0 (0.0%) | 32 (100.0%) |
| College/Associate Degree | 0 (0.0%) | 31 (100.0%) |
| Bachelor's Degree or higher | 0 (0.0%) | 0 (0.0%) |
Occupancy by Age of Householder in Whidbey Island Station
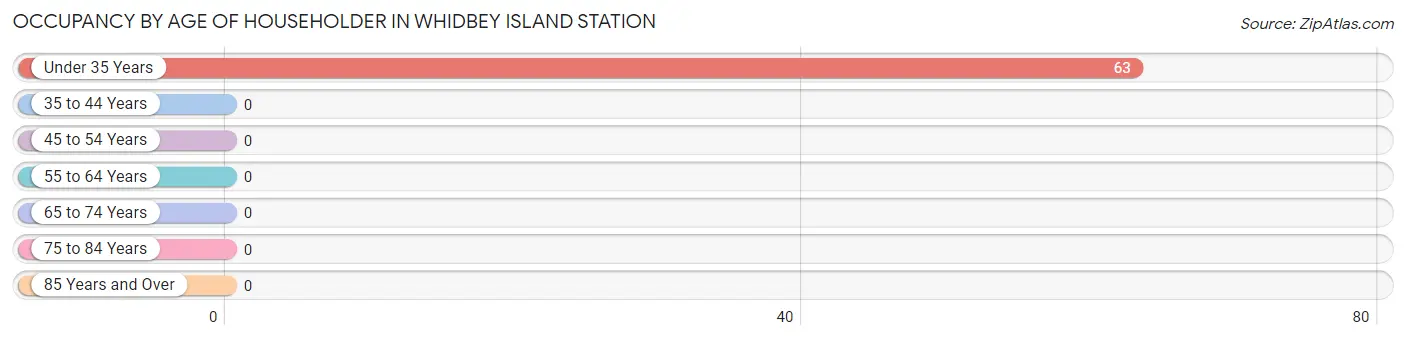
| Age Bracket | # Households | % Households |
| Under 35 Years | 63 | 100.0% |
| 35 to 44 Years | 0 | 0.0% |
| 45 to 54 Years | 0 | 0.0% |
| 55 to 64 Years | 0 | 0.0% |
| 65 to 74 Years | 0 | 0.0% |
| 75 to 84 Years | 0 | 0.0% |
| 85 Years and Over | 0 | 0.0% |
| Total | 63 | 100.0% |
Housing Finances in Whidbey Island Station
Median Income by Occupancy in Whidbey Island Station
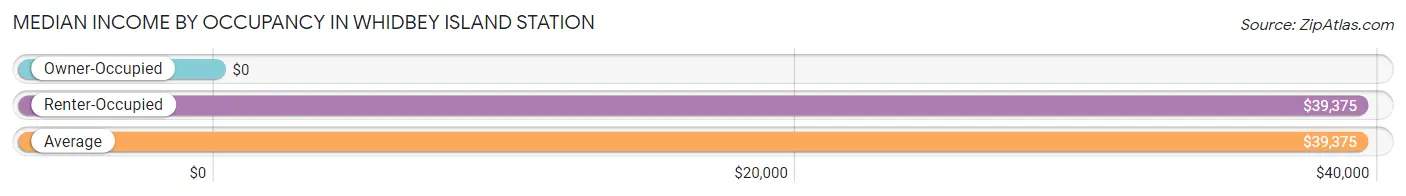
| Occupancy Type | # Households | Median Income |
| Owner-Occupied | 0 (0.0%) | $0 |
| Renter-Occupied | 63 (100.0%) | $39,375 |
| Average | 63 (100.0%) | $39,375 |
Occupancy by Householder Income Bracket in Whidbey Island Station
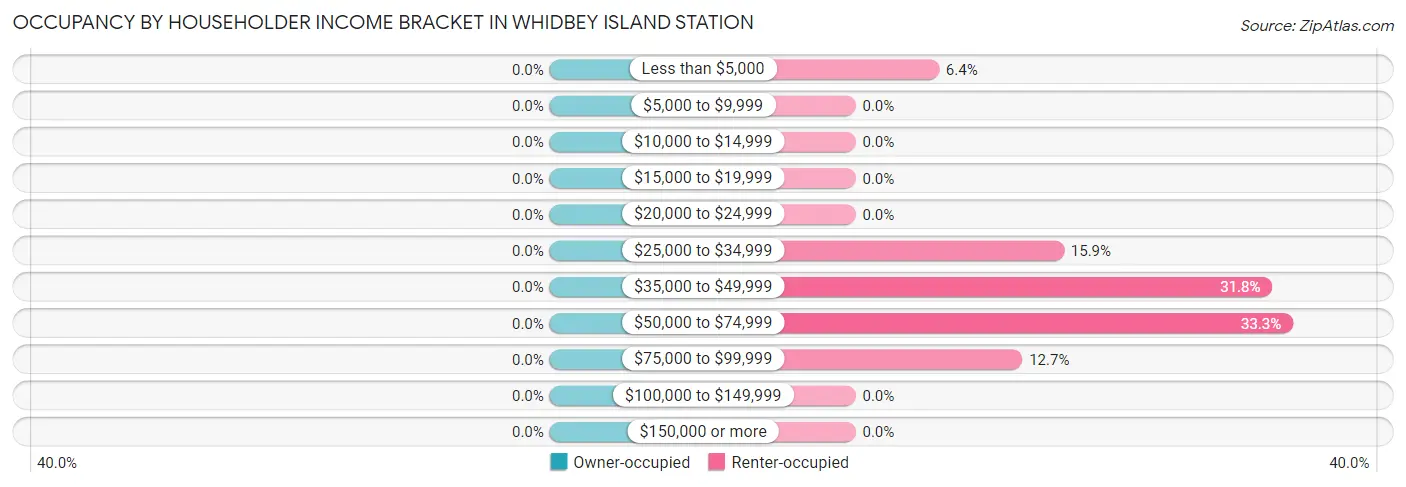
| Income Bracket | Owner-occupied | Renter-occupied |
| Less than $5,000 | 0 (0.0%) | 4 (6.4%) |
| $5,000 to $9,999 | 0 (0.0%) | 0 (0.0%) |
| $10,000 to $14,999 | 0 (0.0%) | 0 (0.0%) |
| $15,000 to $19,999 | 0 (0.0%) | 0 (0.0%) |
| $20,000 to $24,999 | 0 (0.0%) | 0 (0.0%) |
| $25,000 to $34,999 | 0 (0.0%) | 10 (15.9%) |
| $35,000 to $49,999 | 0 (0.0%) | 20 (31.8%) |
| $50,000 to $74,999 | 0 (0.0%) | 21 (33.3%) |
| $75,000 to $99,999 | 0 (0.0%) | 8 (12.7%) |
| $100,000 to $149,999 | 0 (0.0%) | 0 (0.0%) |
| $150,000 or more | 0 (0.0%) | 0 (0.0%) |
| Total | 0 (0.0%) | 63 (100.0%) |
Monthly Housing Cost Tiers in Whidbey Island Station
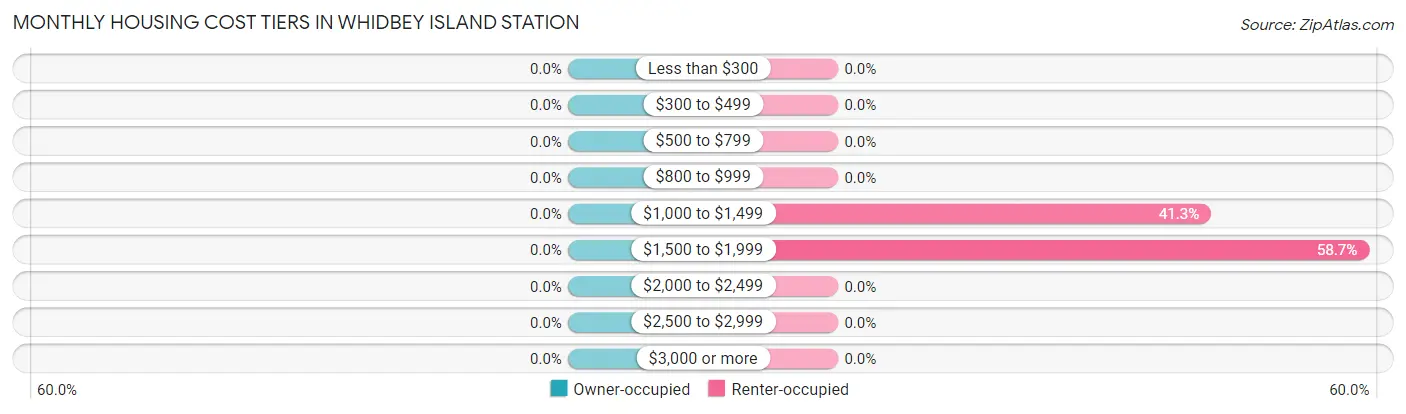
| Monthly Cost | Owner-occupied | Renter-occupied |
| Less than $300 | 0 (0.0%) | 0 (0.0%) |
| $300 to $499 | 0 (0.0%) | 0 (0.0%) |
| $500 to $799 | 0 (0.0%) | 0 (0.0%) |
| $800 to $999 | 0 (0.0%) | 0 (0.0%) |
| $1,000 to $1,499 | 0 (0.0%) | 26 (41.3%) |
| $1,500 to $1,999 | 0 (0.0%) | 37 (58.7%) |
| $2,000 to $2,499 | 0 (0.0%) | 0 (0.0%) |
| $2,500 to $2,999 | 0 (0.0%) | 0 (0.0%) |
| $3,000 or more | 0 (0.0%) | 0 (0.0%) |
| Total | 0 (0.0%) | 63 (100.0%) |
Physical Housing Characteristics in Whidbey Island Station
Housing Structures in Whidbey Island Station
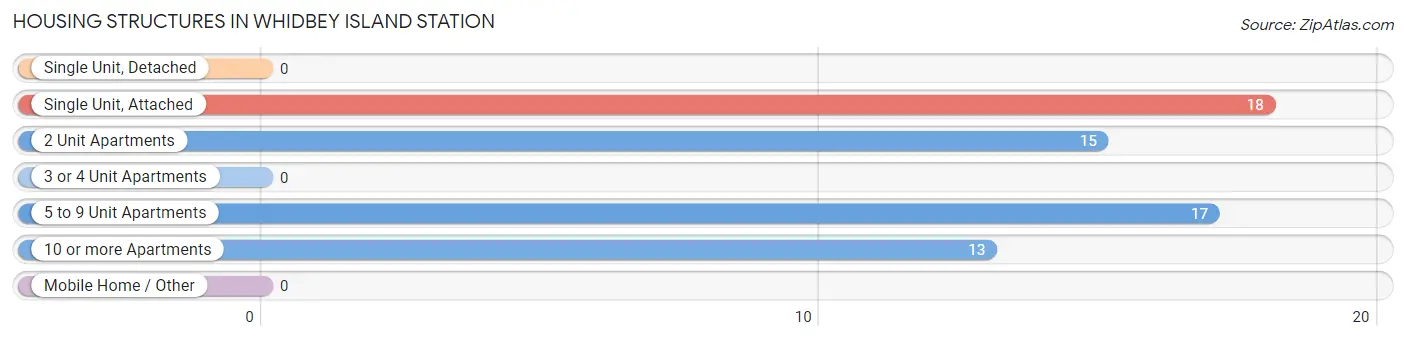
| Structure Type | # Housing Units | % Housing Units |
| Single Unit, Detached | 0 | 0.0% |
| Single Unit, Attached | 18 | 28.6% |
| 2 Unit Apartments | 15 | 23.8% |
| 3 or 4 Unit Apartments | 0 | 0.0% |
| 5 to 9 Unit Apartments | 17 | 27.0% |
| 10 or more Apartments | 13 | 20.6% |
| Mobile Home / Other | 0 | 0.0% |
| Total | 63 | 100.0% |
Housing Structures by Occupancy in Whidbey Island Station
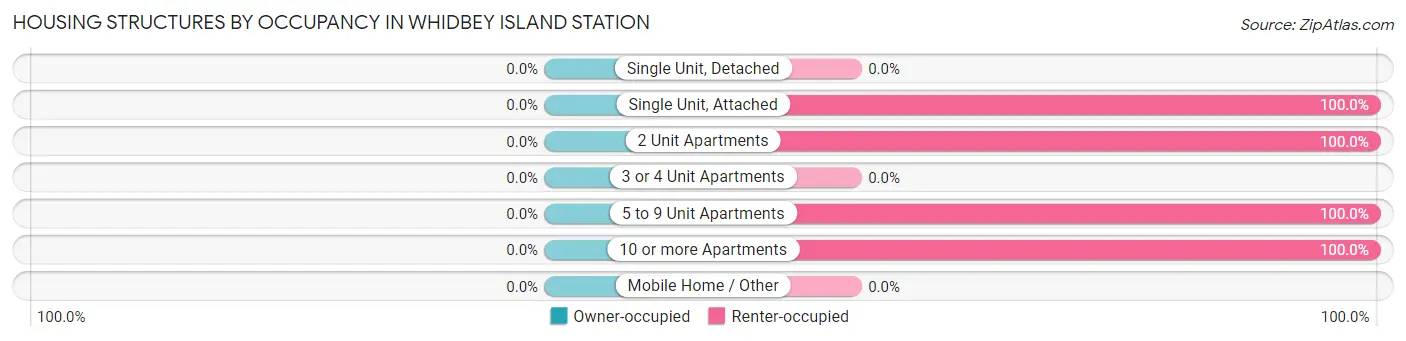
| Structure Type | Owner-occupied | Renter-occupied |
| Single Unit, Detached | 0 (0.0%) | 0 (0.0%) |
| Single Unit, Attached | 0 (0.0%) | 18 (100.0%) |
| 2 Unit Apartments | 0 (0.0%) | 15 (100.0%) |
| 3 or 4 Unit Apartments | 0 (0.0%) | 0 (0.0%) |
| 5 to 9 Unit Apartments | 0 (0.0%) | 17 (100.0%) |
| 10 or more Apartments | 0 (0.0%) | 13 (100.0%) |
| Mobile Home / Other | 0 (0.0%) | 0 (0.0%) |
| Total | 0 (0.0%) | 63 (100.0%) |
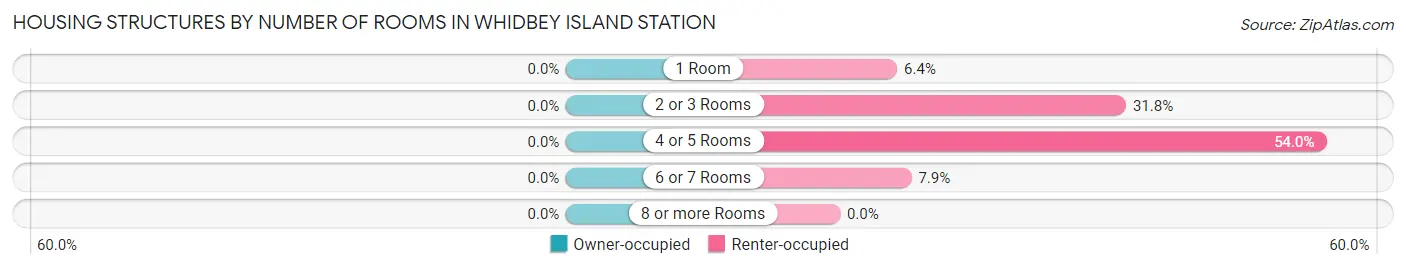
Housing Structures by Number of Rooms in Whidbey Island Station
| Number of Rooms | Owner-occupied | Renter-occupied |
| 1 Room | 0 (0.0%) | 4 (6.4%) |
| 2 or 3 Rooms | 0 (0.0%) | 20 (31.8%) |
| 4 or 5 Rooms | 0 (0.0%) | 34 (54.0%) |
| 6 or 7 Rooms | 0 (0.0%) | 5 (7.9%) |
| 8 or more Rooms | 0 (0.0%) | 0 (0.0%) |
| Total | 0 (0.0%) | 63 (100.0%) |
Housing Structure by Heating Type in Whidbey Island Station
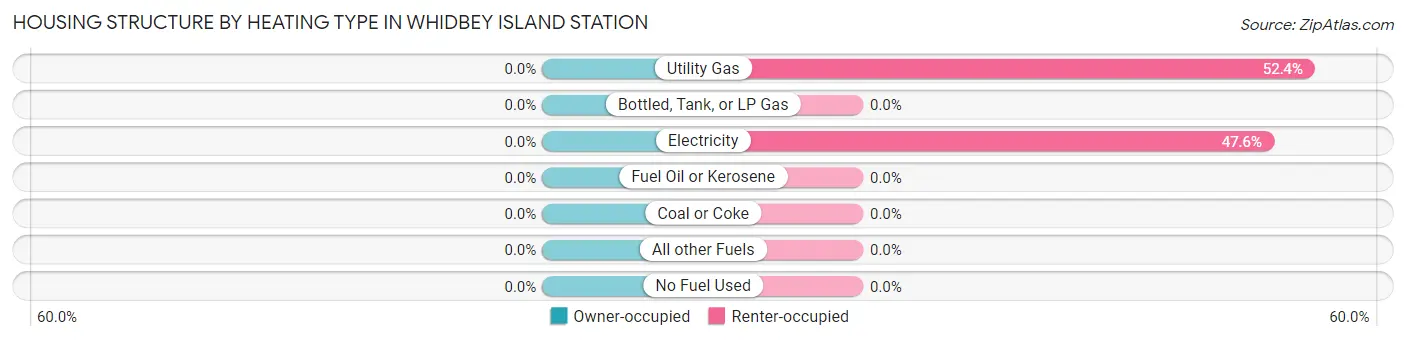
| Heating Type | Owner-occupied | Renter-occupied |
| Utility Gas | 0 (0.0%) | 33 (52.4%) |
| Bottled, Tank, or LP Gas | 0 (0.0%) | 0 (0.0%) |
| Electricity | 0 (0.0%) | 30 (47.6%) |
| Fuel Oil or Kerosene | 0 (0.0%) | 0 (0.0%) |
| Coal or Coke | 0 (0.0%) | 0 (0.0%) |
| All other Fuels | 0 (0.0%) | 0 (0.0%) |
| No Fuel Used | 0 (0.0%) | 0 (0.0%) |
| Total | 0 (0.0%) | 63 (100.0%) |
Household Vehicle Usage in Whidbey Island Station
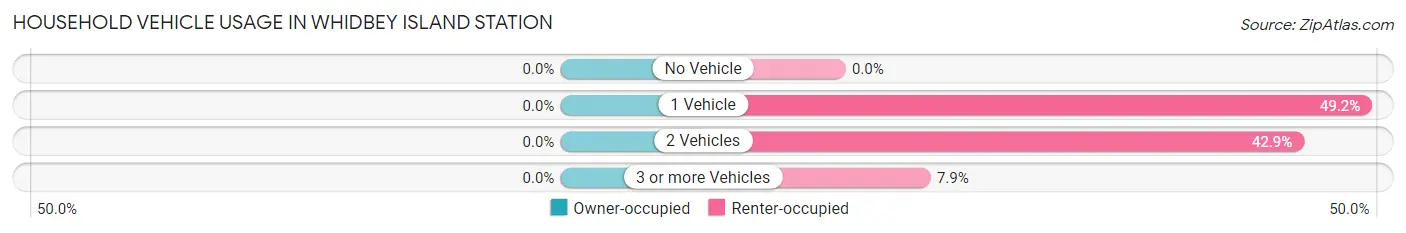
| Vehicles per Household | Owner-occupied | Renter-occupied |
| No Vehicle | 0 (0.0%) | 0 (0.0%) |
| 1 Vehicle | 0 (0.0%) | 31 (49.2%) |
| 2 Vehicles | 0 (0.0%) | 27 (42.9%) |
| 3 or more Vehicles | 0 (0.0%) | 5 (7.9%) |
| Total | 0 (0.0%) | 63 (100.0%) |
Real Estate & Mortgages in Whidbey Island Station
Real Estate and Mortgage Overview in Whidbey Island Station
| Characteristic | Without Mortgage | With Mortgage |
| Housing Units | 0 | 0 |
| Median Property Value | - | - |
| Median Household Income | - | - |
| Monthly Housing Costs | - | - |
| Real Estate Taxes | - | - |
Property Value by Mortgage Status in Whidbey Island Station
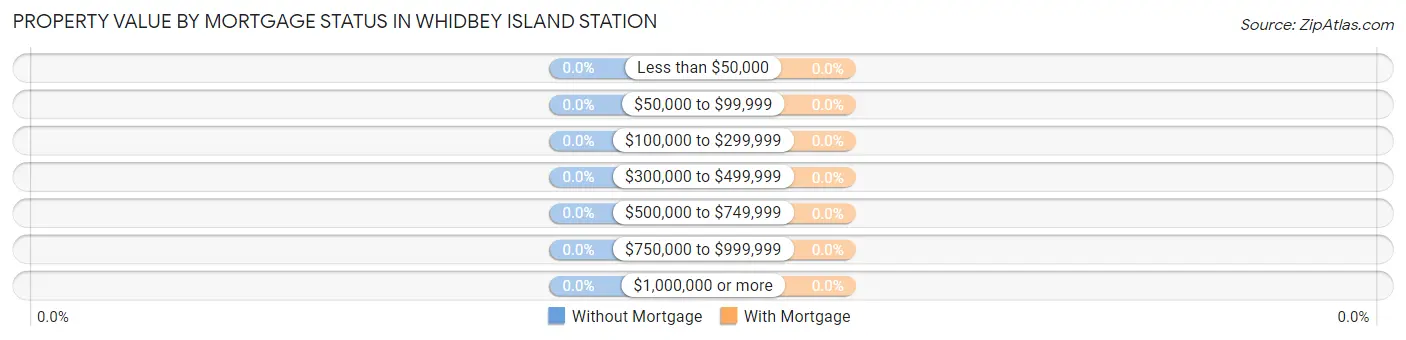
| Property Value | Without Mortgage | With Mortgage |
| Less than $50,000 | 0 (0.0%) | 0 (0.0%) |
| $50,000 to $99,999 | 0 (0.0%) | 0 (0.0%) |
| $100,000 to $299,999 | 0 (0.0%) | 0 (0.0%) |
| $300,000 to $499,999 | 0 (0.0%) | 0 (0.0%) |
| $500,000 to $749,999 | 0 (0.0%) | 0 (0.0%) |
| $750,000 to $999,999 | 0 (0.0%) | 0 (0.0%) |
| $1,000,000 or more | 0 (0.0%) | 0 (0.0%) |
| Total | 0 (0.0%) | 0 (0.0%) |
Household Income by Mortgage Status in Whidbey Island Station
| Household Income | Without Mortgage | With Mortgage |
| Less than $10,000 | 0 (0.0%) | 0 (0.0%) |
| $10,000 to $24,999 | 0 (0.0%) | 0 (0.0%) |
| $25,000 to $34,999 | 0 (0.0%) | 0 (0.0%) |
| $35,000 to $49,999 | 0 (0.0%) | 0 (0.0%) |
| $50,000 to $74,999 | 0 (0.0%) | 0 (0.0%) |
| $75,000 to $99,999 | 0 (0.0%) | 0 (0.0%) |
| $100,000 to $149,999 | 0 (0.0%) | 0 (0.0%) |
| $150,000 or more | 0 (0.0%) | 0 (0.0%) |
| Total | 0 (0.0%) | 0 (0.0%) |
Property Value to Household Income Ratio in Whidbey Island Station
| Value-to-Income Ratio | Without Mortgage | With Mortgage |
| Less than 2.0x | 0 (0.0%) | 0 (0.0%) |
| 2.0x to 2.9x | 0 (0.0%) | 0 (0.0%) |
| 3.0x to 3.9x | 0 (0.0%) | 0 (0.0%) |
| 4.0x or more | 0 (0.0%) | 0 (0.0%) |
| Total | 0 (0.0%) | 0 (0.0%) |
Real Estate Taxes by Mortgage Status in Whidbey Island Station
| Property Taxes | Without Mortgage | With Mortgage |
| Less than $800 | 0 (0.0%) | 0 (0.0%) |
| $800 to $1,499 | 0 (0.0%) | 0 (0.0%) |
| $800 to $1,499 | 0 (0.0%) | 0 (0.0%) |
| Total | 0 (0.0%) | 0 (0.0%) |
Health & Disability in Whidbey Island Station
Health Insurance Coverage by Age in Whidbey Island Station
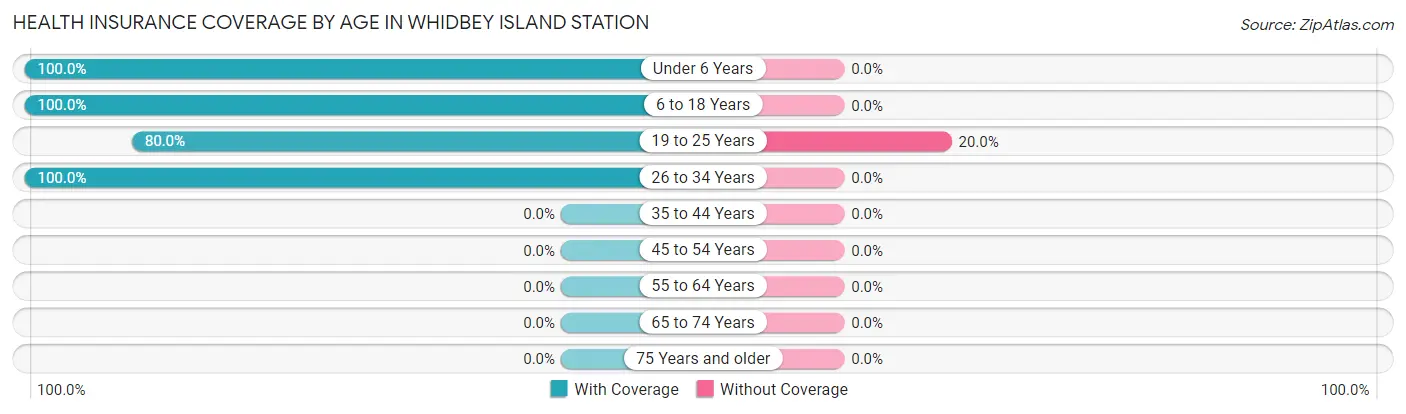
| Age Bracket | With Coverage | Without Coverage |
| Under 6 Years | 14 (100.0%) | 0 (0.0%) |
| 6 to 18 Years | 11 (100.0%) | 0 (0.0%) |
| 19 to 25 Years | 24 (80.0%) | 6 (20.0%) |
| 26 to 34 Years | 32 (100.0%) | 0 (0.0%) |
| 35 to 44 Years | 0 (0.0%) | 0 (0.0%) |
| 45 to 54 Years | 0 (0.0%) | 0 (0.0%) |
| 55 to 64 Years | 0 (0.0%) | 0 (0.0%) |
| 65 to 74 Years | 0 (0.0%) | 0 (0.0%) |
| 75 Years and older | 0 (0.0%) | 0 (0.0%) |
| Total | 81 (93.1%) | 6 (6.9%) |
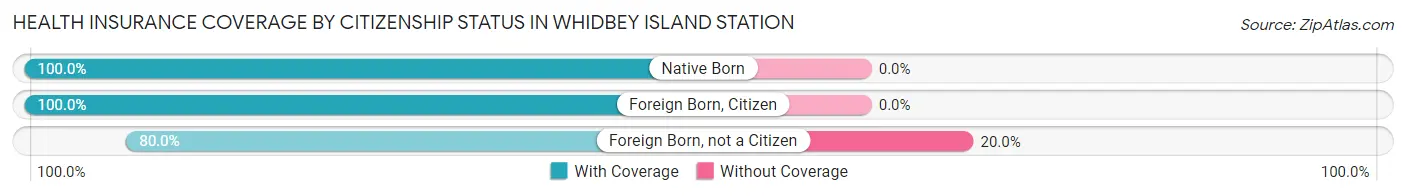
Health Insurance Coverage by Citizenship Status in Whidbey Island Station
| Citizenship Status | With Coverage | Without Coverage |
| Native Born | 14 (100.0%) | 0 (0.0%) |
| Foreign Born, Citizen | 11 (100.0%) | 0 (0.0%) |
| Foreign Born, not a Citizen | 24 (80.0%) | 6 (20.0%) |
Health Insurance Coverage by Household Income in Whidbey Island Station

| Household Income | With Coverage | Without Coverage |
| Under $25,000 | 7 (100.0%) | 0 (0.0%) |
| $25,000 to $49,999 | 35 (100.0%) | 0 (0.0%) |
| $50,000 to $74,999 | 24 (80.0%) | 6 (20.0%) |
| $75,000 to $99,999 | 15 (100.0%) | 0 (0.0%) |
| $100,000 and over | 0 (0.0%) | 0 (0.0%) |
Public vs Private Health Insurance Coverage by Age in Whidbey Island Station

| Age Bracket | Public Insurance | Private Insurance |
| Under 6 | 0 (0.0%) | 14 (100.0%) |
| 6 to 18 Years | 0 (0.0%) | 11 (100.0%) |
| 19 to 25 Years | 4 (13.3%) | 20 (66.7%) |
| 25 to 34 Years | 0 (0.0%) | 32 (100.0%) |
| 35 to 44 Years | 0 (0.0%) | 0 (0.0%) |
| 45 to 54 Years | 0 (0.0%) | 0 (0.0%) |
| 55 to 64 Years | 0 (0.0%) | 0 (0.0%) |
| 65 to 74 Years | 0 (0.0%) | 0 (0.0%) |
| 75 Years and over | 0 (0.0%) | 0 (0.0%) |
| Total | 4 (4.6%) | 77 (88.5%) |
Disability Status by Sex by Age in Whidbey Island Station
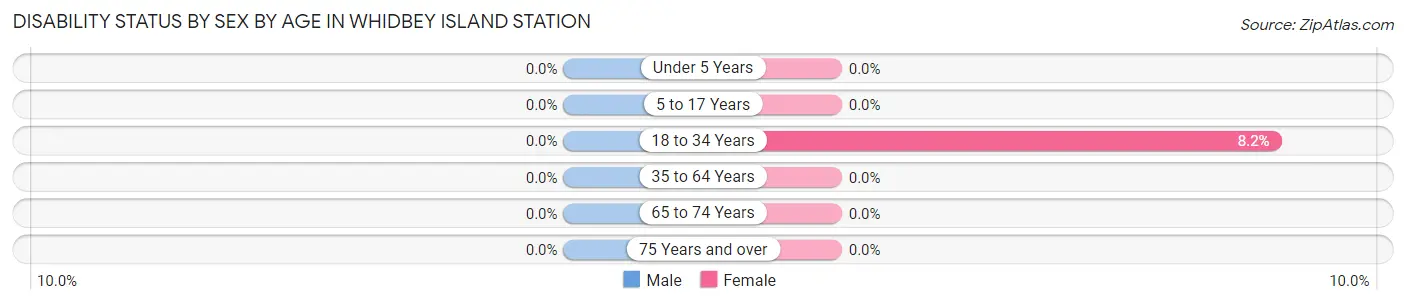
| Age Bracket | Male | Female |
| Under 5 Years | 0 (0.0%) | 0 (0.0%) |
| 5 to 17 Years | 0 (0.0%) | 0 (0.0%) |
| 18 to 34 Years | 0 (0.0%) | 4 (8.2%) |
| 35 to 64 Years | 0 (0.0%) | 0 (0.0%) |
| 65 to 74 Years | 0 (0.0%) | 0 (0.0%) |
| 75 Years and over | 0 (0.0%) | 0 (0.0%) |
Disability Class by Sex by Age in Whidbey Island Station
Disability Class: Hearing Difficulty
| Age Bracket | Male | Female |
| Under 5 Years | 0 (0.0%) | 0 (0.0%) |
| 5 to 17 Years | 0 (0.0%) | 0 (0.0%) |
| 18 to 34 Years | 0 (0.0%) | 0 (0.0%) |
| 35 to 64 Years | 0 (0.0%) | 0 (0.0%) |
| 65 to 74 Years | 0 (0.0%) | 0 (0.0%) |
| 75 Years and over | 0 (0.0%) | 0 (0.0%) |
Disability Class: Vision Difficulty
| Age Bracket | Male | Female |
| Under 5 Years | 0 (0.0%) | 0 (0.0%) |
| 5 to 17 Years | 0 (0.0%) | 0 (0.0%) |
| 18 to 34 Years | 0 (0.0%) | 0 (0.0%) |
| 35 to 64 Years | 0 (0.0%) | 0 (0.0%) |
| 65 to 74 Years | 0 (0.0%) | 0 (0.0%) |
| 75 Years and over | 0 (0.0%) | 0 (0.0%) |
Disability Class: Cognitive Difficulty
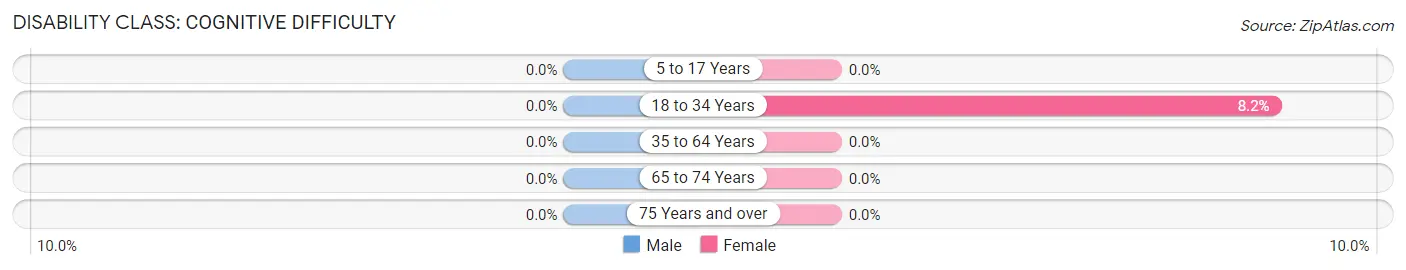
| Age Bracket | Male | Female |
| 5 to 17 Years | 0 (0.0%) | 0 (0.0%) |
| 18 to 34 Years | 0 (0.0%) | 4 (8.2%) |
| 35 to 64 Years | 0 (0.0%) | 0 (0.0%) |
| 65 to 74 Years | 0 (0.0%) | 0 (0.0%) |
| 75 Years and over | 0 (0.0%) | 0 (0.0%) |
Disability Class: Ambulatory Difficulty
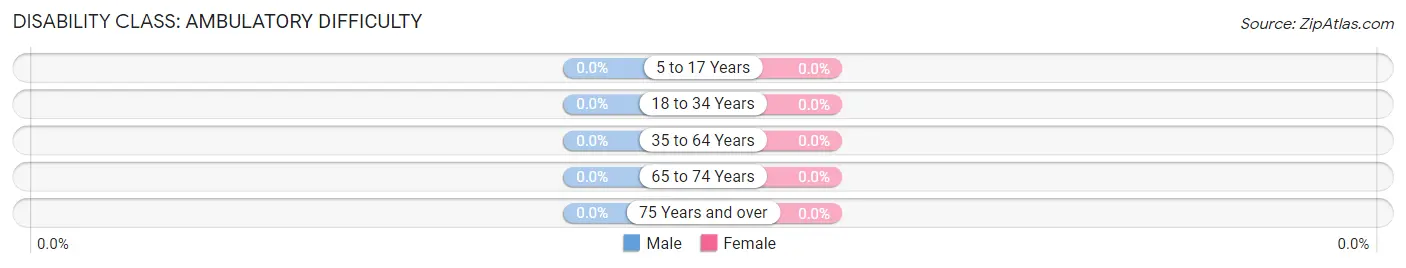
| Age Bracket | Male | Female |
| 5 to 17 Years | 0 (0.0%) | 0 (0.0%) |
| 18 to 34 Years | 0 (0.0%) | 0 (0.0%) |
| 35 to 64 Years | 0 (0.0%) | 0 (0.0%) |
| 65 to 74 Years | 0 (0.0%) | 0 (0.0%) |
| 75 Years and over | 0 (0.0%) | 0 (0.0%) |
Disability Class: Self-Care Difficulty
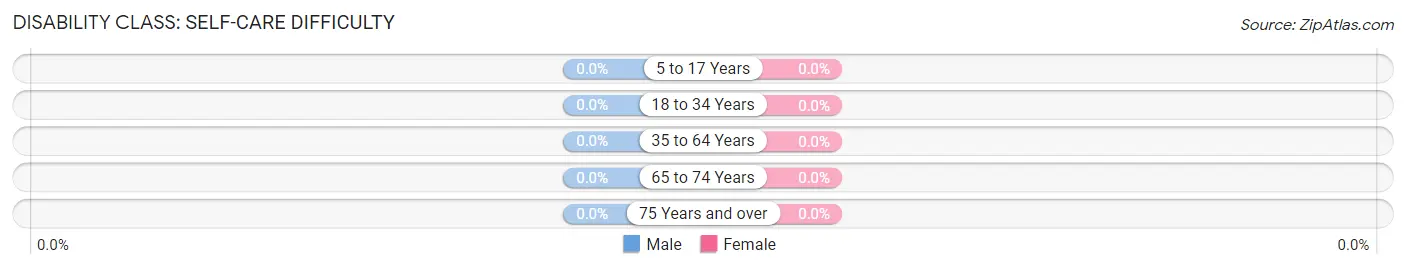
| Age Bracket | Male | Female |
| 5 to 17 Years | 0 (0.0%) | 0 (0.0%) |
| 18 to 34 Years | 0 (0.0%) | 0 (0.0%) |
| 35 to 64 Years | 0 (0.0%) | 0 (0.0%) |
| 65 to 74 Years | 0 (0.0%) | 0 (0.0%) |
| 75 Years and over | 0 (0.0%) | 0 (0.0%) |
Technology Access in Whidbey Island Station
Computing Device Access in Whidbey Island Station
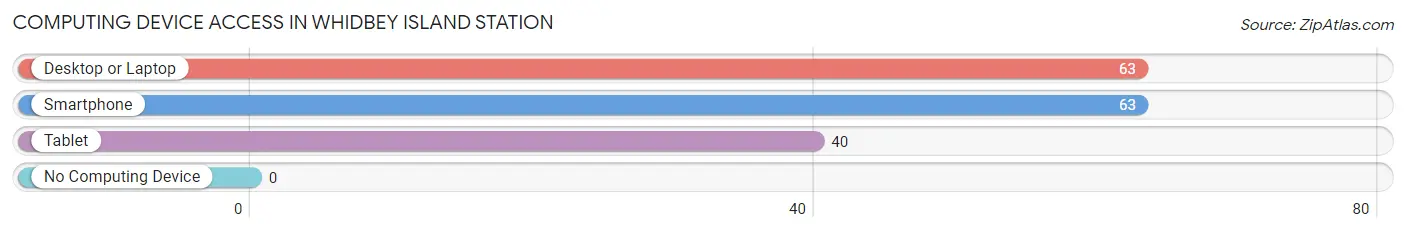
| Device Type | # Households | % Households |
| Desktop or Laptop | 63 | 100.0% |
| Smartphone | 63 | 100.0% |
| Tablet | 40 | 63.5% |
| No Computing Device | 0 | 0.0% |
| Total | 63 | 100.0% |
Internet Access in Whidbey Island Station
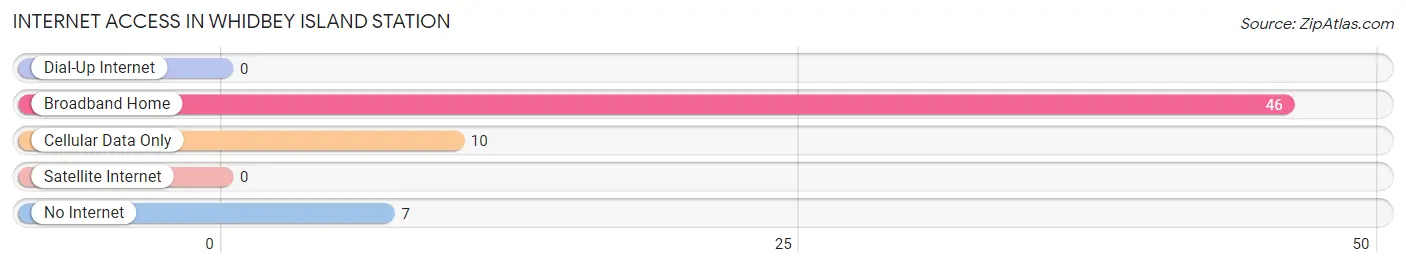
| Internet Type | # Households | % Households |
| Dial-Up Internet | 0 | 0.0% |
| Broadband Home | 46 | 73.0% |
| Cellular Data Only | 10 | 15.9% |
| Satellite Internet | 0 | 0.0% |
| No Internet | 7 | 11.1% |
| Total | 63 | 100.0% |
Whidbey Island Station Summary
Whidbey Island Station, WA is a small unincorporated community located on the northern tip of Whidbey Island in Island County, Washington. It is situated on the east side of the island, just south of the city of Oak Harbor. The population of Whidbey Island Station was estimated to be around 1,000 in 2020.
History
Whidbey Island Station was first settled in the late 1800s by a group of settlers from the nearby town of Coupeville. The settlers were attracted to the area due to its abundance of natural resources, including timber, fish, and game. The settlers built a small community and named it Whidbey Island Station.
The community grew slowly over the years, and by the early 1900s, it had become a popular destination for tourists and vacationers. The town was home to a number of businesses, including a general store, a post office, a hotel, and a ferry service.
In the 1950s, the town began to decline as the timber industry declined and the population began to move away. In the 1970s, the town was revitalized by the construction of a new marina and the development of a tourist industry.
Geography
Whidbey Island Station is located on the northern tip of Whidbey Island in Island County, Washington. It is situated on the east side of the island, just south of the city of Oak Harbor. The town is surrounded by the waters of Penn Cove, Saratoga Passage, and Admiralty Inlet.
The town is located in a temperate rainforest climate, with mild temperatures and abundant rainfall. The average annual temperature is around 50 degrees Fahrenheit, and the average annual rainfall is around 40 inches.
Economy
Whidbey Island Station is primarily a tourist destination, with a number of businesses catering to visitors. The town is home to a number of restaurants, shops, and galleries, as well as a marina and a ferry service.
The town is also home to a number of small businesses, including a general store, a post office, and a hotel. The town is also home to a number of recreational activities, including fishing, boating, and hiking.
Demographics
The population of Whidbey Island Station was estimated to be around 1,000 in 2020. The town is predominantly white, with a small percentage of African American, Asian, and Hispanic residents. The median household income is around $50,000, and the median home value is around $400,000. The town has a low unemployment rate, and the majority of residents are employed in the tourism and service industries.
Common Questions
What is the Total Population of Whidbey Island Station?
Total Population of Whidbey Island Station is 2,482.
What is the Total Male Population of Whidbey Island Station?
Total Male Population of Whidbey Island Station is 2,053.
What is the Total Female Population of Whidbey Island Station?
Total Female Population of Whidbey Island Station is 429.
What is the Ratio of Males per 100 Females in Whidbey Island Station?
There are 478.55 Males per 100 Females in Whidbey Island Station.
What is the Ratio of Females per 100 Males in Whidbey Island Station?
There are 20.90 Females per 100 Males in Whidbey Island Station.
What is the Median Population Age in Whidbey Island Station?
Median Population Age in Whidbey Island Station is 22.2 Years.
What is the Average Family Size in Whidbey Island Station
Average Family Size in Whidbey Island Station is 2.3 People.
What is the Average Household Size in Whidbey Island Station
Average Household Size in Whidbey Island Station is 2.1 People.
What is Per Capita Income in Whidbey Island Station?
Per Capita income in Whidbey Island Station is $27,228.
What is the Median Family Income in Whidbey Island Station?
Median Family Income in Whidbey Island Station is $55,179.
What is the Median Household income in Whidbey Island Station?
Median Household Income in Whidbey Island Station is $39,375.
What is Income or Wage Gap in Whidbey Island Station?
Income or Wage Gap in Whidbey Island Station is 5.3%.
Women in Whidbey Island Station earn 94.7 cents for every dollar earned by a man.
What is Inequality or Gini Index in Whidbey Island Station?
Inequality or Gini Index in Whidbey Island Station is 0.24.
How Large is the Labor Force in Whidbey Island Station?
There are 2,405 People in the Labor Forcein in Whidbey Island Station.
What is the Percentage of People in the Labor Force in Whidbey Island Station?
97.6% of People are in the Labor Force in Whidbey Island Station.