Zip Codes with the Highest Percentage of Population Employed in Administrative & Support Services in Richland, WA
RELATED REPORTS & OPTIONS
Administrative & Support Services
Richland
Compare Zip Codes
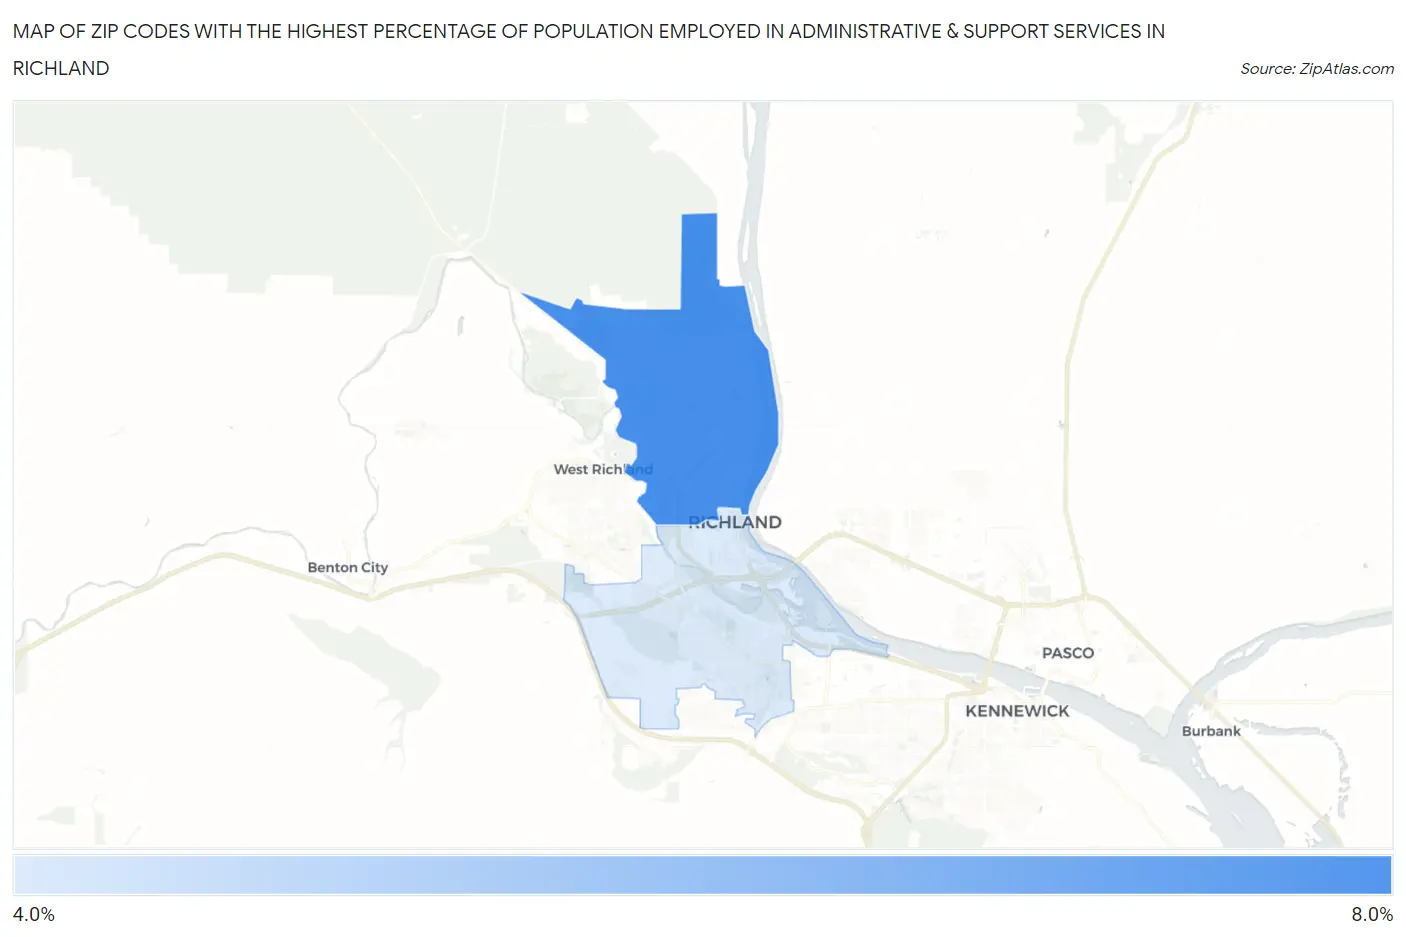
Map of Zip Codes with the Highest Percentage of Population Employed in Administrative & Support Services in Richland
0.0%
8.0%
Zip Codes with the Highest Percentage of Population Employed in Administrative & Support Services in Richland, WA
| Zip Code | % Employed | vs State | vs National | |
| 1. | 99354 | 6.6% | 3.8%(+2.86)#59 | 4.1%(+2.48)#3,727 |
| 2. | 99352 | 4.9% | 3.8%(+1.11)#118 | 4.1%(+0.725)#7,489 |
1
Common Questions
What are the Top Zip Codes with the Highest Percentage of Population Employed in Administrative & Support Services in Richland, WA?
Top Zip Codes with the Highest Percentage of Population Employed in Administrative & Support Services in Richland, WA are:
What zip code has the Highest Percentage of Population Employed in Administrative & Support Services in Richland, WA?
99354 has the Highest Percentage of Population Employed in Administrative & Support Services in Richland, WA with 6.6%.
What is the Percentage of Population Employed in Administrative & Support Services in Richland, WA?
Percentage of Population Employed in Administrative & Support Services in Richland is 5.5%.
What is the Percentage of Population Employed in Administrative & Support Services in Washington?
Percentage of Population Employed in Administrative & Support Services in Washington is 3.8%.
What is the Percentage of Population Employed in Administrative & Support Services in the United States?
Percentage of Population Employed in Administrative & Support Services in the United States is 4.1%.