Zip Codes with the Highest Percentage of Population with a Degree in Visual and Performing Arts in District Of Columbia
RELATED REPORTS & OPTIONS
Visual and Performing Arts
District Of Columbia
Compare Zip Codes
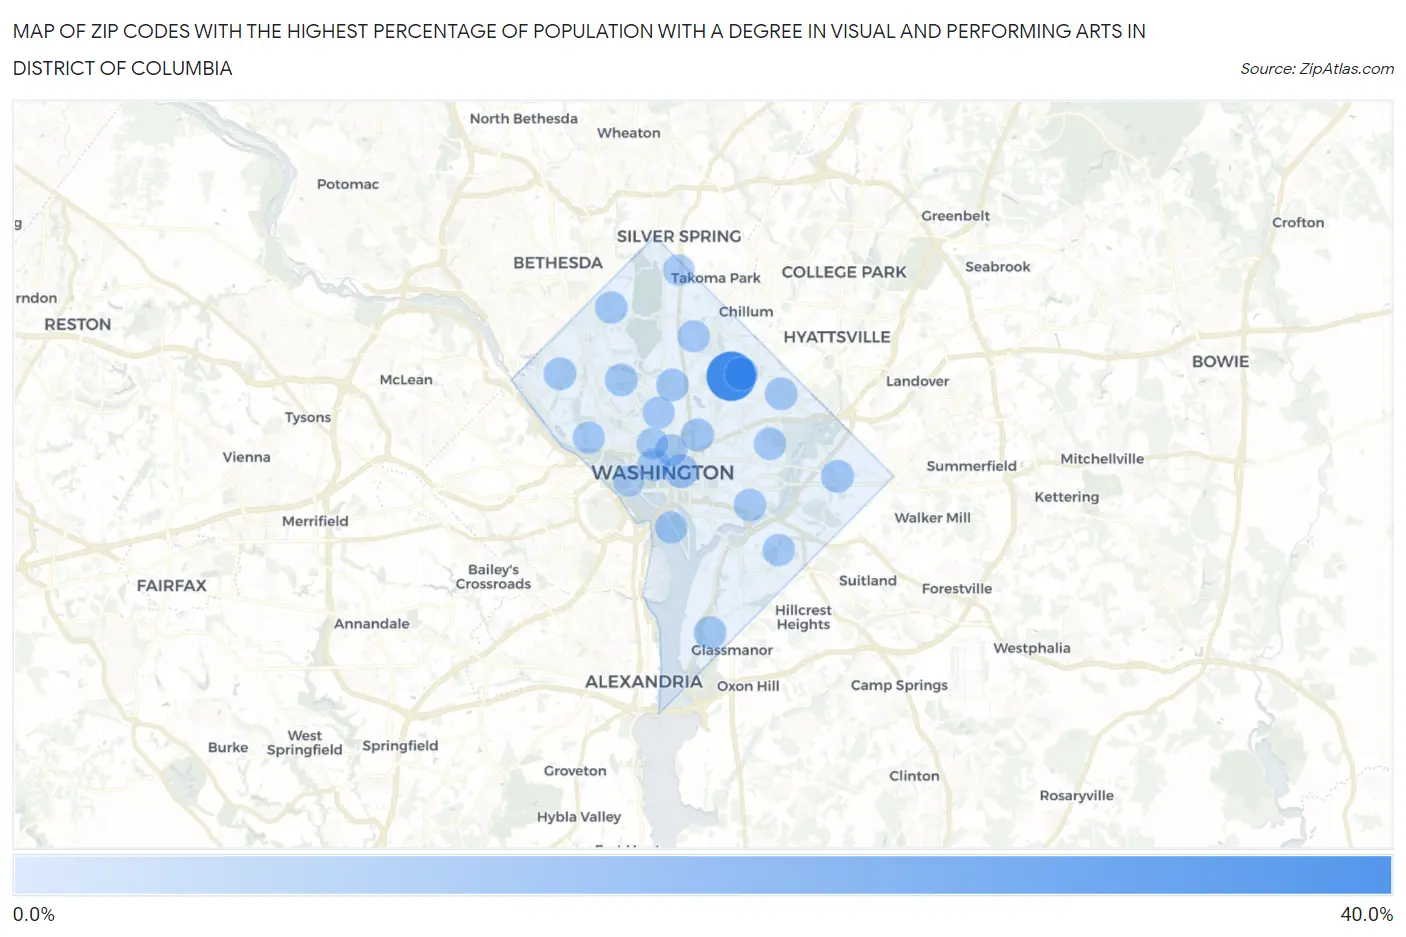
Map of Zip Codes with the Highest Percentage of Population with a Degree in Visual and Performing Arts in District Of Columbia
0.0%
40.0%
Zip Codes with the Highest Percentage of Population with a Degree in Visual and Performing Arts in District Of Columbia
| Zip Code | % Graduates | vs State | vs National | |
| 1. | 20064 | 37.5% | 4.1%(+33.4)#1 | 4.3%(+33.2)#129 |
| 2. | 20004 | 6.7% | 4.1%(+2.61)#2 | 4.3%(+2.50)#3,933 |
| 3. | 20017 | 5.8% | 4.1%(+1.65)#3 | 4.3%(+1.53)#5,194 |
| 4. | 20001 | 5.1% | 4.1%(+0.982)#4 | 4.3%(+0.865)#6,391 |
| 5. | 20019 | 4.9% | 4.1%(+0.796)#5 | 4.3%(+0.678)#6,806 |
| 6. | 20008 | 4.7% | 4.1%(+0.548)#6 | 4.3%(+0.430)#7,338 |
| 7. | 20016 | 4.6% | 4.1%(+0.474)#7 | 4.3%(+0.357)#7,529 |
| 8. | 20010 | 4.6% | 4.1%(+0.467)#8 | 4.3%(+0.350)#7,554 |
| 9. | 20006 | 4.6% | 4.1%(+0.419)#9 | 4.3%(+0.301)#7,662 |
| 10. | 20018 | 4.5% | 4.1%(+0.405)#10 | 4.3%(+0.288)#7,710 |
| 11. | 20032 | 4.4% | 4.1%(+0.268)#11 | 4.3%(+0.151)#8,086 |
| 12. | 20015 | 4.2% | 4.1%(+0.037)#12 | 4.3%(-0.080)#8,711 |
| 13. | 20002 | 4.1% | 4.1%(-0.008)#13 | 4.3%(-0.125)#8,842 |
| 14. | 20011 | 4.0% | 4.1%(-0.124)#14 | 4.3%(-0.241)#9,224 |
| 15. | 20003 | 4.0% | 4.1%(-0.136)#15 | 4.3%(-0.254)#9,279 |
| 16. | 20024 | 3.7% | 4.1%(-0.440)#16 | 4.3%(-0.557)#10,184 |
| 17. | 20007 | 3.6% | 4.1%(-0.535)#17 | 4.3%(-0.652)#10,504 |
| 18. | 20009 | 3.6% | 4.1%(-0.583)#18 | 4.3%(-0.700)#10,690 |
| 19. | 20020 | 3.5% | 4.1%(-0.642)#19 | 4.3%(-0.759)#10,908 |
| 20. | 20005 | 3.3% | 4.1%(-0.849)#20 | 4.3%(-0.966)#11,674 |
| 21. | 20036 | 3.1% | 4.1%(-0.987)#21 | 4.3%(-1.10)#12,168 |
| 22. | 20012 | 2.4% | 4.1%(-1.70)#22 | 4.3%(-1.82)#14,879 |
| 23. | 20037 | 1.6% | 4.1%(-2.51)#23 | 4.3%(-2.63)#17,749 |
1
Common Questions
What are the Top 10 Zip Codes with the Highest Percentage of Population with a Degree in Visual and Performing Arts in District Of Columbia?
Top 10 Zip Codes with the Highest Percentage of Population with a Degree in Visual and Performing Arts in District Of Columbia are:
What zip code has the Highest Percentage of Population with a Degree in Visual and Performing Arts in District Of Columbia?
20064 has the Highest Percentage of Population with a Degree in Visual and Performing Arts in District Of Columbia with 37.5%.
What is the Percentage of Population with a Degree in Visual and Performing Arts in the State of District Of Columbia?
Percentage of Population with a Degree in Visual and Performing Arts in District Of Columbia is 4.1%.
What is the Percentage of Population with a Degree in Visual and Performing Arts in the United States?
Percentage of Population with a Degree in Visual and Performing Arts in the United States is 4.3%.