Zip Codes with the Highest Percentage of Population with a Degree in Visual and Performing Arts in Washington
RELATED REPORTS & OPTIONS
Visual and Performing Arts
Washington
Compare Zip Codes
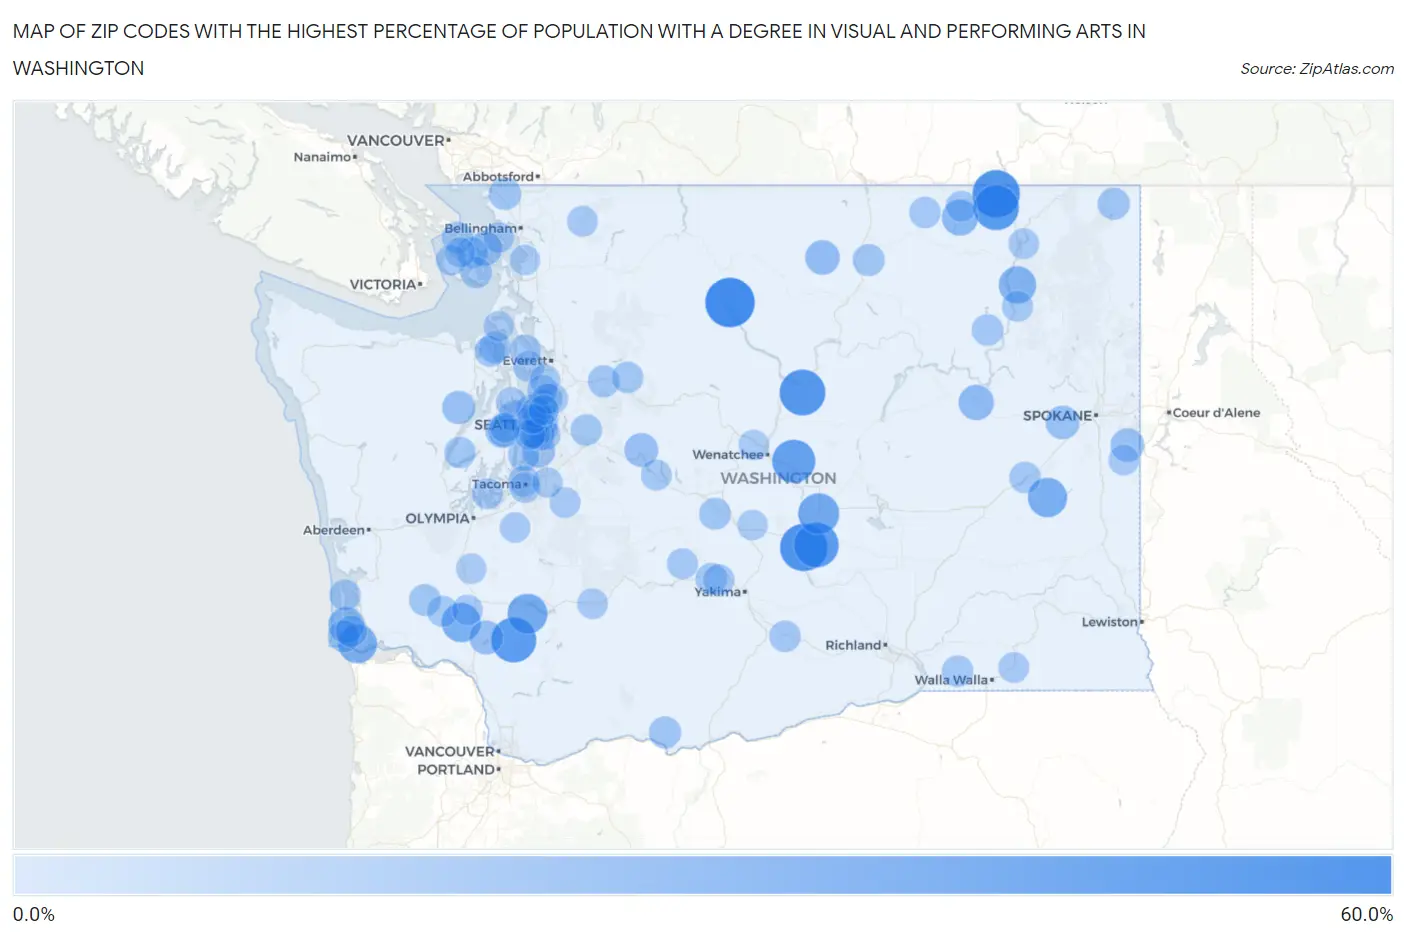
Map of Zip Codes with the Highest Percentage of Population with a Degree in Visual and Performing Arts in Washington
0.0%
60.0%
Zip Codes with the Highest Percentage of Population with a Degree in Visual and Performing Arts in Washington
| Zip Code | % Graduates | vs State | vs National | |
| 1. | 98852 | 55.6% | 4.6%(+50.9)#1 | 4.3%(+51.3)#56 |
| 2. | 99146 | 50.0% | 4.6%(+45.4)#2 | 4.3%(+45.7)#78 |
| 3. | 98950 | 50.0% | 4.6%(+45.4)#3 | 4.3%(+45.7)#79 |
| 4. | 98817 | 45.9% | 4.6%(+41.3)#4 | 4.3%(+41.7)#93 |
| 5. | 99160 | 44.4% | 4.6%(+39.8)#5 | 4.3%(+40.2)#103 |
| 6. | 98649 | 44.0% | 4.6%(+39.4)#6 | 4.3%(+39.7)#107 |
| 7. | 99321 | 43.4% | 4.6%(+38.8)#7 | 4.3%(+39.2)#111 |
| 8. | 98850 | 39.1% | 4.6%(+34.4)#8 | 4.3%(+34.8)#122 |
| 9. | 98824 | 33.3% | 4.6%(+28.7)#9 | 4.3%(+29.1)#175 |
| 10. | 98564 | 31.1% | 4.6%(+26.5)#10 | 4.3%(+26.8)#209 |
| 11. | 99017 | 29.2% | 4.6%(+24.5)#11 | 4.3%(+24.9)#233 |
| 12. | 98593 | 29.0% | 4.6%(+24.4)#12 | 4.3%(+24.8)#237 |
| 13. | 98614 | 28.6% | 4.6%(+24.0)#13 | 4.3%(+24.3)#243 |
| 14. | 99167 | 24.3% | 4.6%(+19.7)#14 | 4.3%(+20.1)#328 |
| 15. | 99150 | 21.6% | 4.6%(+17.0)#15 | 4.3%(+17.4)#409 |
| 16. | 98631 | 21.0% | 4.6%(+16.4)#16 | 4.3%(+16.8)#431 |
| 17. | 99117 | 19.1% | 4.6%(+14.5)#17 | 4.3%(+14.9)#507 |
| 18. | 98819 | 17.4% | 4.6%(+12.8)#18 | 4.3%(+13.1)#613 |
| 19. | 98279 | 16.2% | 4.6%(+11.6)#19 | 4.3%(+11.9)#690 |
| 20. | 98645 | 15.6% | 4.6%(+11.0)#20 | 4.3%(+11.3)#749 |
| 21. | 98068 | 15.3% | 4.6%(+10.7)#21 | 4.3%(+11.1)#778 |
| 22. | 98314 | 15.0% | 4.6%(+10.4)#22 | 4.3%(+10.7)#810 |
| 23. | 99030 | 14.9% | 4.6%(+10.3)#23 | 4.3%(+10.6)#825 |
| 24. | 99022 | 14.8% | 4.6%(+10.2)#24 | 4.3%(+10.5)#835 |
| 25. | 98320 | 14.1% | 4.6%(+9.49)#25 | 4.3%(+9.86)#940 |
| 26. | 98148 | 12.9% | 4.6%(+8.32)#26 | 4.3%(+8.68)#1,117 |
| 27. | 98240 | 12.0% | 4.6%(+7.38)#27 | 4.3%(+7.74)#1,291 |
| 28. | 98635 | 11.3% | 4.6%(+6.68)#28 | 4.3%(+7.05)#1,442 |
| 29. | 99153 | 11.1% | 4.6%(+6.49)#29 | 4.3%(+6.86)#1,497 |
| 30. | 98644 | 11.0% | 4.6%(+6.36)#30 | 4.3%(+6.73)#1,536 |
| 31. | 98849 | 10.9% | 4.6%(+6.29)#31 | 4.3%(+6.66)#1,558 |
| 32. | 98358 | 10.8% | 4.6%(+6.16)#32 | 4.3%(+6.53)#1,599 |
| 33. | 98572 | 10.5% | 4.6%(+5.91)#33 | 4.3%(+6.27)#1,665 |
| 34. | 98294 | 10.5% | 4.6%(+5.90)#34 | 4.3%(+6.27)#1,671 |
| 35. | 98946 | 10.4% | 4.6%(+5.77)#35 | 4.3%(+6.14)#1,710 |
| 36. | 98624 | 10.2% | 4.6%(+5.57)#36 | 4.3%(+5.94)#1,775 |
| 37. | 98070 | 10.0% | 4.6%(+5.41)#37 | 4.3%(+5.78)#1,813 |
| 38. | 98280 | 10.0% | 4.6%(+5.38)#38 | 4.3%(+5.75)#1,835 |
| 39. | 98112 | 10.0% | 4.6%(+5.34)#39 | 4.3%(+5.71)#1,854 |
| 40. | 99138 | 9.8% | 4.6%(+5.22)#40 | 4.3%(+5.58)#1,894 |
| 41. | 98947 | 9.8% | 4.6%(+5.16)#41 | 4.3%(+5.52)#1,916 |
| 42. | 98932 | 9.7% | 4.6%(+5.13)#42 | 4.3%(+5.49)#1,930 |
| 43. | 98337 | 9.7% | 4.6%(+5.10)#43 | 4.3%(+5.46)#1,940 |
| 44. | 99360 | 9.7% | 4.6%(+5.10)#44 | 4.3%(+5.46)#1,941 |
| 45. | 98297 | 9.6% | 4.6%(+5.00)#45 | 4.3%(+5.36)#1,975 |
| 46. | 98024 | 9.6% | 4.6%(+4.99)#46 | 4.3%(+5.36)#1,979 |
| 47. | 98251 | 9.6% | 4.6%(+4.98)#47 | 4.3%(+5.35)#1,989 |
| 48. | 98923 | 9.6% | 4.6%(+4.97)#48 | 4.3%(+5.34)#1,990 |
| 49. | 98261 | 9.6% | 4.6%(+4.94)#49 | 4.3%(+5.31)#2,002 |
| 50. | 99032 | 9.5% | 4.6%(+4.90)#50 | 4.3%(+5.27)#2,009 |
| 51. | 98859 | 9.4% | 4.6%(+4.76)#51 | 4.3%(+5.12)#2,074 |
| 52. | 98588 | 9.3% | 4.6%(+4.68)#52 | 4.3%(+5.05)#2,105 |
| 53. | 98640 | 9.0% | 4.6%(+4.38)#53 | 4.3%(+4.75)#2,261 |
| 54. | 98403 | 9.0% | 4.6%(+4.34)#54 | 4.3%(+4.70)#2,280 |
| 55. | 98108 | 8.9% | 4.6%(+4.26)#55 | 4.3%(+4.63)#2,315 |
| 56. | 98125 | 8.7% | 4.6%(+4.04)#56 | 4.3%(+4.40)#2,443 |
| 57. | 98925 | 8.6% | 4.6%(+4.00)#57 | 4.3%(+4.37)#2,466 |
| 58. | 98144 | 8.5% | 4.6%(+3.88)#58 | 4.3%(+4.24)#2,530 |
| 59. | 98236 | 8.4% | 4.6%(+3.81)#59 | 4.3%(+4.18)#2,577 |
| 60. | 99118 | 8.3% | 4.6%(+3.71)#60 | 4.3%(+4.08)#2,634 |
| 61. | 98538 | 8.3% | 4.6%(+3.71)#61 | 4.3%(+4.08)#2,639 |
| 62. | 99131 | 8.3% | 4.6%(+3.71)#62 | 4.3%(+4.08)#2,645 |
| 63. | 98339 | 8.3% | 4.6%(+3.70)#63 | 4.3%(+4.07)#2,652 |
| 64. | 98011 | 8.3% | 4.6%(+3.70)#64 | 4.3%(+4.06)#2,653 |
| 65. | 98937 | 8.2% | 4.6%(+3.61)#65 | 4.3%(+3.98)#2,695 |
| 66. | 98351 | 8.1% | 4.6%(+3.52)#66 | 4.3%(+3.88)#2,763 |
| 67. | 98118 | 8.1% | 4.6%(+3.45)#67 | 4.3%(+3.82)#2,797 |
| 68. | 98385 | 8.0% | 4.6%(+3.38)#68 | 4.3%(+3.75)#2,846 |
| 69. | 98244 | 8.0% | 4.6%(+3.34)#69 | 4.3%(+3.71)#2,886 |
| 70. | 99012 | 7.9% | 4.6%(+3.26)#70 | 4.3%(+3.63)#2,935 |
| 71. | 98260 | 7.8% | 4.6%(+3.18)#71 | 4.3%(+3.55)#2,987 |
| 72. | 98377 | 7.8% | 4.6%(+3.14)#72 | 4.3%(+3.50)#3,011 |
| 73. | 98418 | 7.7% | 4.6%(+3.13)#73 | 4.3%(+3.49)#3,023 |
| 74. | 98110 | 7.7% | 4.6%(+3.08)#74 | 4.3%(+3.45)#3,050 |
| 75. | 99151 | 7.7% | 4.6%(+3.07)#75 | 4.3%(+3.44)#3,076 |
| 76. | 99329 | 7.7% | 4.6%(+3.07)#76 | 4.3%(+3.44)#3,077 |
| 77. | 98117 | 7.7% | 4.6%(+3.05)#77 | 4.3%(+3.42)#3,091 |
| 78. | 98102 | 7.7% | 4.6%(+3.04)#78 | 4.3%(+3.41)#3,099 |
| 79. | 98392 | 7.6% | 4.6%(+3.02)#79 | 4.3%(+3.39)#3,113 |
| 80. | 98250 | 7.6% | 4.6%(+2.94)#80 | 4.3%(+3.31)#3,173 |
| 81. | 98262 | 7.5% | 4.6%(+2.84)#81 | 4.3%(+3.21)#3,249 |
| 82. | 98126 | 7.4% | 4.6%(+2.82)#82 | 4.3%(+3.19)#3,261 |
| 83. | 98106 | 7.4% | 4.6%(+2.78)#83 | 4.3%(+3.15)#3,297 |
| 84. | 98596 | 7.3% | 4.6%(+2.70)#84 | 4.3%(+3.07)#3,354 |
| 85. | 98103 | 7.2% | 4.6%(+2.62)#85 | 4.3%(+2.99)#3,436 |
| 86. | 98580 | 7.2% | 4.6%(+2.61)#86 | 4.3%(+2.98)#3,445 |
| 87. | 98087 | 7.2% | 4.6%(+2.61)#87 | 4.3%(+2.98)#3,446 |
| 88. | 98836 | 7.1% | 4.6%(+2.52)#88 | 4.3%(+2.89)#3,508 |
| 89. | 98243 | 7.1% | 4.6%(+2.52)#89 | 4.3%(+2.89)#3,520 |
| 90. | 98028 | 7.1% | 4.6%(+2.48)#90 | 4.3%(+2.85)#3,557 |
| 91. | 98531 | 7.1% | 4.6%(+2.46)#91 | 4.3%(+2.82)#3,588 |
| 92. | 98136 | 7.0% | 4.6%(+2.42)#92 | 4.3%(+2.78)#3,630 |
| 93. | 98036 | 7.0% | 4.6%(+2.40)#93 | 4.3%(+2.77)#3,644 |
| 94. | 98926 | 6.9% | 4.6%(+2.33)#94 | 4.3%(+2.70)#3,711 |
| 95. | 98047 | 6.9% | 4.6%(+2.30)#95 | 4.3%(+2.67)#3,733 |
| 96. | 98119 | 6.9% | 4.6%(+2.30)#96 | 4.3%(+2.66)#3,742 |
| 97. | 98232 | 6.9% | 4.6%(+2.27)#97 | 4.3%(+2.63)#3,776 |
| 98. | 98115 | 6.9% | 4.6%(+2.25)#98 | 4.3%(+2.61)#3,796 |
| 99. | 98239 | 6.8% | 4.6%(+2.15)#99 | 4.3%(+2.52)#3,907 |
| 100. | 98310 | 6.7% | 4.6%(+2.08)#100 | 4.3%(+2.45)#3,978 |
Common Questions
What are the Top 10 Zip Codes with the Highest Percentage of Population with a Degree in Visual and Performing Arts in Washington?
Top 10 Zip Codes with the Highest Percentage of Population with a Degree in Visual and Performing Arts in Washington are:
What zip code has the Highest Percentage of Population with a Degree in Visual and Performing Arts in Washington?
98852 has the Highest Percentage of Population with a Degree in Visual and Performing Arts in Washington with 55.6%.
What is the Percentage of Population with a Degree in Visual and Performing Arts in the State of Washington?
Percentage of Population with a Degree in Visual and Performing Arts in Washington is 4.6%.
What is the Percentage of Population with a Degree in Visual and Performing Arts in the United States?
Percentage of Population with a Degree in Visual and Performing Arts in the United States is 4.3%.