Zip Codes with the Highest Percentage of Population with a Degree in Visual and Performing Arts in Pennsylvania
RELATED REPORTS & OPTIONS
Visual and Performing Arts
Pennsylvania
Compare Zip Codes
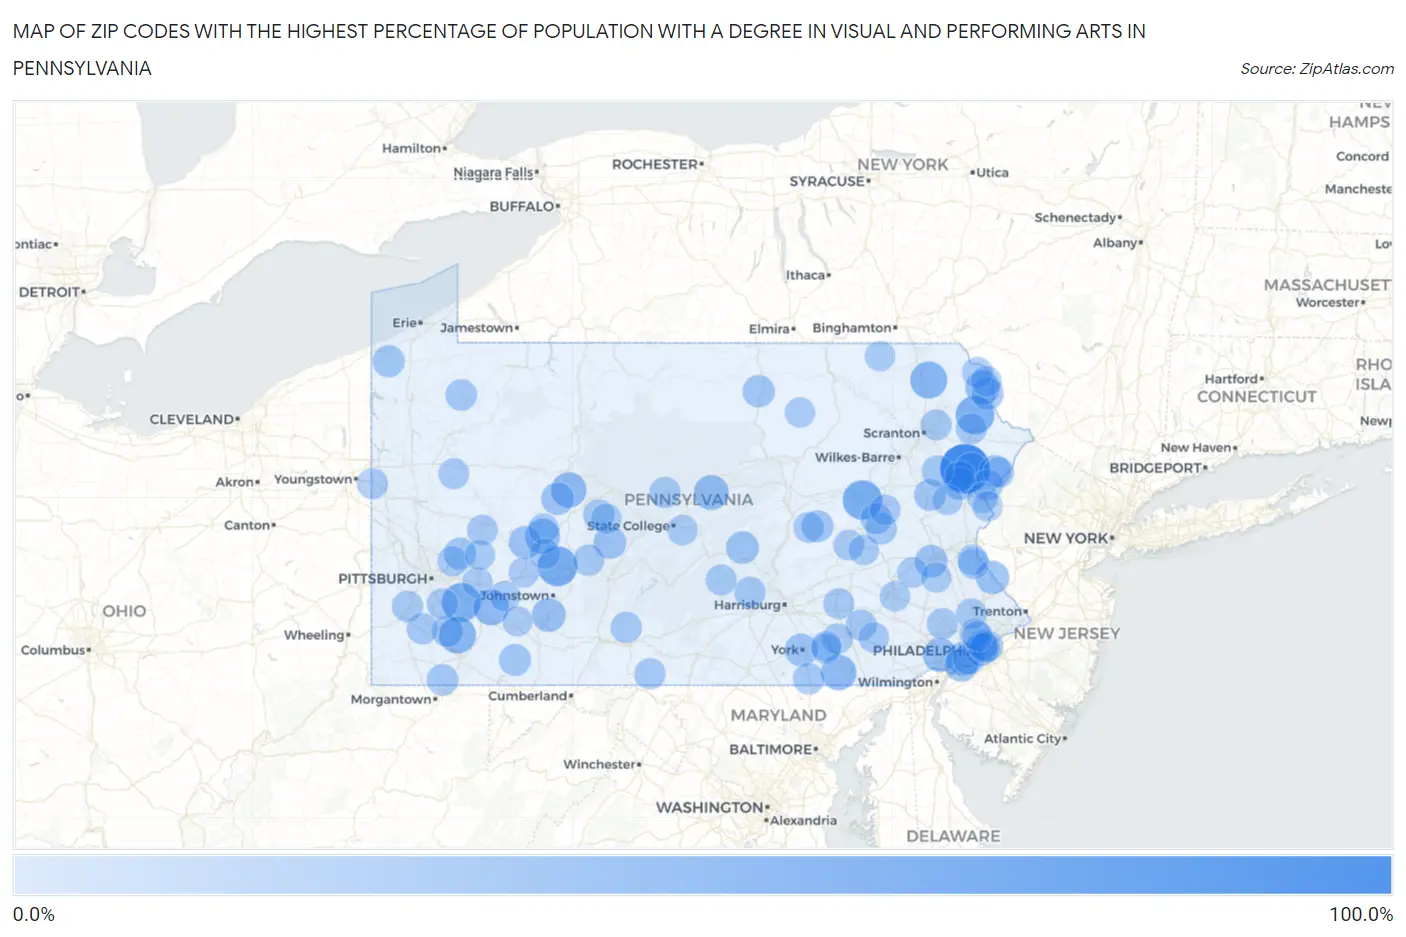
Map of Zip Codes with the Highest Percentage of Population with a Degree in Visual and Performing Arts in Pennsylvania
0.0%
100.0%
Zip Codes with the Highest Percentage of Population with a Degree in Visual and Performing Arts in Pennsylvania
| Zip Code | % Graduates | vs State | vs National | |
| 1. | 18342 | 93.0% | 3.8%(+89.1)#1 | 4.3%(+88.7)#25 |
| 2. | 15922 | 50.0% | 3.8%(+46.2)#2 | 4.3%(+45.7)#77 |
| 3. | 18246 | 48.3% | 3.8%(+44.5)#3 | 4.3%(+44.0)#84 |
| 4. | 15678 | 44.8% | 3.8%(+41.0)#4 | 4.3%(+40.6)#96 |
| 5. | 18473 | 44.1% | 3.8%(+40.3)#5 | 4.3%(+39.9)#105 |
| 6. | 15482 | 37.5% | 3.8%(+33.7)#6 | 4.3%(+33.2)#132 |
| 7. | 18842 | 37.5% | 3.8%(+33.7)#7 | 4.3%(+33.2)#134 |
| 8. | 15676 | 31.7% | 3.8%(+27.9)#8 | 4.3%(+27.5)#202 |
| 9. | 17302 | 30.8% | 3.8%(+26.9)#9 | 4.3%(+26.5)#211 |
| 10. | 15866 | 30.0% | 3.8%(+26.2)#10 | 4.3%(+25.7)#219 |
| 11. | 15734 | 29.3% | 3.8%(+25.5)#11 | 4.3%(+25.1)#231 |
| 12. | 16848 | 28.6% | 3.8%(+24.7)#12 | 4.3%(+24.3)#247 |
| 13. | 18469 | 25.6% | 3.8%(+21.8)#13 | 4.3%(+21.4)#300 |
| 14. | 19043 | 25.5% | 3.8%(+21.7)#14 | 4.3%(+21.3)#303 |
| 15. | 19319 | 25.3% | 3.8%(+21.5)#15 | 4.3%(+21.0)#308 |
| 16. | 15935 | 23.9% | 3.8%(+20.0)#16 | 4.3%(+19.6)#338 |
| 17. | 18950 | 21.7% | 3.8%(+17.8)#17 | 4.3%(+17.4)#405 |
| 18. | 19022 | 21.5% | 3.8%(+17.7)#18 | 4.3%(+17.2)#413 |
| 19. | 17401 | 19.8% | 3.8%(+16.0)#19 | 4.3%(+15.6)#479 |
| 20. | 17049 | 19.6% | 3.8%(+15.8)#20 | 4.3%(+15.3)#485 |
| 21. | 15739 | 19.3% | 3.8%(+15.5)#21 | 4.3%(+15.1)#498 |
| 22. | 18087 | 19.2% | 3.8%(+15.4)#22 | 4.3%(+14.9)#506 |
| 23. | 15715 | 19.0% | 3.8%(+15.2)#23 | 4.3%(+14.8)#512 |
| 24. | 18326 | 18.2% | 3.8%(+14.4)#24 | 4.3%(+14.0)#561 |
| 25. | 18355 | 18.2% | 3.8%(+14.4)#25 | 4.3%(+13.9)#564 |
| 26. | 16619 | 18.2% | 3.8%(+14.4)#26 | 4.3%(+13.9)#567 |
| 27. | 18443 | 17.6% | 3.8%(+13.7)#27 | 4.3%(+13.3)#597 |
| 28. | 16911 | 17.4% | 3.8%(+13.6)#28 | 4.3%(+13.1)#612 |
| 29. | 19108 | 17.4% | 3.8%(+13.6)#29 | 4.3%(+13.1)#615 |
| 30. | 18371 | 16.9% | 3.8%(+13.0)#30 | 4.3%(+12.6)#652 |
| 31. | 15014 | 16.5% | 3.8%(+12.7)#31 | 4.3%(+12.3)#673 |
| 32. | 16475 | 16.4% | 3.8%(+12.6)#32 | 4.3%(+12.1)#679 |
| 33. | 15551 | 15.9% | 3.8%(+12.1)#33 | 4.3%(+11.7)#720 |
| 34. | 18210 | 15.4% | 3.8%(+11.6)#34 | 4.3%(+11.1)#775 |
| 35. | 17872 | 15.3% | 3.8%(+11.4)#35 | 4.3%(+11.0)#785 |
| 36. | 18347 | 14.6% | 3.8%(+10.8)#36 | 4.3%(+10.4)#862 |
| 37. | 15474 | 14.6% | 3.8%(+10.8)#37 | 4.3%(+10.3)#868 |
| 38. | 19079 | 14.5% | 3.8%(+10.7)#38 | 4.3%(+10.3)#880 |
| 39. | 16328 | 14.3% | 3.8%(+10.5)#39 | 4.3%(+10.0)#917 |
| 40. | 17361 | 14.0% | 3.8%(+10.2)#40 | 4.3%(+9.78)#951 |
| 41. | 19134 | 14.0% | 3.8%(+10.2)#41 | 4.3%(+9.75)#958 |
| 42. | 17982 | 13.3% | 3.8%(+9.51)#42 | 4.3%(+9.08)#1,042 |
| 43. | 18220 | 13.3% | 3.8%(+9.51)#43 | 4.3%(+9.08)#1,045 |
| 44. | 17090 | 13.2% | 3.8%(+9.39)#44 | 4.3%(+8.96)#1,066 |
| 45. | 15483 | 13.2% | 3.8%(+9.38)#45 | 4.3%(+8.96)#1,069 |
| 46. | 15088 | 13.0% | 3.8%(+9.22)#46 | 4.3%(+8.79)#1,097 |
| 47. | 16874 | 12.9% | 3.8%(+9.08)#47 | 4.3%(+8.65)#1,121 |
| 48. | 15324 | 12.9% | 3.8%(+9.08)#48 | 4.3%(+8.65)#1,122 |
| 49. | 16861 | 12.9% | 3.8%(+9.08)#49 | 4.3%(+8.65)#1,125 |
| 50. | 19453 | 12.8% | 3.8%(+9.01)#50 | 4.3%(+8.58)#1,132 |
| 51. | 15363 | 12.7% | 3.8%(+8.93)#51 | 4.3%(+8.50)#1,143 |
| 52. | 16650 | 12.6% | 3.8%(+8.76)#52 | 4.3%(+8.33)#1,176 |
| 53. | 17212 | 12.5% | 3.8%(+8.68)#53 | 4.3%(+8.25)#1,190 |
| 54. | 16624 | 12.1% | 3.8%(+8.30)#54 | 4.3%(+7.87)#1,262 |
| 55. | 17016 | 12.1% | 3.8%(+8.28)#55 | 4.3%(+7.85)#1,267 |
| 56. | 18335 | 12.1% | 3.8%(+8.23)#56 | 4.3%(+7.80)#1,276 |
| 57. | 17508 | 12.0% | 3.8%(+8.18)#57 | 4.3%(+7.75)#1,286 |
| 58. | 17037 | 11.8% | 3.8%(+7.94)#58 | 4.3%(+7.51)#1,333 |
| 59. | 18438 | 11.7% | 3.8%(+7.92)#59 | 4.3%(+7.49)#1,337 |
| 60. | 18434 | 11.6% | 3.8%(+7.81)#60 | 4.3%(+7.38)#1,367 |
| 61. | 18417 | 11.3% | 3.8%(+7.52)#61 | 4.3%(+7.09)#1,430 |
| 62. | 16155 | 11.3% | 3.8%(+7.52)#62 | 4.3%(+7.09)#1,431 |
| 63. | 18930 | 11.2% | 3.8%(+7.42)#63 | 4.3%(+6.99)#1,458 |
| 64. | 17881 | 11.1% | 3.8%(+7.29)#64 | 4.3%(+6.86)#1,487 |
| 65. | 19536 | 11.1% | 3.8%(+7.29)#65 | 4.3%(+6.86)#1,496 |
| 66. | 16228 | 11.1% | 3.8%(+7.29)#66 | 4.3%(+6.86)#1,499 |
| 67. | 18324 | 10.9% | 3.8%(+7.08)#67 | 4.3%(+6.65)#1,564 |
| 68. | 19436 | 10.8% | 3.8%(+6.99)#68 | 4.3%(+6.56)#1,583 |
| 69. | 17554 | 10.8% | 3.8%(+6.95)#69 | 4.3%(+6.52)#1,601 |
| 70. | 15759 | 10.7% | 3.8%(+6.90)#70 | 4.3%(+6.47)#1,616 |
| 71. | 16030 | 10.7% | 3.8%(+6.89)#71 | 4.3%(+6.46)#1,622 |
| 72. | 18231 | 10.6% | 3.8%(+6.82)#72 | 4.3%(+6.39)#1,642 |
| 73. | 18415 | 10.5% | 3.8%(+6.68)#73 | 4.3%(+6.25)#1,675 |
| 74. | 17923 | 10.3% | 3.8%(+6.52)#74 | 4.3%(+6.09)#1,727 |
| 75. | 19133 | 10.3% | 3.8%(+6.51)#75 | 4.3%(+6.08)#1,732 |
| 76. | 19118 | 10.3% | 3.8%(+6.48)#76 | 4.3%(+6.05)#1,739 |
| 77. | 18077 | 10.2% | 3.8%(+6.42)#77 | 4.3%(+5.99)#1,760 |
| 78. | 19125 | 10.1% | 3.8%(+6.24)#78 | 4.3%(+5.81)#1,802 |
| 79. | 15049 | 10.0% | 3.8%(+6.18)#79 | 4.3%(+5.75)#1,830 |
| 80. | 18327 | 9.9% | 3.8%(+6.09)#80 | 4.3%(+5.67)#1,866 |
| 81. | 18344 | 9.9% | 3.8%(+6.09)#81 | 4.3%(+5.66)#1,869 |
| 82. | 17529 | 9.9% | 3.8%(+6.08)#82 | 4.3%(+5.65)#1,875 |
| 83. | 19119 | 9.8% | 3.8%(+5.98)#83 | 4.3%(+5.55)#1,909 |
| 84. | 16661 | 9.8% | 3.8%(+5.93)#84 | 4.3%(+5.50)#1,922 |
| 85. | 15620 | 9.7% | 3.8%(+5.90)#85 | 4.3%(+5.47)#1,939 |
| 86. | 17929 | 9.6% | 3.8%(+5.78)#86 | 4.3%(+5.35)#1,983 |
| 87. | 17317 | 9.5% | 3.8%(+5.70)#87 | 4.3%(+5.27)#2,011 |
| 88. | 16827 | 9.4% | 3.8%(+5.57)#88 | 4.3%(+5.14)#2,067 |
| 89. | 18351 | 9.4% | 3.8%(+5.55)#89 | 4.3%(+5.12)#2,072 |
| 90. | 19602 | 9.3% | 3.8%(+5.51)#90 | 4.3%(+5.08)#2,089 |
| 91. | 18056 | 9.3% | 3.8%(+5.47)#91 | 4.3%(+5.04)#2,117 |
| 92. | 15765 | 9.2% | 3.8%(+5.42)#92 | 4.3%(+4.99)#2,145 |
| 93. | 15750 | 9.2% | 3.8%(+5.39)#93 | 4.3%(+4.96)#2,165 |
| 94. | 17368 | 9.2% | 3.8%(+5.37)#94 | 4.3%(+4.94)#2,171 |
| 95. | 18330 | 9.1% | 3.8%(+5.28)#95 | 4.3%(+4.85)#2,204 |
| 96. | 18818 | 9.0% | 3.8%(+5.20)#96 | 4.3%(+4.78)#2,250 |
| 97. | 17768 | 9.0% | 3.8%(+5.13)#97 | 4.3%(+4.70)#2,281 |
| 98. | 15626 | 8.9% | 3.8%(+5.11)#98 | 4.3%(+4.68)#2,287 |
| 99. | 15677 | 8.9% | 3.8%(+5.11)#99 | 4.3%(+4.68)#2,291 |
| 100. | 15629 | 8.9% | 3.8%(+5.07)#100 | 4.3%(+4.64)#2,312 |
Common Questions
What are the Top 10 Zip Codes with the Highest Percentage of Population with a Degree in Visual and Performing Arts in Pennsylvania?
Top 10 Zip Codes with the Highest Percentage of Population with a Degree in Visual and Performing Arts in Pennsylvania are:
What zip code has the Highest Percentage of Population with a Degree in Visual and Performing Arts in Pennsylvania?
18342 has the Highest Percentage of Population with a Degree in Visual and Performing Arts in Pennsylvania with 93.0%.
What is the Percentage of Population with a Degree in Visual and Performing Arts in the State of Pennsylvania?
Percentage of Population with a Degree in Visual and Performing Arts in Pennsylvania is 3.8%.
What is the Percentage of Population with a Degree in Visual and Performing Arts in the United States?
Percentage of Population with a Degree in Visual and Performing Arts in the United States is 4.3%.