Broad Top City borough, PA
Broad Top City borough Overview
462
TOTAL POPULATION
244
MALE POPULATION
218
FEMALE POPULATION
111.93
MALES / 100 FEMALES
89.34
FEMALES / 100 MALES
43.4
MEDIAN AGE
3.1
AVG FAMILY SIZE
2.7
AVG HOUSEHOLD SIZE
$33,849
PER CAPITA INCOME
$76,944
AVG FAMILY INCOME
$66,172
AVG HOUSEHOLD INCOME
52.4%
WAGE / INCOME GAP [ % ]
47.6¢/ $1
WAGE / INCOME GAP [ $ ]
0.41
INEQUALITY / GINI INDEX
238
LABOR FORCE [ PEOPLE ]
62.6%
PERCENT IN LABOR FORCE
0.8%
UNEMPLOYMENT RATE
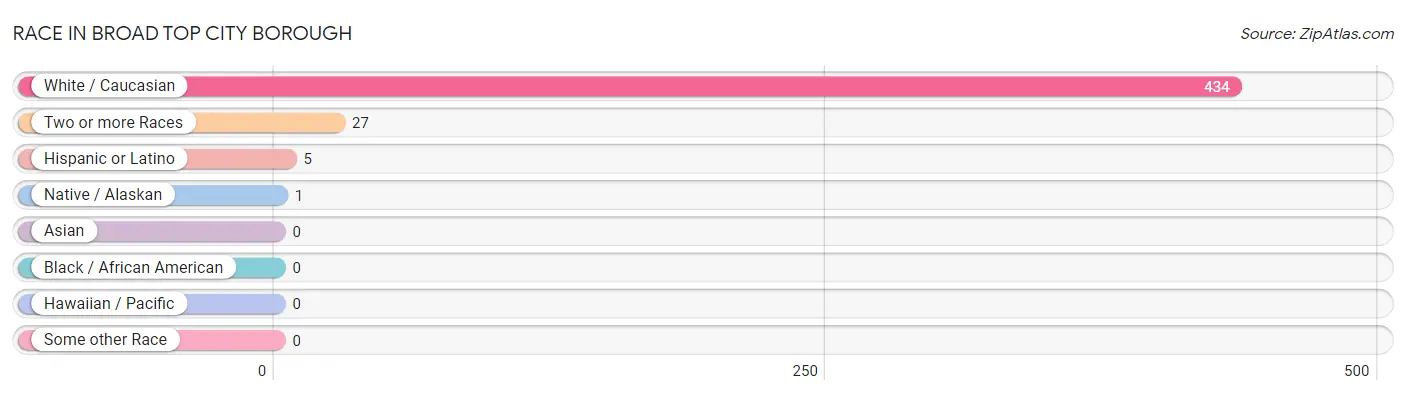
Race in Broad Top City borough
The most populous races in Broad Top City borough are White / Caucasian (434 | 93.9%), Two or more Races (27 | 5.8%), and Hispanic or Latino (5 | 1.1%).
| Race | # Population | % Population |
| Asian | 0 | 0.0% |
| Black / African American | 0 | 0.0% |
| Hawaiian / Pacific | 0 | 0.0% |
| Hispanic or Latino | 5 | 1.1% |
| Native / Alaskan | 1 | 0.2% |
| White / Caucasian | 434 | 93.9% |
| Two or more Races | 27 | 5.8% |
| Some other Race | 0 | 0.0% |
| Total | 462 | 100.0% |
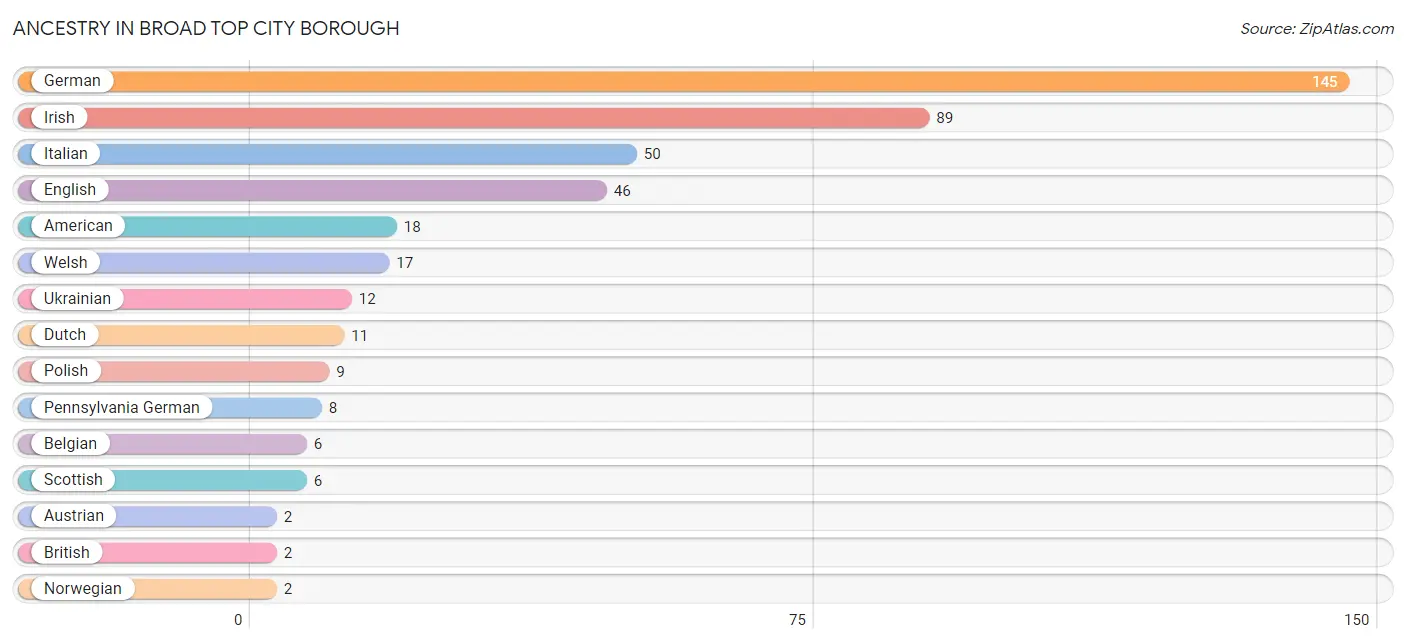
Ancestry in Broad Top City borough
The most populous ancestries reported in Broad Top City borough are German (145 | 31.4%), Irish (89 | 19.3%), Italian (50 | 10.8%), English (46 | 10.0%), and American (18 | 3.9%), together accounting for 75.3% of all Broad Top City borough residents.
| Ancestry | # Population | % Population |
| American | 18 | 3.9% |
| Austrian | 2 | 0.4% |
| Belgian | 6 | 1.3% |
| British | 2 | 0.4% |
| Dutch | 11 | 2.4% |
| English | 46 | 10.0% |
| German | 145 | 31.4% |
| Irish | 89 | 19.3% |
| Italian | 50 | 10.8% |
| Norwegian | 2 | 0.4% |
| Pennsylvania German | 8 | 1.7% |
| Polish | 9 | 1.9% |
| Scotch-Irish | 2 | 0.4% |
| Scottish | 6 | 1.3% |
| Slovak | 2 | 0.4% |
| Ukrainian | 12 | 2.6% |
| Welsh | 17 | 3.7% | View All 17 Rows |
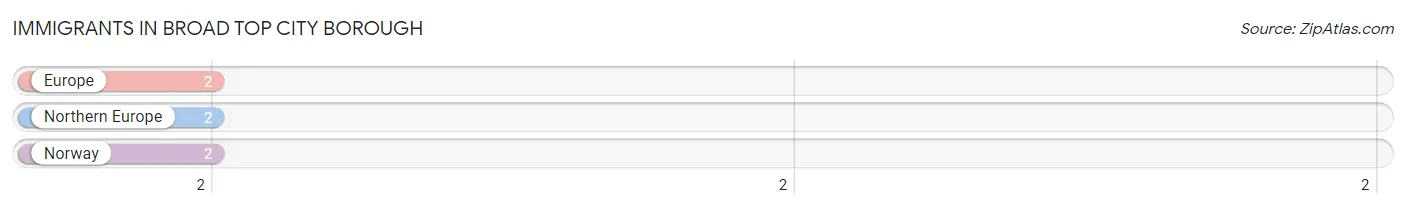
Immigrants in Broad Top City borough
The most numerous immigrant groups reported in Broad Top City borough came from Europe (2 | 0.4%), Northern Europe (2 | 0.4%), and Norway (2 | 0.4%), together accounting for 1.3% of all Broad Top City borough residents.
| Immigration Origin | # Population | % Population |
| Europe | 2 | 0.4% |
| Northern Europe | 2 | 0.4% |
| Norway | 2 | 0.4% | View All 3 Rows |
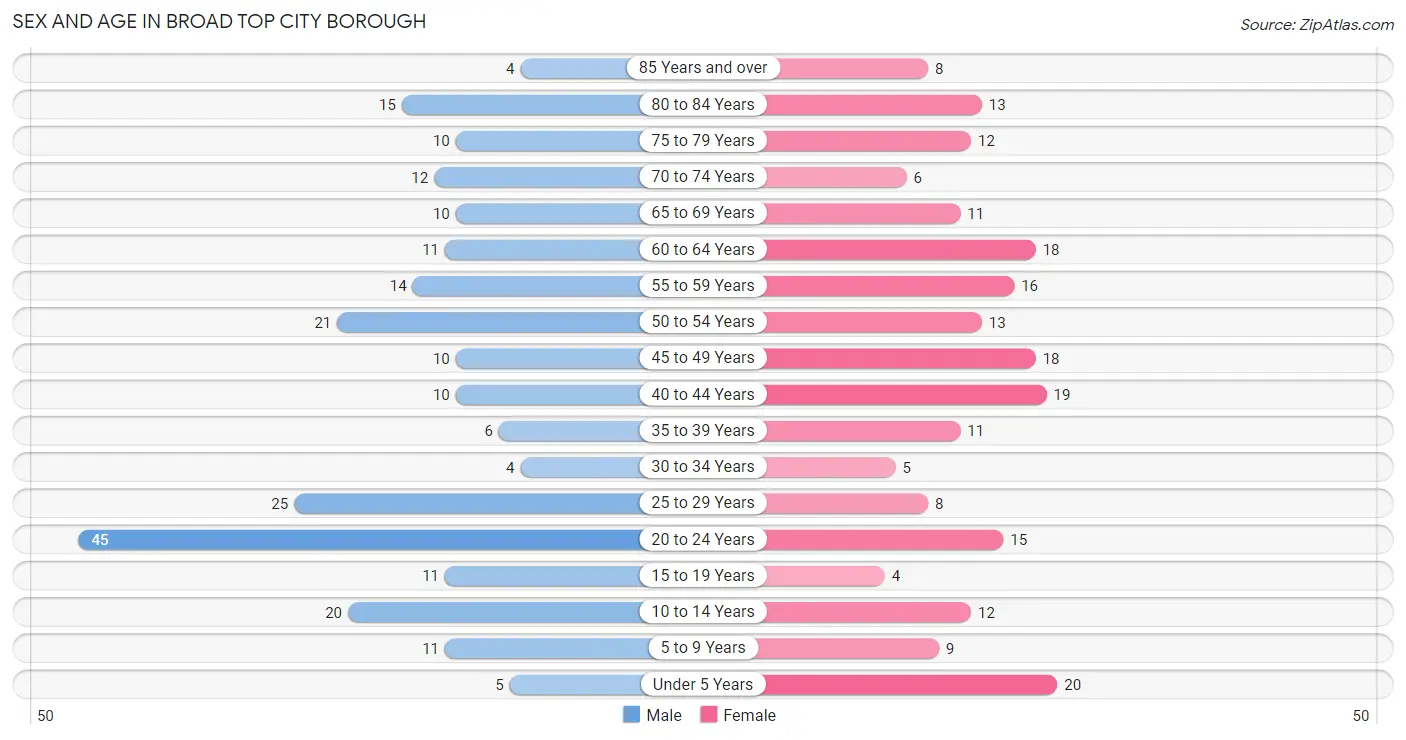
Sex and Age in Broad Top City borough
Sex and Age in Broad Top City borough
The most populous age groups in Broad Top City borough are 20 to 24 Years (45 | 18.4%) for men and Under 5 Years (20 | 9.2%) for women.
| Age Bracket | Male | Female |
| Under 5 Years | 5 (2.1%) | 20 (9.2%) |
| 5 to 9 Years | 11 (4.5%) | 9 (4.1%) |
| 10 to 14 Years | 20 (8.2%) | 12 (5.5%) |
| 15 to 19 Years | 11 (4.5%) | 4 (1.8%) |
| 20 to 24 Years | 45 (18.4%) | 15 (6.9%) |
| 25 to 29 Years | 25 (10.2%) | 8 (3.7%) |
| 30 to 34 Years | 4 (1.6%) | 5 (2.3%) |
| 35 to 39 Years | 6 (2.5%) | 11 (5.1%) |
| 40 to 44 Years | 10 (4.1%) | 19 (8.7%) |
| 45 to 49 Years | 10 (4.1%) | 18 (8.3%) |
| 50 to 54 Years | 21 (8.6%) | 13 (6.0%) |
| 55 to 59 Years | 14 (5.7%) | 16 (7.3%) |
| 60 to 64 Years | 11 (4.5%) | 18 (8.3%) |
| 65 to 69 Years | 10 (4.1%) | 11 (5.1%) |
| 70 to 74 Years | 12 (4.9%) | 6 (2.8%) |
| 75 to 79 Years | 10 (4.1%) | 12 (5.5%) |
| 80 to 84 Years | 15 (6.1%) | 13 (6.0%) |
| 85 Years and over | 4 (1.6%) | 8 (3.7%) |
| Total | 244 (100.0%) | 218 (100.0%) |
Families and Households in Broad Top City borough
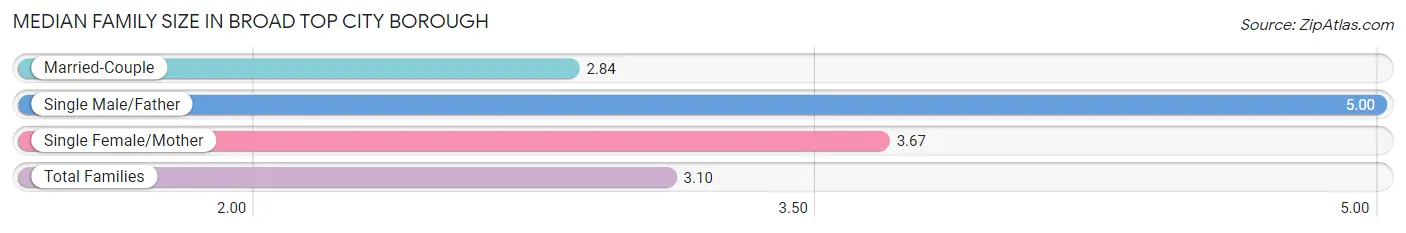
Median Family Size in Broad Top City borough
The median family size in Broad Top City borough is 3.10 persons per family, with single male/father families (3 | 2.3%) accounting for the largest median family size of 5 persons per family. On the other hand, married-couple families (92 | 71.9%) represent the smallest median family size with 2.84 persons per family.
| Family Type | # Families | Family Size |
| Married-Couple | 92 (71.9%) | 2.84 |
| Single Male/Father | 3 (2.3%) | 5.00 |
| Single Female/Mother | 33 (25.8%) | 3.67 |
| Total Families | 128 (100.0%) | 3.10 |
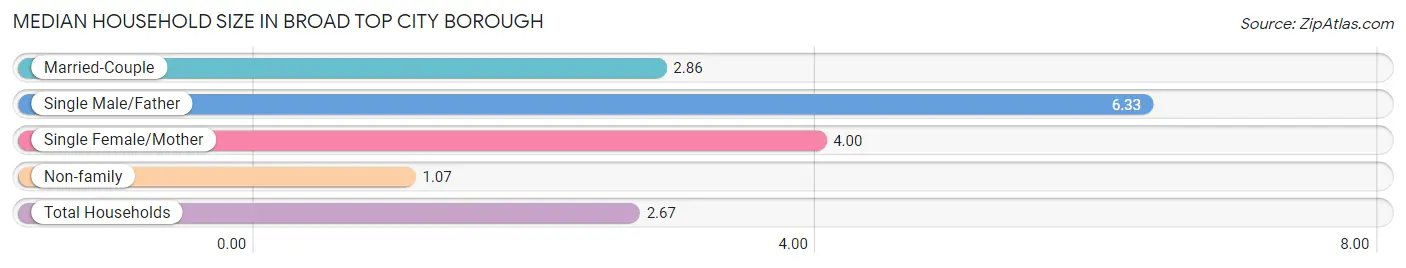
Median Household Size in Broad Top City borough
The median household size in Broad Top City borough is 2.67 persons per household, with single male/father households (3 | 1.7%) accounting for the largest median household size of 6.33 persons per household. non-family households (45 | 26.0%) represent the smallest median household size with 1.07 persons per household.
| Household Type | # Households | Household Size |
| Married-Couple | 92 (53.2%) | 2.86 |
| Single Male/Father | 3 (1.7%) | 6.33 |
| Single Female/Mother | 33 (19.1%) | 4.00 |
| Non-family | 45 (26.0%) | 1.07 |
| Total Households | 173 (100.0%) | 2.67 |
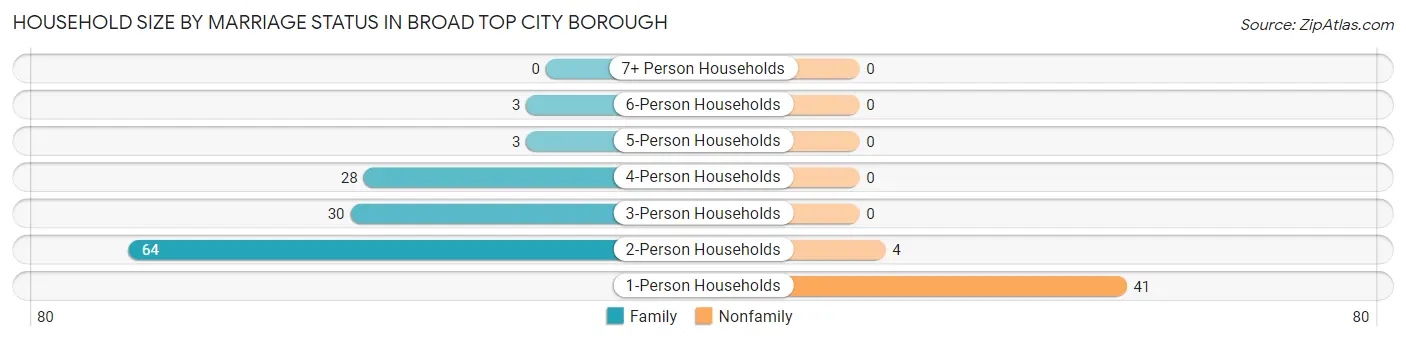
Household Size by Marriage Status in Broad Top City borough
Out of a total of 173 households in Broad Top City borough, 128 (74.0%) are family households, while 45 (26.0%) are nonfamily households. The most numerous type of family households are 2-person households, comprising 64, and the most common type of nonfamily households are 1-person households, comprising 41.
| Household Size | Family Households | Nonfamily Households |
| 1-Person Households | - | 41 (23.7%) |
| 2-Person Households | 64 (37.0%) | 4 (2.3%) |
| 3-Person Households | 30 (17.3%) | 0 (0.0%) |
| 4-Person Households | 28 (16.2%) | 0 (0.0%) |
| 5-Person Households | 3 (1.7%) | 0 (0.0%) |
| 6-Person Households | 3 (1.7%) | 0 (0.0%) |
| 7+ Person Households | 0 (0.0%) | 0 (0.0%) |
| Total | 128 (74.0%) | 45 (26.0%) |
Female Fertility in Broad Top City borough
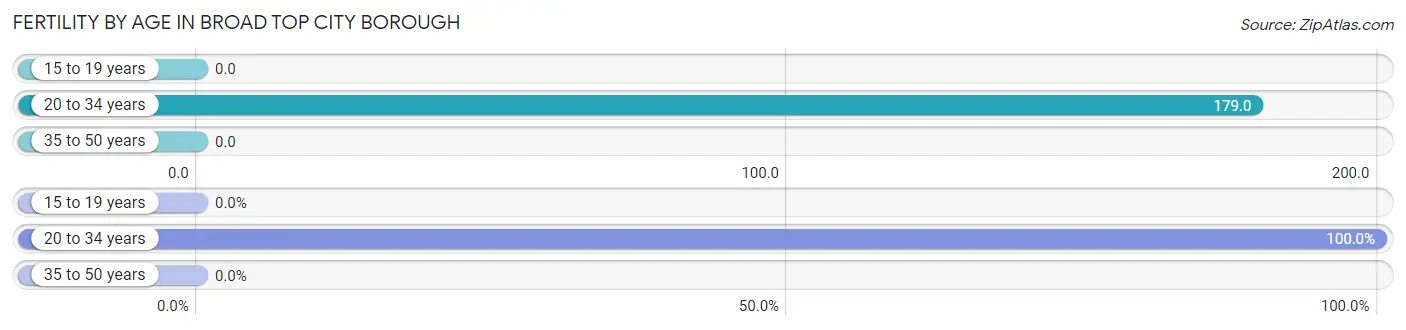
Fertility by Age in Broad Top City borough
Average fertility rate in Broad Top City borough is 59.0 births per 1,000 women. Women in the age bracket of 20 to 34 years have the highest fertility rate with 179.0 births per 1,000 women. Women in the age bracket of 20 to 34 years acount for 100.0% of all women with births.
| Age Bracket | Women with Births | Births / 1,000 Women |
| 15 to 19 years | 0 (0.0%) | 0.0 |
| 20 to 34 years | 5 (100.0%) | 179.0 |
| 35 to 50 years | 0 (0.0%) | 0.0 |
| Total | 5 (100.0%) | 59.0 |
Fertility by Age by Marriage Status in Broad Top City borough
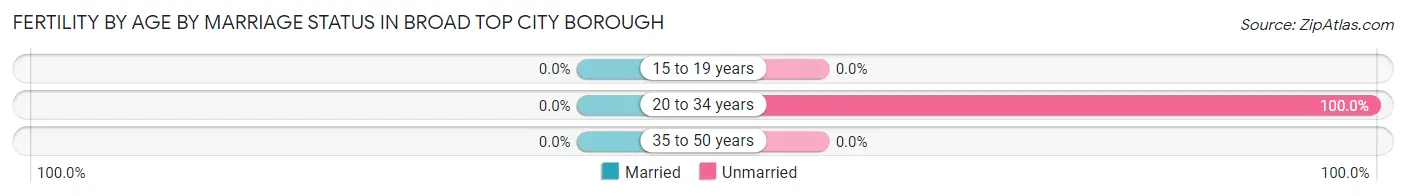
| Age Bracket | Married | Unmarried |
| 15 to 19 years | 0 (0.0%) | 0 (0.0%) |
| 20 to 34 years | 0 (0.0%) | 5 (100.0%) |
| 35 to 50 years | 0 (0.0%) | 0 (0.0%) |
| Total | 0 (0.0%) | 5 (100.0%) |
Fertility by Education in Broad Top City borough
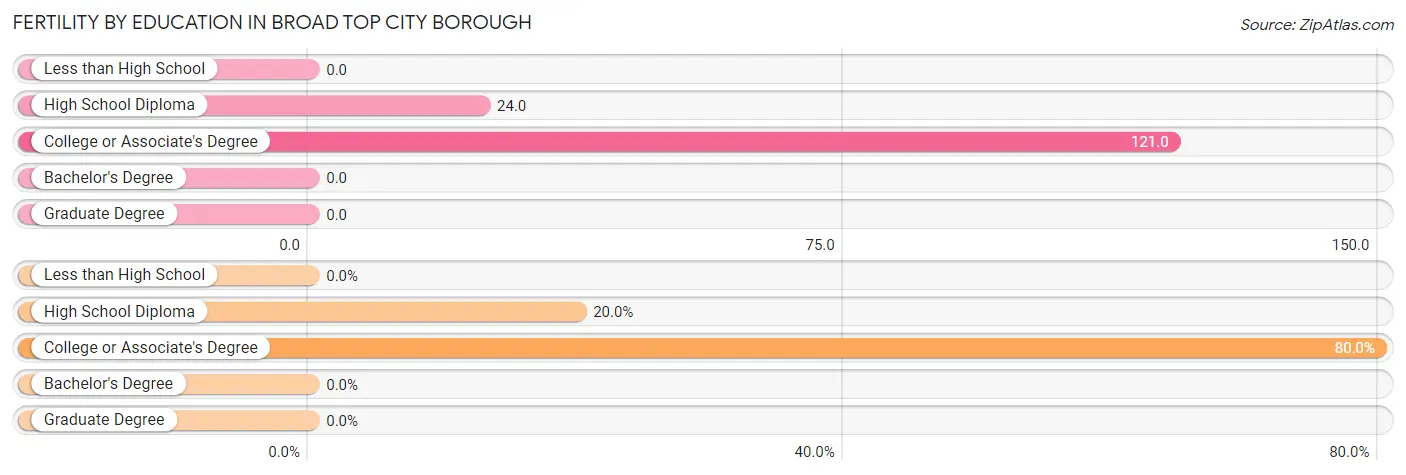
| Educational Attainment | Women with Births | Births / 1,000 Women |
| Less than High School | 0 (0.0%) | 0.0 |
| High School Diploma | 1 (20.0%) | 24.0 |
| College or Associate's Degree | 4 (80.0%) | 121.0 |
| Bachelor's Degree | 0 (0.0%) | 0.0 |
| Graduate Degree | 0 (0.0%) | 0.0 |
| Total | 5 (100.0%) | 59.0 |
Fertility by Education by Marriage Status in Broad Top City borough
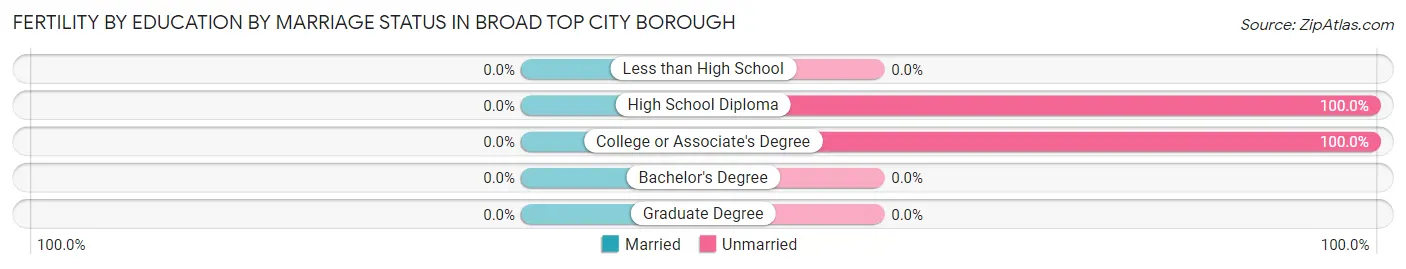
| Educational Attainment | Married | Unmarried |
| Less than High School | 0 (0.0%) | 0 (0.0%) |
| High School Diploma | 0 (0.0%) | 1 (100.0%) |
| College or Associate's Degree | 0 (0.0%) | 4 (100.0%) |
| Bachelor's Degree | 0 (0.0%) | 0 (0.0%) |
| Graduate Degree | 0 (0.0%) | 0 (0.0%) |
| Total | 0 (0.0%) | 5 (100.0%) |
Income in Broad Top City borough
Income Overview in Broad Top City borough
Per Capita Income in Broad Top City borough is $33,849, while median incomes of families and households are $76,944 and $66,172 respectively.
| Characteristic | Number | Measure |
| Per Capita Income | 462 | $33,849 |
| Median Family Income | 128 | $76,944 |
| Mean Family Income | 128 | $93,020 |
| Median Household Income | 173 | $66,172 |
| Mean Household Income | 173 | $80,399 |
| Income Deficit | 128 | $0 |
| Wage / Income Gap (%) | 462 | 52.41% |
| Wage / Income Gap ($) | 462 | 47.59¢ per $1 |
| Gini / Inequality Index | 462 | 0.41 |
Earnings by Sex in Broad Top City borough
Average Earnings in Broad Top City borough are $35,909, $55,455 for men and $26,389 for women, a difference of 52.4%.
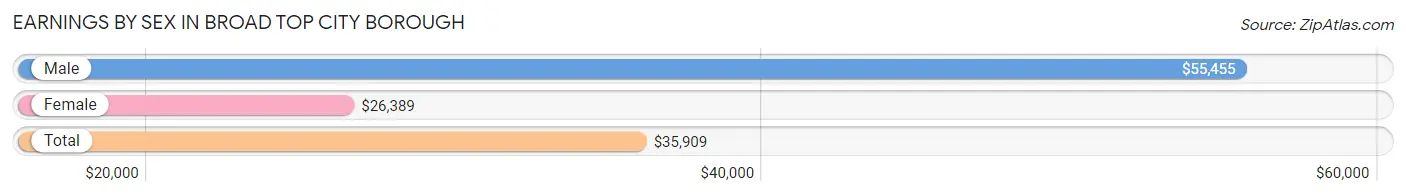
| Sex | Number | Average Earnings |
| Male | 148 (58.7%) | $55,455 |
| Female | 104 (41.3%) | $26,389 |
| Total | 252 (100.0%) | $35,909 |
Earnings by Sex by Income Bracket in Broad Top City borough
The most common earnings brackets in Broad Top City borough are $55,000 to $64,999 for men (45 | 30.4%) and $25,000 to $29,999 for women (13 | 12.5%).
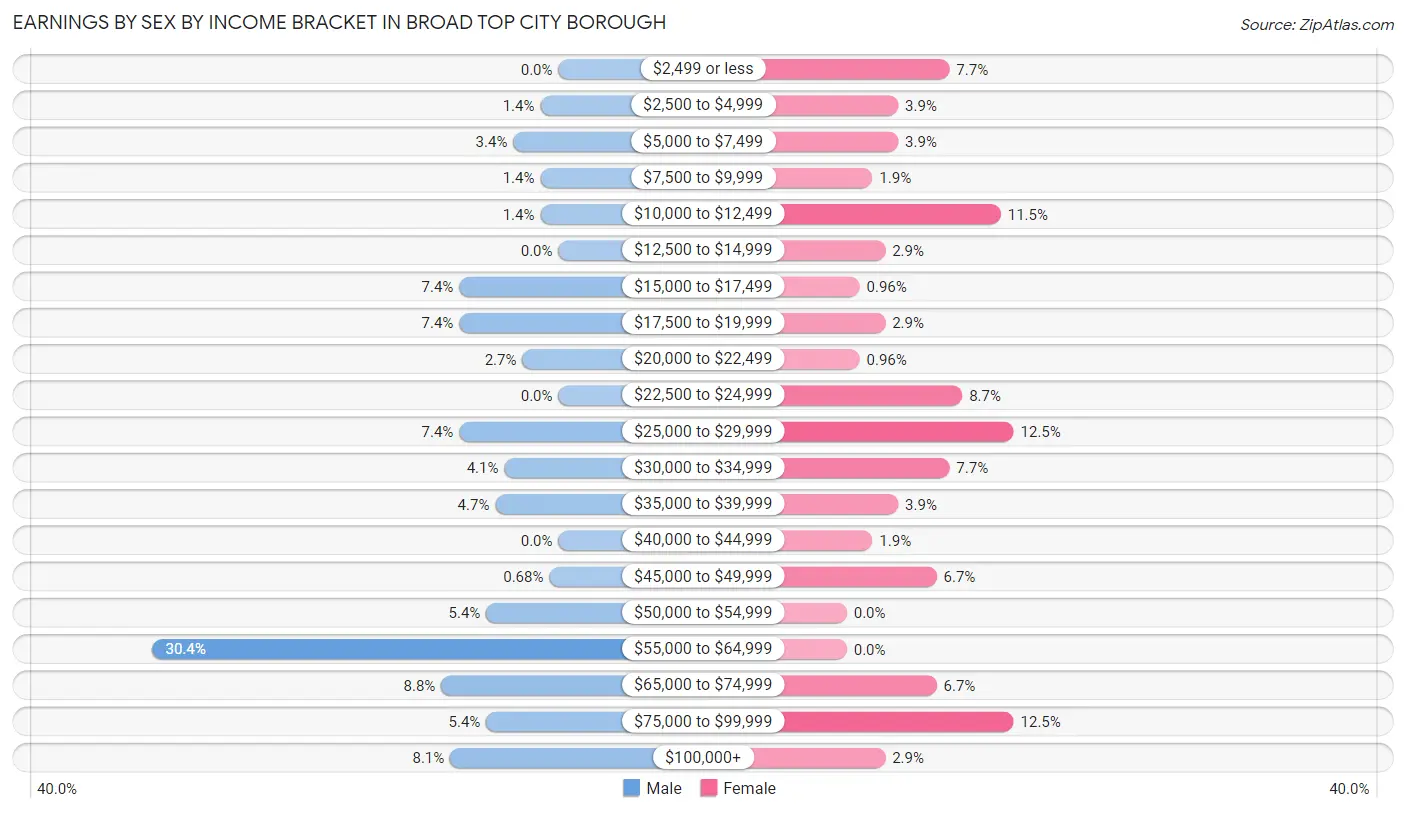
| Income | Male | Female |
| $2,499 or less | 0 (0.0%) | 8 (7.7%) |
| $2,500 to $4,999 | 2 (1.3%) | 4 (3.8%) |
| $5,000 to $7,499 | 5 (3.4%) | 4 (3.8%) |
| $7,500 to $9,999 | 2 (1.3%) | 2 (1.9%) |
| $10,000 to $12,499 | 2 (1.3%) | 12 (11.5%) |
| $12,500 to $14,999 | 0 (0.0%) | 3 (2.9%) |
| $15,000 to $17,499 | 11 (7.4%) | 1 (1.0%) |
| $17,500 to $19,999 | 11 (7.4%) | 3 (2.9%) |
| $20,000 to $22,499 | 4 (2.7%) | 1 (1.0%) |
| $22,500 to $24,999 | 0 (0.0%) | 9 (8.6%) |
| $25,000 to $29,999 | 11 (7.4%) | 13 (12.5%) |
| $30,000 to $34,999 | 6 (4.1%) | 8 (7.7%) |
| $35,000 to $39,999 | 7 (4.7%) | 4 (3.8%) |
| $40,000 to $44,999 | 0 (0.0%) | 2 (1.9%) |
| $45,000 to $49,999 | 1 (0.7%) | 7 (6.7%) |
| $50,000 to $54,999 | 8 (5.4%) | 0 (0.0%) |
| $55,000 to $64,999 | 45 (30.4%) | 0 (0.0%) |
| $65,000 to $74,999 | 13 (8.8%) | 7 (6.7%) |
| $75,000 to $99,999 | 8 (5.4%) | 13 (12.5%) |
| $100,000+ | 12 (8.1%) | 3 (2.9%) |
| Total | 148 (100.0%) | 104 (100.0%) |
Earnings by Sex by Educational Attainment in Broad Top City borough
Average earnings in Broad Top City borough are $52,188 for men and $29,375 for women, a difference of 43.7%. Men with an educational attainment of high school diploma enjoy the highest average annual earnings of $59,375, while those with college or associate's degree education earn the least with $28,000. Women with an educational attainment of college or associate's degree earn the most with the average annual earnings of $28,750, while those with high school diploma education have the smallest earnings of $27,292.
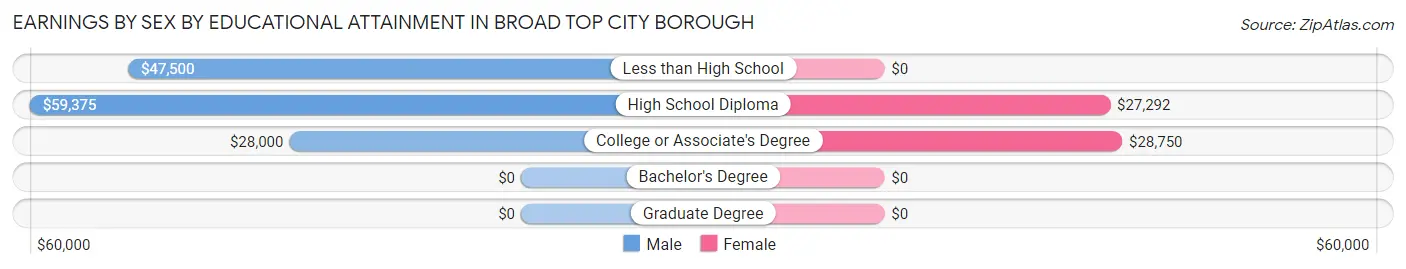
| Educational Attainment | Male Income | Female Income |
| Less than High School | $47,500 | $0 |
| High School Diploma | $59,375 | $27,292 |
| College or Associate's Degree | $28,000 | $28,750 |
| Bachelor's Degree | - | - |
| Graduate Degree | - | - |
| Total | $52,188 | $29,375 |
Family Income in Broad Top City borough
Family Income Brackets in Broad Top City borough
According to the Broad Top City borough family income data, there are 28 families falling into the $100,000 to $149,999 income range, which is the most common income bracket and makes up 21.9% of all families. Conversely, the $10,000 to $14,999 income bracket is the least frequent group with only 3 families (2.3%) belonging to this category.
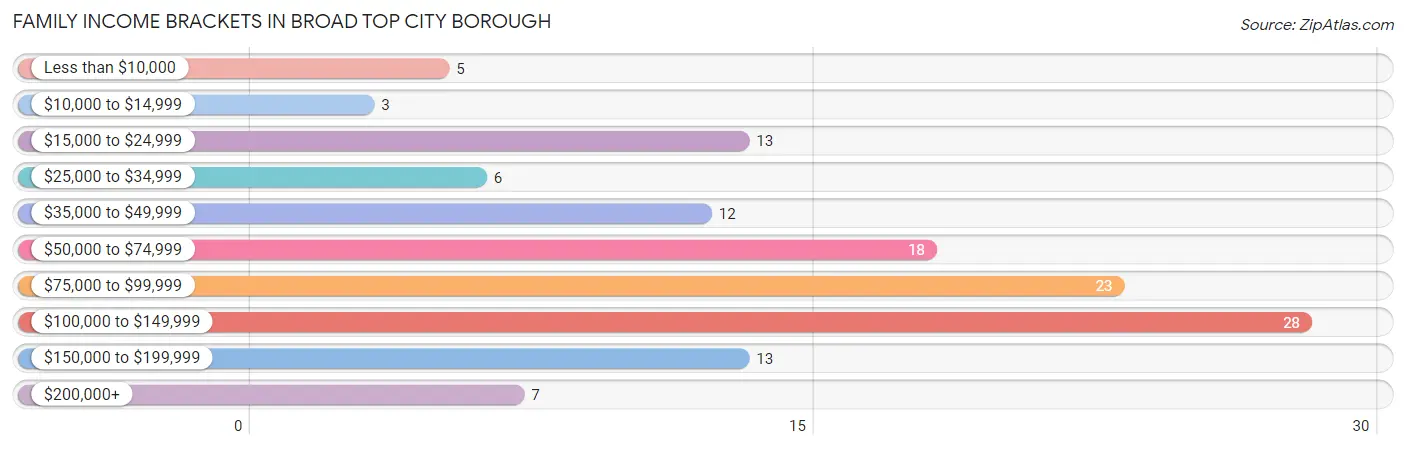
| Income Bracket | # Families | % Families |
| Less than $10,000 | 5 | 3.9% |
| $10,000 to $14,999 | 3 | 2.3% |
| $15,000 to $24,999 | 13 | 10.2% |
| $25,000 to $34,999 | 6 | 4.7% |
| $35,000 to $49,999 | 12 | 9.4% |
| $50,000 to $74,999 | 18 | 14.1% |
| $75,000 to $99,999 | 23 | 18.0% |
| $100,000 to $149,999 | 28 | 21.9% |
| $150,000 to $199,999 | 13 | 10.2% |
| $200,000+ | 7 | 5.5% |
Family Income by Famaliy Size in Broad Top City borough
5-person families (6 | 4.7%) account for the highest median family income in Broad Top City borough with $176,667 per family, while 3-person families (28 | 21.9%) have the highest median income of $42,500 per family member.
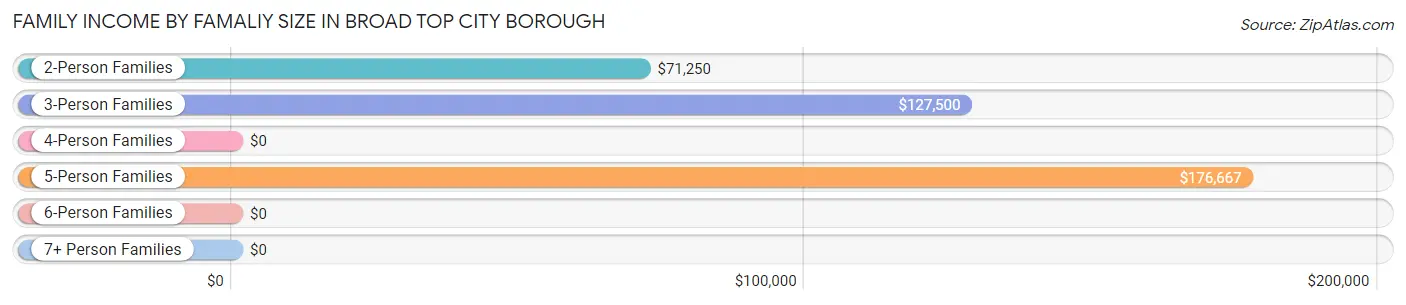
| Income Bracket | # Families | Median Income |
| 2-Person Families | 68 (53.1%) | $71,250 |
| 3-Person Families | 28 (21.9%) | $127,500 |
| 4-Person Families | 26 (20.3%) | $0 |
| 5-Person Families | 6 (4.7%) | $176,667 |
| 6-Person Families | 0 (0.0%) | $0 |
| 7+ Person Families | 0 (0.0%) | $0 |
| Total | 128 (100.0%) | $76,944 |
Family Income by Number of Earners in Broad Top City borough
The median family income in Broad Top City borough is $76,944, with families comprising 3+ earners (24) having the highest median family income of $133,125, while families with 1 earner (32) have the lowest median family income of $34,375, accounting for 18.8% and 25.0% of families, respectively.
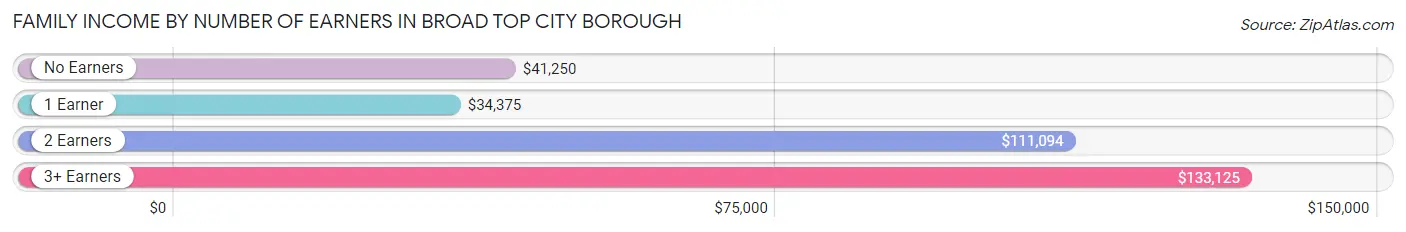
| Number of Earners | # Families | Median Income |
| No Earners | 29 (22.7%) | $41,250 |
| 1 Earner | 32 (25.0%) | $34,375 |
| 2 Earners | 43 (33.6%) | $111,094 |
| 3+ Earners | 24 (18.8%) | $133,125 |
| Total | 128 (100.0%) | $76,944 |
Household Income in Broad Top City borough
Household Income Brackets in Broad Top City borough
With 42 households falling in the category, the $50,000 to $74,999 income range is the most frequent in Broad Top City borough, accounting for 24.3% of all households. In contrast, only 5 households (2.9%) fall into the less than $10,000 income bracket, making it the least populous group.
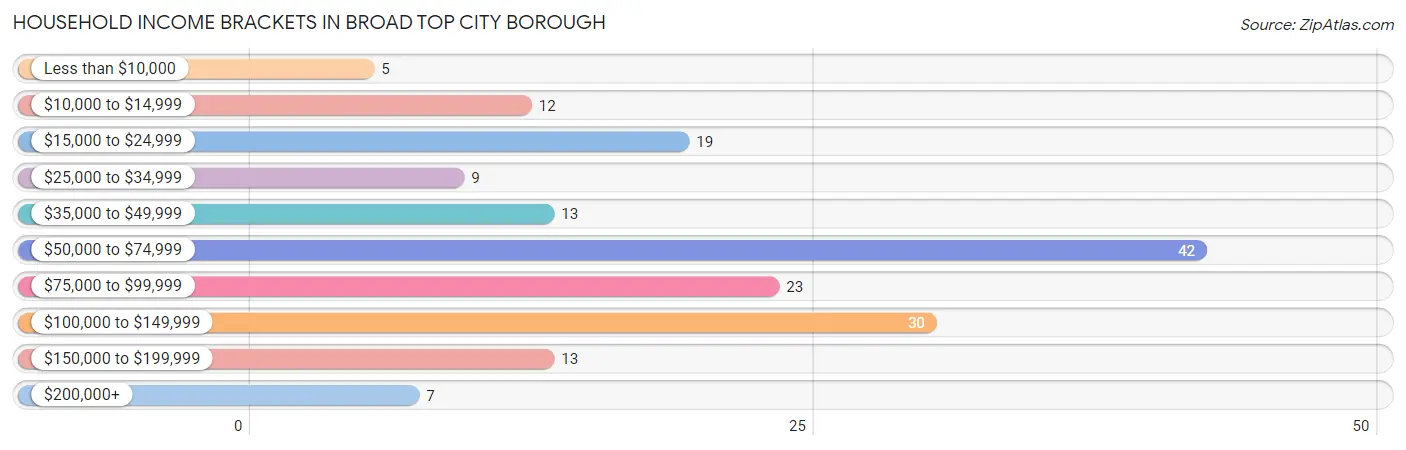
| Income Bracket | # Households | % Households |
| Less than $10,000 | 5 | 2.9% |
| $10,000 to $14,999 | 12 | 6.9% |
| $15,000 to $24,999 | 19 | 11.0% |
| $25,000 to $34,999 | 9 | 5.2% |
| $35,000 to $49,999 | 13 | 7.5% |
| $50,000 to $74,999 | 42 | 24.3% |
| $75,000 to $99,999 | 23 | 13.3% |
| $100,000 to $149,999 | 30 | 17.3% |
| $150,000 to $199,999 | 13 | 7.5% |
| $200,000+ | 7 | 4.0% |
Household Income by Householder Age in Broad Top City borough
The median household income in Broad Top City borough is $66,172, with the highest median household income of $78,750 found in the 45 to 64 years age bracket for the primary householder. A total of 69 households (39.9%) fall into this category. Meanwhile, the 15 to 24 years age bracket for the primary householder has the lowest median household income of $0, with 6 households (3.5%) in this group.
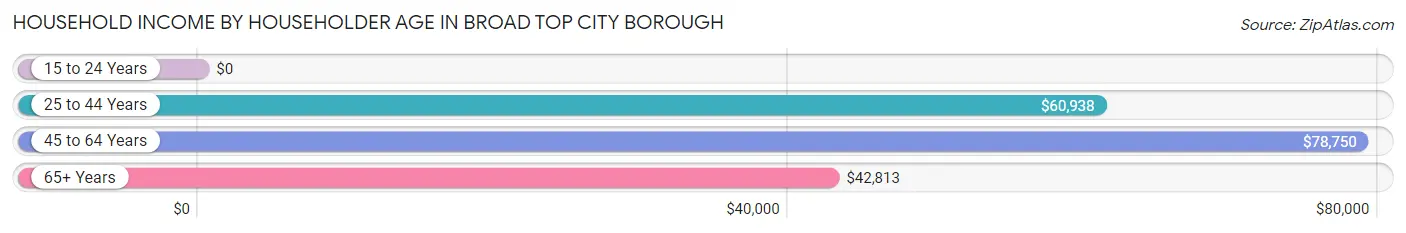
| Income Bracket | # Households | Median Income |
| 15 to 24 Years | 6 (3.5%) | $0 |
| 25 to 44 Years | 39 (22.5%) | $60,938 |
| 45 to 64 Years | 69 (39.9%) | $78,750 |
| 65+ Years | 59 (34.1%) | $42,813 |
| Total | 173 (100.0%) | $66,172 |
Poverty in Broad Top City borough
Income Below Poverty by Sex and Age in Broad Top City borough
With 11.5% poverty level for males and 20.2% for females among the residents of Broad Top City borough, 16 and 17 year old males and 5 year old females are the most vulnerable to poverty, with 2 males (100.0%) and 3 females (75.0%) in their respective age groups living below the poverty level.
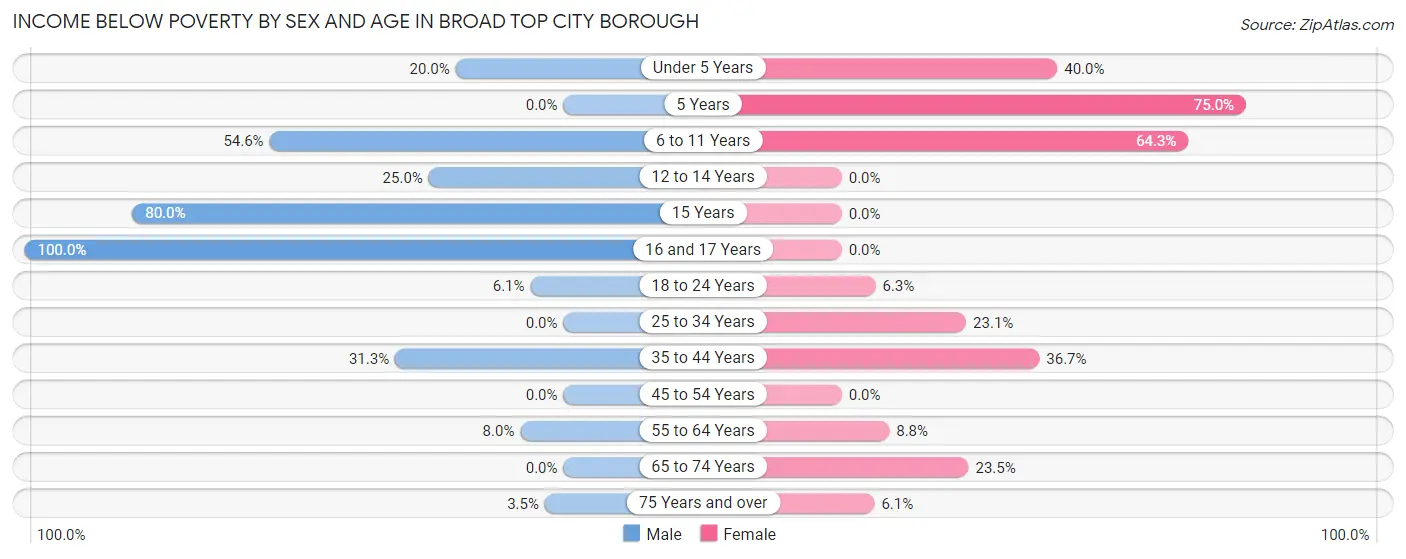
| Age Bracket | Male | Female |
| Under 5 Years | 1 (20.0%) | 8 (40.0%) |
| 5 Years | 0 (0.0%) | 3 (75.0%) |
| 6 to 11 Years | 6 (54.5%) | 9 (64.3%) |
| 12 to 14 Years | 4 (25.0%) | 0 (0.0%) |
| 15 Years | 4 (80.0%) | 0 (0.0%) |
| 16 and 17 Years | 2 (100.0%) | 0 (0.0%) |
| 18 to 24 Years | 3 (6.1%) | 1 (6.2%) |
| 25 to 34 Years | 0 (0.0%) | 3 (23.1%) |
| 35 to 44 Years | 5 (31.2%) | 11 (36.7%) |
| 45 to 54 Years | 0 (0.0%) | 0 (0.0%) |
| 55 to 64 Years | 2 (8.0%) | 3 (8.8%) |
| 65 to 74 Years | 0 (0.0%) | 4 (23.5%) |
| 75 Years and over | 1 (3.5%) | 2 (6.1%) |
| Total | 28 (11.5%) | 44 (20.2%) |
Income Above Poverty by Sex and Age in Broad Top City borough
According to the poverty statistics in Broad Top City borough, males aged 5 years and females aged 12 to 14 years are the age groups that are most secure financially, with 100.0% of males and 100.0% of females in these age groups living above the poverty line.

| Age Bracket | Male | Female |
| Under 5 Years | 4 (80.0%) | 12 (60.0%) |
| 5 Years | 4 (100.0%) | 1 (25.0%) |
| 6 to 11 Years | 5 (45.5%) | 5 (35.7%) |
| 12 to 14 Years | 12 (75.0%) | 3 (100.0%) |
| 15 Years | 1 (20.0%) | 0 (0.0%) |
| 16 and 17 Years | 0 (0.0%) | 3 (100.0%) |
| 18 to 24 Years | 46 (93.9%) | 15 (93.8%) |
| 25 to 34 Years | 29 (100.0%) | 10 (76.9%) |
| 35 to 44 Years | 11 (68.8%) | 19 (63.3%) |
| 45 to 54 Years | 31 (100.0%) | 31 (100.0%) |
| 55 to 64 Years | 23 (92.0%) | 31 (91.2%) |
| 65 to 74 Years | 22 (100.0%) | 13 (76.5%) |
| 75 Years and over | 28 (96.6%) | 31 (93.9%) |
| Total | 216 (88.5%) | 174 (79.8%) |
Income Below Poverty Among Married-Couple Families in Broad Top City borough
The poverty statistics for married-couple families in Broad Top City borough show that 6.5% or 6 of the total 92 families live below the poverty line. Families with 1 or 2 children have the highest poverty rate of 26.3%, comprising of 5 families. On the other hand, families with 3 or 4 children have the lowest poverty rate of 0.0%, which includes 0 families.
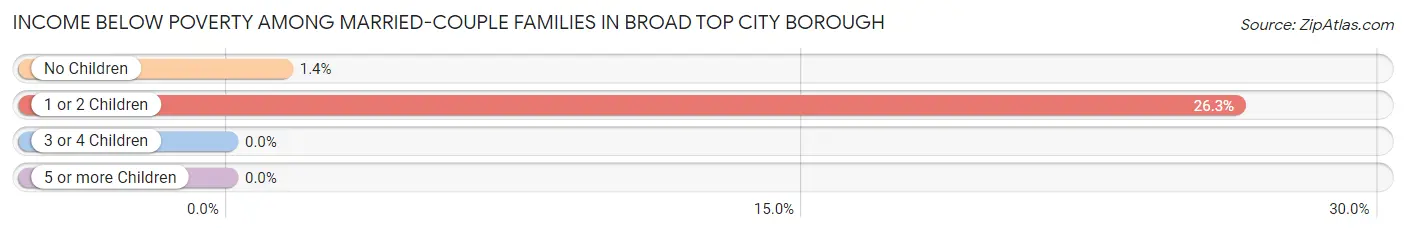
| Children | Above Poverty | Below Poverty |
| No Children | 69 (98.6%) | 1 (1.4%) |
| 1 or 2 Children | 14 (73.7%) | 5 (26.3%) |
| 3 or 4 Children | 3 (100.0%) | 0 (0.0%) |
| 5 or more Children | 0 (0.0%) | 0 (0.0%) |
| Total | 86 (93.5%) | 6 (6.5%) |
Income Below Poverty Among Single-Parent Households in Broad Top City borough
According to the poverty data in Broad Top City borough, 33.3% or 1 single-father households and 21.2% or 7 single-mother households are living below the poverty line. Among single-father households, those with 3 or 4 children have the highest poverty rate, with 1 households (100.0%) experiencing poverty. Likewise, among single-mother households, those with 3 or 4 children have the highest poverty rate, with 7 households (100.0%) falling below the poverty line.
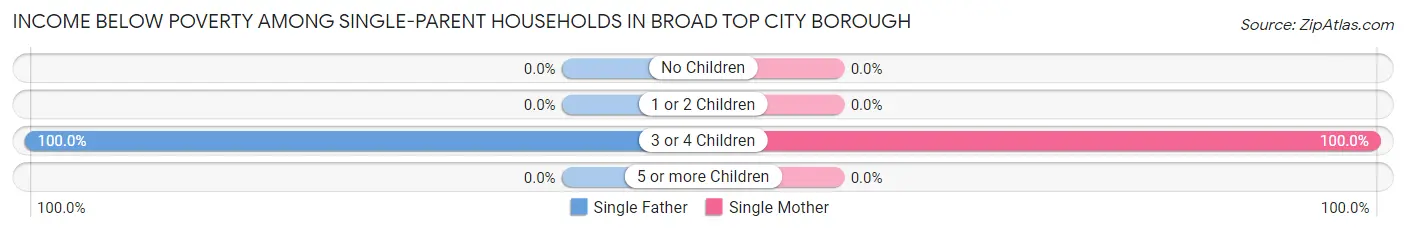
| Children | Single Father | Single Mother |
| No Children | 0 (0.0%) | 0 (0.0%) |
| 1 or 2 Children | 0 (0.0%) | 0 (0.0%) |
| 3 or 4 Children | 1 (100.0%) | 7 (100.0%) |
| 5 or more Children | 0 (0.0%) | 0 (0.0%) |
| Total | 1 (33.3%) | 7 (21.2%) |
Income Below Poverty Among Married-Couple vs Single-Parent Households in Broad Top City borough
The poverty data for Broad Top City borough shows that 6 of the married-couple family households (6.5%) and 8 of the single-parent households (22.2%) are living below the poverty level. Within the married-couple family households, those with 1 or 2 children have the highest poverty rate, with 5 households (26.3%) falling below the poverty line. Among the single-parent households, those with 3 or 4 children have the highest poverty rate, with 8 household (100.0%) living below poverty.
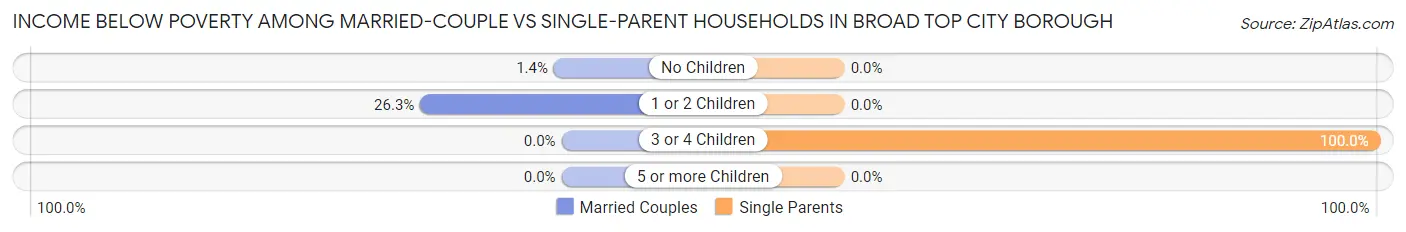
| Children | Married-Couple Families | Single-Parent Households |
| No Children | 1 (1.4%) | 0 (0.0%) |
| 1 or 2 Children | 5 (26.3%) | 0 (0.0%) |
| 3 or 4 Children | 0 (0.0%) | 8 (100.0%) |
| 5 or more Children | 0 (0.0%) | 0 (0.0%) |
| Total | 6 (6.5%) | 8 (22.2%) |
Employment Characteristics in Broad Top City borough
Employment by Class of Employer in Broad Top City borough
Among the 233 employed individuals in Broad Top City borough, private company employees (176 | 75.5%), not-for-profit organizations (20 | 8.6%), and local government employees (15 | 6.4%) make up the most common classes of employment.
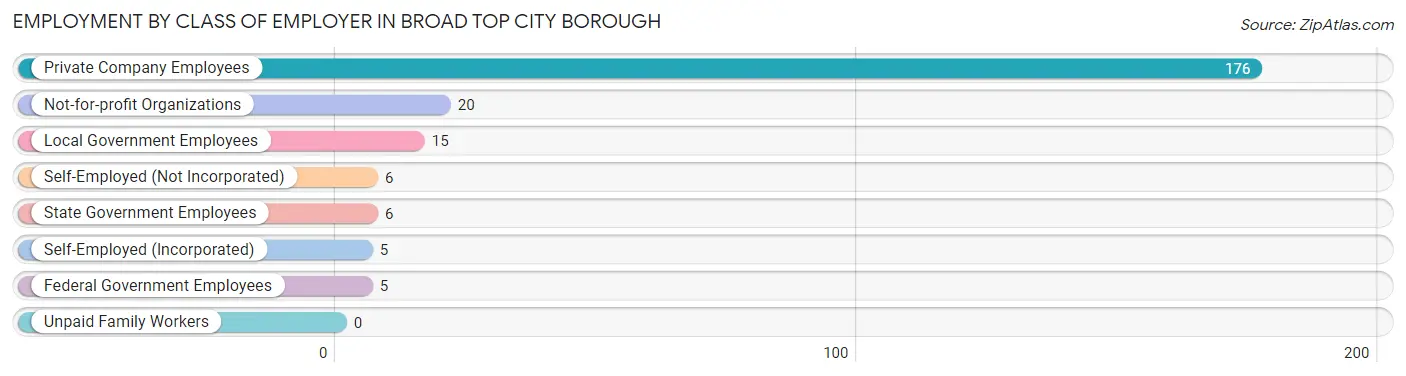
| Employer Class | # Employees | % Employees |
| Private Company Employees | 176 | 75.5% |
| Self-Employed (Incorporated) | 5 | 2.1% |
| Self-Employed (Not Incorporated) | 6 | 2.6% |
| Not-for-profit Organizations | 20 | 8.6% |
| Local Government Employees | 15 | 6.4% |
| State Government Employees | 6 | 2.6% |
| Federal Government Employees | 5 | 2.1% |
| Unpaid Family Workers | 0 | 0.0% |
| Total | 233 | 100.0% |
Employment Status by Age in Broad Top City borough
According to the labor force statistics for Broad Top City borough, out of the total population over 16 years of age (380), 62.6% or 238 individuals are in the labor force, with 0.8% or 2 of them unemployed. The age group with the highest labor force participation rate is 30 to 34 years, with 100.0% or 9 individuals in the labor force. Within the labor force, the 30 to 34 years age range has the highest percentage of unemployed individuals, with 11.1% or 1 of them being unemployed.
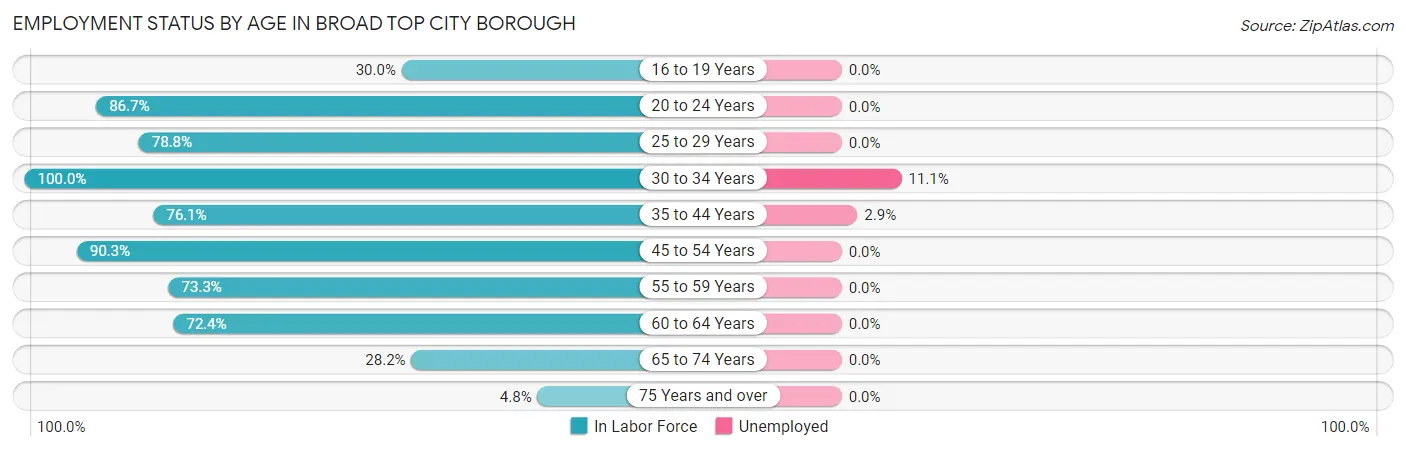
| Age Bracket | In Labor Force | Unemployed |
| 16 to 19 Years | 3 (30.0%) | 0 (0.0%) |
| 20 to 24 Years | 52 (86.7%) | 0 (0.0%) |
| 25 to 29 Years | 26 (78.8%) | 0 (0.0%) |
| 30 to 34 Years | 9 (100.0%) | 1 (11.1%) |
| 35 to 44 Years | 35 (76.1%) | 1 (2.9%) |
| 45 to 54 Years | 56 (90.3%) | 0 (0.0%) |
| 55 to 59 Years | 22 (73.3%) | 0 (0.0%) |
| 60 to 64 Years | 21 (72.4%) | 0 (0.0%) |
| 65 to 74 Years | 11 (28.2%) | 0 (0.0%) |
| 75 Years and over | 3 (4.8%) | 0 (0.0%) |
| Total | 238 (62.6%) | 2 (0.8%) |
Employment Status by Educational Attainment in Broad Top City borough
According to labor force statistics for Broad Top City borough, 80.9% of individuals (169) out of the total population between 25 and 64 years of age (209) are in the labor force, with 1.2% or 2 of them being unemployed. The group with the highest labor force participation rate are those with the educational attainment of less than high school, with 100.0% or 10 individuals in the labor force. Within the labor force, individuals with high school diploma education have the highest percentage of unemployment, with 2.3% or 2 of them being unemployed.
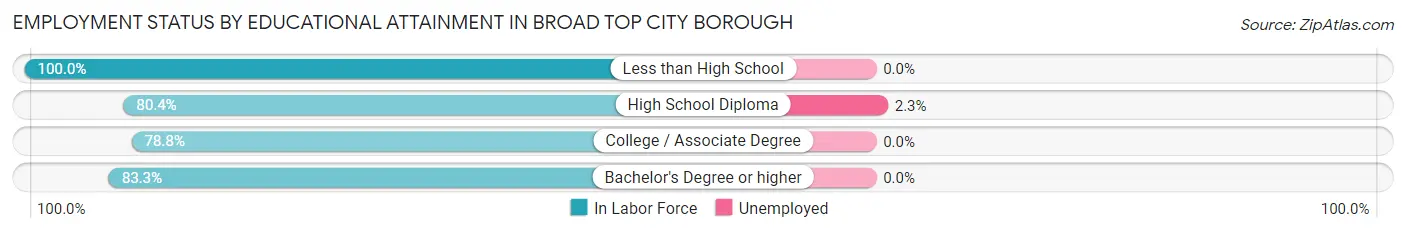
| Educational Attainment | In Labor Force | Unemployed |
| Less than High School | 10 (100.0%) | 0 (0.0%) |
| High School Diploma | 86 (80.4%) | 2 (2.3%) |
| College / Associate Degree | 63 (78.8%) | 0 (0.0%) |
| Bachelor's Degree or higher | 10 (83.3%) | 0 (0.0%) |
| Total | 169 (80.9%) | 3 (1.2%) |
Employment Occupations by Sex in Broad Top City borough
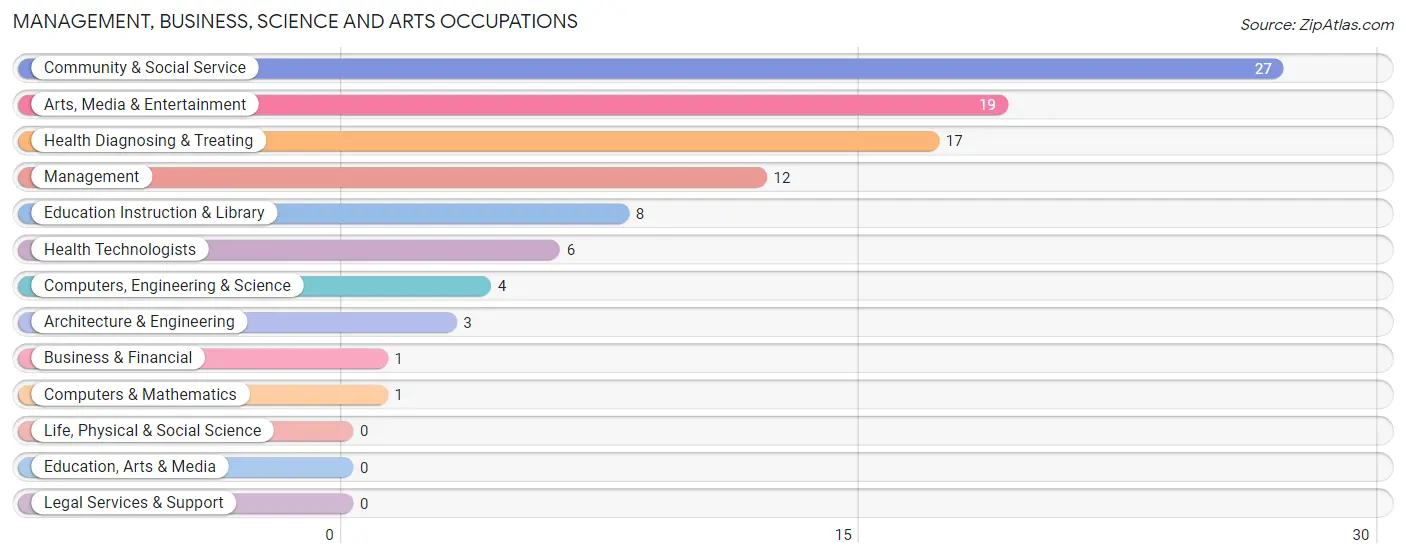
Management, Business, Science and Arts Occupations
The most common Management, Business, Science and Arts occupations in Broad Top City borough are Community & Social Service (27 | 11.4%), Arts, Media & Entertainment (19 | 8.1%), Health Diagnosing & Treating (17 | 7.2%), Management (12 | 5.1%), and Education Instruction & Library (8 | 3.4%).
Management, Business, Science and Arts Occupations by Sex
Within the Management, Business, Science and Arts occupations in Broad Top City borough, the most male-oriented occupations are Computers, Engineering & Science (100.0%), Computers & Mathematics (100.0%), and Architecture & Engineering (100.0%), while the most female-oriented occupations are Business & Financial (100.0%), Education Instruction & Library (100.0%), and Health Diagnosing & Treating (100.0%).
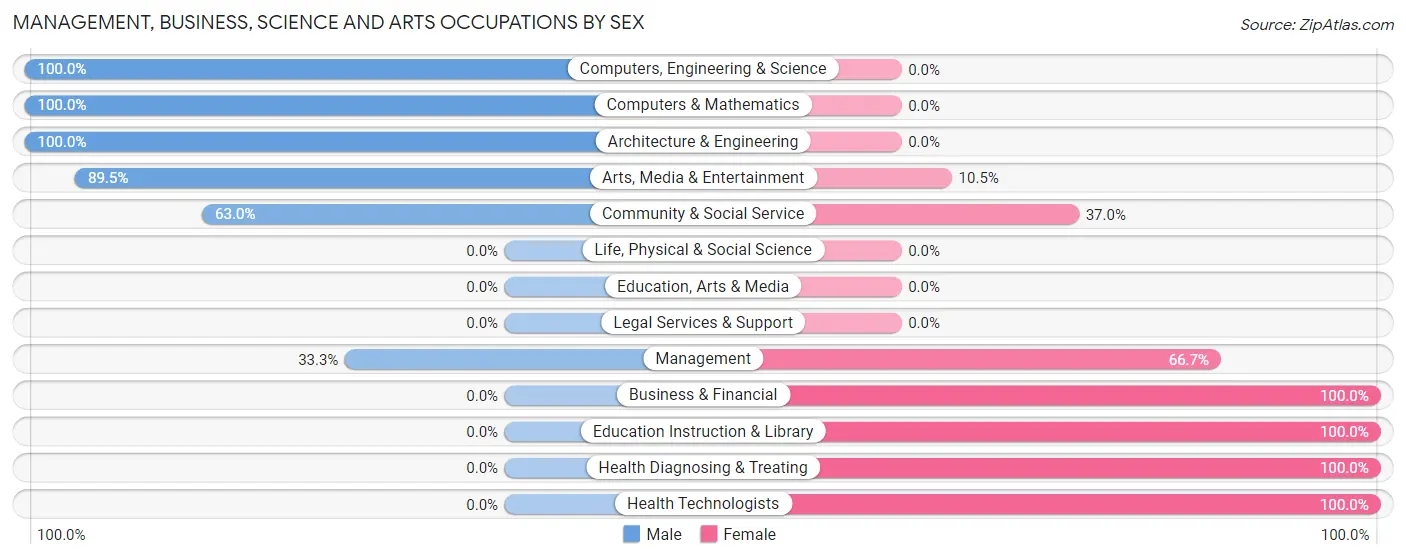
| Occupation | Male | Female |
| Management | 4 (33.3%) | 8 (66.7%) |
| Business & Financial | 0 (0.0%) | 1 (100.0%) |
| Computers, Engineering & Science | 4 (100.0%) | 0 (0.0%) |
| Computers & Mathematics | 1 (100.0%) | 0 (0.0%) |
| Architecture & Engineering | 3 (100.0%) | 0 (0.0%) |
| Life, Physical & Social Science | 0 (0.0%) | 0 (0.0%) |
| Community & Social Service | 17 (63.0%) | 10 (37.0%) |
| Education, Arts & Media | 0 (0.0%) | 0 (0.0%) |
| Legal Services & Support | 0 (0.0%) | 0 (0.0%) |
| Education Instruction & Library | 0 (0.0%) | 8 (100.0%) |
| Arts, Media & Entertainment | 17 (89.5%) | 2 (10.5%) |
| Health Diagnosing & Treating | 0 (0.0%) | 17 (100.0%) |
| Health Technologists | 0 (0.0%) | 6 (100.0%) |
| Total (Category) | 25 (41.0%) | 36 (59.0%) |
| Total (Overall) | 146 (61.9%) | 90 (38.1%) |
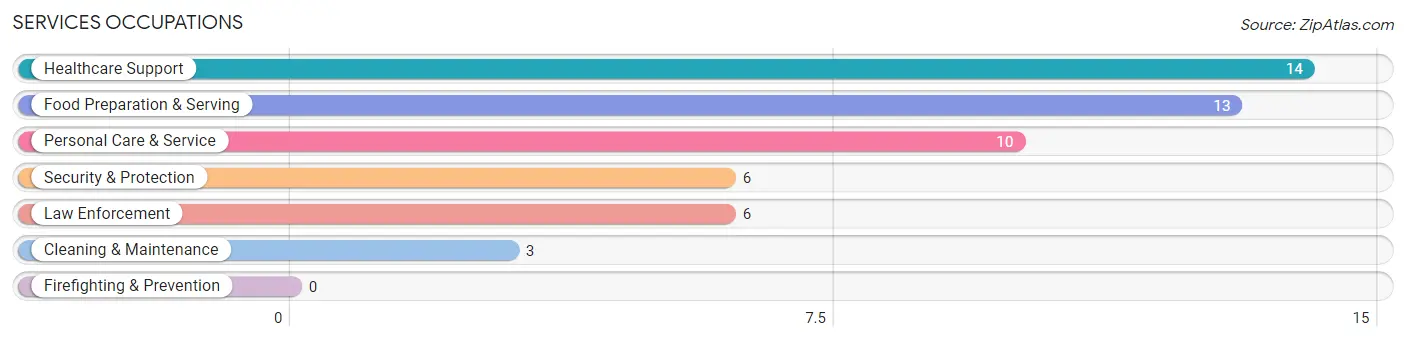
Services Occupations
The most common Services occupations in Broad Top City borough are Healthcare Support (14 | 5.9%), Food Preparation & Serving (13 | 5.5%), Personal Care & Service (10 | 4.2%), Security & Protection (6 | 2.5%), and Law Enforcement (6 | 2.5%).
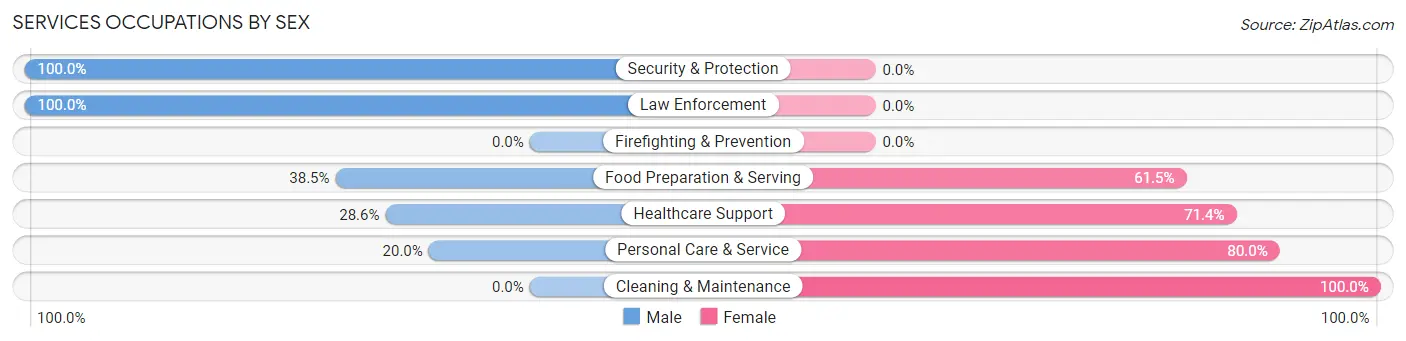
Services Occupations by Sex
Within the Services occupations in Broad Top City borough, the most male-oriented occupations are Security & Protection (100.0%), Law Enforcement (100.0%), and Food Preparation & Serving (38.5%), while the most female-oriented occupations are Cleaning & Maintenance (100.0%), Personal Care & Service (80.0%), and Healthcare Support (71.4%).
| Occupation | Male | Female |
| Healthcare Support | 4 (28.6%) | 10 (71.4%) |
| Security & Protection | 6 (100.0%) | 0 (0.0%) |
| Firefighting & Prevention | 0 (0.0%) | 0 (0.0%) |
| Law Enforcement | 6 (100.0%) | 0 (0.0%) |
| Food Preparation & Serving | 5 (38.5%) | 8 (61.5%) |
| Cleaning & Maintenance | 0 (0.0%) | 3 (100.0%) |
| Personal Care & Service | 2 (20.0%) | 8 (80.0%) |
| Total (Category) | 17 (37.0%) | 29 (63.0%) |
| Total (Overall) | 146 (61.9%) | 90 (38.1%) |
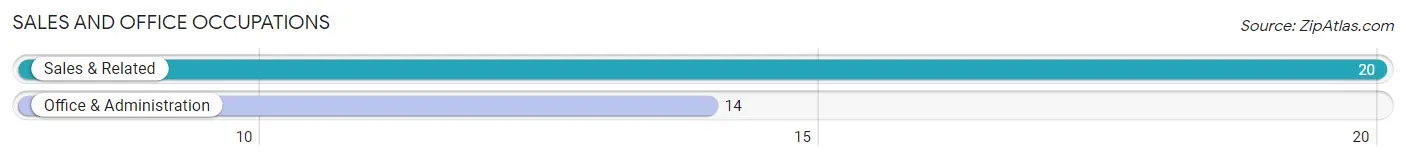
Sales and Office Occupations
The most common Sales and Office occupations in Broad Top City borough are Sales & Related (20 | 8.5%), and Office & Administration (14 | 5.9%).
Sales and Office Occupations by Sex
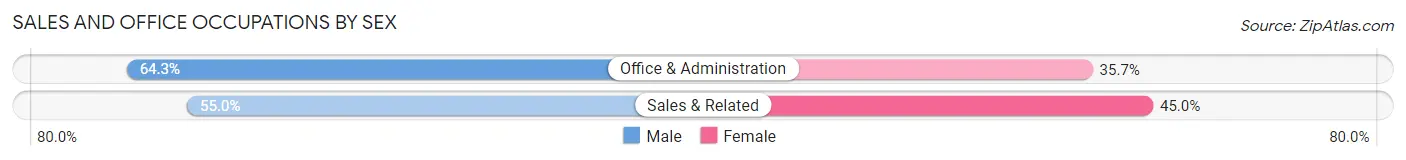
| Occupation | Male | Female |
| Sales & Related | 11 (55.0%) | 9 (45.0%) |
| Office & Administration | 9 (64.3%) | 5 (35.7%) |
| Total (Category) | 20 (58.8%) | 14 (41.2%) |
| Total (Overall) | 146 (61.9%) | 90 (38.1%) |
Natural Resources, Construction and Maintenance Occupations
The most common Natural Resources, Construction and Maintenance occupations in Broad Top City borough are Construction & Extraction (35 | 14.8%), Installation, Maintenance & Repair (7 | 3.0%), and Farming, Fishing & Forestry (2 | 0.9%).
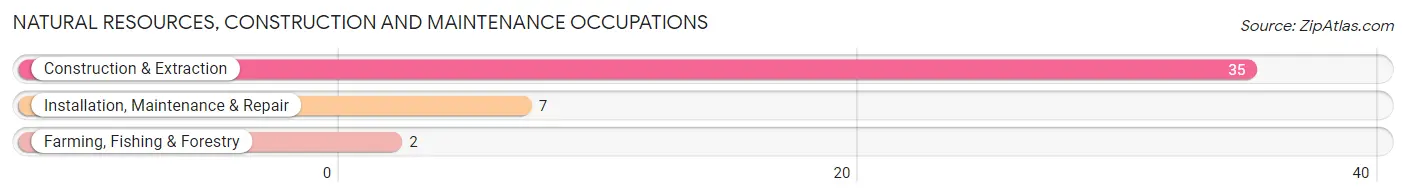
Natural Resources, Construction and Maintenance Occupations by Sex
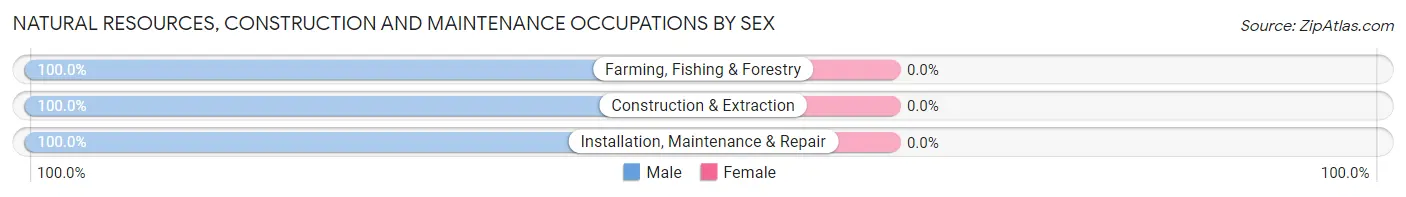
| Occupation | Male | Female |
| Farming, Fishing & Forestry | 2 (100.0%) | 0 (0.0%) |
| Construction & Extraction | 35 (100.0%) | 0 (0.0%) |
| Installation, Maintenance & Repair | 7 (100.0%) | 0 (0.0%) |
| Total (Category) | 44 (100.0%) | 0 (0.0%) |
| Total (Overall) | 146 (61.9%) | 90 (38.1%) |
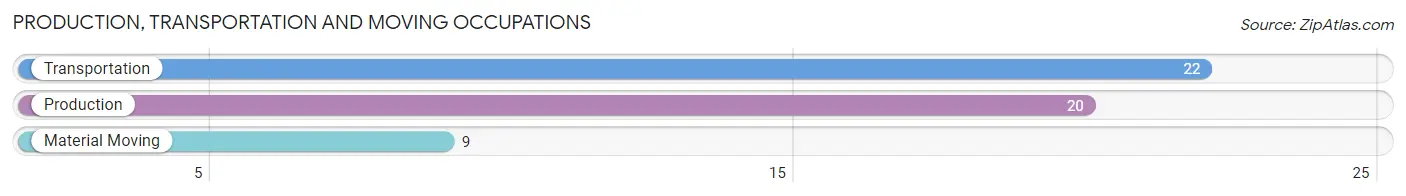
Production, Transportation and Moving Occupations
The most common Production, Transportation and Moving occupations in Broad Top City borough are Transportation (22 | 9.3%), Production (20 | 8.5%), and Material Moving (9 | 3.8%).
Production, Transportation and Moving Occupations by Sex
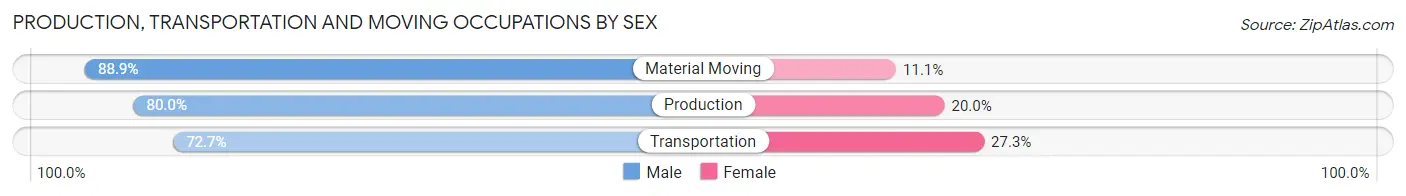
| Occupation | Male | Female |
| Production | 16 (80.0%) | 4 (20.0%) |
| Transportation | 16 (72.7%) | 6 (27.3%) |
| Material Moving | 8 (88.9%) | 1 (11.1%) |
| Total (Category) | 40 (78.4%) | 11 (21.6%) |
| Total (Overall) | 146 (61.9%) | 90 (38.1%) |
Employment Industries by Sex in Broad Top City borough
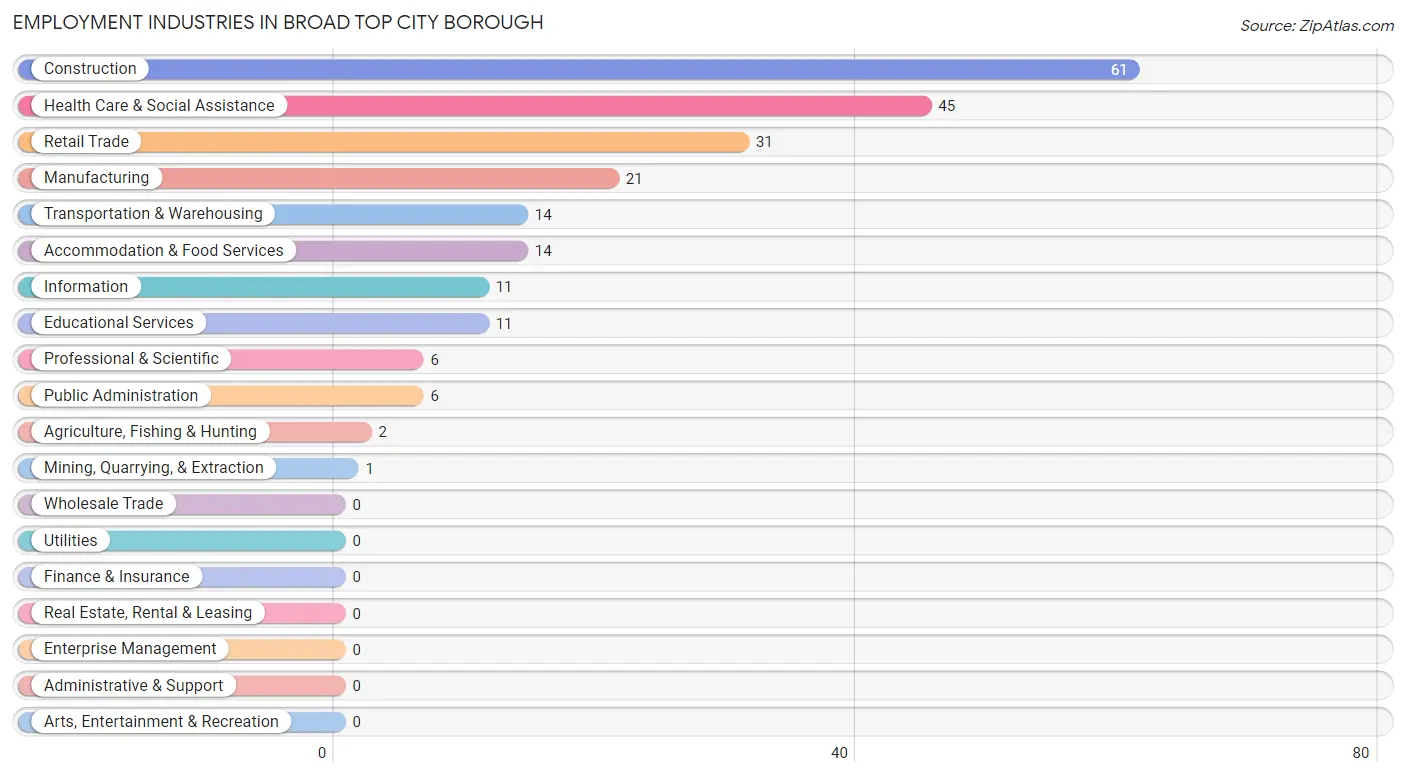
Employment Industries in Broad Top City borough
The major employment industries in Broad Top City borough include Construction (61 | 25.9%), Health Care & Social Assistance (45 | 19.1%), Retail Trade (31 | 13.1%), Manufacturing (21 | 8.9%), and Transportation & Warehousing (14 | 5.9%).
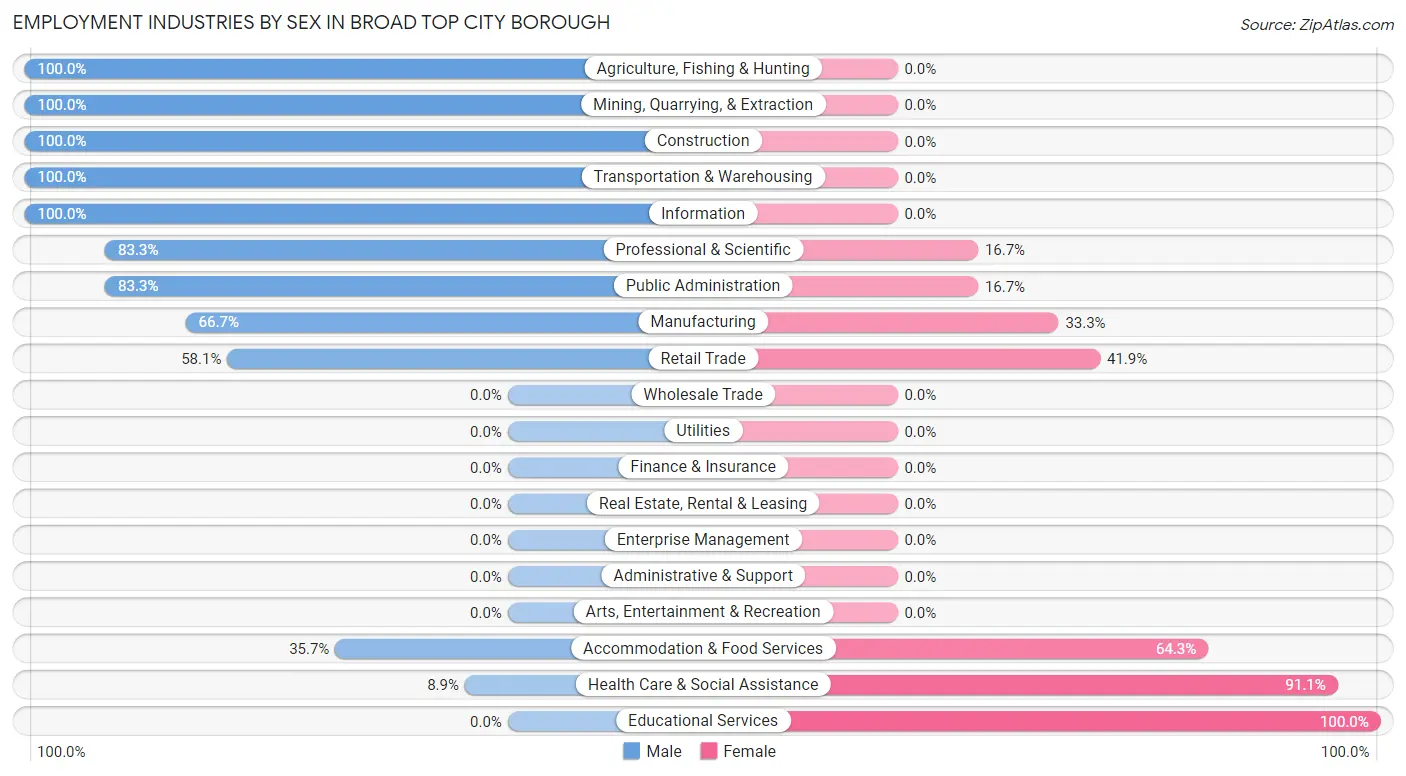
Employment Industries by Sex in Broad Top City borough
The Broad Top City borough industries that see more men than women are Agriculture, Fishing & Hunting (100.0%), Mining, Quarrying, & Extraction (100.0%), and Construction (100.0%), whereas the industries that tend to have a higher number of women are Educational Services (100.0%), Health Care & Social Assistance (91.1%), and Accommodation & Food Services (64.3%).
| Industry | Male | Female |
| Agriculture, Fishing & Hunting | 2 (100.0%) | 0 (0.0%) |
| Mining, Quarrying, & Extraction | 1 (100.0%) | 0 (0.0%) |
| Construction | 61 (100.0%) | 0 (0.0%) |
| Manufacturing | 14 (66.7%) | 7 (33.3%) |
| Wholesale Trade | 0 (0.0%) | 0 (0.0%) |
| Retail Trade | 18 (58.1%) | 13 (41.9%) |
| Transportation & Warehousing | 14 (100.0%) | 0 (0.0%) |
| Utilities | 0 (0.0%) | 0 (0.0%) |
| Information | 11 (100.0%) | 0 (0.0%) |
| Finance & Insurance | 0 (0.0%) | 0 (0.0%) |
| Real Estate, Rental & Leasing | 0 (0.0%) | 0 (0.0%) |
| Professional & Scientific | 5 (83.3%) | 1 (16.7%) |
| Enterprise Management | 0 (0.0%) | 0 (0.0%) |
| Administrative & Support | 0 (0.0%) | 0 (0.0%) |
| Educational Services | 0 (0.0%) | 11 (100.0%) |
| Health Care & Social Assistance | 4 (8.9%) | 41 (91.1%) |
| Arts, Entertainment & Recreation | 0 (0.0%) | 0 (0.0%) |
| Accommodation & Food Services | 5 (35.7%) | 9 (64.3%) |
| Public Administration | 5 (83.3%) | 1 (16.7%) |
| Total | 146 (61.9%) | 90 (38.1%) |
Education in Broad Top City borough
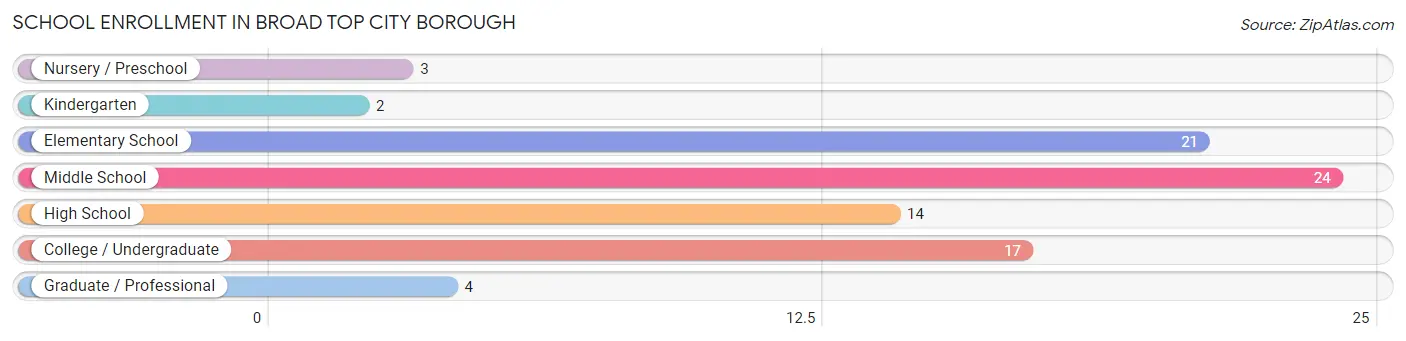
School Enrollment in Broad Top City borough
The most common levels of schooling among the 85 students in Broad Top City borough are middle school (24 | 28.2%), elementary school (21 | 24.7%), and college / undergraduate (17 | 20.0%).
| School Level | # Students | % Students |
| Nursery / Preschool | 3 | 3.5% |
| Kindergarten | 2 | 2.4% |
| Elementary School | 21 | 24.7% |
| Middle School | 24 | 28.2% |
| High School | 14 | 16.5% |
| College / Undergraduate | 17 | 20.0% |
| Graduate / Professional | 4 | 4.7% |
| Total | 85 | 100.0% |
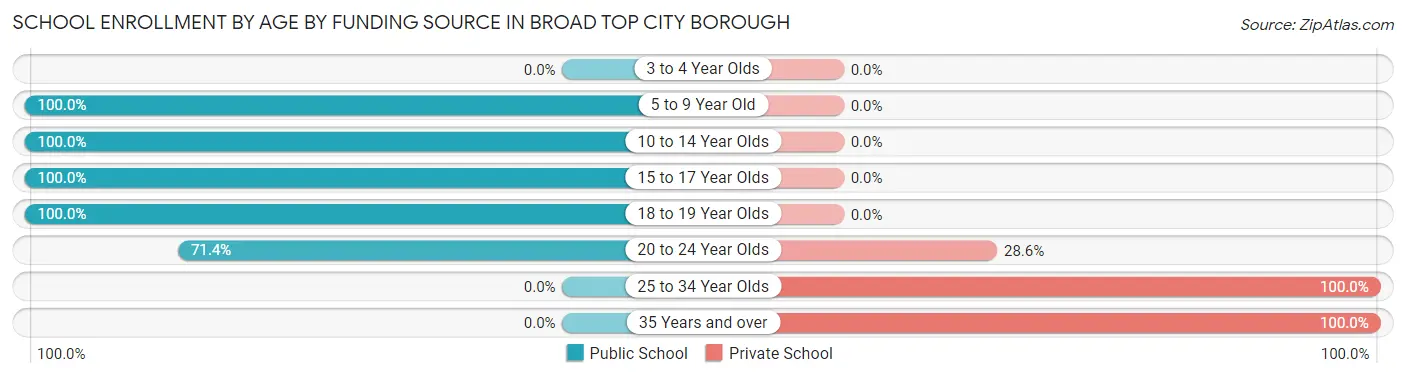
School Enrollment by Age by Funding Source in Broad Top City borough
Out of a total of 85 students who are enrolled in schools in Broad Top City borough, 11 (12.9%) attend a private institution, while the remaining 74 (87.1%) are enrolled in public schools. The age group of 25 to 34 year olds has the highest likelihood of being enrolled in private schools, with 5 (100.0% in the age bracket) enrolled. Conversely, the age group of 5 to 9 year old has the lowest likelihood of being enrolled in a private school, with 20 (100.0% in the age bracket) attending a public institution.
| Age Bracket | Public School | Private School |
| 3 to 4 Year Olds | 0 (0.0%) | 0 (0.0%) |
| 5 to 9 Year Old | 20 (100.0%) | 0 (0.0%) |
| 10 to 14 Year Olds | 32 (100.0%) | 0 (0.0%) |
| 15 to 17 Year Olds | 10 (100.0%) | 0 (0.0%) |
| 18 to 19 Year Olds | 2 (100.0%) | 0 (0.0%) |
| 20 to 24 Year Olds | 10 (71.4%) | 4 (28.6%) |
| 25 to 34 Year Olds | 0 (0.0%) | 5 (100.0%) |
| 35 Years and over | 0 (0.0%) | 2 (100.0%) |
| Total | 74 (87.1%) | 11 (12.9%) |
Educational Attainment by Field of Study in Broad Top City borough
Education (17 | 51.5%), social sciences (7 | 21.2%), business (4 | 12.1%), arts & humanities (2 | 6.1%), and physical & health sciences (1 | 3.0%) are the most common fields of study among 33 individuals in Broad Top City borough who have obtained a bachelor's degree or higher.
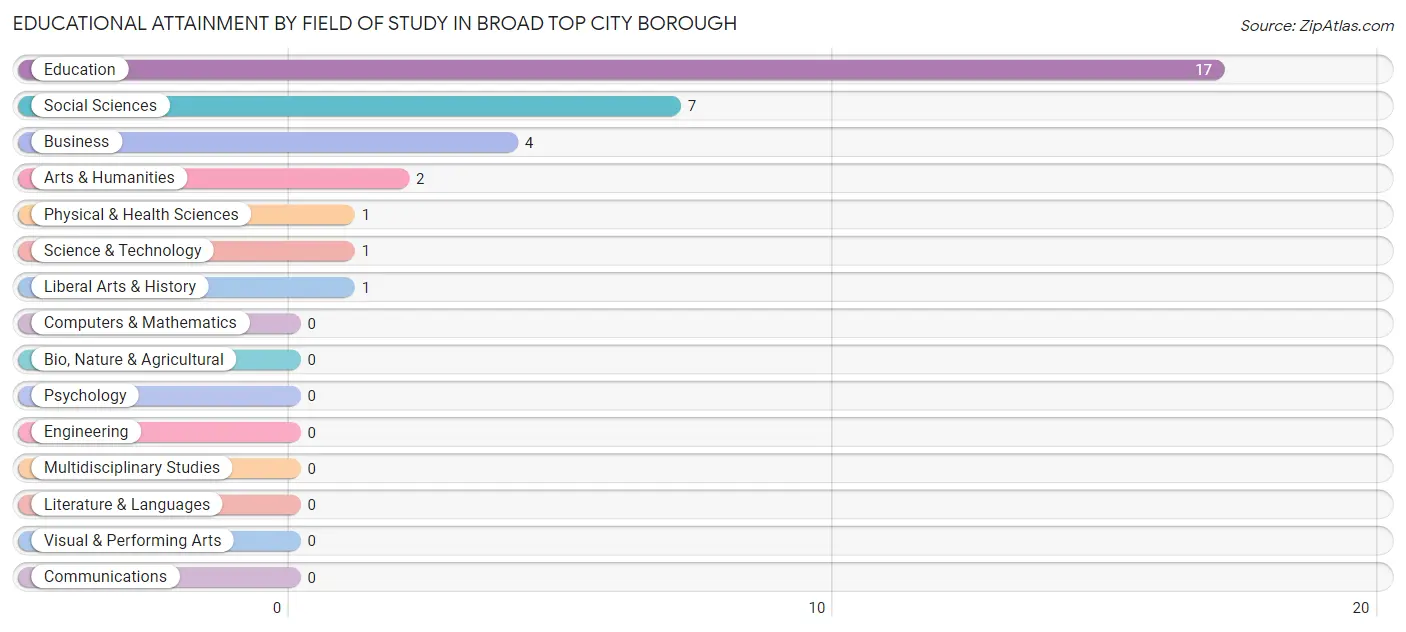
| Field of Study | # Graduates | % Graduates |
| Computers & Mathematics | 0 | 0.0% |
| Bio, Nature & Agricultural | 0 | 0.0% |
| Physical & Health Sciences | 1 | 3.0% |
| Psychology | 0 | 0.0% |
| Social Sciences | 7 | 21.2% |
| Engineering | 0 | 0.0% |
| Multidisciplinary Studies | 0 | 0.0% |
| Science & Technology | 1 | 3.0% |
| Business | 4 | 12.1% |
| Education | 17 | 51.5% |
| Literature & Languages | 0 | 0.0% |
| Liberal Arts & History | 1 | 3.0% |
| Visual & Performing Arts | 0 | 0.0% |
| Communications | 0 | 0.0% |
| Arts & Humanities | 2 | 6.1% |
| Total | 33 | 100.0% |
Transportation & Commute in Broad Top City borough
Vehicle Availability by Sex in Broad Top City borough
The most prevalent vehicle ownership categories in Broad Top City borough are males with 2 vehicles (69, accounting for 48.2%) and females with 2 vehicles (36, making up 76.7%).
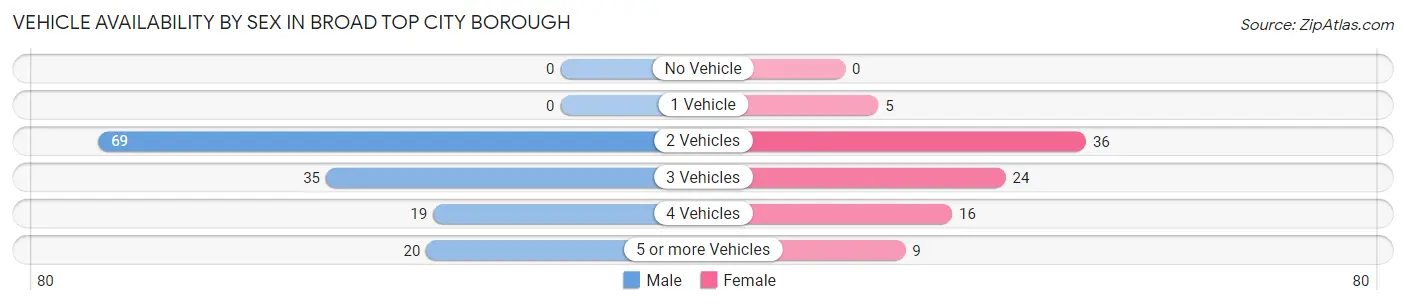
| Vehicles Available | Male | Female |
| No Vehicle | 0 (0.0%) | 0 (0.0%) |
| 1 Vehicle | 0 (0.0%) | 5 (5.6%) |
| 2 Vehicles | 69 (48.2%) | 36 (40.0%) |
| 3 Vehicles | 35 (24.5%) | 24 (26.7%) |
| 4 Vehicles | 19 (13.3%) | 16 (17.8%) |
| 5 or more Vehicles | 20 (14.0%) | 9 (10.0%) |
| Total | 143 (100.0%) | 90 (100.0%) |
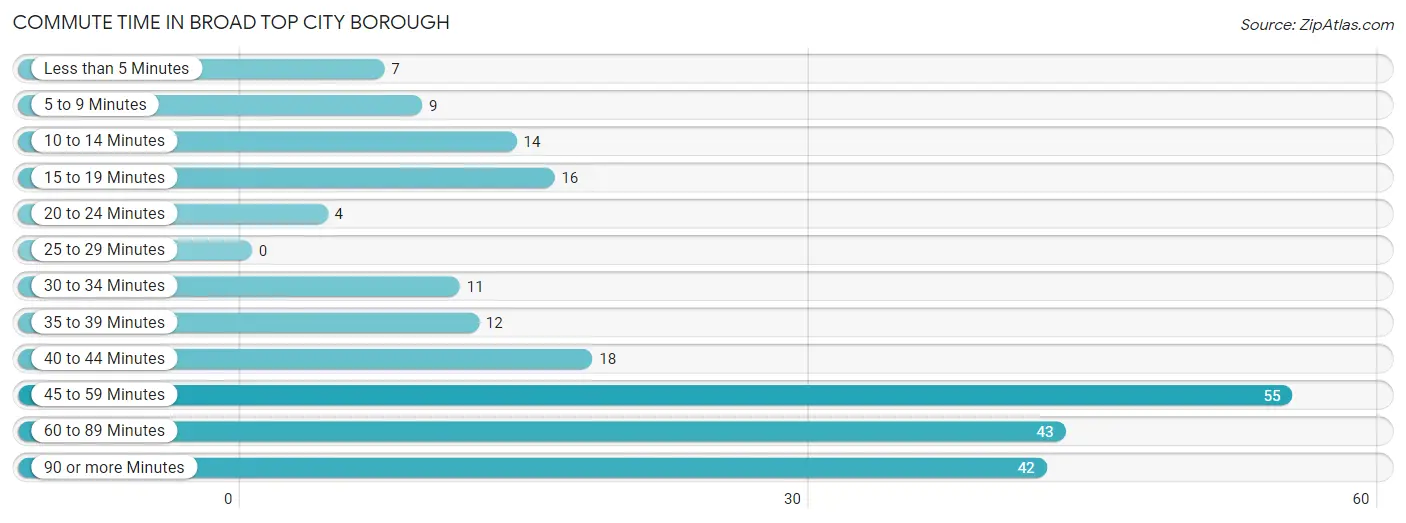
Commute Time in Broad Top City borough
The most frequently occuring commute durations in Broad Top City borough are 45 to 59 minutes (55 commuters, 23.8%), 60 to 89 minutes (43 commuters, 18.6%), and 90 or more minutes (42 commuters, 18.2%).
| Commute Time | # Commuters | % Commuters |
| Less than 5 Minutes | 7 | 3.0% |
| 5 to 9 Minutes | 9 | 3.9% |
| 10 to 14 Minutes | 14 | 6.1% |
| 15 to 19 Minutes | 16 | 6.9% |
| 20 to 24 Minutes | 4 | 1.7% |
| 25 to 29 Minutes | 0 | 0.0% |
| 30 to 34 Minutes | 11 | 4.8% |
| 35 to 39 Minutes | 12 | 5.2% |
| 40 to 44 Minutes | 18 | 7.8% |
| 45 to 59 Minutes | 55 | 23.8% |
| 60 to 89 Minutes | 43 | 18.6% |
| 90 or more Minutes | 42 | 18.2% |
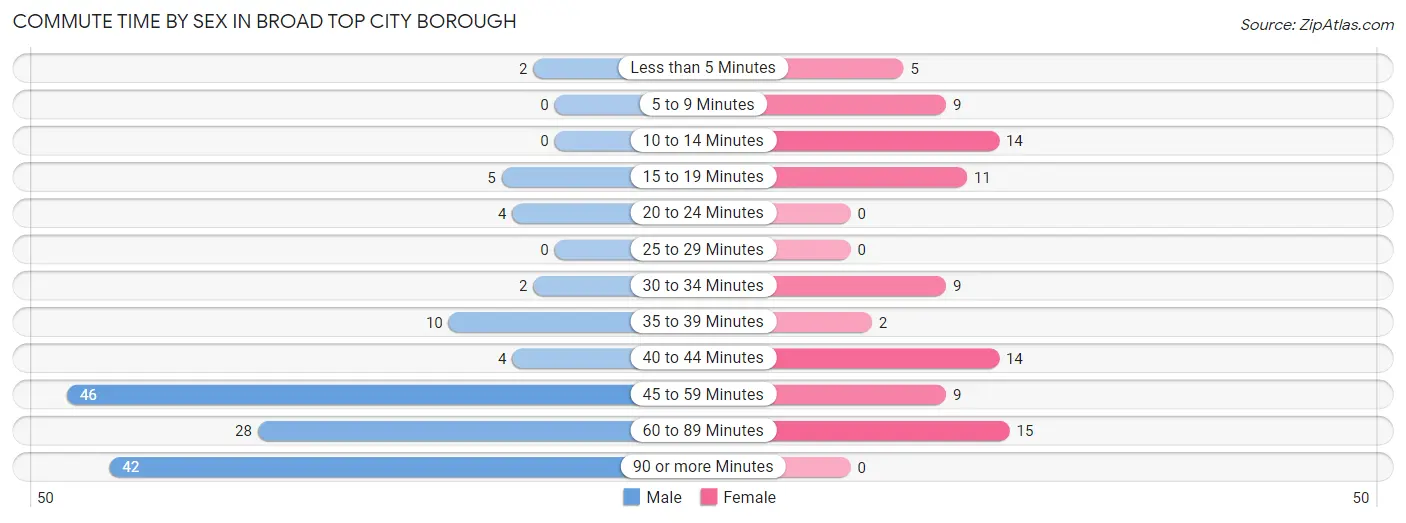
Commute Time by Sex in Broad Top City borough
The most common commute times in Broad Top City borough are 45 to 59 minutes (46 commuters, 32.2%) for males and 60 to 89 minutes (15 commuters, 17.1%) for females.
| Commute Time | Male | Female |
| Less than 5 Minutes | 2 (1.4%) | 5 (5.7%) |
| 5 to 9 Minutes | 0 (0.0%) | 9 (10.2%) |
| 10 to 14 Minutes | 0 (0.0%) | 14 (15.9%) |
| 15 to 19 Minutes | 5 (3.5%) | 11 (12.5%) |
| 20 to 24 Minutes | 4 (2.8%) | 0 (0.0%) |
| 25 to 29 Minutes | 0 (0.0%) | 0 (0.0%) |
| 30 to 34 Minutes | 2 (1.4%) | 9 (10.2%) |
| 35 to 39 Minutes | 10 (7.0%) | 2 (2.3%) |
| 40 to 44 Minutes | 4 (2.8%) | 14 (15.9%) |
| 45 to 59 Minutes | 46 (32.2%) | 9 (10.2%) |
| 60 to 89 Minutes | 28 (19.6%) | 15 (17.1%) |
| 90 or more Minutes | 42 (29.4%) | 0 (0.0%) |
Time of Departure to Work by Sex in Broad Top City borough
The most frequent times of departure to work in Broad Top City borough are 12:00 AM to 4:59 AM (92, 64.3%) for males and 7:00 AM to 7:29 AM (28, 31.8%) for females.
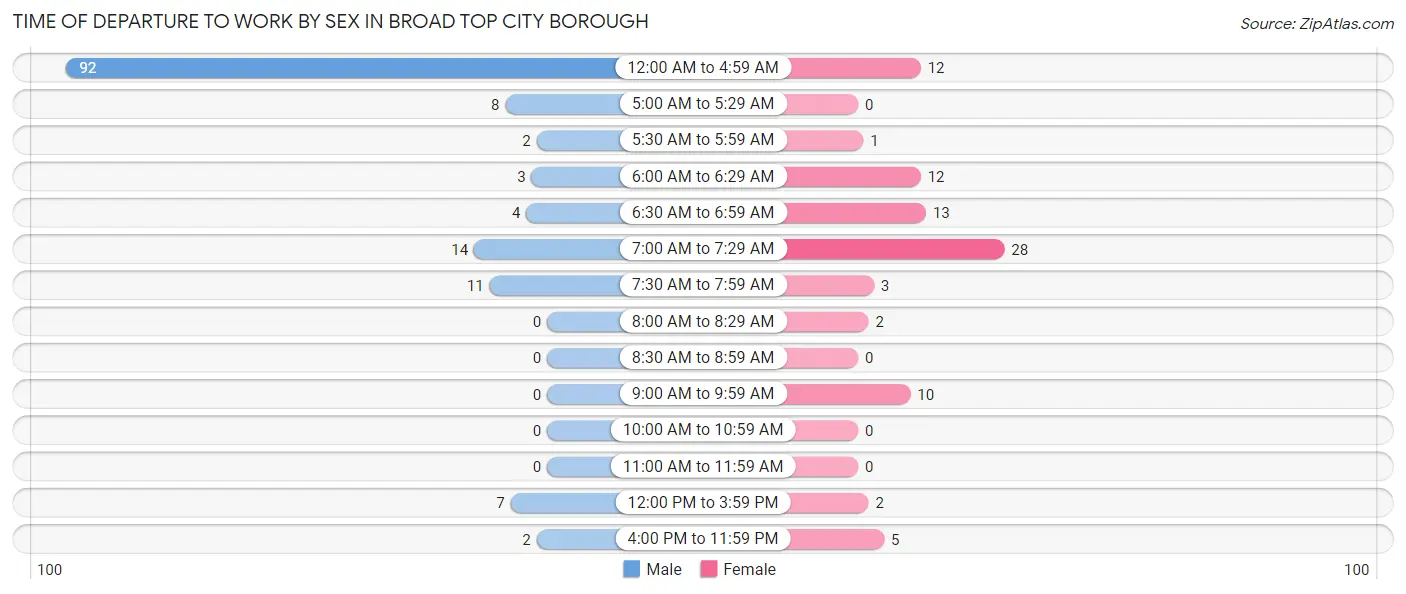
| Time of Departure | Male | Female |
| 12:00 AM to 4:59 AM | 92 (64.3%) | 12 (13.6%) |
| 5:00 AM to 5:29 AM | 8 (5.6%) | 0 (0.0%) |
| 5:30 AM to 5:59 AM | 2 (1.4%) | 1 (1.1%) |
| 6:00 AM to 6:29 AM | 3 (2.1%) | 12 (13.6%) |
| 6:30 AM to 6:59 AM | 4 (2.8%) | 13 (14.8%) |
| 7:00 AM to 7:29 AM | 14 (9.8%) | 28 (31.8%) |
| 7:30 AM to 7:59 AM | 11 (7.7%) | 3 (3.4%) |
| 8:00 AM to 8:29 AM | 0 (0.0%) | 2 (2.3%) |
| 8:30 AM to 8:59 AM | 0 (0.0%) | 0 (0.0%) |
| 9:00 AM to 9:59 AM | 0 (0.0%) | 10 (11.4%) |
| 10:00 AM to 10:59 AM | 0 (0.0%) | 0 (0.0%) |
| 11:00 AM to 11:59 AM | 0 (0.0%) | 0 (0.0%) |
| 12:00 PM to 3:59 PM | 7 (4.9%) | 2 (2.3%) |
| 4:00 PM to 11:59 PM | 2 (1.4%) | 5 (5.7%) |
| Total | 143 (100.0%) | 88 (100.0%) |
Housing Occupancy in Broad Top City borough
Occupancy by Ownership in Broad Top City borough
Of the total 173 dwellings in Broad Top City borough, owner-occupied units account for 132 (76.3%), while renter-occupied units make up 41 (23.7%).
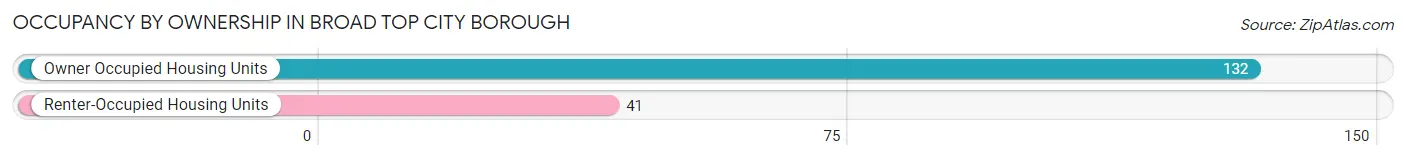
| Occupancy | # Housing Units | % Housing Units |
| Owner Occupied Housing Units | 132 | 76.3% |
| Renter-Occupied Housing Units | 41 | 23.7% |
| Total Occupied Housing Units | 173 | 100.0% |
Occupancy by Household Size in Broad Top City borough
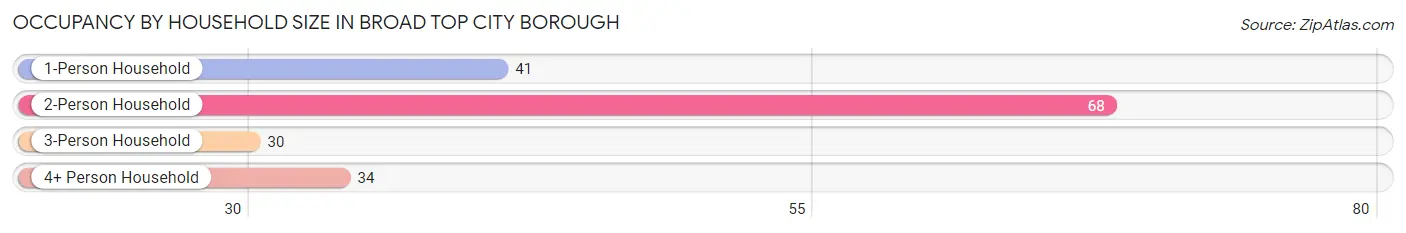
| Household Size | # Housing Units | % Housing Units |
| 1-Person Household | 41 | 23.7% |
| 2-Person Household | 68 | 39.3% |
| 3-Person Household | 30 | 17.3% |
| 4+ Person Household | 34 | 19.7% |
| Total Housing Units | 173 | 100.0% |
Occupancy by Ownership by Household Size in Broad Top City borough
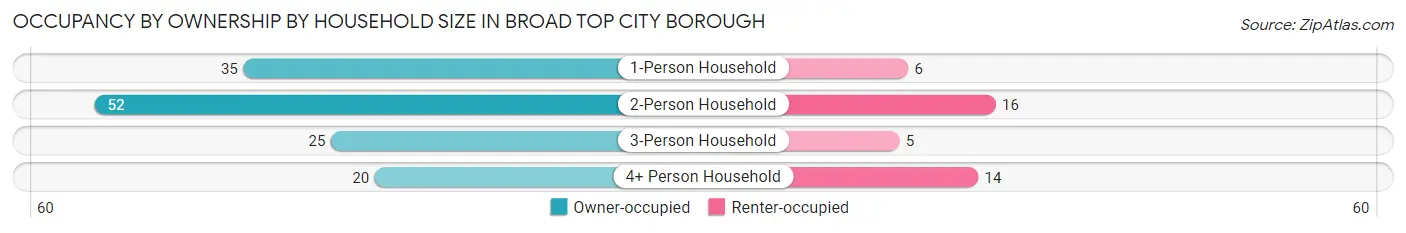
| Household Size | Owner-occupied | Renter-occupied |
| 1-Person Household | 35 (85.4%) | 6 (14.6%) |
| 2-Person Household | 52 (76.5%) | 16 (23.5%) |
| 3-Person Household | 25 (83.3%) | 5 (16.7%) |
| 4+ Person Household | 20 (58.8%) | 14 (41.2%) |
| Total Housing Units | 132 (76.3%) | 41 (23.7%) |
Occupancy by Educational Attainment in Broad Top City borough
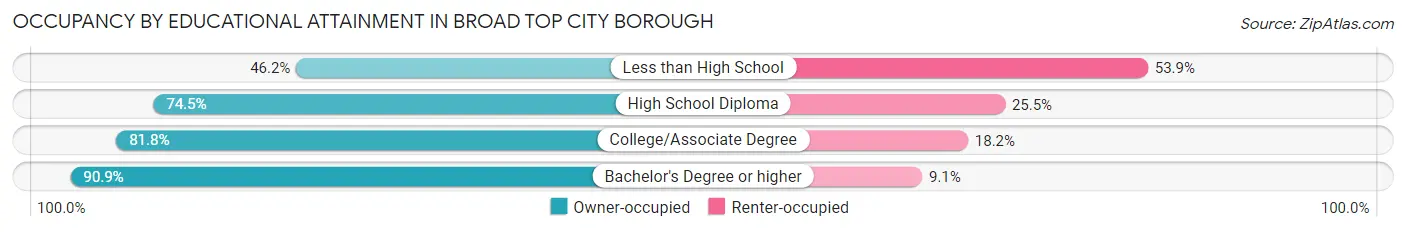
| Household Size | Owner-occupied | Renter-occupied |
| Less than High School | 6 (46.2%) | 7 (53.8%) |
| High School Diploma | 70 (74.5%) | 24 (25.5%) |
| College/Associate Degree | 36 (81.8%) | 8 (18.2%) |
| Bachelor's Degree or higher | 20 (90.9%) | 2 (9.1%) |
Occupancy by Age of Householder in Broad Top City borough
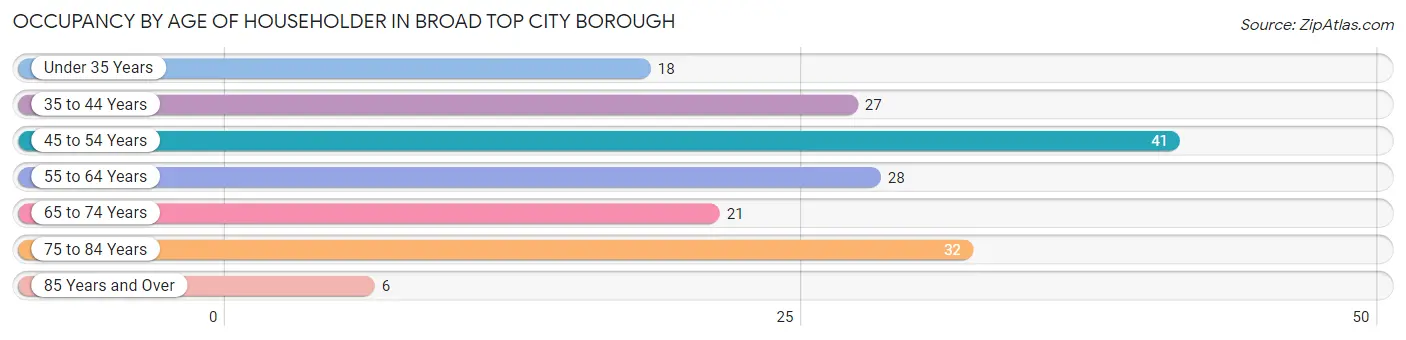
| Age Bracket | # Households | % Households |
| Under 35 Years | 18 | 10.4% |
| 35 to 44 Years | 27 | 15.6% |
| 45 to 54 Years | 41 | 23.7% |
| 55 to 64 Years | 28 | 16.2% |
| 65 to 74 Years | 21 | 12.1% |
| 75 to 84 Years | 32 | 18.5% |
| 85 Years and Over | 6 | 3.5% |
| Total | 173 | 100.0% |
Housing Finances in Broad Top City borough
Median Income by Occupancy in Broad Top City borough
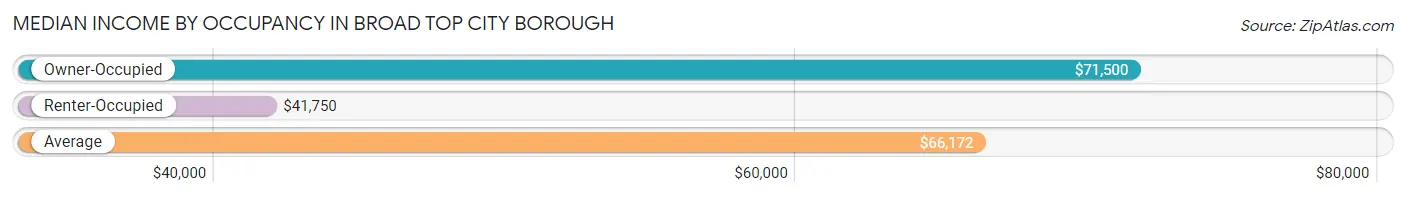
| Occupancy Type | # Households | Median Income |
| Owner-Occupied | 132 (76.3%) | $71,500 |
| Renter-Occupied | 41 (23.7%) | $41,750 |
| Average | 173 (100.0%) | $66,172 |
Occupancy by Householder Income Bracket in Broad Top City borough
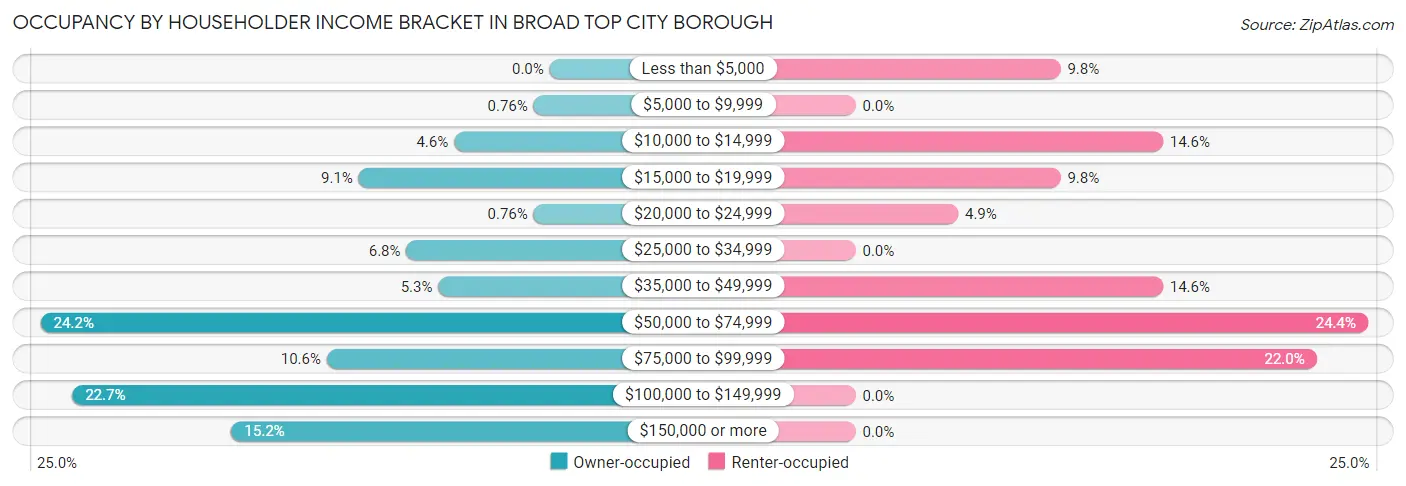
| Income Bracket | Owner-occupied | Renter-occupied |
| Less than $5,000 | 0 (0.0%) | 4 (9.8%) |
| $5,000 to $9,999 | 1 (0.8%) | 0 (0.0%) |
| $10,000 to $14,999 | 6 (4.5%) | 6 (14.6%) |
| $15,000 to $19,999 | 12 (9.1%) | 4 (9.8%) |
| $20,000 to $24,999 | 1 (0.8%) | 2 (4.9%) |
| $25,000 to $34,999 | 9 (6.8%) | 0 (0.0%) |
| $35,000 to $49,999 | 7 (5.3%) | 6 (14.6%) |
| $50,000 to $74,999 | 32 (24.2%) | 10 (24.4%) |
| $75,000 to $99,999 | 14 (10.6%) | 9 (22.0%) |
| $100,000 to $149,999 | 30 (22.7%) | 0 (0.0%) |
| $150,000 or more | 20 (15.1%) | 0 (0.0%) |
| Total | 132 (100.0%) | 41 (100.0%) |
Monthly Housing Cost Tiers in Broad Top City borough
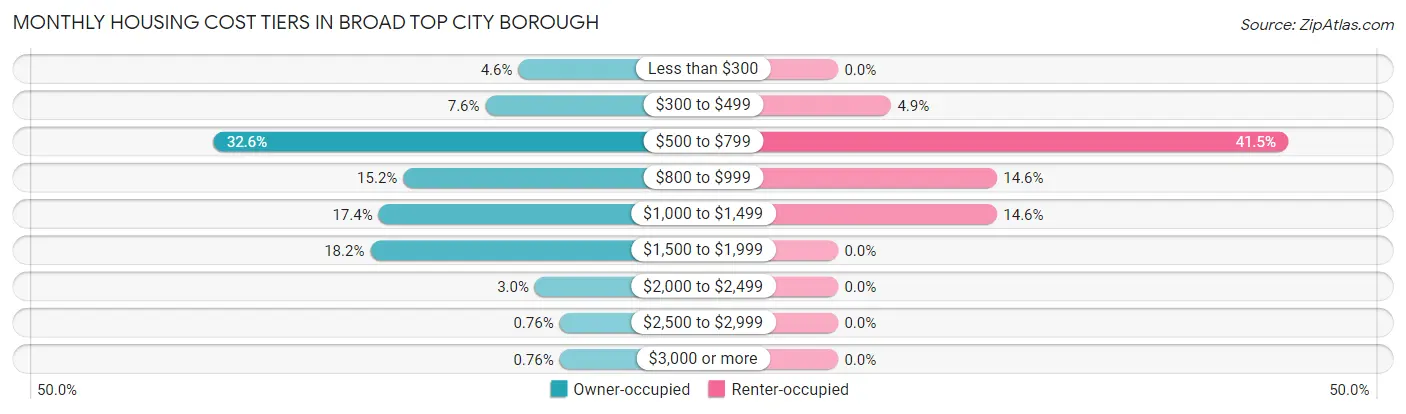
| Monthly Cost | Owner-occupied | Renter-occupied |
| Less than $300 | 6 (4.5%) | 0 (0.0%) |
| $300 to $499 | 10 (7.6%) | 2 (4.9%) |
| $500 to $799 | 43 (32.6%) | 17 (41.5%) |
| $800 to $999 | 20 (15.1%) | 6 (14.6%) |
| $1,000 to $1,499 | 23 (17.4%) | 6 (14.6%) |
| $1,500 to $1,999 | 24 (18.2%) | 0 (0.0%) |
| $2,000 to $2,499 | 4 (3.0%) | 0 (0.0%) |
| $2,500 to $2,999 | 1 (0.8%) | 0 (0.0%) |
| $3,000 or more | 1 (0.8%) | 0 (0.0%) |
| Total | 132 (100.0%) | 41 (100.0%) |
Physical Housing Characteristics in Broad Top City borough
Housing Structures in Broad Top City borough
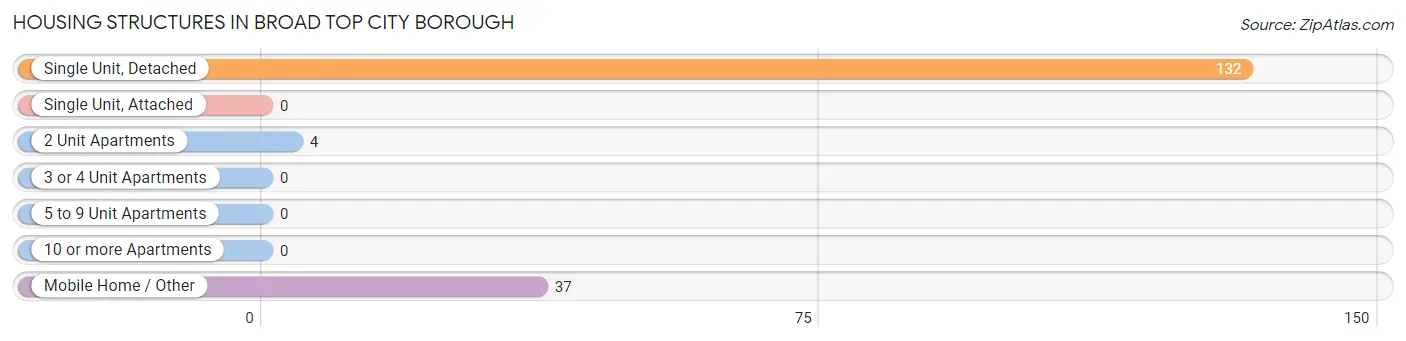
| Structure Type | # Housing Units | % Housing Units |
| Single Unit, Detached | 132 | 76.3% |
| Single Unit, Attached | 0 | 0.0% |
| 2 Unit Apartments | 4 | 2.3% |
| 3 or 4 Unit Apartments | 0 | 0.0% |
| 5 to 9 Unit Apartments | 0 | 0.0% |
| 10 or more Apartments | 0 | 0.0% |
| Mobile Home / Other | 37 | 21.4% |
| Total | 173 | 100.0% |
Housing Structures by Occupancy in Broad Top City borough
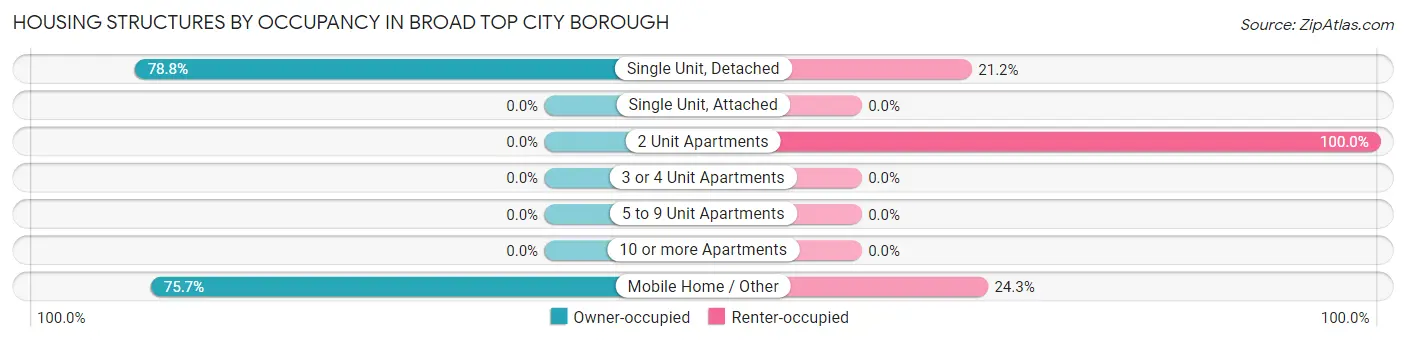
| Structure Type | Owner-occupied | Renter-occupied |
| Single Unit, Detached | 104 (78.8%) | 28 (21.2%) |
| Single Unit, Attached | 0 (0.0%) | 0 (0.0%) |
| 2 Unit Apartments | 0 (0.0%) | 4 (100.0%) |
| 3 or 4 Unit Apartments | 0 (0.0%) | 0 (0.0%) |
| 5 to 9 Unit Apartments | 0 (0.0%) | 0 (0.0%) |
| 10 or more Apartments | 0 (0.0%) | 0 (0.0%) |
| Mobile Home / Other | 28 (75.7%) | 9 (24.3%) |
| Total | 132 (76.3%) | 41 (23.7%) |
Housing Structures by Number of Rooms in Broad Top City borough
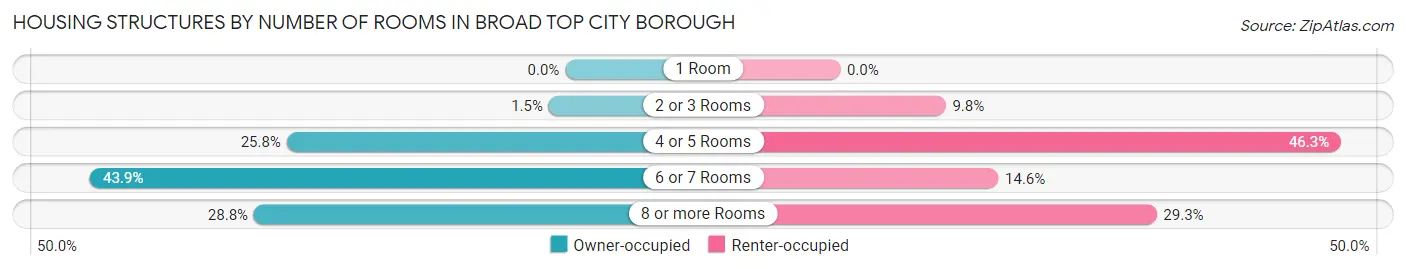
| Number of Rooms | Owner-occupied | Renter-occupied |
| 1 Room | 0 (0.0%) | 0 (0.0%) |
| 2 or 3 Rooms | 2 (1.5%) | 4 (9.8%) |
| 4 or 5 Rooms | 34 (25.8%) | 19 (46.3%) |
| 6 or 7 Rooms | 58 (43.9%) | 6 (14.6%) |
| 8 or more Rooms | 38 (28.8%) | 12 (29.3%) |
| Total | 132 (100.0%) | 41 (100.0%) |
Housing Structure by Heating Type in Broad Top City borough
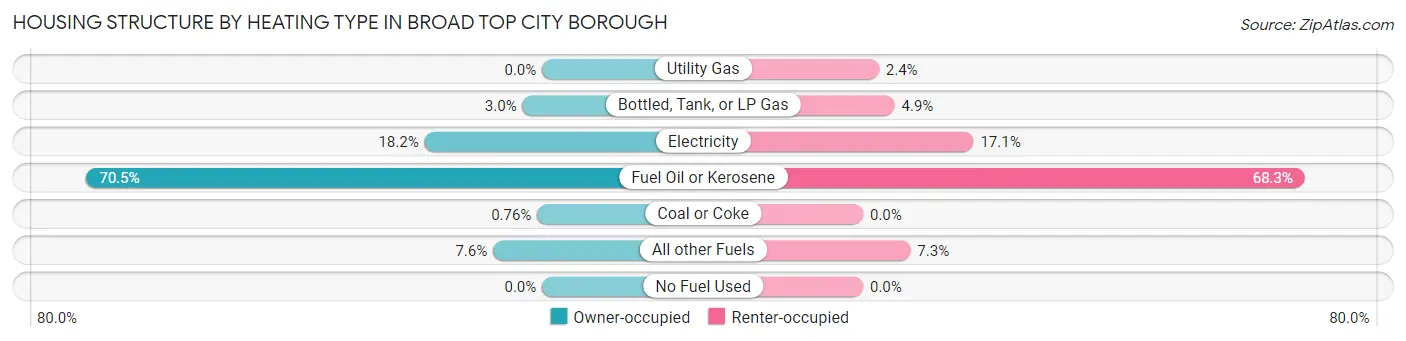
| Heating Type | Owner-occupied | Renter-occupied |
| Utility Gas | 0 (0.0%) | 1 (2.4%) |
| Bottled, Tank, or LP Gas | 4 (3.0%) | 2 (4.9%) |
| Electricity | 24 (18.2%) | 7 (17.1%) |
| Fuel Oil or Kerosene | 93 (70.5%) | 28 (68.3%) |
| Coal or Coke | 1 (0.8%) | 0 (0.0%) |
| All other Fuels | 10 (7.6%) | 3 (7.3%) |
| No Fuel Used | 0 (0.0%) | 0 (0.0%) |
| Total | 132 (100.0%) | 41 (100.0%) |
Household Vehicle Usage in Broad Top City borough
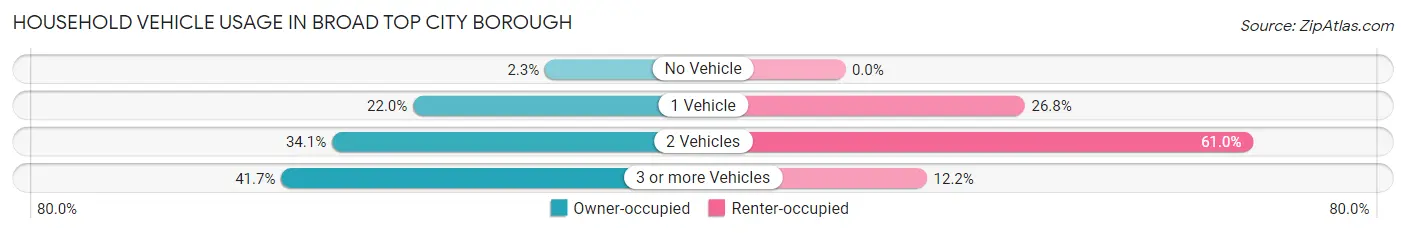
| Vehicles per Household | Owner-occupied | Renter-occupied |
| No Vehicle | 3 (2.3%) | 0 (0.0%) |
| 1 Vehicle | 29 (22.0%) | 11 (26.8%) |
| 2 Vehicles | 45 (34.1%) | 25 (61.0%) |
| 3 or more Vehicles | 55 (41.7%) | 5 (12.2%) |
| Total | 132 (100.0%) | 41 (100.0%) |
Real Estate & Mortgages in Broad Top City borough
Real Estate and Mortgage Overview in Broad Top City borough
| Characteristic | Without Mortgage | With Mortgage |
| Housing Units | 77 | 55 |
| Median Property Value | $95,000 | $167,800 |
| Median Household Income | $65,750 | $12 |
| Monthly Housing Costs | $639 | $1 |
| Real Estate Taxes | $1,717 | $1 |
Property Value by Mortgage Status in Broad Top City borough
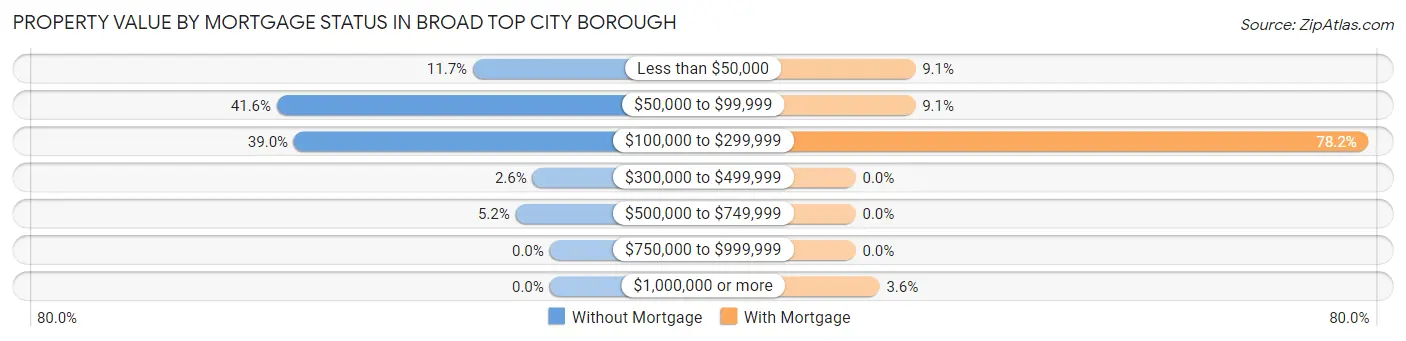
| Property Value | Without Mortgage | With Mortgage |
| Less than $50,000 | 9 (11.7%) | 5 (9.1%) |
| $50,000 to $99,999 | 32 (41.6%) | 5 (9.1%) |
| $100,000 to $299,999 | 30 (39.0%) | 43 (78.2%) |
| $300,000 to $499,999 | 2 (2.6%) | 0 (0.0%) |
| $500,000 to $749,999 | 4 (5.2%) | 0 (0.0%) |
| $750,000 to $999,999 | 0 (0.0%) | 0 (0.0%) |
| $1,000,000 or more | 0 (0.0%) | 2 (3.6%) |
| Total | 77 (100.0%) | 55 (100.0%) |
Household Income by Mortgage Status in Broad Top City borough
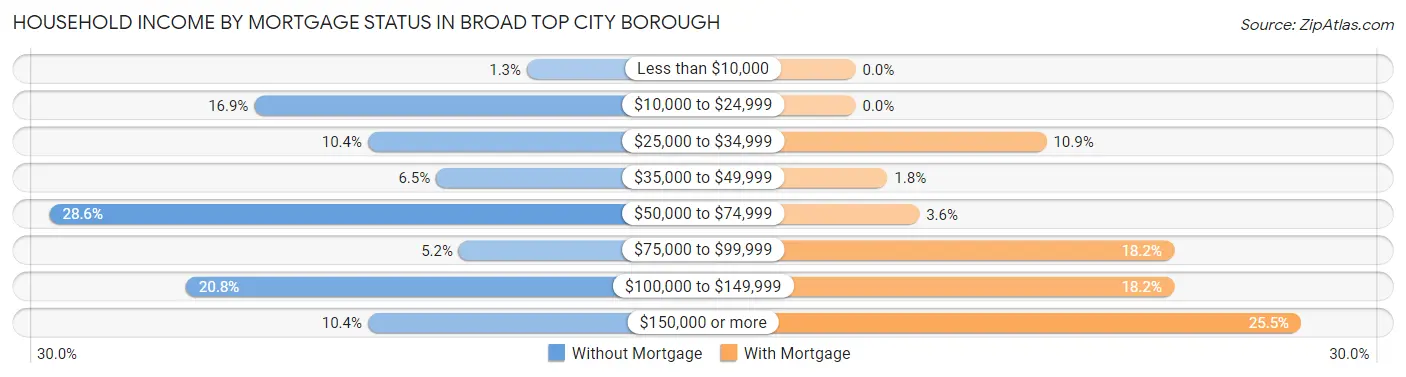
| Household Income | Without Mortgage | With Mortgage |
| Less than $10,000 | 1 (1.3%) | 0 (0.0%) |
| $10,000 to $24,999 | 13 (16.9%) | 0 (0.0%) |
| $25,000 to $34,999 | 8 (10.4%) | 6 (10.9%) |
| $35,000 to $49,999 | 5 (6.5%) | 1 (1.8%) |
| $50,000 to $74,999 | 22 (28.6%) | 2 (3.6%) |
| $75,000 to $99,999 | 4 (5.2%) | 10 (18.2%) |
| $100,000 to $149,999 | 16 (20.8%) | 10 (18.2%) |
| $150,000 or more | 8 (10.4%) | 14 (25.5%) |
| Total | 77 (100.0%) | 55 (100.0%) |
Property Value to Household Income Ratio in Broad Top City borough
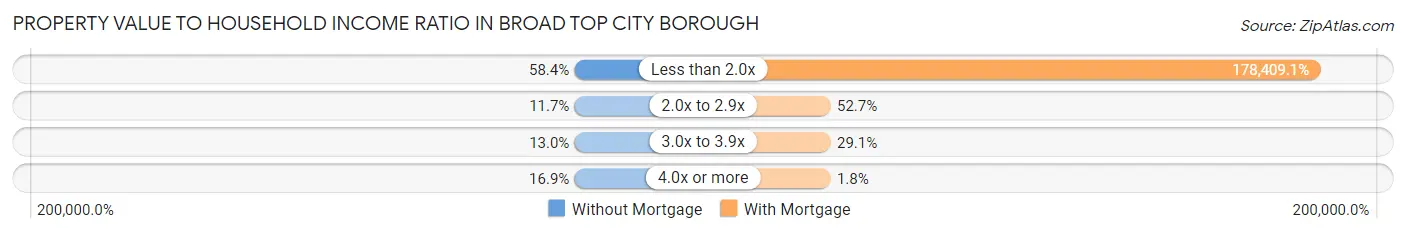
| Value-to-Income Ratio | Without Mortgage | With Mortgage |
| Less than 2.0x | 45 (58.4%) | 98,125 (178,409.1%) |
| 2.0x to 2.9x | 9 (11.7%) | 29 (52.7%) |
| 3.0x to 3.9x | 10 (13.0%) | 16 (29.1%) |
| 4.0x or more | 13 (16.9%) | 1 (1.8%) |
| Total | 77 (100.0%) | 55 (100.0%) |
Real Estate Taxes by Mortgage Status in Broad Top City borough
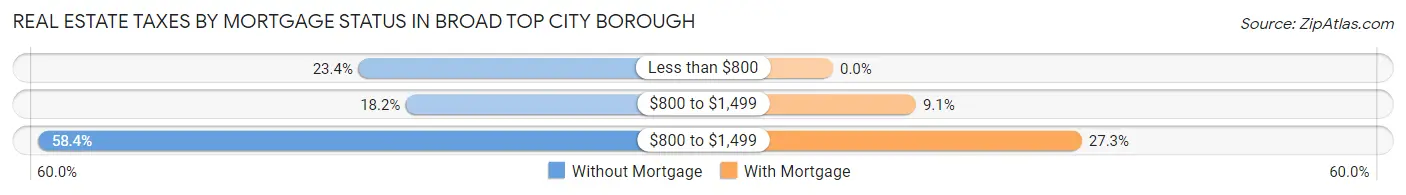
| Property Taxes | Without Mortgage | With Mortgage |
| Less than $800 | 18 (23.4%) | 0 (0.0%) |
| $800 to $1,499 | 14 (18.2%) | 5 (9.1%) |
| $800 to $1,499 | 45 (58.4%) | 15 (27.3%) |
| Total | 77 (100.0%) | 55 (100.0%) |
Health & Disability in Broad Top City borough
Health Insurance Coverage by Age in Broad Top City borough
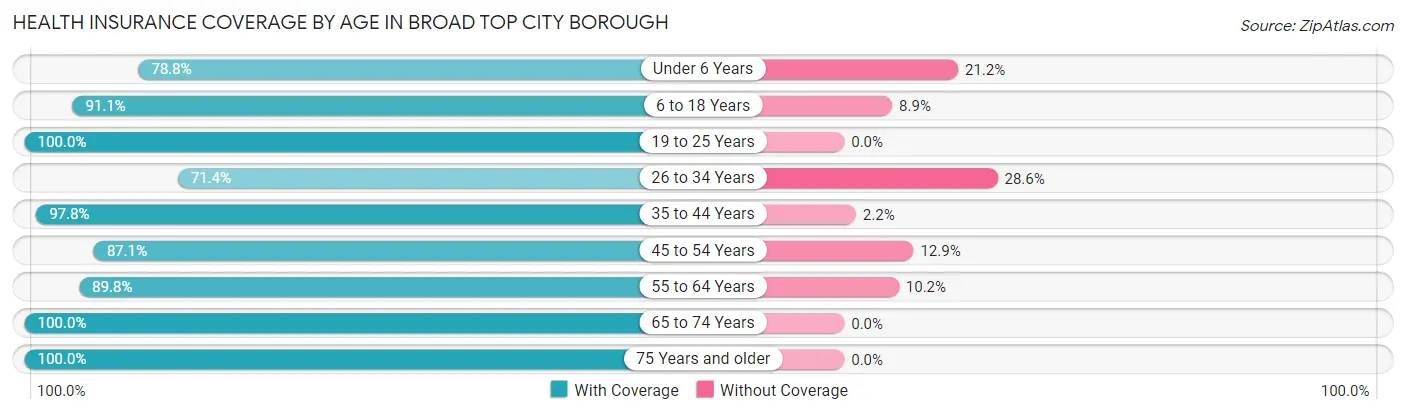
| Age Bracket | With Coverage | Without Coverage |
| Under 6 Years | 26 (78.8%) | 7 (21.2%) |
| 6 to 18 Years | 51 (91.1%) | 5 (8.9%) |
| 19 to 25 Years | 84 (100.0%) | 0 (0.0%) |
| 26 to 34 Years | 15 (71.4%) | 6 (28.6%) |
| 35 to 44 Years | 45 (97.8%) | 1 (2.2%) |
| 45 to 54 Years | 54 (87.1%) | 8 (12.9%) |
| 55 to 64 Years | 53 (89.8%) | 6 (10.2%) |
| 65 to 74 Years | 39 (100.0%) | 0 (0.0%) |
| 75 Years and older | 62 (100.0%) | 0 (0.0%) |
| Total | 429 (92.9%) | 33 (7.1%) |
Health Insurance Coverage by Citizenship Status in Broad Top City borough
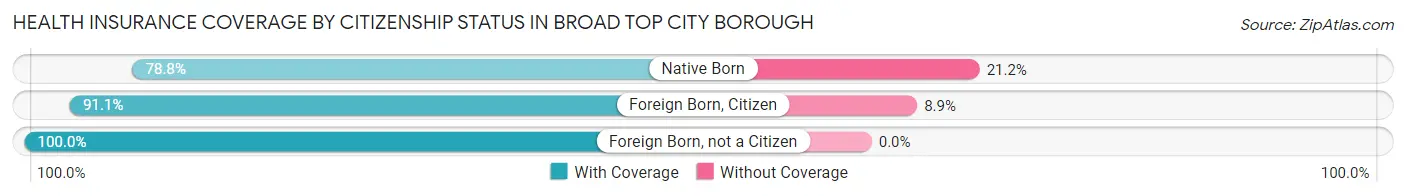
| Citizenship Status | With Coverage | Without Coverage |
| Native Born | 26 (78.8%) | 7 (21.2%) |
| Foreign Born, Citizen | 51 (91.1%) | 5 (8.9%) |
| Foreign Born, not a Citizen | 84 (100.0%) | 0 (0.0%) |
Health Insurance Coverage by Household Income in Broad Top City borough
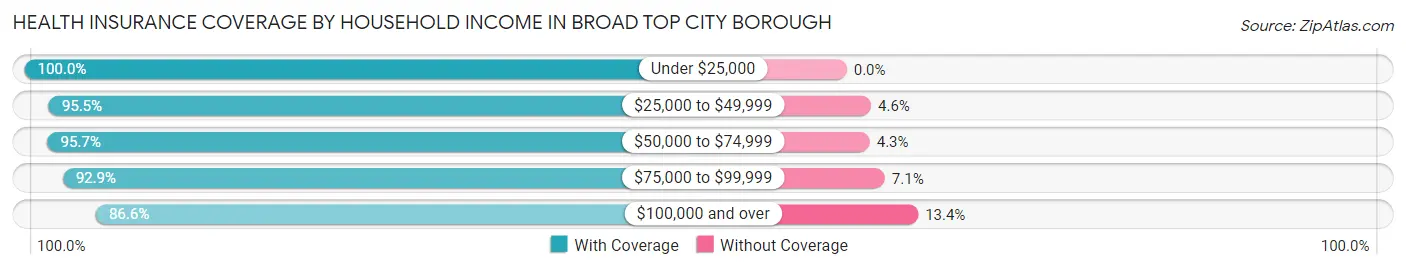
| Household Income | With Coverage | Without Coverage |
| Under $25,000 | 75 (100.0%) | 0 (0.0%) |
| $25,000 to $49,999 | 42 (95.5%) | 2 (4.5%) |
| $50,000 to $74,999 | 111 (95.7%) | 5 (4.3%) |
| $75,000 to $99,999 | 65 (92.9%) | 5 (7.1%) |
| $100,000 and over | 136 (86.6%) | 21 (13.4%) |
Public vs Private Health Insurance Coverage by Age in Broad Top City borough
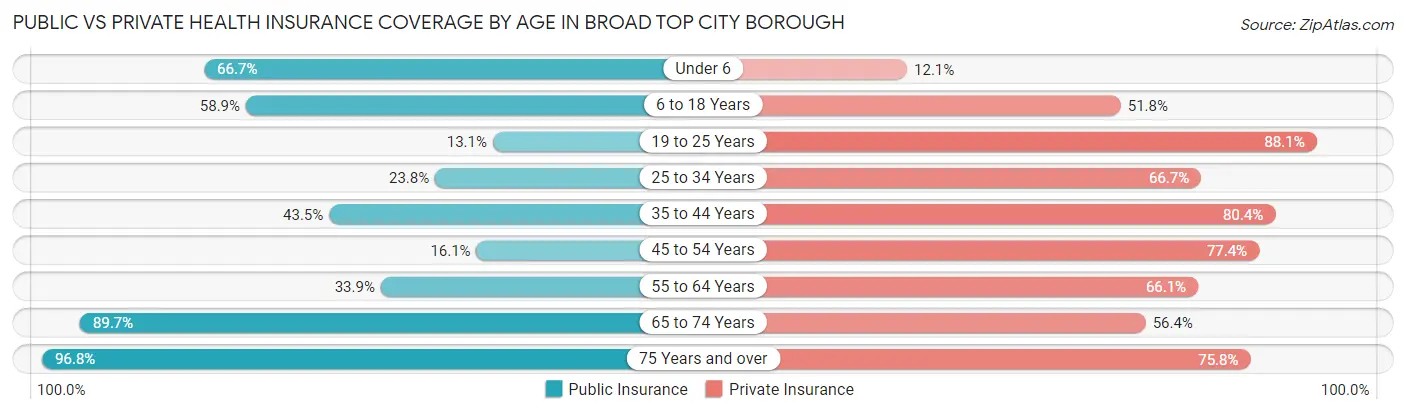
| Age Bracket | Public Insurance | Private Insurance |
| Under 6 | 22 (66.7%) | 4 (12.1%) |
| 6 to 18 Years | 33 (58.9%) | 29 (51.8%) |
| 19 to 25 Years | 11 (13.1%) | 74 (88.1%) |
| 25 to 34 Years | 5 (23.8%) | 14 (66.7%) |
| 35 to 44 Years | 20 (43.5%) | 37 (80.4%) |
| 45 to 54 Years | 10 (16.1%) | 48 (77.4%) |
| 55 to 64 Years | 20 (33.9%) | 39 (66.1%) |
| 65 to 74 Years | 35 (89.7%) | 22 (56.4%) |
| 75 Years and over | 60 (96.8%) | 47 (75.8%) |
| Total | 216 (46.8%) | 314 (68.0%) |
Disability Status by Sex by Age in Broad Top City borough
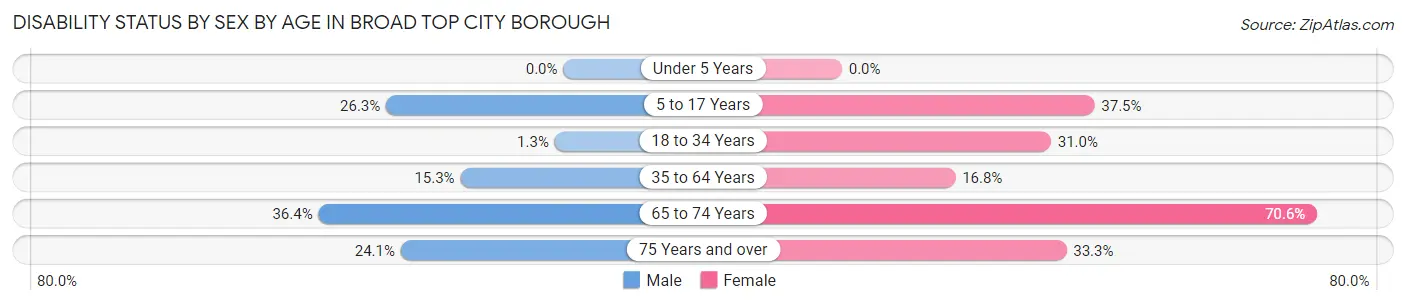
| Age Bracket | Male | Female |
| Under 5 Years | 0 (0.0%) | 0 (0.0%) |
| 5 to 17 Years | 10 (26.3%) | 9 (37.5%) |
| 18 to 34 Years | 1 (1.3%) | 9 (31.0%) |
| 35 to 64 Years | 11 (15.3%) | 16 (16.8%) |
| 65 to 74 Years | 8 (36.4%) | 12 (70.6%) |
| 75 Years and over | 7 (24.1%) | 11 (33.3%) |
Disability Class by Sex by Age in Broad Top City borough
Disability Class: Hearing Difficulty
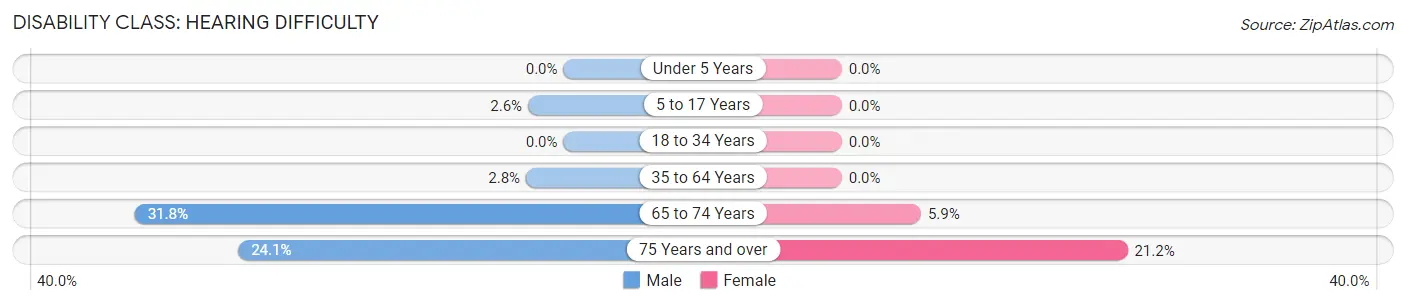
| Age Bracket | Male | Female |
| Under 5 Years | 0 (0.0%) | 0 (0.0%) |
| 5 to 17 Years | 1 (2.6%) | 0 (0.0%) |
| 18 to 34 Years | 0 (0.0%) | 0 (0.0%) |
| 35 to 64 Years | 2 (2.8%) | 0 (0.0%) |
| 65 to 74 Years | 7 (31.8%) | 1 (5.9%) |
| 75 Years and over | 7 (24.1%) | 7 (21.2%) |
Disability Class: Vision Difficulty
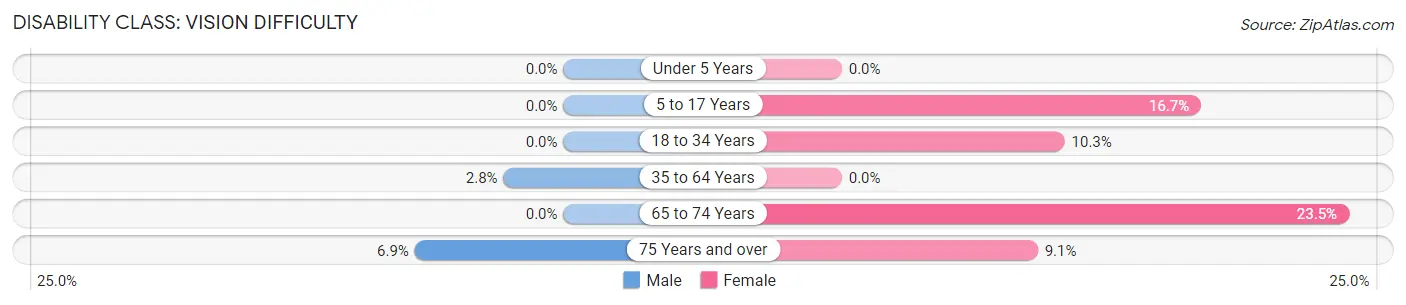
| Age Bracket | Male | Female |
| Under 5 Years | 0 (0.0%) | 0 (0.0%) |
| 5 to 17 Years | 0 (0.0%) | 4 (16.7%) |
| 18 to 34 Years | 0 (0.0%) | 3 (10.3%) |
| 35 to 64 Years | 2 (2.8%) | 0 (0.0%) |
| 65 to 74 Years | 0 (0.0%) | 4 (23.5%) |
| 75 Years and over | 2 (6.9%) | 3 (9.1%) |
Disability Class: Cognitive Difficulty
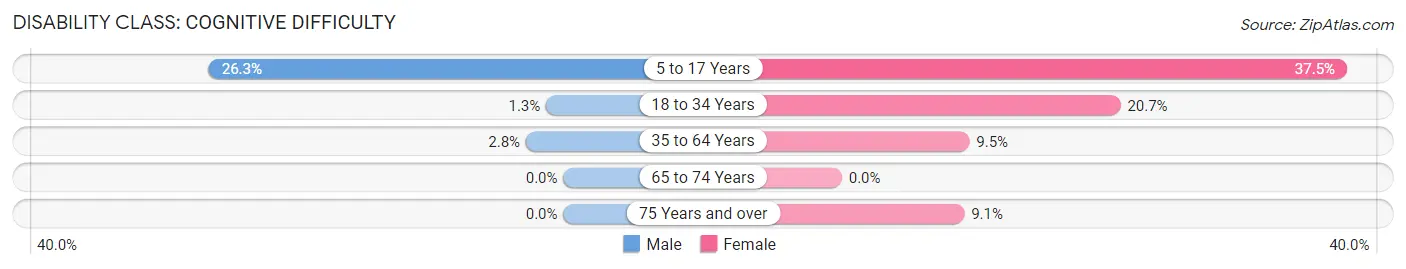
| Age Bracket | Male | Female |
| 5 to 17 Years | 10 (26.3%) | 9 (37.5%) |
| 18 to 34 Years | 1 (1.3%) | 6 (20.7%) |
| 35 to 64 Years | 2 (2.8%) | 9 (9.5%) |
| 65 to 74 Years | 0 (0.0%) | 0 (0.0%) |
| 75 Years and over | 0 (0.0%) | 3 (9.1%) |
Disability Class: Ambulatory Difficulty
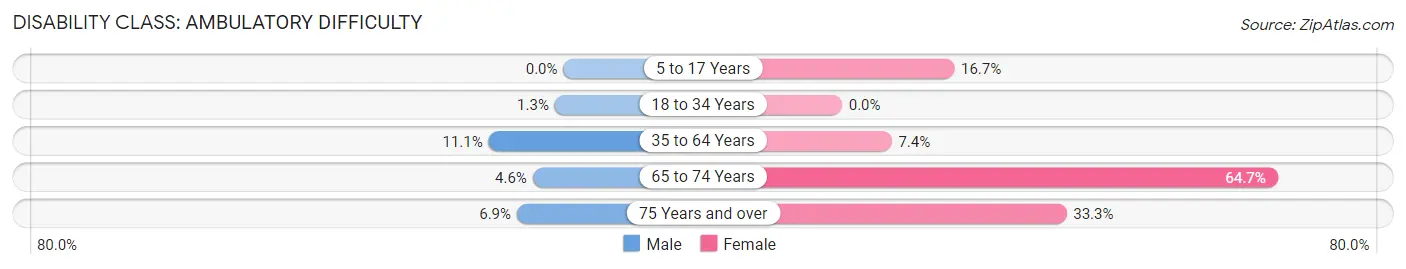
| Age Bracket | Male | Female |
| 5 to 17 Years | 0 (0.0%) | 4 (16.7%) |
| 18 to 34 Years | 1 (1.3%) | 0 (0.0%) |
| 35 to 64 Years | 8 (11.1%) | 7 (7.4%) |
| 65 to 74 Years | 1 (4.5%) | 11 (64.7%) |
| 75 Years and over | 2 (6.9%) | 11 (33.3%) |
Disability Class: Self-Care Difficulty
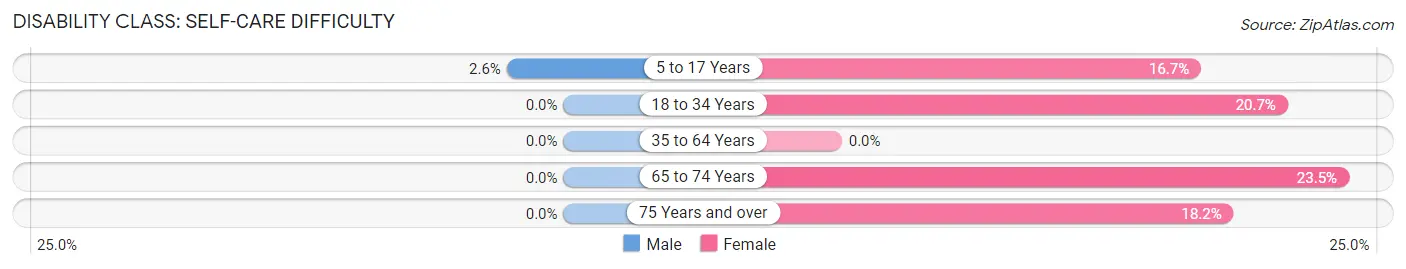
| Age Bracket | Male | Female |
| 5 to 17 Years | 1 (2.6%) | 4 (16.7%) |
| 18 to 34 Years | 0 (0.0%) | 6 (20.7%) |
| 35 to 64 Years | 0 (0.0%) | 0 (0.0%) |
| 65 to 74 Years | 0 (0.0%) | 4 (23.5%) |
| 75 Years and over | 0 (0.0%) | 6 (18.2%) |
Technology Access in Broad Top City borough
Computing Device Access in Broad Top City borough
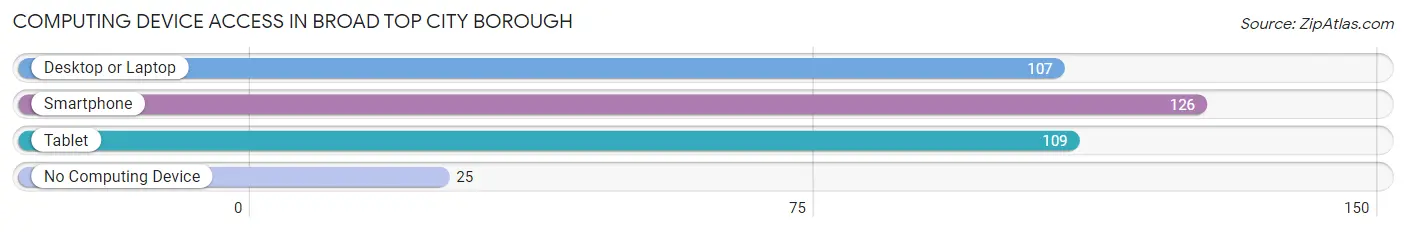
| Device Type | # Households | % Households |
| Desktop or Laptop | 107 | 61.9% |
| Smartphone | 126 | 72.8% |
| Tablet | 109 | 63.0% |
| No Computing Device | 25 | 14.4% |
| Total | 173 | 100.0% |
Internet Access in Broad Top City borough

| Internet Type | # Households | % Households |
| Dial-Up Internet | 2 | 1.2% |
| Broadband Home | 130 | 75.1% |
| Cellular Data Only | 10 | 5.8% |
| Satellite Internet | 3 | 1.7% |
| No Internet | 30 | 17.3% |
| Total | 173 | 100.0% |
Broad Top City borough Summary
Broad Top City Borough is a borough located in Huntingdon County, Pennsylvania. It is situated in the southeastern corner of the county, and is bordered by the townships of Hopewell, Liberty, and Wood. The borough is home to a population of approximately 1,000 people, and is part of the Huntingdon-Bedford-Fulton tri-county area.
History
The area that is now Broad Top City Borough was first settled in the late 1700s by German and Scots-Irish immigrants. The town was originally known as “Broad Top”, and was incorporated as a borough in 1872. The name was changed to “Broad Top City” in 1875.
The town was an important center of the coal mining industry in the late 19th and early 20th centuries. The Broad Top Coal and Iron Company was founded in 1872, and operated several mines in the area. The company also operated a large coke oven plant, which produced coke for use in the steel industry. The company was the largest employer in the area, and the town’s population grew rapidly during this period.
The coal industry declined in the mid-20th century, and the Broad Top Coal and Iron Company closed its operations in the 1950s. The town’s population declined as well, and the town has since become a quiet, rural community.
Geography
Broad Top City Borough is located in the southeastern corner of Huntingdon County, and is bordered by the townships of Hopewell, Liberty, and Wood. The borough is situated in the Broad Top Mountain range, and is surrounded by rolling hills and forests. The town is located approximately 25 miles east of Altoona, and is accessible via U.S. Route 22.
The borough has a total area of 1.2 square miles, all of which is land. The town is located at an elevation of 1,890 feet above sea level.
Economy
The economy of Broad Top City Borough is largely based on agriculture and tourism. The town is home to several small farms, which produce a variety of crops, including corn, soybeans, and hay. The town is also home to several small businesses, including a general store, a hardware store, and a restaurant.
The town is a popular destination for outdoor recreation, and is home to several parks and trails. The town is also home to the Broad Top Mountain Ski Resort, which offers skiing and snowboarding in the winter months.
Demographics
As of the 2010 census, the population of Broad Top City Borough was 1,000. The racial makeup of the town was 97.2% White, 0.7% African American, 0.2% Native American, 0.2% Asian, and 1.7% from other races. Hispanic or Latino of any race were 1.2% of the population.
The median household income in the town was $37,500, and the median family income was $45,000. The per capita income in the town was $18,000. Approximately 11.2% of the population was below the poverty line.
Common Questions
What is the Total Population of Broad Top City borough?
Total Population of Broad Top City borough is 462.
What is the Total Male Population of Broad Top City borough?
Total Male Population of Broad Top City borough is 244.
What is the Total Female Population of Broad Top City borough?
Total Female Population of Broad Top City borough is 218.
What is the Ratio of Males per 100 Females in Broad Top City borough?
There are 111.93 Males per 100 Females in Broad Top City borough.
What is the Ratio of Females per 100 Males in Broad Top City borough?
There are 89.34 Females per 100 Males in Broad Top City borough.
What is the Median Population Age in Broad Top City borough?
Median Population Age in Broad Top City borough is 43.4 Years.
What is the Average Family Size in Broad Top City borough
Average Family Size in Broad Top City borough is 3.1 People.
What is the Average Household Size in Broad Top City borough
Average Household Size in Broad Top City borough is 2.7 People.
What is Per Capita Income in Broad Top City borough?
Per Capita income in Broad Top City borough is $33,849.
What is the Median Family Income in Broad Top City borough?
Median Family Income in Broad Top City borough is $76,944.
What is the Median Household income in Broad Top City borough?
Median Household Income in Broad Top City borough is $66,172.
What is Income or Wage Gap in Broad Top City borough?
Income or Wage Gap in Broad Top City borough is 52.4%.
Women in Broad Top City borough earn 47.6 cents for every dollar earned by a man.
What is Inequality or Gini Index in Broad Top City borough?
Inequality or Gini Index in Broad Top City borough is 0.41.
How Large is the Labor Force in Broad Top City borough?
There are 238 People in the Labor Forcein in Broad Top City borough.
What is the Percentage of People in the Labor Force in Broad Top City borough?
62.6% of People are in the Labor Force in Broad Top City borough.
What is the Unemployment Rate in Broad Top City borough?
Unemployment Rate in Broad Top City borough is 0.8%.