Ackermanville, PA
Ackermanville Map
Ackermanville Overview
280
TOTAL POPULATION
146
MALE POPULATION
134
FEMALE POPULATION
108.96
MALES / 100 FEMALES
91.78
FEMALES / 100 MALES
33.0
MEDIAN AGE
2.7
AVG FAMILY SIZE
2.2
AVG HOUSEHOLD SIZE
$27,213
PER CAPITA INCOME
$54,281
AVG FAMILY INCOME
$54,000
AVG HOUSEHOLD INCOME
0.30
INEQUALITY / GINI INDEX
136
LABOR FORCE [ PEOPLE ]
68.3%
PERCENT IN LABOR FORCE
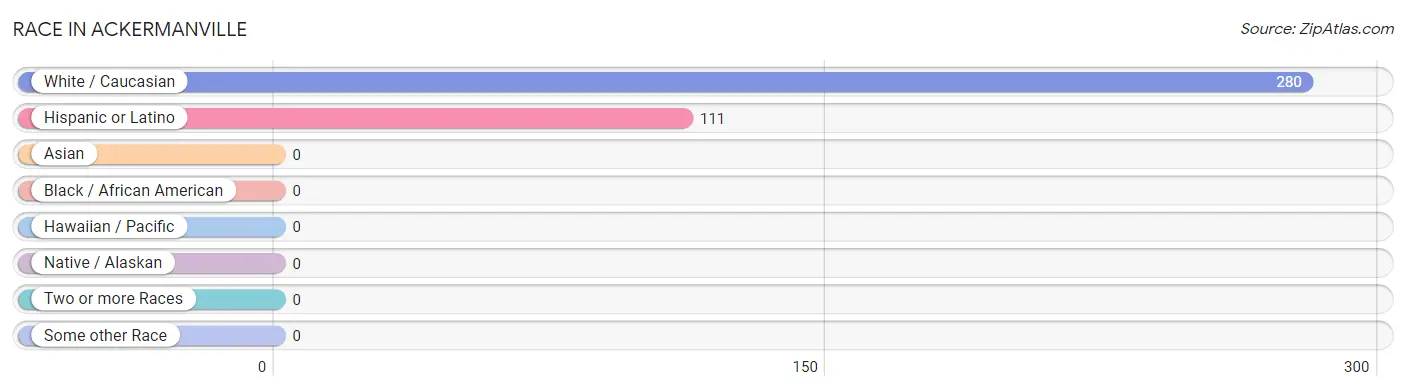
Race in Ackermanville
The most populous races in Ackermanville are White / Caucasian (280 | 100.0%), and Hispanic or Latino (111 | 39.6%).
| Race | # Population | % Population |
| Asian | 0 | 0.0% |
| Black / African American | 0 | 0.0% |
| Hawaiian / Pacific | 0 | 0.0% |
| Hispanic or Latino | 111 | 39.6% |
| Native / Alaskan | 0 | 0.0% |
| White / Caucasian | 280 | 100.0% |
| Two or more Races | 0 | 0.0% |
| Some other Race | 0 | 0.0% |
| Total | 280 | 100.0% |
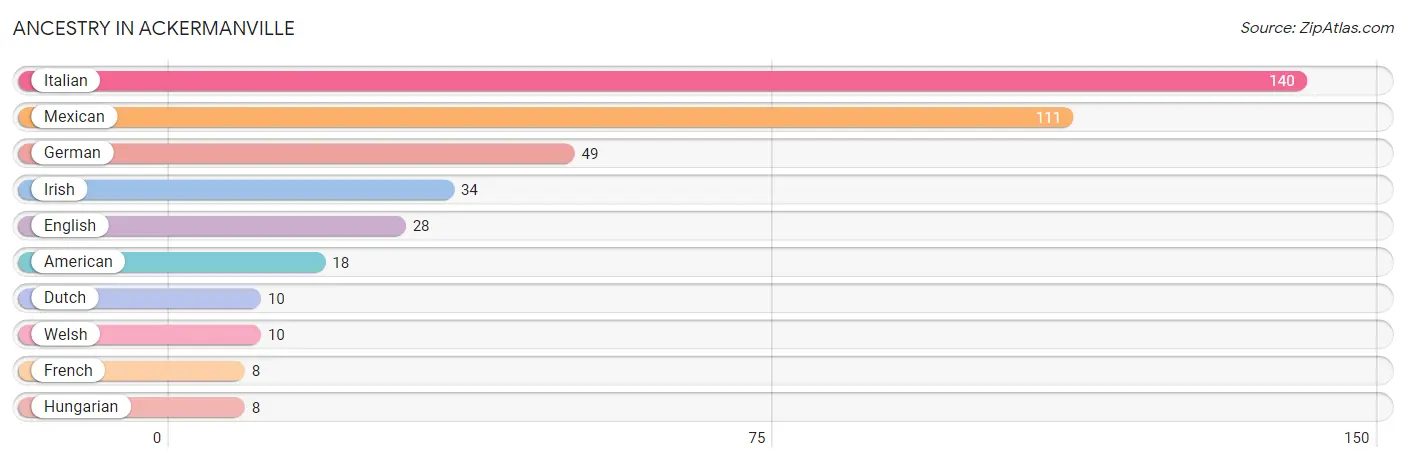
Ancestry in Ackermanville
The most populous ancestries reported in Ackermanville are Italian (140 | 50.0%), Mexican (111 | 39.6%), German (49 | 17.5%), Irish (34 | 12.1%), and English (28 | 10.0%), together accounting for 129.3% of all Ackermanville residents.
| Ancestry | # Population | % Population |
| American | 18 | 6.4% |
| Dutch | 10 | 3.6% |
| English | 28 | 10.0% |
| French | 8 | 2.9% |
| German | 49 | 17.5% |
| Hungarian | 8 | 2.9% |
| Irish | 34 | 12.1% |
| Italian | 140 | 50.0% |
| Mexican | 111 | 39.6% |
| Welsh | 10 | 3.6% | View All 10 Rows |
Immigrants in Ackermanville

| Immigration Origin | # Population | % Population | View All 0 Rows |
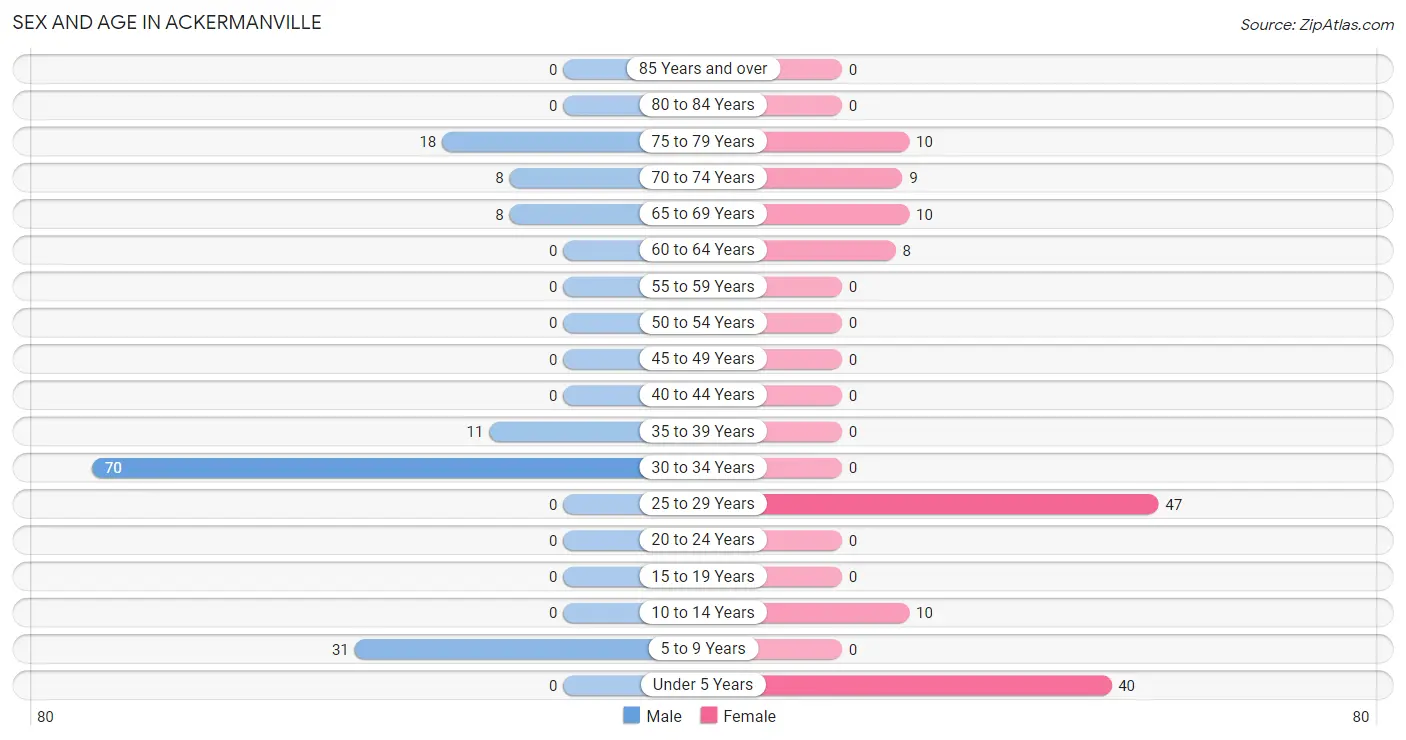
Sex and Age in Ackermanville
Sex and Age in Ackermanville
The most populous age groups in Ackermanville are 30 to 34 Years (70 | 47.9%) for men and 25 to 29 Years (47 | 35.1%) for women.
| Age Bracket | Male | Female |
| Under 5 Years | 0 (0.0%) | 40 (29.8%) |
| 5 to 9 Years | 31 (21.2%) | 0 (0.0%) |
| 10 to 14 Years | 0 (0.0%) | 10 (7.5%) |
| 15 to 19 Years | 0 (0.0%) | 0 (0.0%) |
| 20 to 24 Years | 0 (0.0%) | 0 (0.0%) |
| 25 to 29 Years | 0 (0.0%) | 47 (35.1%) |
| 30 to 34 Years | 70 (47.9%) | 0 (0.0%) |
| 35 to 39 Years | 11 (7.5%) | 0 (0.0%) |
| 40 to 44 Years | 0 (0.0%) | 0 (0.0%) |
| 45 to 49 Years | 0 (0.0%) | 0 (0.0%) |
| 50 to 54 Years | 0 (0.0%) | 0 (0.0%) |
| 55 to 59 Years | 0 (0.0%) | 0 (0.0%) |
| 60 to 64 Years | 0 (0.0%) | 8 (6.0%) |
| 65 to 69 Years | 8 (5.5%) | 10 (7.5%) |
| 70 to 74 Years | 8 (5.5%) | 9 (6.7%) |
| 75 to 79 Years | 18 (12.3%) | 10 (7.5%) |
| 80 to 84 Years | 0 (0.0%) | 0 (0.0%) |
| 85 Years and over | 0 (0.0%) | 0 (0.0%) |
| Total | 146 (100.0%) | 134 (100.0%) |
Families and Households in Ackermanville
Median Family Size in Ackermanville
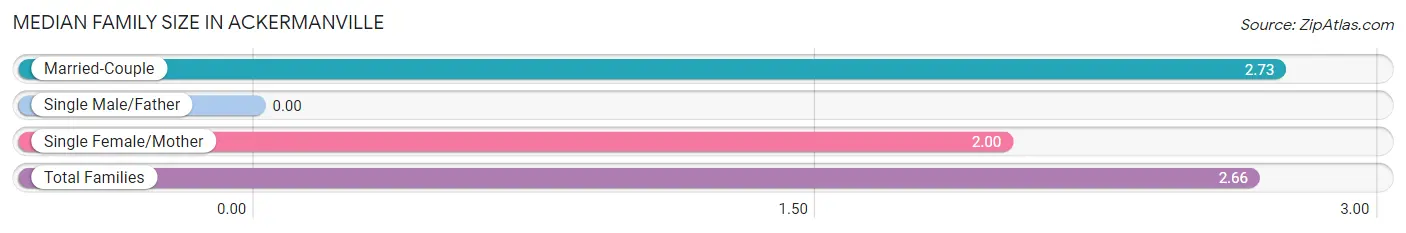
| Family Type | # Families | Family Size |
| Married-Couple | 83 (89.2%) | 2.73 |
| Single Male/Father | 0 (0.0%) | - |
| Single Female/Mother | 10 (10.7%) | 2.00 |
| Total Families | 93 (100.0%) | 2.66 |
Median Household Size in Ackermanville
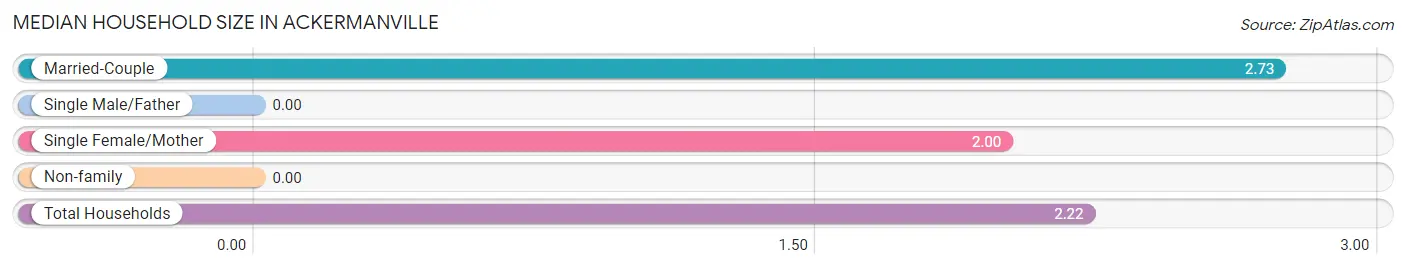
| Household Type | # Households | Household Size |
| Married-Couple | 83 (65.9%) | 2.73 |
| Single Male/Father | 0 (0.0%) | - |
| Single Female/Mother | 10 (7.9%) | 2.00 |
| Non-family | 33 (26.2%) | - |
| Total Households | 126 (100.0%) | 2.22 |
Household Size by Marriage Status in Ackermanville
Out of a total of 126 households in Ackermanville, 93 (73.8%) are family households, while 33 (26.2%) are nonfamily households. The most numerous type of family households are 2-person households, comprising 53, and the most common type of nonfamily households are 1-person households, comprising 33.
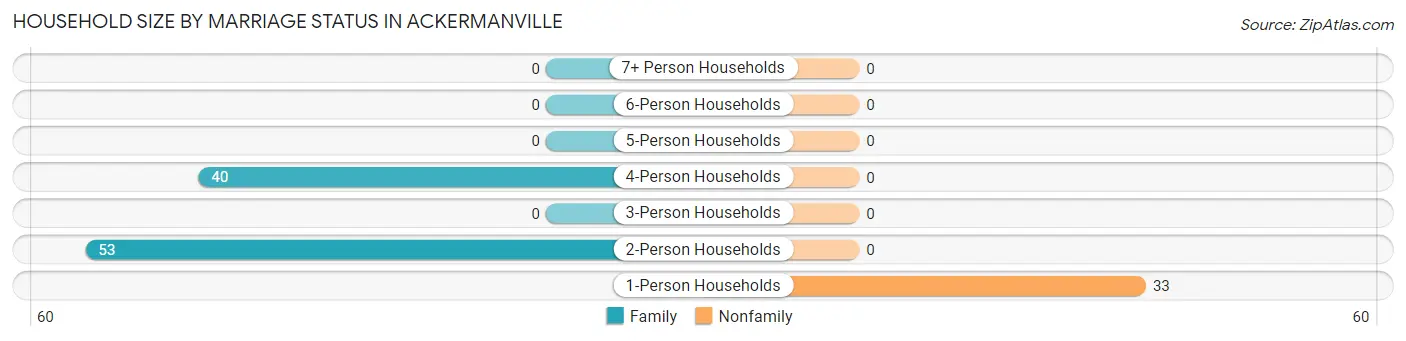
| Household Size | Family Households | Nonfamily Households |
| 1-Person Households | - | 33 (26.2%) |
| 2-Person Households | 53 (42.1%) | 0 (0.0%) |
| 3-Person Households | 0 (0.0%) | 0 (0.0%) |
| 4-Person Households | 40 (31.8%) | 0 (0.0%) |
| 5-Person Households | 0 (0.0%) | 0 (0.0%) |
| 6-Person Households | 0 (0.0%) | 0 (0.0%) |
| 7+ Person Households | 0 (0.0%) | 0 (0.0%) |
| Total | 93 (73.8%) | 33 (26.2%) |
Female Fertility in Ackermanville
Fertility by Age in Ackermanville
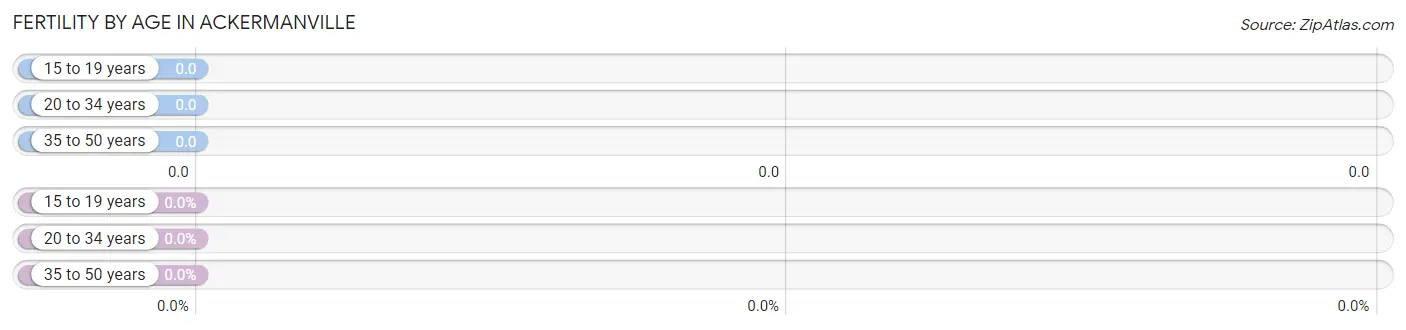
| Age Bracket | Women with Births | Births / 1,000 Women |
| 15 to 19 years | 0 (0.0%) | 0.0 |
| 20 to 34 years | 0 (0.0%) | 0.0 |
| 35 to 50 years | 0 (0.0%) | 0.0 |
| Total | 0 (0.0%) | 0.0 |
Fertility by Age by Marriage Status in Ackermanville
| Age Bracket | Married | Unmarried |
| 15 to 19 years | 0 (0.0%) | 0 (0.0%) |
| 20 to 34 years | 0 (0.0%) | 0 (0.0%) |
| 35 to 50 years | 0 (0.0%) | 0 (0.0%) |
| Total | 0 (0.0%) | 0 (0.0%) |
Fertility by Education in Ackermanville
| Educational Attainment | Women with Births | Births / 1,000 Women |
| Less than High School | 0 (0.0%) | 0.0 |
| High School Diploma | 0 (0.0%) | 0.0 |
| College or Associate's Degree | 0 (0.0%) | 0.0 |
| Bachelor's Degree | 0 (0.0%) | 0.0 |
| Graduate Degree | 0 (0.0%) | 0.0 |
| Total | 0 (0.0%) | 0.0 |
Fertility by Education by Marriage Status in Ackermanville
| Educational Attainment | Married | Unmarried |
| Less than High School | 0 (0.0%) | 0 (0.0%) |
| High School Diploma | 0 (0.0%) | 0 (0.0%) |
| College or Associate's Degree | 0 (0.0%) | 0 (0.0%) |
| Bachelor's Degree | 0 (0.0%) | 0 (0.0%) |
| Graduate Degree | 0 (0.0%) | 0 (0.0%) |
| Total | 0 (0.0%) | 0 (0.0%) |
Income in Ackermanville
Income Overview in Ackermanville
Per Capita Income in Ackermanville is $27,213, while median incomes of families and households are $54,281 and $54,000 respectively.
| Characteristic | Number | Measure |
| Per Capita Income | 280 | $27,213 |
| Median Family Income | 93 | $54,281 |
| Mean Family Income | 93 | $67,367 |
| Median Household Income | 126 | $54,000 |
| Mean Household Income | 126 | $62,504 |
| Income Deficit | 93 | $0 |
| Wage / Income Gap (%) | 280 | 0.00% |
| Wage / Income Gap ($) | 280 | 100.00¢ per $1 |
| Gini / Inequality Index | 280 | 0.30 |
Earnings by Sex in Ackermanville
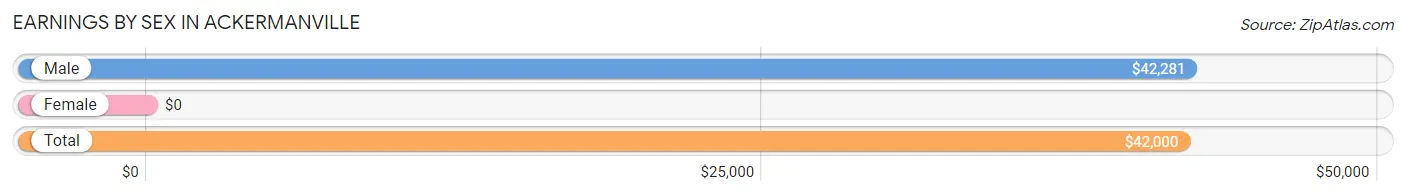
| Sex | Number | Average Earnings |
| Male | 89 (61.8%) | $42,281 |
| Female | 55 (38.2%) | $0 |
| Total | 144 (100.0%) | $42,000 |
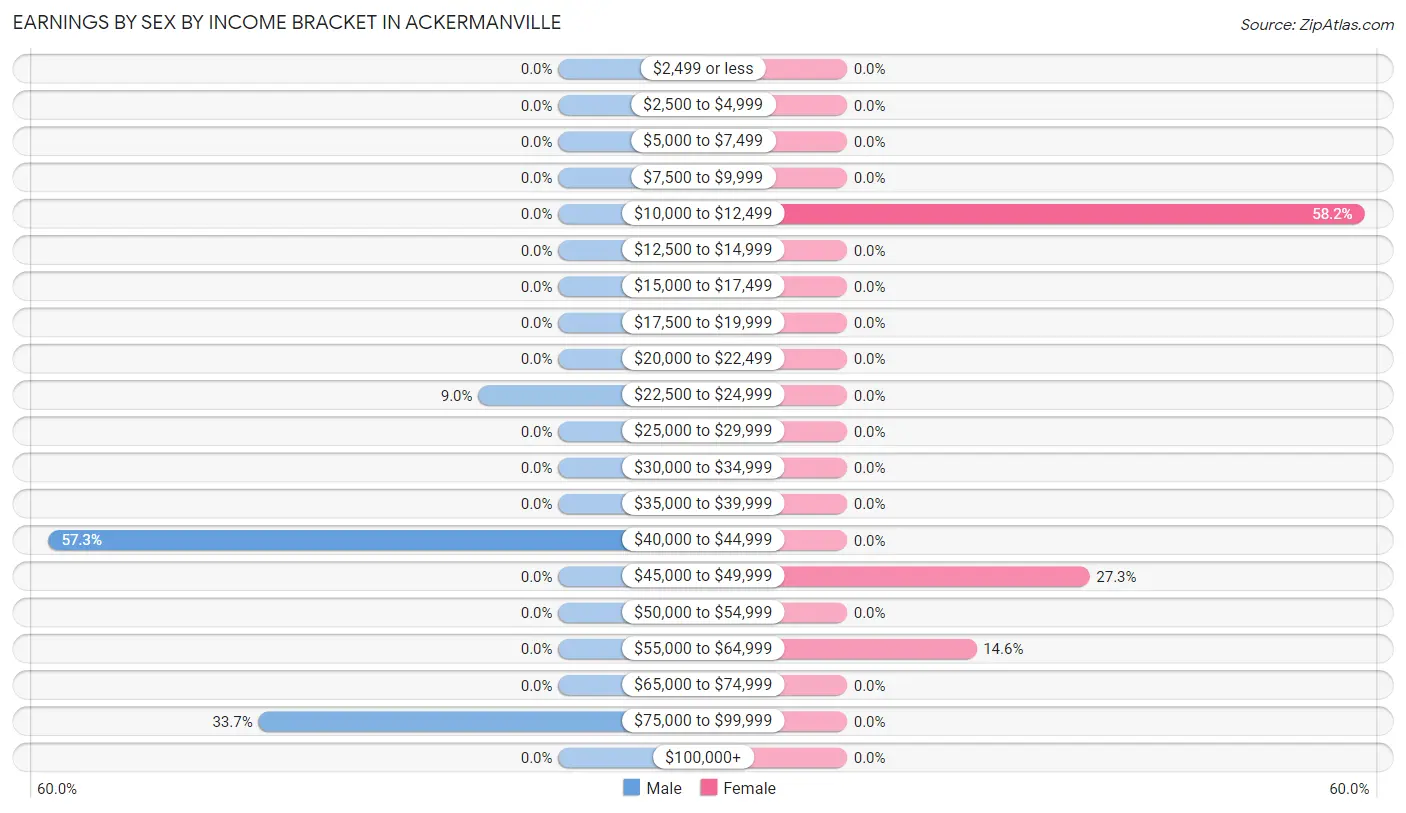
Earnings by Sex by Income Bracket in Ackermanville
The most common earnings brackets in Ackermanville are $40,000 to $44,999 for men (51 | 57.3%) and $10,000 to $12,499 for women (32 | 58.2%).
| Income | Male | Female |
| $2,499 or less | 0 (0.0%) | 0 (0.0%) |
| $2,500 to $4,999 | 0 (0.0%) | 0 (0.0%) |
| $5,000 to $7,499 | 0 (0.0%) | 0 (0.0%) |
| $7,500 to $9,999 | 0 (0.0%) | 0 (0.0%) |
| $10,000 to $12,499 | 0 (0.0%) | 32 (58.2%) |
| $12,500 to $14,999 | 0 (0.0%) | 0 (0.0%) |
| $15,000 to $17,499 | 0 (0.0%) | 0 (0.0%) |
| $17,500 to $19,999 | 0 (0.0%) | 0 (0.0%) |
| $20,000 to $22,499 | 0 (0.0%) | 0 (0.0%) |
| $22,500 to $24,999 | 8 (9.0%) | 0 (0.0%) |
| $25,000 to $29,999 | 0 (0.0%) | 0 (0.0%) |
| $30,000 to $34,999 | 0 (0.0%) | 0 (0.0%) |
| $35,000 to $39,999 | 0 (0.0%) | 0 (0.0%) |
| $40,000 to $44,999 | 51 (57.3%) | 0 (0.0%) |
| $45,000 to $49,999 | 0 (0.0%) | 15 (27.3%) |
| $50,000 to $54,999 | 0 (0.0%) | 0 (0.0%) |
| $55,000 to $64,999 | 0 (0.0%) | 8 (14.5%) |
| $65,000 to $74,999 | 0 (0.0%) | 0 (0.0%) |
| $75,000 to $99,999 | 30 (33.7%) | 0 (0.0%) |
| $100,000+ | 0 (0.0%) | 0 (0.0%) |
| Total | 89 (100.0%) | 55 (100.0%) |
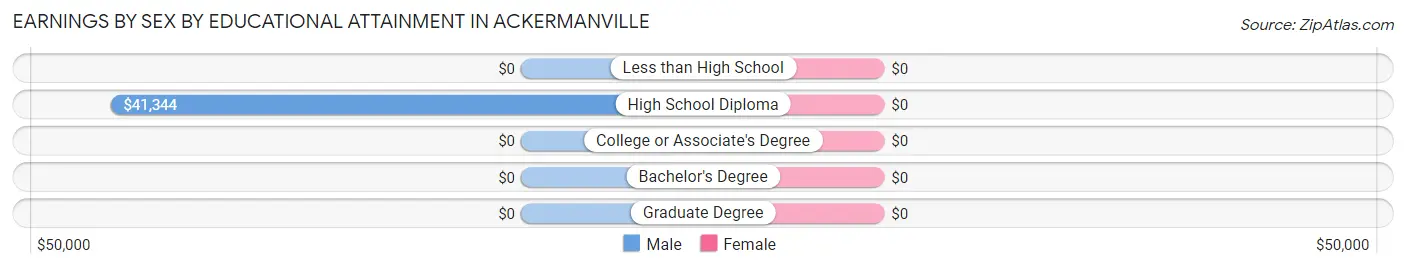
Earnings by Sex by Educational Attainment in Ackermanville
| Educational Attainment | Male Income | Female Income |
| Less than High School | - | - |
| High School Diploma | $41,344 | $0 |
| College or Associate's Degree | - | - |
| Bachelor's Degree | - | - |
| Graduate Degree | - | - |
| Total | $42,281 | $0 |
Family Income in Ackermanville
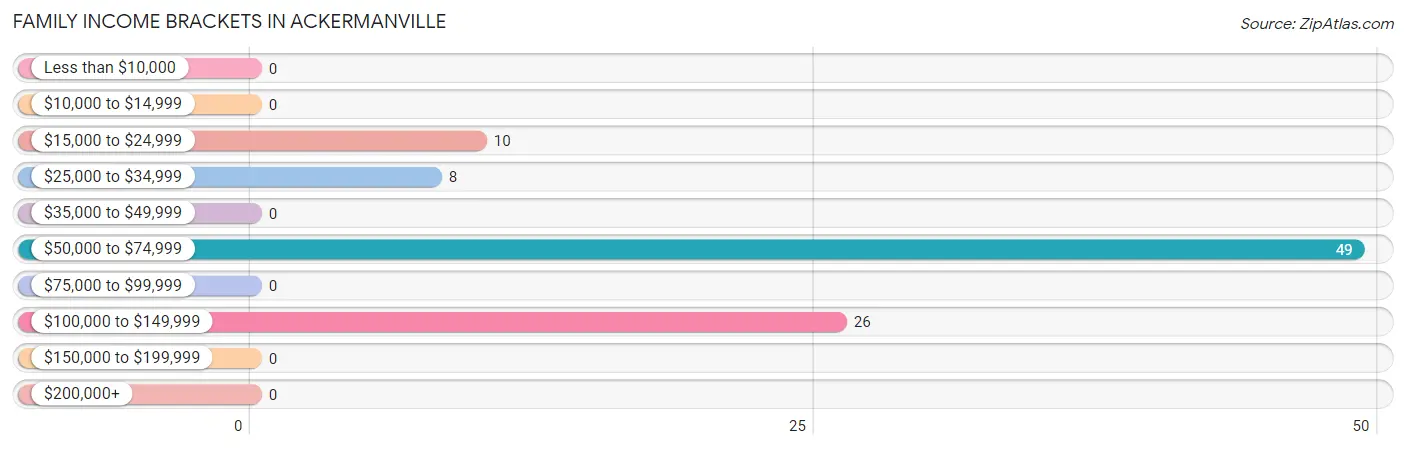
Family Income Brackets in Ackermanville
According to the Ackermanville family income data, there are 49 families falling into the $50,000 to $74,999 income range, which is the most common income bracket and makes up 52.7% of all families.
| Income Bracket | # Families | % Families |
| Less than $10,000 | 0 | 0.0% |
| $10,000 to $14,999 | 0 | 0.0% |
| $15,000 to $24,999 | 10 | 10.8% |
| $25,000 to $34,999 | 8 | 8.6% |
| $35,000 to $49,999 | 0 | 0.0% |
| $50,000 to $74,999 | 49 | 52.7% |
| $75,000 to $99,999 | 0 | 0.0% |
| $100,000 to $149,999 | 26 | 28.0% |
| $150,000 to $199,999 | 0 | 0.0% |
| $200,000+ | 0 | 0.0% |
Family Income by Famaliy Size in Ackermanville
| Income Bracket | # Families | Median Income |
| 2-Person Families | 53 (57.0%) | $0 |
| 3-Person Families | 0 (0.0%) | $0 |
| 4-Person Families | 40 (43.0%) | $0 |
| 5-Person Families | 0 (0.0%) | $0 |
| 6-Person Families | 0 (0.0%) | $0 |
| 7+ Person Families | 0 (0.0%) | $0 |
| Total | 93 (100.0%) | $54,281 |
Family Income by Number of Earners in Ackermanville
| Number of Earners | # Families | Median Income |
| No Earners | 27 (29.0%) | $0 |
| 1 Earner | 0 (0.0%) | $0 |
| 2 Earners | 66 (71.0%) | $0 |
| 3+ Earners | 0 (0.0%) | $0 |
| Total | 93 (100.0%) | $54,281 |
Household Income in Ackermanville
Household Income Brackets in Ackermanville
With 49 households falling in the category, the $50,000 to $74,999 income range is the most frequent in Ackermanville, accounting for 38.9% of all households.
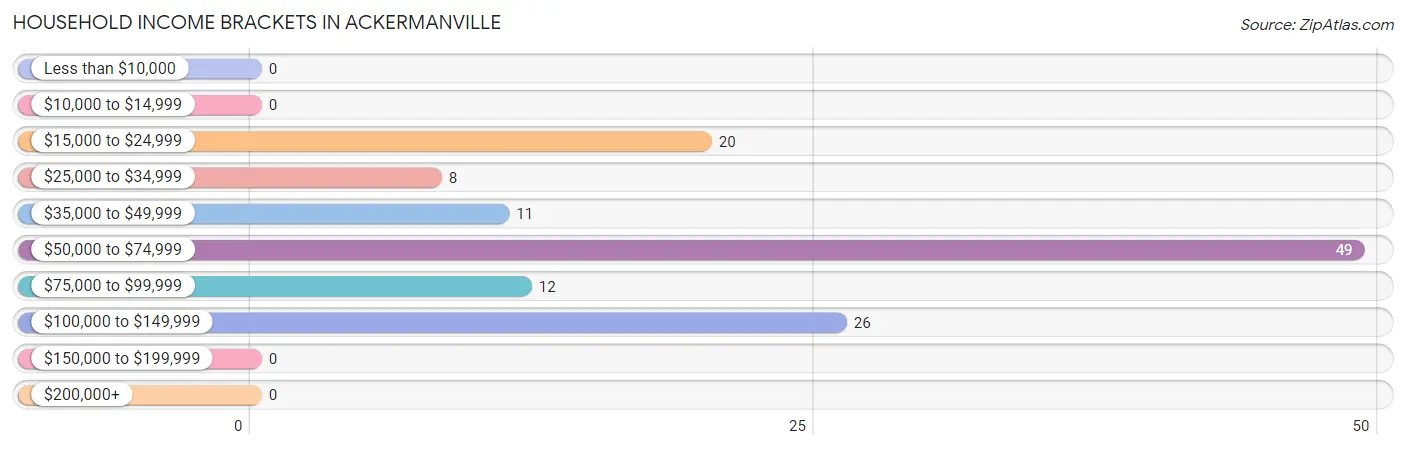
| Income Bracket | # Households | % Households |
| Less than $10,000 | 0 | 0.0% |
| $10,000 to $14,999 | 0 | 0.0% |
| $15,000 to $24,999 | 20 | 15.9% |
| $25,000 to $34,999 | 8 | 6.3% |
| $35,000 to $49,999 | 11 | 8.7% |
| $50,000 to $74,999 | 49 | 38.9% |
| $75,000 to $99,999 | 12 | 9.5% |
| $100,000 to $149,999 | 26 | 20.6% |
| $150,000 to $199,999 | 0 | 0.0% |
| $200,000+ | 0 | 0.0% |
Household Income by Householder Age in Ackermanville
The median household income in Ackermanville is $54,000, with the highest median household income of $54,344 found in the 25 to 44 years age bracket for the primary householder. A total of 81 households (64.3%) fall into this category.
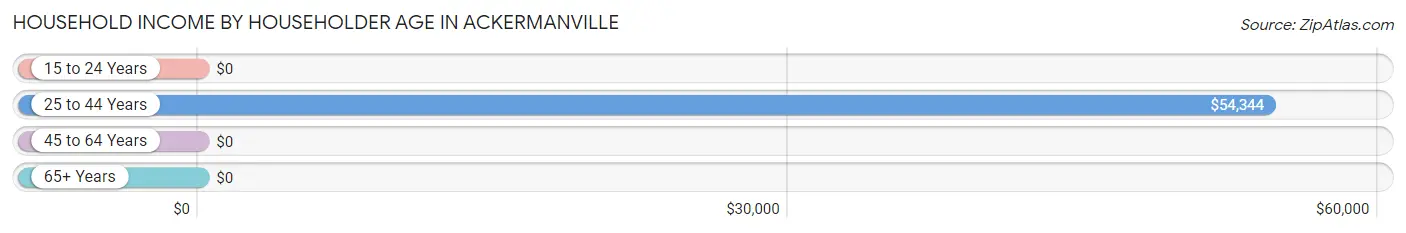
| Income Bracket | # Households | Median Income |
| 15 to 24 Years | 0 (0.0%) | $0 |
| 25 to 44 Years | 81 (64.3%) | $54,344 |
| 45 to 64 Years | 0 (0.0%) | $0 |
| 65+ Years | 45 (35.7%) | $0 |
| Total | 126 (100.0%) | $54,000 |
Poverty in Ackermanville
Income Below Poverty by Sex and Age in Ackermanville
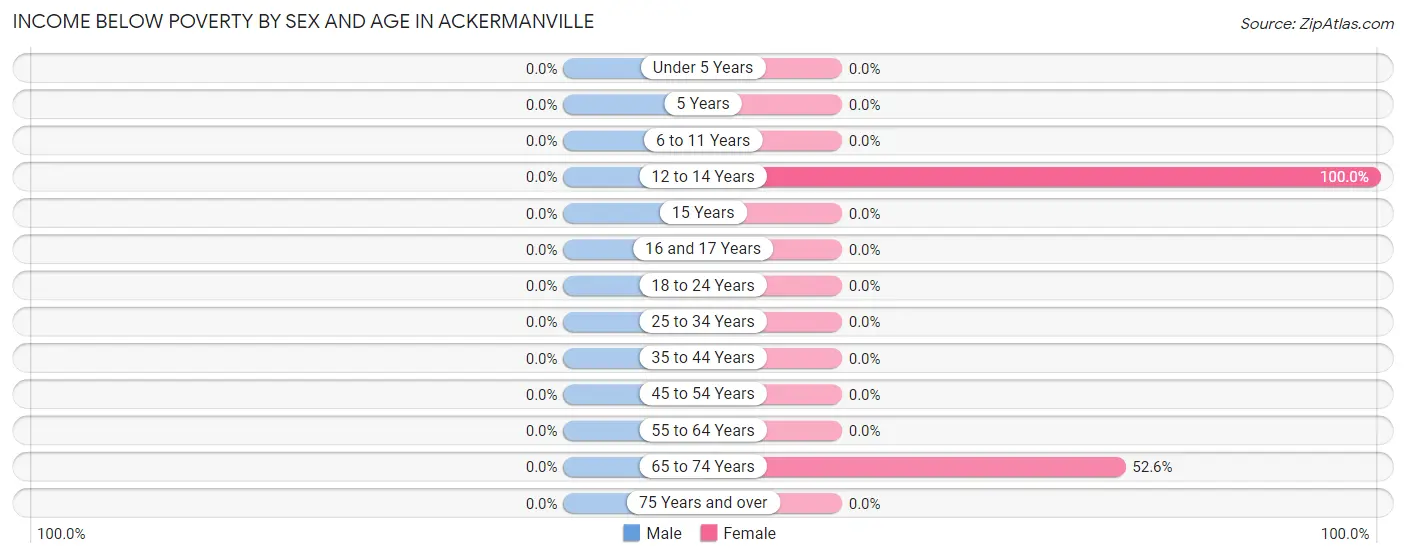
| Age Bracket | Male | Female |
| Under 5 Years | 0 (0.0%) | 0 (0.0%) |
| 5 Years | 0 (0.0%) | 0 (0.0%) |
| 6 to 11 Years | 0 (0.0%) | 0 (0.0%) |
| 12 to 14 Years | 0 (0.0%) | 10 (100.0%) |
| 15 Years | 0 (0.0%) | 0 (0.0%) |
| 16 and 17 Years | 0 (0.0%) | 0 (0.0%) |
| 18 to 24 Years | 0 (0.0%) | 0 (0.0%) |
| 25 to 34 Years | 0 (0.0%) | 0 (0.0%) |
| 35 to 44 Years | 0 (0.0%) | 0 (0.0%) |
| 45 to 54 Years | 0 (0.0%) | 0 (0.0%) |
| 55 to 64 Years | 0 (0.0%) | 0 (0.0%) |
| 65 to 74 Years | 0 (0.0%) | 10 (52.6%) |
| 75 Years and over | 0 (0.0%) | 0 (0.0%) |
| Total | 0 (0.0%) | 20 (14.9%) |
Income Above Poverty by Sex and Age in Ackermanville
According to the poverty statistics in Ackermanville, males aged 6 to 11 years and females aged under 5 years are the age groups that are most secure financially, with 100.0% of males and 100.0% of females in these age groups living above the poverty line.
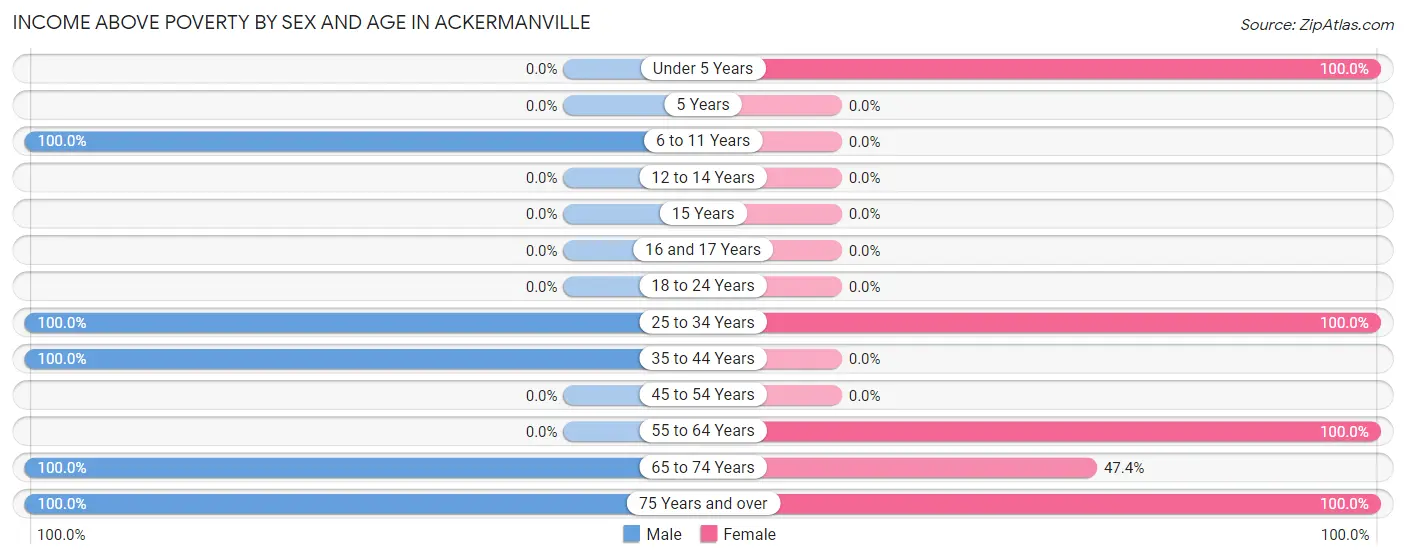
| Age Bracket | Male | Female |
| Under 5 Years | 0 (0.0%) | 40 (100.0%) |
| 5 Years | 0 (0.0%) | 0 (0.0%) |
| 6 to 11 Years | 31 (100.0%) | 0 (0.0%) |
| 12 to 14 Years | 0 (0.0%) | 0 (0.0%) |
| 15 Years | 0 (0.0%) | 0 (0.0%) |
| 16 and 17 Years | 0 (0.0%) | 0 (0.0%) |
| 18 to 24 Years | 0 (0.0%) | 0 (0.0%) |
| 25 to 34 Years | 70 (100.0%) | 47 (100.0%) |
| 35 to 44 Years | 11 (100.0%) | 0 (0.0%) |
| 45 to 54 Years | 0 (0.0%) | 0 (0.0%) |
| 55 to 64 Years | 0 (0.0%) | 8 (100.0%) |
| 65 to 74 Years | 16 (100.0%) | 9 (47.4%) |
| 75 Years and over | 18 (100.0%) | 10 (100.0%) |
| Total | 146 (100.0%) | 114 (85.1%) |
Income Below Poverty Among Married-Couple Families in Ackermanville
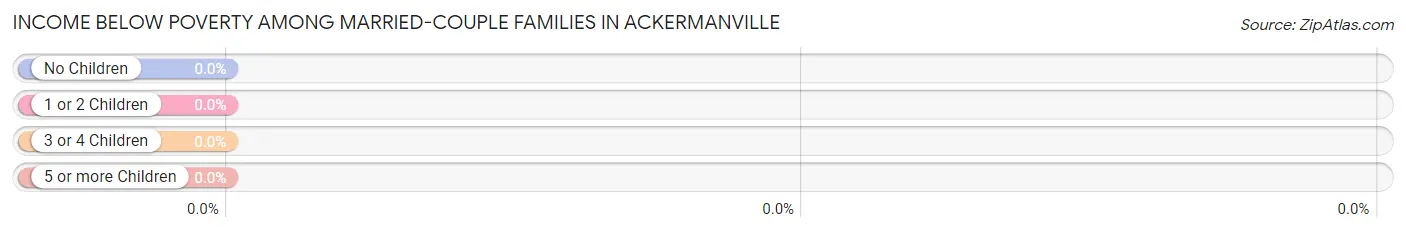
| Children | Above Poverty | Below Poverty |
| No Children | 43 (100.0%) | 0 (0.0%) |
| 1 or 2 Children | 40 (100.0%) | 0 (0.0%) |
| 3 or 4 Children | 0 (0.0%) | 0 (0.0%) |
| 5 or more Children | 0 (0.0%) | 0 (0.0%) |
| Total | 83 (100.0%) | 0 (0.0%) |
Income Below Poverty Among Single-Parent Households in Ackermanville
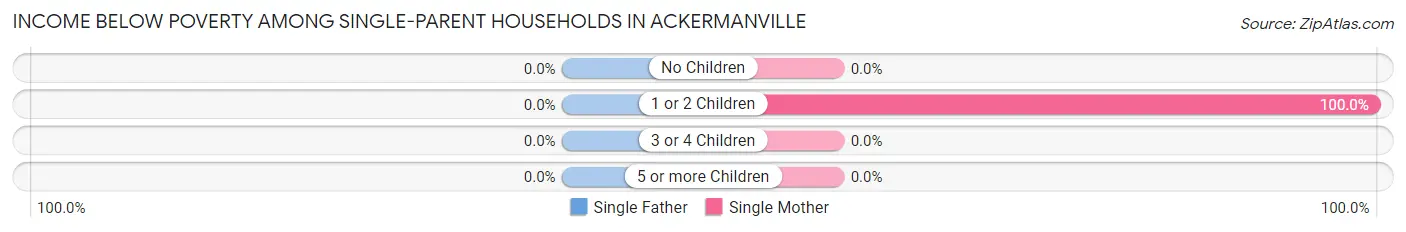
| Children | Single Father | Single Mother |
| No Children | 0 (0.0%) | 0 (0.0%) |
| 1 or 2 Children | 0 (0.0%) | 10 (100.0%) |
| 3 or 4 Children | 0 (0.0%) | 0 (0.0%) |
| 5 or more Children | 0 (0.0%) | 0 (0.0%) |
| Total | 0 (0.0%) | 10 (100.0%) |
Income Below Poverty Among Married-Couple vs Single-Parent Households in Ackermanville
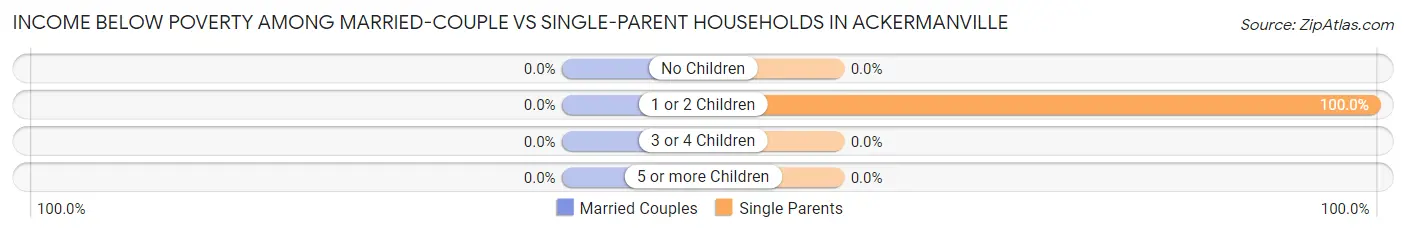
| Children | Married-Couple Families | Single-Parent Households |
| No Children | 0 (0.0%) | 0 (0.0%) |
| 1 or 2 Children | 0 (0.0%) | 10 (100.0%) |
| 3 or 4 Children | 0 (0.0%) | 0 (0.0%) |
| 5 or more Children | 0 (0.0%) | 0 (0.0%) |
| Total | 0 (0.0%) | 10 (100.0%) |
Employment Characteristics in Ackermanville
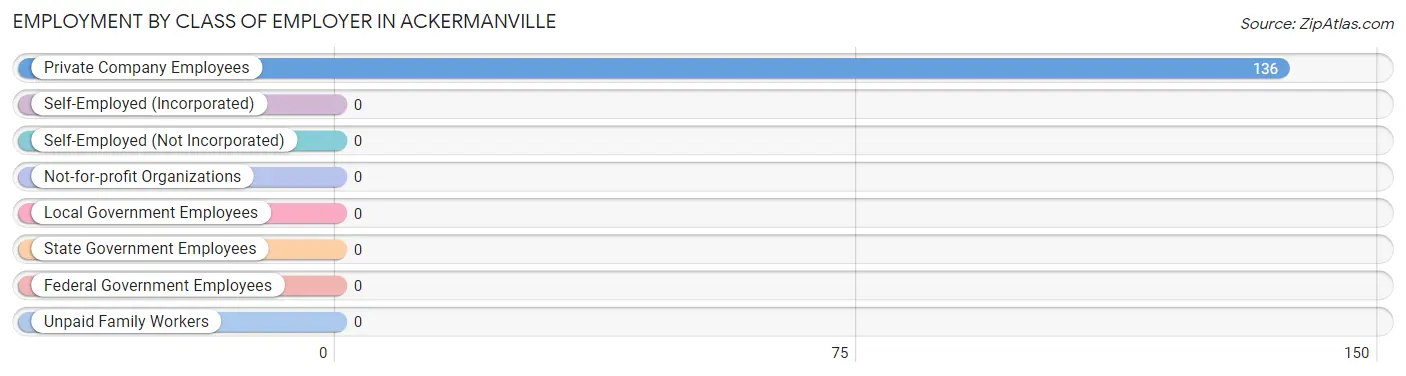
Employment by Class of Employer in Ackermanville
Among the 136 employed individuals in Ackermanville, , and private company employees (136 | 100.0%) make up the most common classes of employment.
| Employer Class | # Employees | % Employees |
| Private Company Employees | 136 | 100.0% |
| Self-Employed (Incorporated) | 0 | 0.0% |
| Self-Employed (Not Incorporated) | 0 | 0.0% |
| Not-for-profit Organizations | 0 | 0.0% |
| Local Government Employees | 0 | 0.0% |
| State Government Employees | 0 | 0.0% |
| Federal Government Employees | 0 | 0.0% |
| Unpaid Family Workers | 0 | 0.0% |
| Total | 136 | 100.0% |
Employment Status by Age in Ackermanville
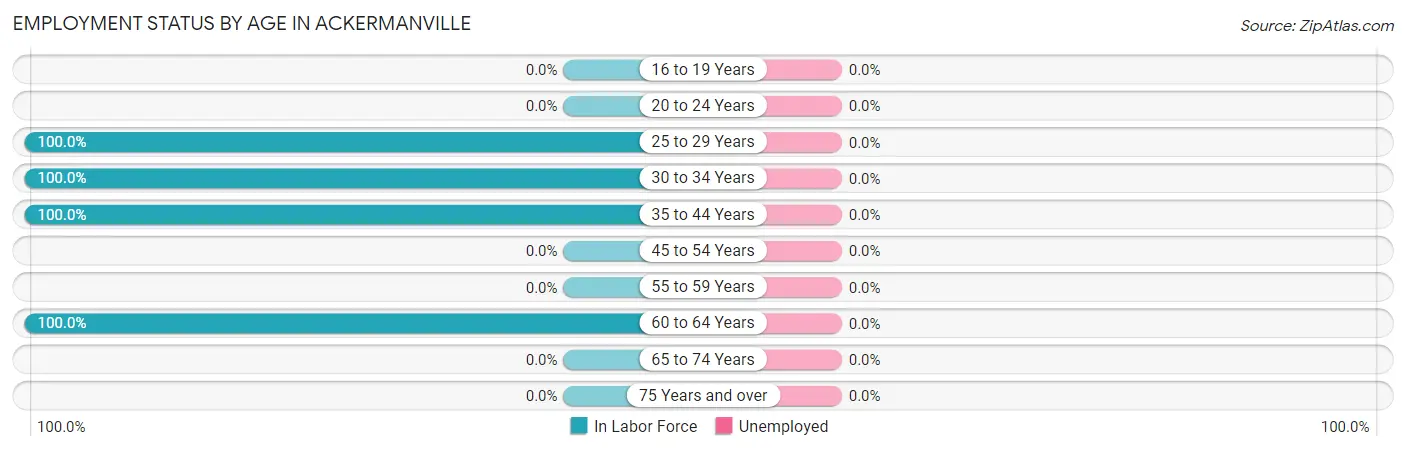
| Age Bracket | In Labor Force | Unemployed |
| 16 to 19 Years | 0 (0.0%) | 0 (0.0%) |
| 20 to 24 Years | 0 (0.0%) | 0 (0.0%) |
| 25 to 29 Years | 47 (100.0%) | 0 (0.0%) |
| 30 to 34 Years | 70 (100.0%) | 0 (0.0%) |
| 35 to 44 Years | 11 (100.0%) | 0 (0.0%) |
| 45 to 54 Years | 0 (0.0%) | 0 (0.0%) |
| 55 to 59 Years | 0 (0.0%) | 0 (0.0%) |
| 60 to 64 Years | 8 (100.0%) | 0 (0.0%) |
| 65 to 74 Years | 0 (0.0%) | 0 (0.0%) |
| 75 Years and over | 0 (0.0%) | 0 (0.0%) |
| Total | 136 (68.3%) | 0 (0.0%) |
Employment Status by Educational Attainment in Ackermanville
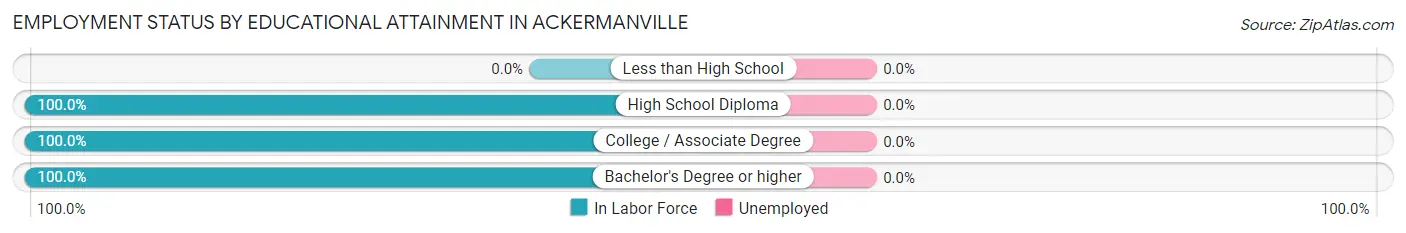
| Educational Attainment | In Labor Force | Unemployed |
| Less than High School | 0 (0.0%) | 0 (0.0%) |
| High School Diploma | 83 (100.0%) | 0 (0.0%) |
| College / Associate Degree | 38 (100.0%) | 0 (0.0%) |
| Bachelor's Degree or higher | 15 (100.0%) | 0 (0.0%) |
| Total | 136 (100.0%) | 0 (0.0%) |
Employment Occupations by Sex in Ackermanville
Management, Business, Science and Arts Occupations
The most common Management, Business, Science and Arts occupations in Ackermanville are Management (15 | 11.0%), Health Diagnosing & Treating (11 | 8.1%), Computers, Engineering & Science (8 | 5.9%), and Computers & Mathematics (8 | 5.9%).
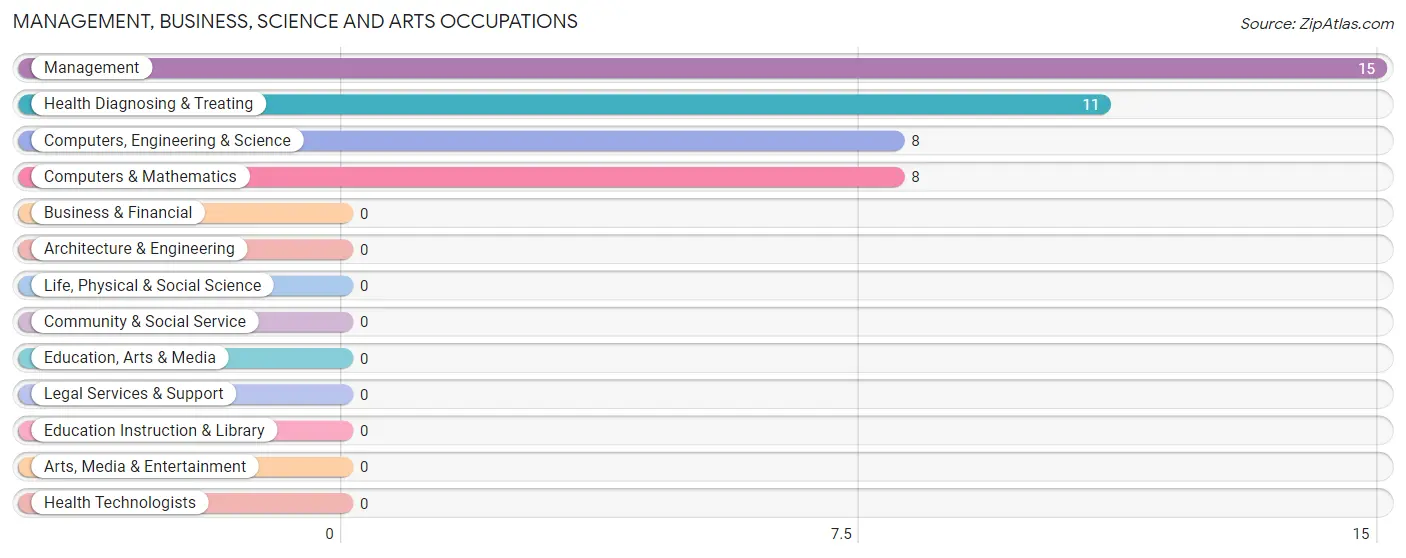
Management, Business, Science and Arts Occupations by Sex
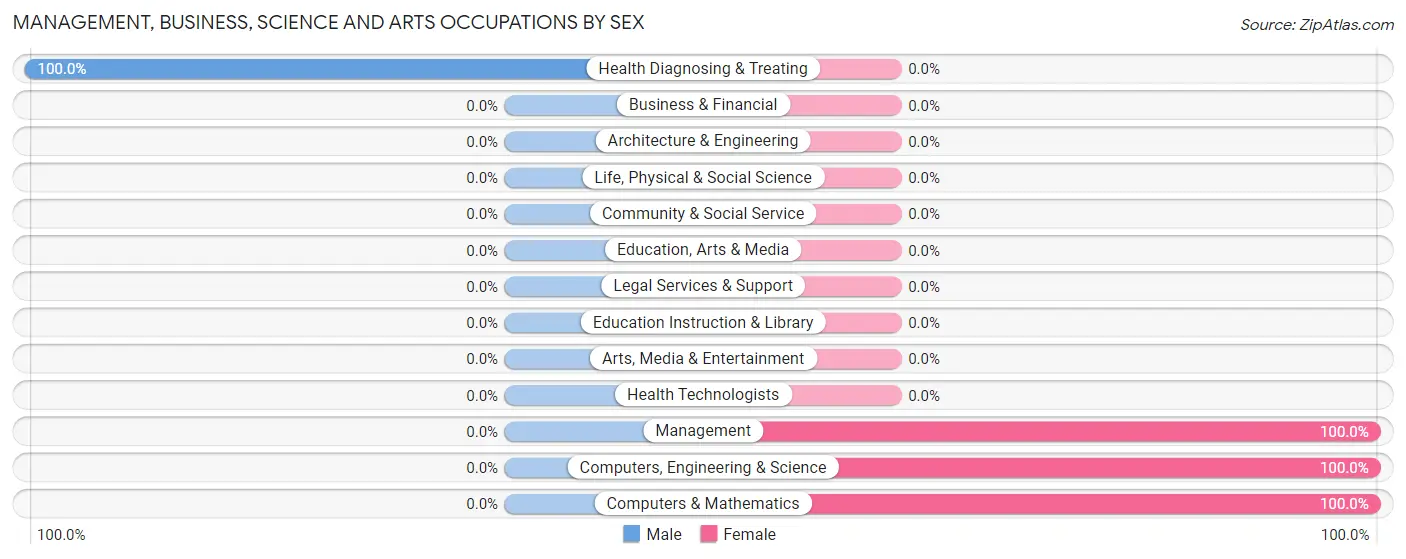
| Occupation | Male | Female |
| Management | 0 (0.0%) | 15 (100.0%) |
| Business & Financial | 0 (0.0%) | 0 (0.0%) |
| Computers, Engineering & Science | 0 (0.0%) | 8 (100.0%) |
| Computers & Mathematics | 0 (0.0%) | 8 (100.0%) |
| Architecture & Engineering | 0 (0.0%) | 0 (0.0%) |
| Life, Physical & Social Science | 0 (0.0%) | 0 (0.0%) |
| Community & Social Service | 0 (0.0%) | 0 (0.0%) |
| Education, Arts & Media | 0 (0.0%) | 0 (0.0%) |
| Legal Services & Support | 0 (0.0%) | 0 (0.0%) |
| Education Instruction & Library | 0 (0.0%) | 0 (0.0%) |
| Arts, Media & Entertainment | 0 (0.0%) | 0 (0.0%) |
| Health Diagnosing & Treating | 11 (100.0%) | 0 (0.0%) |
| Health Technologists | 0 (0.0%) | 0 (0.0%) |
| Total (Category) | 11 (32.4%) | 23 (67.6%) |
| Total (Overall) | 81 (59.6%) | 55 (40.4%) |
Services Occupations
Services Occupations by Sex
| Occupation | Male | Female |
| Healthcare Support | 0 (0.0%) | 0 (0.0%) |
| Security & Protection | 0 (0.0%) | 0 (0.0%) |
| Firefighting & Prevention | 0 (0.0%) | 0 (0.0%) |
| Law Enforcement | 0 (0.0%) | 0 (0.0%) |
| Food Preparation & Serving | 0 (0.0%) | 0 (0.0%) |
| Cleaning & Maintenance | 0 (0.0%) | 0 (0.0%) |
| Personal Care & Service | 0 (0.0%) | 0 (0.0%) |
| Total (Category) | 0 (0.0%) | 0 (0.0%) |
| Total (Overall) | 81 (59.6%) | 55 (40.4%) |
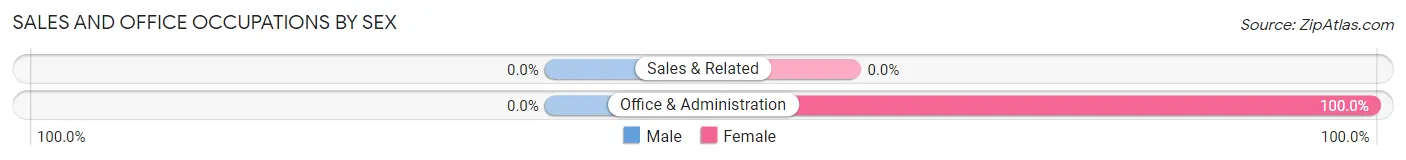
Sales and Office Occupations
The most common Sales and Office occupations in Ackermanville are , and Office & Administration (32 | 23.5%).
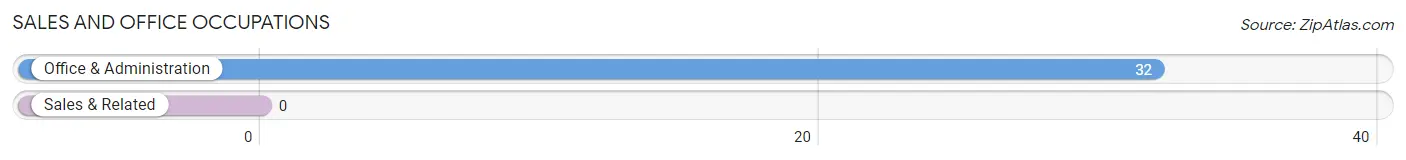
Sales and Office Occupations by Sex
| Occupation | Male | Female |
| Sales & Related | 0 (0.0%) | 0 (0.0%) |
| Office & Administration | 0 (0.0%) | 32 (100.0%) |
| Total (Category) | 0 (0.0%) | 32 (100.0%) |
| Total (Overall) | 81 (59.6%) | 55 (40.4%) |
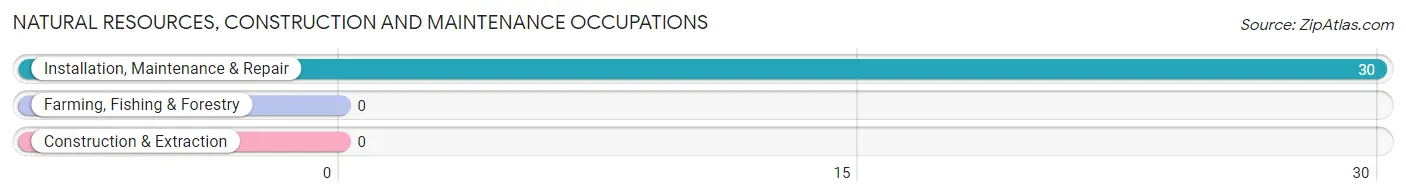
Natural Resources, Construction and Maintenance Occupations
The most common Natural Resources, Construction and Maintenance occupations in Ackermanville are , and Installation, Maintenance & Repair (30 | 22.1%).
Natural Resources, Construction and Maintenance Occupations by Sex
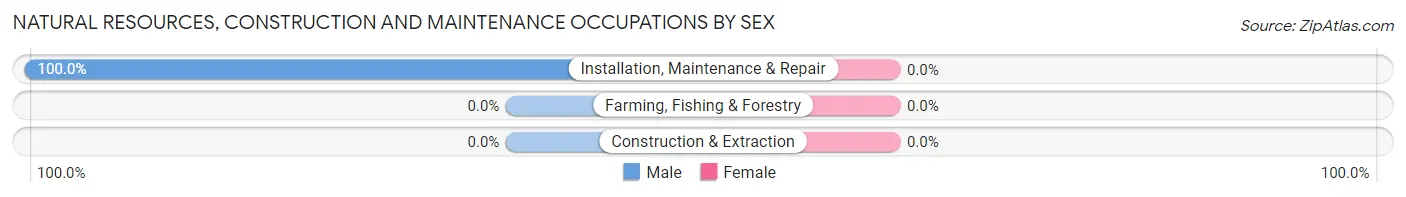
| Occupation | Male | Female |
| Farming, Fishing & Forestry | 0 (0.0%) | 0 (0.0%) |
| Construction & Extraction | 0 (0.0%) | 0 (0.0%) |
| Installation, Maintenance & Repair | 30 (100.0%) | 0 (0.0%) |
| Total (Category) | 30 (100.0%) | 0 (0.0%) |
| Total (Overall) | 81 (59.6%) | 55 (40.4%) |
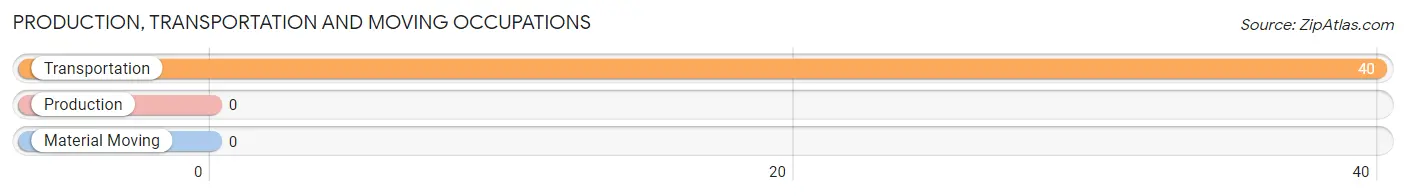
Production, Transportation and Moving Occupations
The most common Production, Transportation and Moving occupations in Ackermanville are , and Transportation (40 | 29.4%).
Production, Transportation and Moving Occupations by Sex
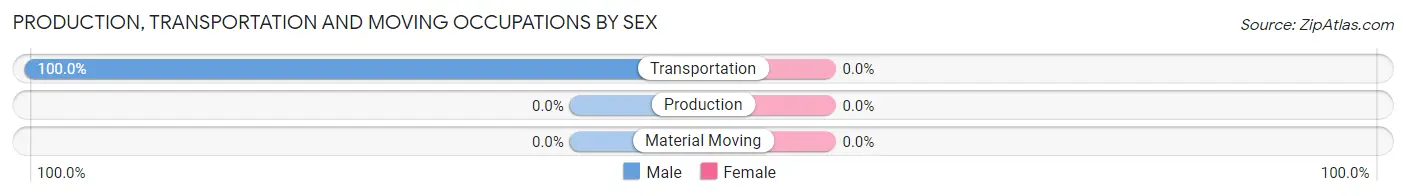
| Occupation | Male | Female |
| Production | 0 (0.0%) | 0 (0.0%) |
| Transportation | 40 (100.0%) | 0 (0.0%) |
| Material Moving | 0 (0.0%) | 0 (0.0%) |
| Total (Category) | 40 (100.0%) | 0 (0.0%) |
| Total (Overall) | 81 (59.6%) | 55 (40.4%) |
Employment Industries by Sex in Ackermanville
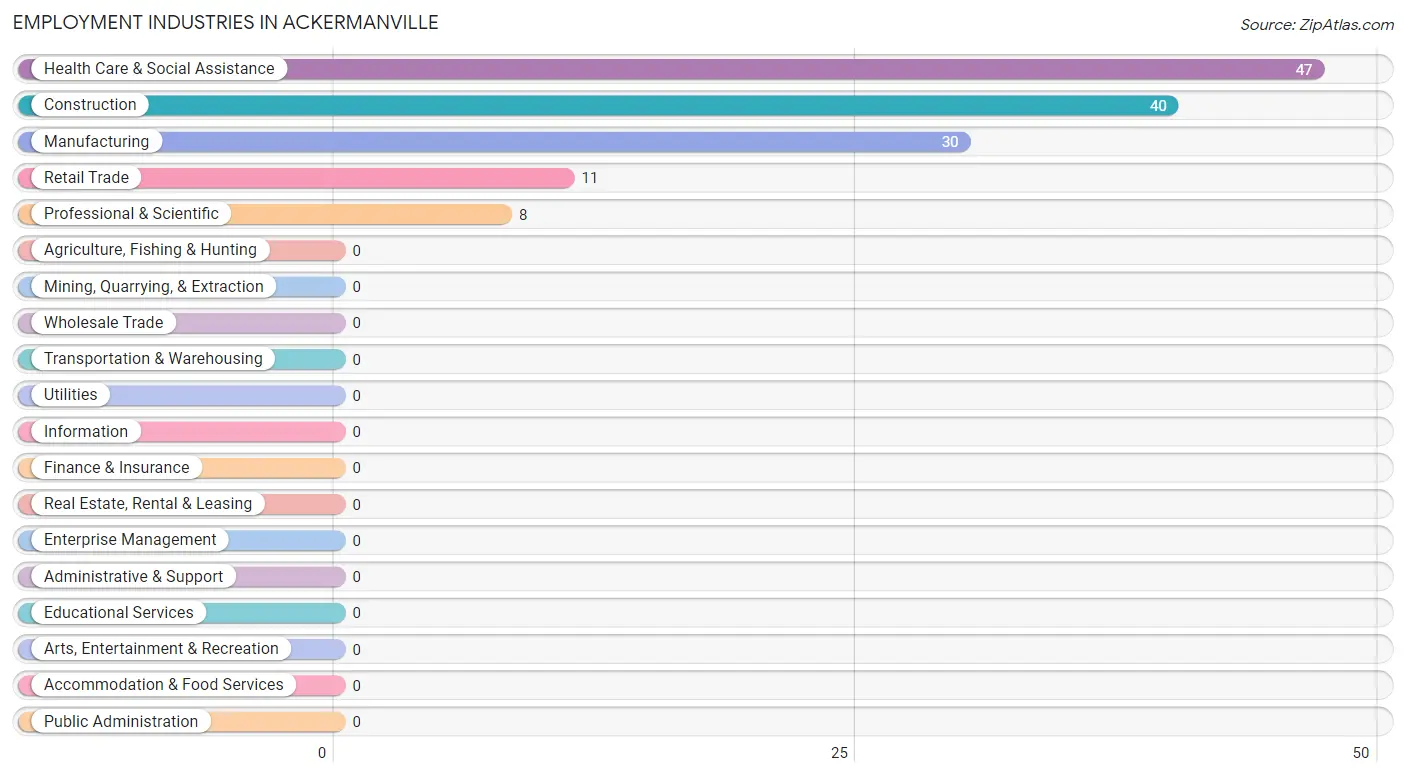
Employment Industries in Ackermanville
The major employment industries in Ackermanville include Health Care & Social Assistance (47 | 34.6%), Construction (40 | 29.4%), Manufacturing (30 | 22.1%), Retail Trade (11 | 8.1%), and Professional & Scientific (8 | 5.9%).
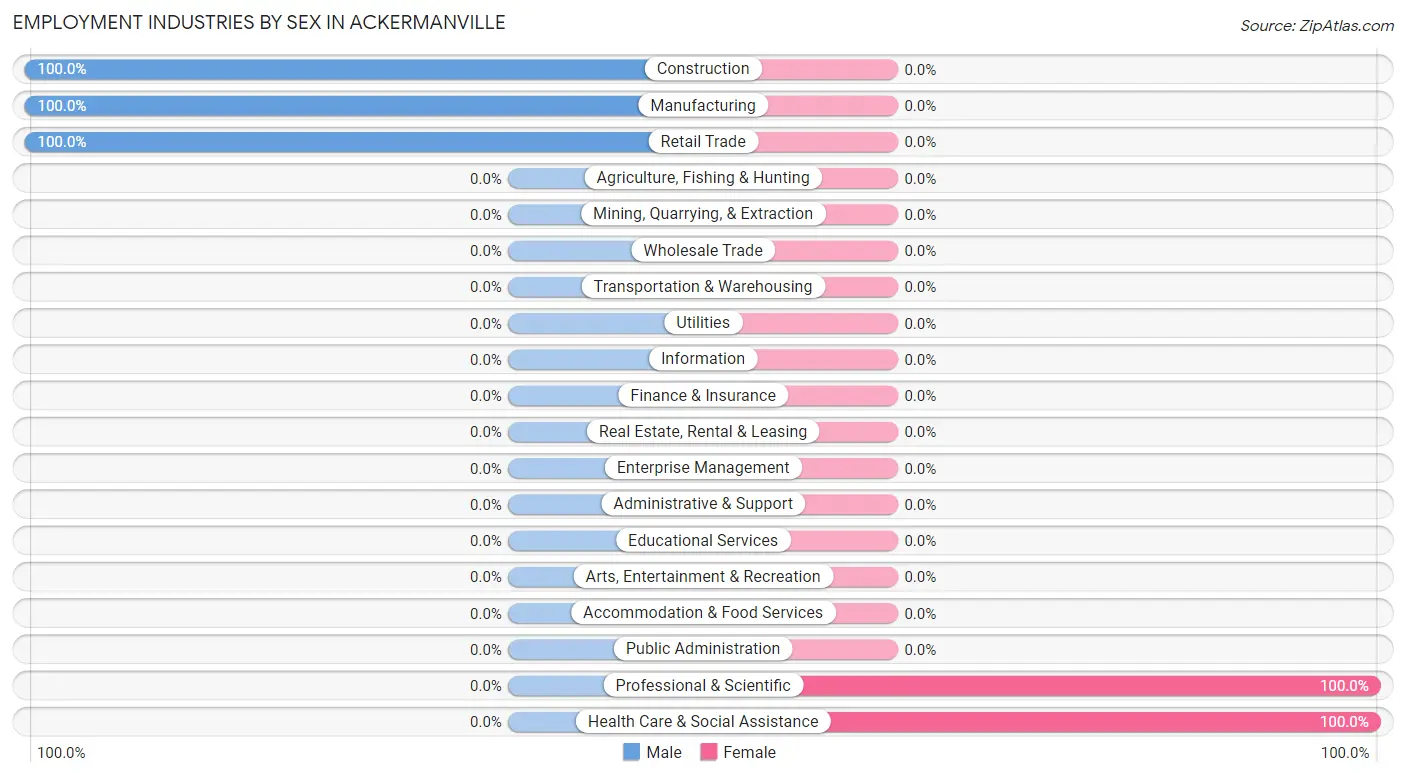
Employment Industries by Sex in Ackermanville
The Ackermanville industries that see more men than women are Construction (100.0%), Manufacturing (100.0%), and Retail Trade (100.0%), whereas the industries that tend to have a higher number of women are Professional & Scientific (100.0%), and Health Care & Social Assistance (100.0%).
| Industry | Male | Female |
| Agriculture, Fishing & Hunting | 0 (0.0%) | 0 (0.0%) |
| Mining, Quarrying, & Extraction | 0 (0.0%) | 0 (0.0%) |
| Construction | 40 (100.0%) | 0 (0.0%) |
| Manufacturing | 30 (100.0%) | 0 (0.0%) |
| Wholesale Trade | 0 (0.0%) | 0 (0.0%) |
| Retail Trade | 11 (100.0%) | 0 (0.0%) |
| Transportation & Warehousing | 0 (0.0%) | 0 (0.0%) |
| Utilities | 0 (0.0%) | 0 (0.0%) |
| Information | 0 (0.0%) | 0 (0.0%) |
| Finance & Insurance | 0 (0.0%) | 0 (0.0%) |
| Real Estate, Rental & Leasing | 0 (0.0%) | 0 (0.0%) |
| Professional & Scientific | 0 (0.0%) | 8 (100.0%) |
| Enterprise Management | 0 (0.0%) | 0 (0.0%) |
| Administrative & Support | 0 (0.0%) | 0 (0.0%) |
| Educational Services | 0 (0.0%) | 0 (0.0%) |
| Health Care & Social Assistance | 0 (0.0%) | 47 (100.0%) |
| Arts, Entertainment & Recreation | 0 (0.0%) | 0 (0.0%) |
| Accommodation & Food Services | 0 (0.0%) | 0 (0.0%) |
| Public Administration | 0 (0.0%) | 0 (0.0%) |
| Total | 81 (59.6%) | 55 (40.4%) |
Education in Ackermanville
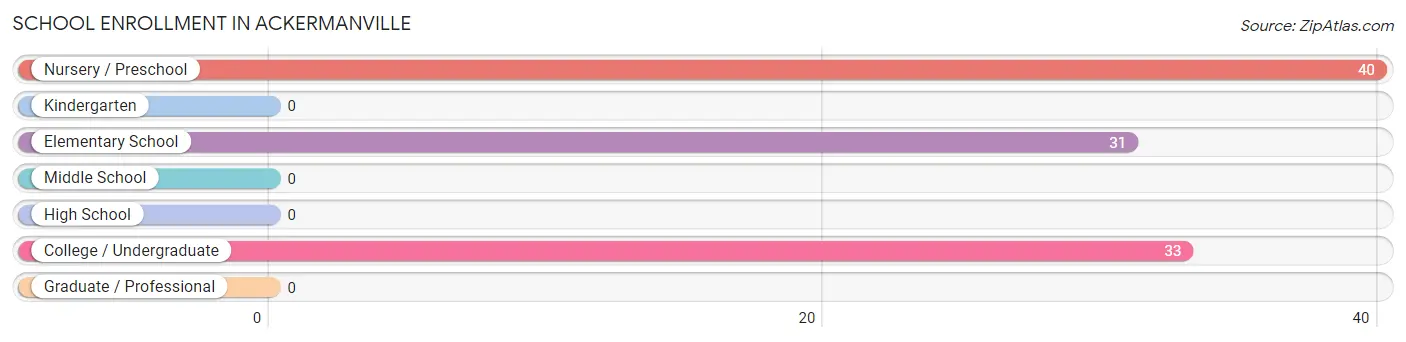
School Enrollment in Ackermanville
The most common levels of schooling among the 104 students in Ackermanville are nursery / preschool (40 | 38.5%), college / undergraduate (33 | 31.7%), and elementary school (31 | 29.8%).
| School Level | # Students | % Students |
| Nursery / Preschool | 40 | 38.5% |
| Kindergarten | 0 | 0.0% |
| Elementary School | 31 | 29.8% |
| Middle School | 0 | 0.0% |
| High School | 0 | 0.0% |
| College / Undergraduate | 33 | 31.7% |
| Graduate / Professional | 0 | 0.0% |
| Total | 104 | 100.0% |
School Enrollment by Age by Funding Source in Ackermanville
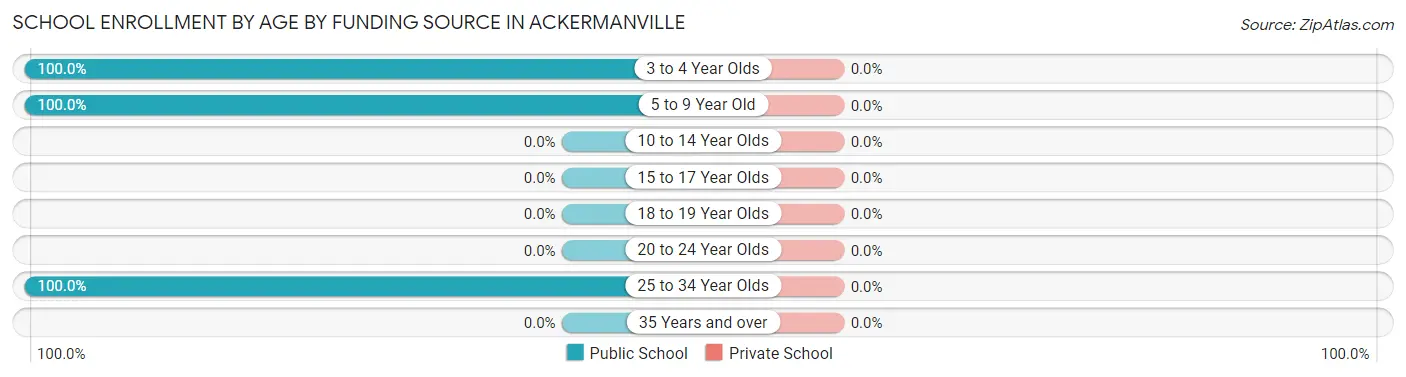
| Age Bracket | Public School | Private School |
| 3 to 4 Year Olds | 40 (100.0%) | 0 (0.0%) |
| 5 to 9 Year Old | 31 (100.0%) | 0 (0.0%) |
| 10 to 14 Year Olds | 0 (0.0%) | 0 (0.0%) |
| 15 to 17 Year Olds | 0 (0.0%) | 0 (0.0%) |
| 18 to 19 Year Olds | 0 (0.0%) | 0 (0.0%) |
| 20 to 24 Year Olds | 0 (0.0%) | 0 (0.0%) |
| 25 to 34 Year Olds | 33 (100.0%) | 0 (0.0%) |
| 35 Years and over | 0 (0.0%) | 0 (0.0%) |
| Total | 104 (100.0%) | 0 (0.0%) |
Educational Attainment by Field of Study in Ackermanville
, and arts & humanities (15 | 100.0%) are the most common fields of study among 15 individuals in Ackermanville who have obtained a bachelor's degree or higher.
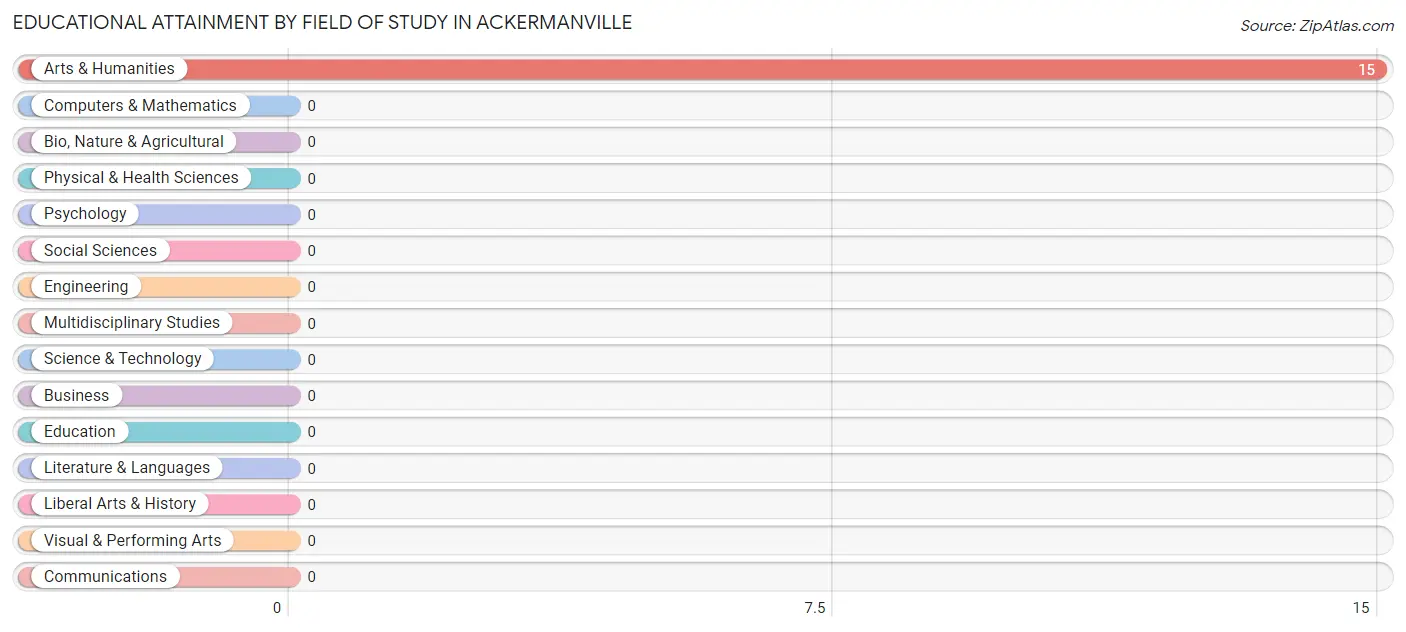
| Field of Study | # Graduates | % Graduates |
| Computers & Mathematics | 0 | 0.0% |
| Bio, Nature & Agricultural | 0 | 0.0% |
| Physical & Health Sciences | 0 | 0.0% |
| Psychology | 0 | 0.0% |
| Social Sciences | 0 | 0.0% |
| Engineering | 0 | 0.0% |
| Multidisciplinary Studies | 0 | 0.0% |
| Science & Technology | 0 | 0.0% |
| Business | 0 | 0.0% |
| Education | 0 | 0.0% |
| Literature & Languages | 0 | 0.0% |
| Liberal Arts & History | 0 | 0.0% |
| Visual & Performing Arts | 0 | 0.0% |
| Communications | 0 | 0.0% |
| Arts & Humanities | 15 | 100.0% |
| Total | 15 | 100.0% |
Transportation & Commute in Ackermanville
Vehicle Availability by Sex in Ackermanville
The most prevalent vehicle ownership categories in Ackermanville are males with 3 vehicles (40, accounting for 49.4%) and females with 3 vehicles (32, making up 72.7%).
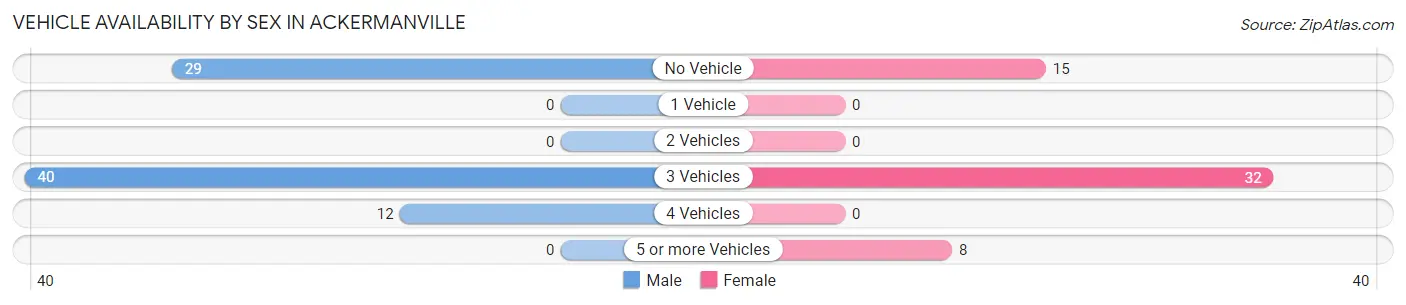
| Vehicles Available | Male | Female |
| No Vehicle | 29 (35.8%) | 15 (27.3%) |
| 1 Vehicle | 0 (0.0%) | 0 (0.0%) |
| 2 Vehicles | 0 (0.0%) | 0 (0.0%) |
| 3 Vehicles | 40 (49.4%) | 32 (58.2%) |
| 4 Vehicles | 12 (14.8%) | 0 (0.0%) |
| 5 or more Vehicles | 0 (0.0%) | 8 (14.5%) |
| Total | 81 (100.0%) | 55 (100.0%) |
Commute Time in Ackermanville
The most frequently occuring commute durations in Ackermanville are 15 to 19 minutes (58 commuters, 42.6%), less than 5 minutes (32 commuters, 23.5%), and 40 to 44 minutes (26 commuters, 19.1%).
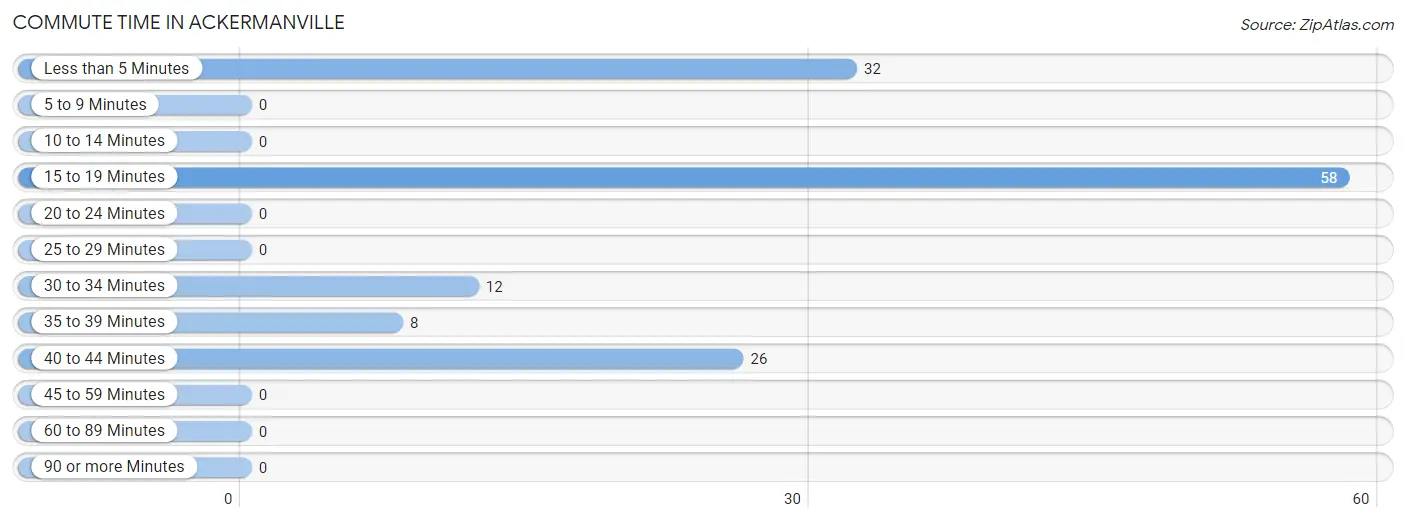
| Commute Time | # Commuters | % Commuters |
| Less than 5 Minutes | 32 | 23.5% |
| 5 to 9 Minutes | 0 | 0.0% |
| 10 to 14 Minutes | 0 | 0.0% |
| 15 to 19 Minutes | 58 | 42.6% |
| 20 to 24 Minutes | 0 | 0.0% |
| 25 to 29 Minutes | 0 | 0.0% |
| 30 to 34 Minutes | 12 | 8.8% |
| 35 to 39 Minutes | 8 | 5.9% |
| 40 to 44 Minutes | 26 | 19.1% |
| 45 to 59 Minutes | 0 | 0.0% |
| 60 to 89 Minutes | 0 | 0.0% |
| 90 or more Minutes | 0 | 0.0% |
Commute Time by Sex in Ackermanville
The most common commute times in Ackermanville are 15 to 19 minutes (58 commuters, 71.6%) for males and less than 5 minutes (32 commuters, 58.2%) for females.
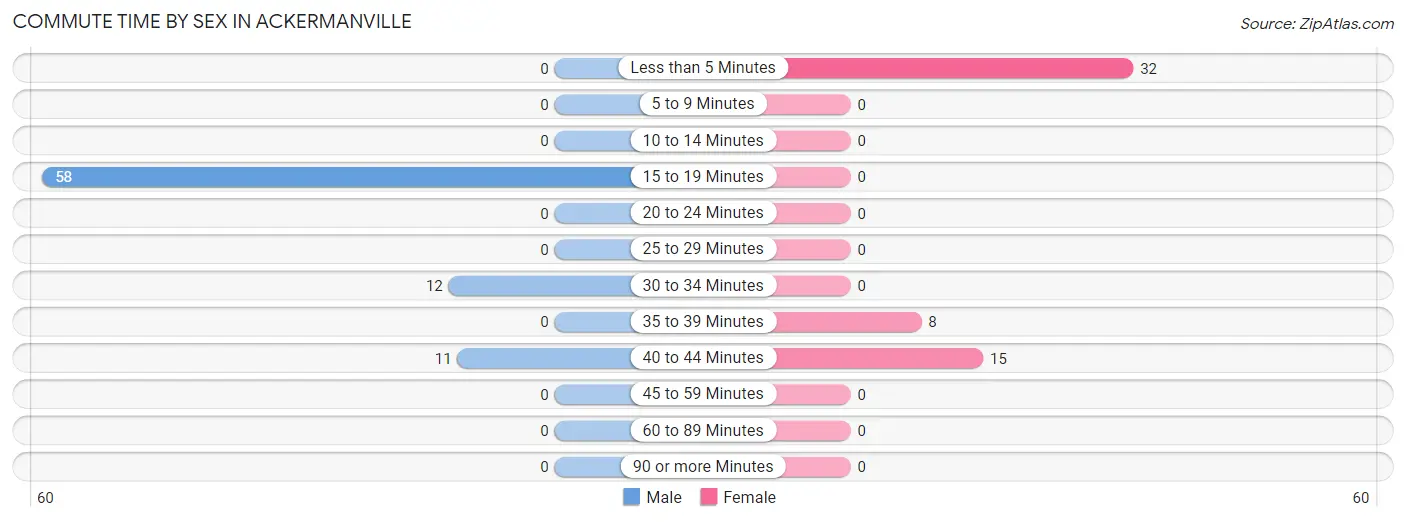
| Commute Time | Male | Female |
| Less than 5 Minutes | 0 (0.0%) | 32 (58.2%) |
| 5 to 9 Minutes | 0 (0.0%) | 0 (0.0%) |
| 10 to 14 Minutes | 0 (0.0%) | 0 (0.0%) |
| 15 to 19 Minutes | 58 (71.6%) | 0 (0.0%) |
| 20 to 24 Minutes | 0 (0.0%) | 0 (0.0%) |
| 25 to 29 Minutes | 0 (0.0%) | 0 (0.0%) |
| 30 to 34 Minutes | 12 (14.8%) | 0 (0.0%) |
| 35 to 39 Minutes | 0 (0.0%) | 8 (14.5%) |
| 40 to 44 Minutes | 11 (13.6%) | 15 (27.3%) |
| 45 to 59 Minutes | 0 (0.0%) | 0 (0.0%) |
| 60 to 89 Minutes | 0 (0.0%) | 0 (0.0%) |
| 90 or more Minutes | 0 (0.0%) | 0 (0.0%) |
Time of Departure to Work by Sex in Ackermanville
The most frequent times of departure to work in Ackermanville are 7:30 AM to 7:59 AM (40, 49.4%) for males and 6:30 AM to 6:59 AM (32, 58.2%) for females.
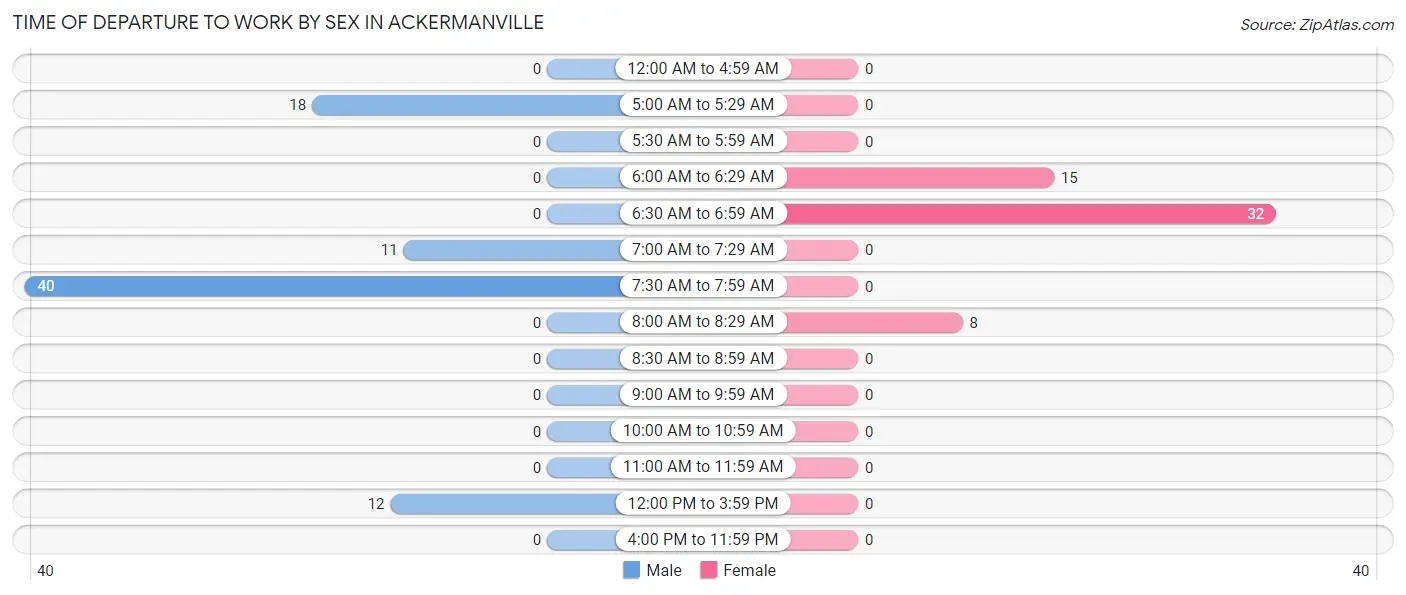
| Time of Departure | Male | Female |
| 12:00 AM to 4:59 AM | 0 (0.0%) | 0 (0.0%) |
| 5:00 AM to 5:29 AM | 18 (22.2%) | 0 (0.0%) |
| 5:30 AM to 5:59 AM | 0 (0.0%) | 0 (0.0%) |
| 6:00 AM to 6:29 AM | 0 (0.0%) | 15 (27.3%) |
| 6:30 AM to 6:59 AM | 0 (0.0%) | 32 (58.2%) |
| 7:00 AM to 7:29 AM | 11 (13.6%) | 0 (0.0%) |
| 7:30 AM to 7:59 AM | 40 (49.4%) | 0 (0.0%) |
| 8:00 AM to 8:29 AM | 0 (0.0%) | 8 (14.5%) |
| 8:30 AM to 8:59 AM | 0 (0.0%) | 0 (0.0%) |
| 9:00 AM to 9:59 AM | 0 (0.0%) | 0 (0.0%) |
| 10:00 AM to 10:59 AM | 0 (0.0%) | 0 (0.0%) |
| 11:00 AM to 11:59 AM | 0 (0.0%) | 0 (0.0%) |
| 12:00 PM to 3:59 PM | 12 (14.8%) | 0 (0.0%) |
| 4:00 PM to 11:59 PM | 0 (0.0%) | 0 (0.0%) |
| Total | 81 (100.0%) | 55 (100.0%) |
Housing Occupancy in Ackermanville
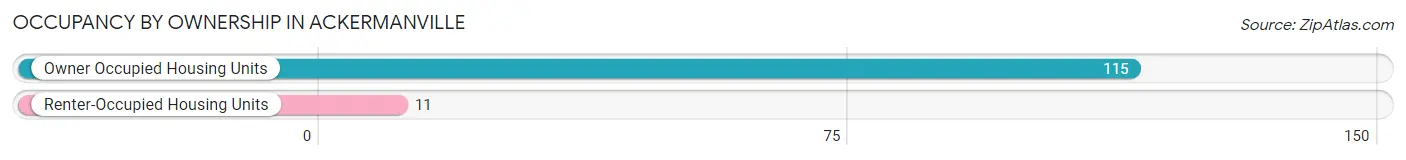
Occupancy by Ownership in Ackermanville
Of the total 126 dwellings in Ackermanville, owner-occupied units account for 115 (91.3%), while renter-occupied units make up 11 (8.7%).
| Occupancy | # Housing Units | % Housing Units |
| Owner Occupied Housing Units | 115 | 91.3% |
| Renter-Occupied Housing Units | 11 | 8.7% |
| Total Occupied Housing Units | 126 | 100.0% |
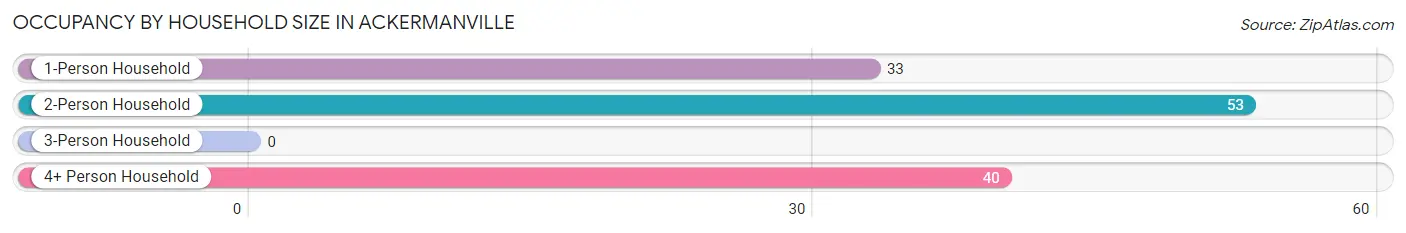
Occupancy by Household Size in Ackermanville
| Household Size | # Housing Units | % Housing Units |
| 1-Person Household | 33 | 26.2% |
| 2-Person Household | 53 | 42.1% |
| 3-Person Household | 0 | 0.0% |
| 4+ Person Household | 40 | 31.8% |
| Total Housing Units | 126 | 100.0% |
Occupancy by Ownership by Household Size in Ackermanville
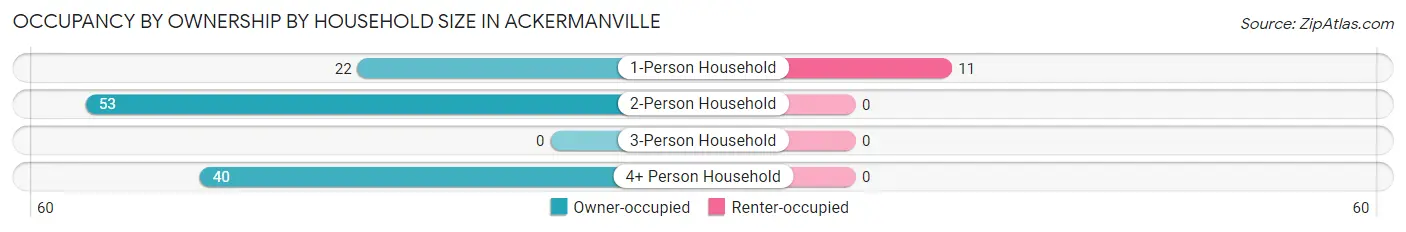
| Household Size | Owner-occupied | Renter-occupied |
| 1-Person Household | 22 (66.7%) | 11 (33.3%) |
| 2-Person Household | 53 (100.0%) | 0 (0.0%) |
| 3-Person Household | 0 (0.0%) | 0 (0.0%) |
| 4+ Person Household | 40 (100.0%) | 0 (0.0%) |
| Total Housing Units | 115 (91.3%) | 11 (8.7%) |
Occupancy by Educational Attainment in Ackermanville
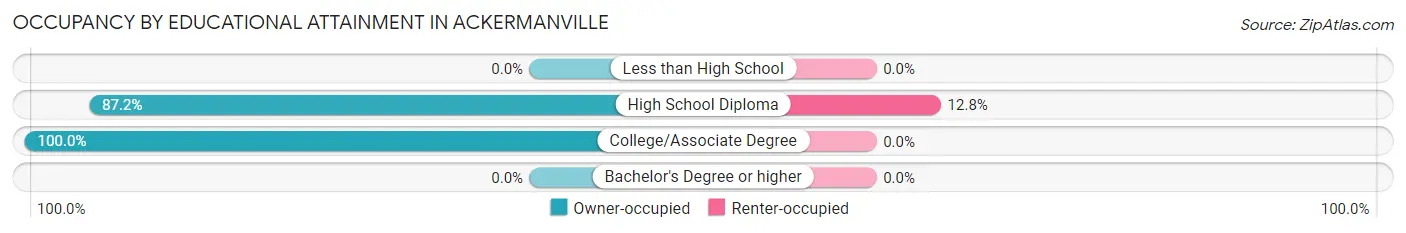
| Household Size | Owner-occupied | Renter-occupied |
| Less than High School | 0 (0.0%) | 0 (0.0%) |
| High School Diploma | 75 (87.2%) | 11 (12.8%) |
| College/Associate Degree | 40 (100.0%) | 0 (0.0%) |
| Bachelor's Degree or higher | 0 (0.0%) | 0 (0.0%) |
Occupancy by Age of Householder in Ackermanville
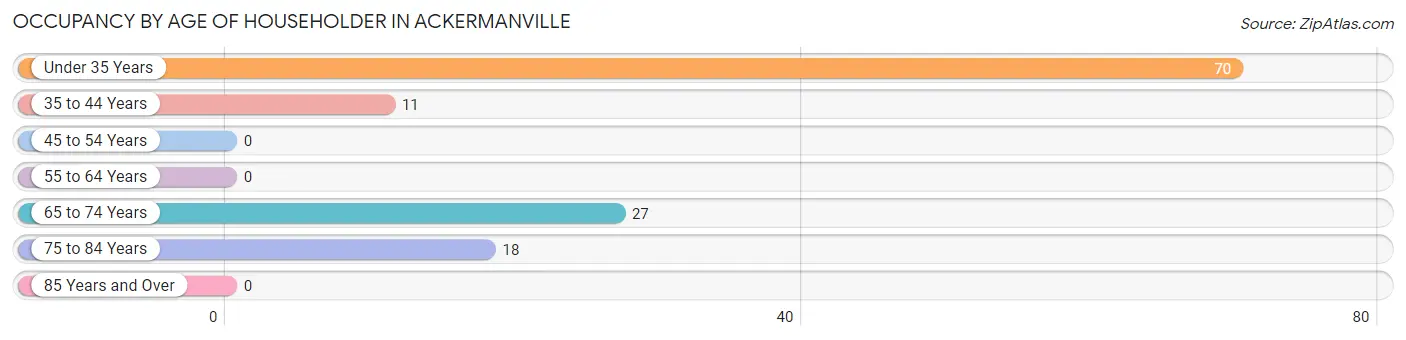
| Age Bracket | # Households | % Households |
| Under 35 Years | 70 | 55.6% |
| 35 to 44 Years | 11 | 8.7% |
| 45 to 54 Years | 0 | 0.0% |
| 55 to 64 Years | 0 | 0.0% |
| 65 to 74 Years | 27 | 21.4% |
| 75 to 84 Years | 18 | 14.3% |
| 85 Years and Over | 0 | 0.0% |
| Total | 126 | 100.0% |
Housing Finances in Ackermanville
Median Income by Occupancy in Ackermanville
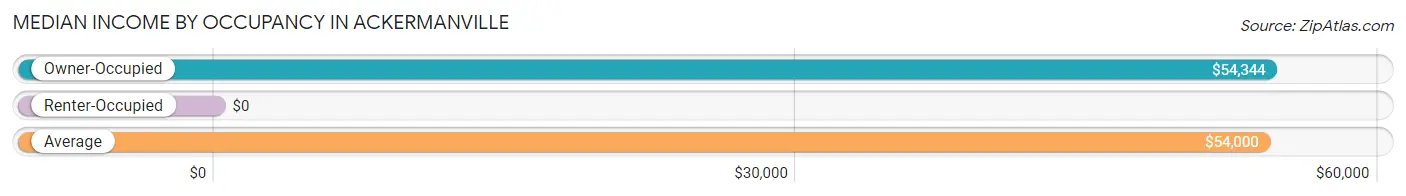
| Occupancy Type | # Households | Median Income |
| Owner-Occupied | 115 (91.3%) | $54,344 |
| Renter-Occupied | 11 (8.7%) | $0 |
| Average | 126 (100.0%) | $54,000 |
Occupancy by Householder Income Bracket in Ackermanville
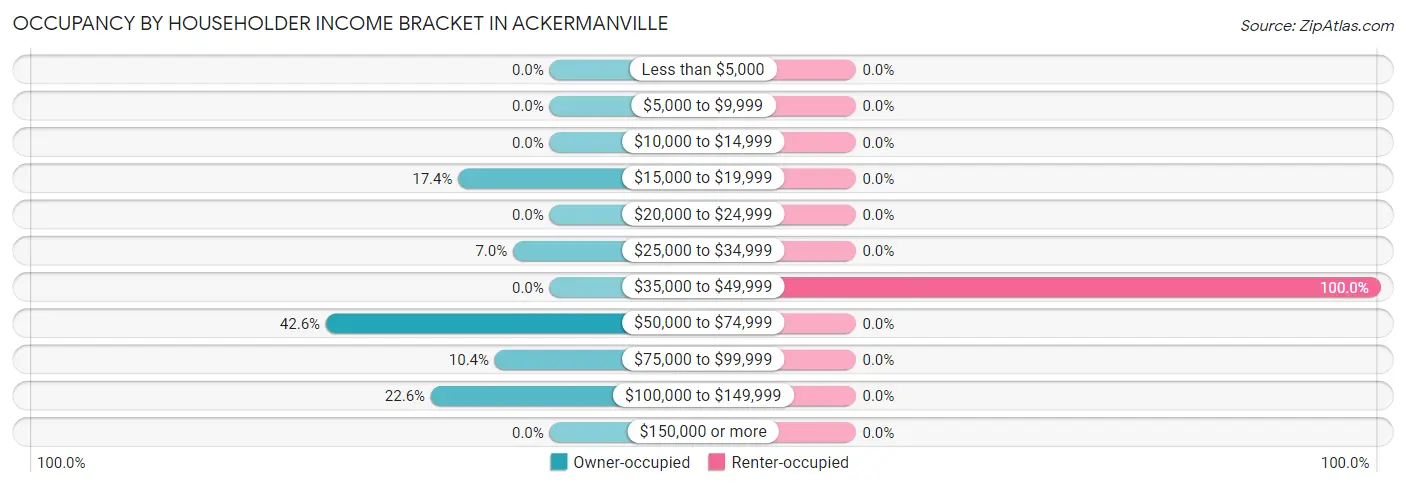
| Income Bracket | Owner-occupied | Renter-occupied |
| Less than $5,000 | 0 (0.0%) | 0 (0.0%) |
| $5,000 to $9,999 | 0 (0.0%) | 0 (0.0%) |
| $10,000 to $14,999 | 0 (0.0%) | 0 (0.0%) |
| $15,000 to $19,999 | 20 (17.4%) | 0 (0.0%) |
| $20,000 to $24,999 | 0 (0.0%) | 0 (0.0%) |
| $25,000 to $34,999 | 8 (7.0%) | 0 (0.0%) |
| $35,000 to $49,999 | 0 (0.0%) | 11 (100.0%) |
| $50,000 to $74,999 | 49 (42.6%) | 0 (0.0%) |
| $75,000 to $99,999 | 12 (10.4%) | 0 (0.0%) |
| $100,000 to $149,999 | 26 (22.6%) | 0 (0.0%) |
| $150,000 or more | 0 (0.0%) | 0 (0.0%) |
| Total | 115 (100.0%) | 11 (100.0%) |
Monthly Housing Cost Tiers in Ackermanville
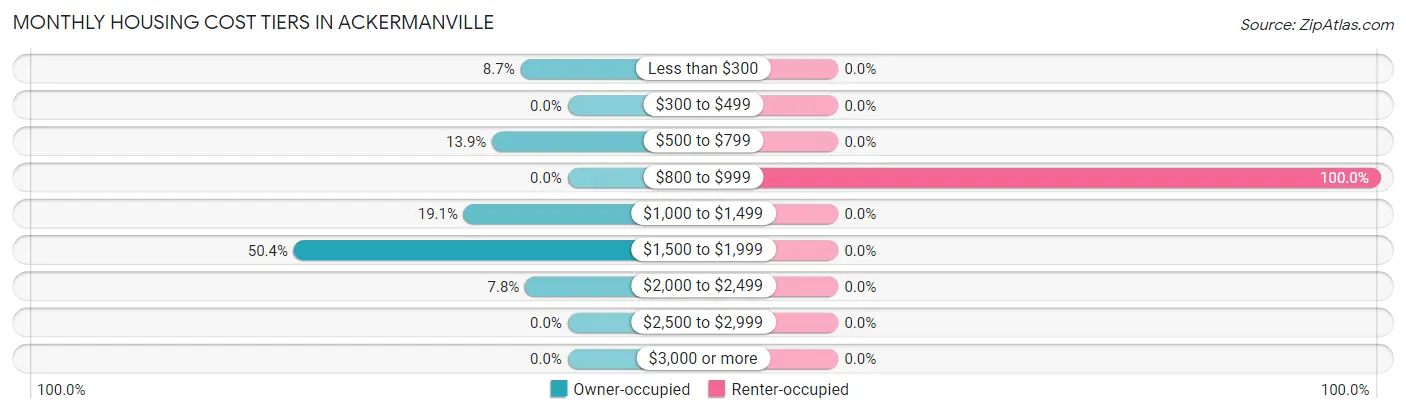
| Monthly Cost | Owner-occupied | Renter-occupied |
| Less than $300 | 10 (8.7%) | 0 (0.0%) |
| $300 to $499 | 0 (0.0%) | 0 (0.0%) |
| $500 to $799 | 16 (13.9%) | 0 (0.0%) |
| $800 to $999 | 0 (0.0%) | 11 (100.0%) |
| $1,000 to $1,499 | 22 (19.1%) | 0 (0.0%) |
| $1,500 to $1,999 | 58 (50.4%) | 0 (0.0%) |
| $2,000 to $2,499 | 9 (7.8%) | 0 (0.0%) |
| $2,500 to $2,999 | 0 (0.0%) | 0 (0.0%) |
| $3,000 or more | 0 (0.0%) | 0 (0.0%) |
| Total | 115 (100.0%) | 11 (100.0%) |
Physical Housing Characteristics in Ackermanville
Housing Structures in Ackermanville
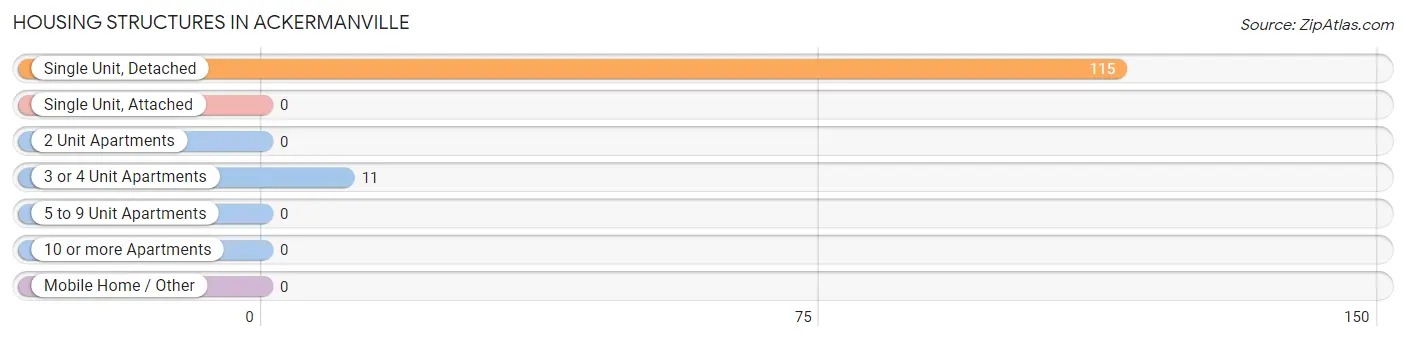
| Structure Type | # Housing Units | % Housing Units |
| Single Unit, Detached | 115 | 91.3% |
| Single Unit, Attached | 0 | 0.0% |
| 2 Unit Apartments | 0 | 0.0% |
| 3 or 4 Unit Apartments | 11 | 8.7% |
| 5 to 9 Unit Apartments | 0 | 0.0% |
| 10 or more Apartments | 0 | 0.0% |
| Mobile Home / Other | 0 | 0.0% |
| Total | 126 | 100.0% |
Housing Structures by Occupancy in Ackermanville
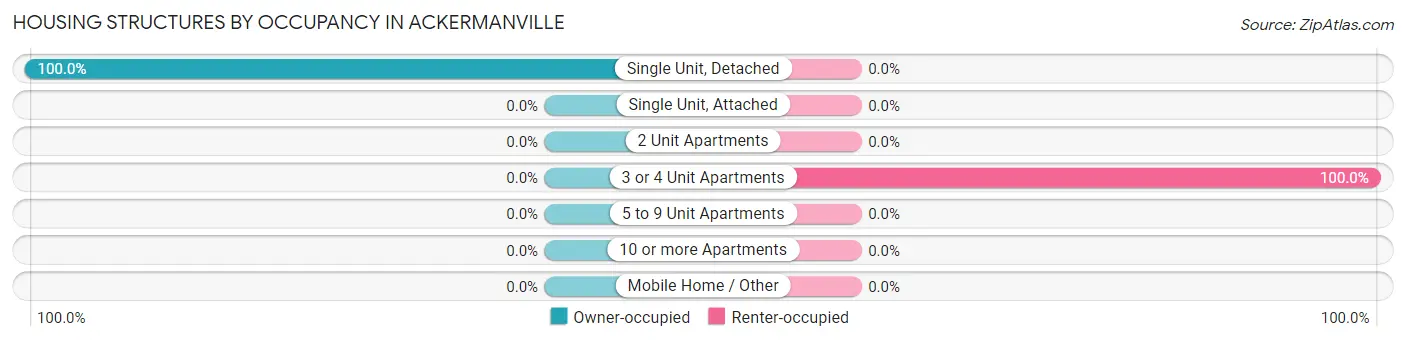
| Structure Type | Owner-occupied | Renter-occupied |
| Single Unit, Detached | 115 (100.0%) | 0 (0.0%) |
| Single Unit, Attached | 0 (0.0%) | 0 (0.0%) |
| 2 Unit Apartments | 0 (0.0%) | 0 (0.0%) |
| 3 or 4 Unit Apartments | 0 (0.0%) | 11 (100.0%) |
| 5 to 9 Unit Apartments | 0 (0.0%) | 0 (0.0%) |
| 10 or more Apartments | 0 (0.0%) | 0 (0.0%) |
| Mobile Home / Other | 0 (0.0%) | 0 (0.0%) |
| Total | 115 (91.3%) | 11 (8.7%) |
Housing Structures by Number of Rooms in Ackermanville
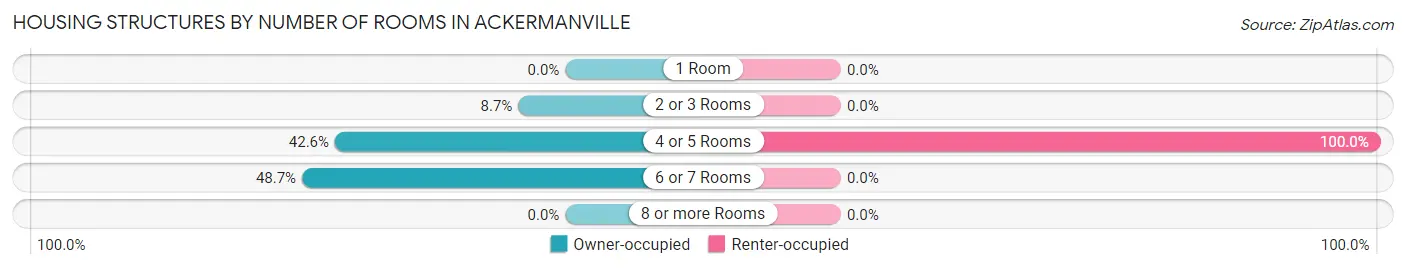
| Number of Rooms | Owner-occupied | Renter-occupied |
| 1 Room | 0 (0.0%) | 0 (0.0%) |
| 2 or 3 Rooms | 10 (8.7%) | 0 (0.0%) |
| 4 or 5 Rooms | 49 (42.6%) | 11 (100.0%) |
| 6 or 7 Rooms | 56 (48.7%) | 0 (0.0%) |
| 8 or more Rooms | 0 (0.0%) | 0 (0.0%) |
| Total | 115 (100.0%) | 11 (100.0%) |
Housing Structure by Heating Type in Ackermanville
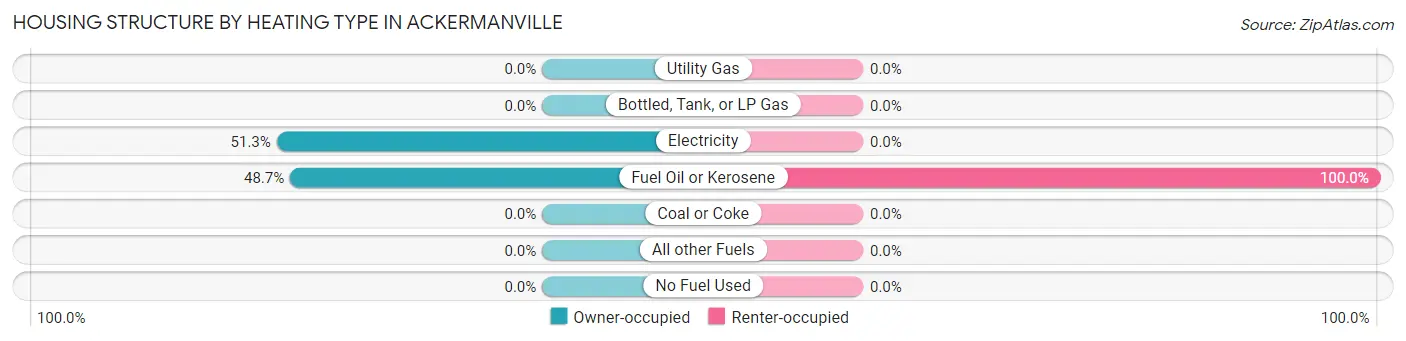
| Heating Type | Owner-occupied | Renter-occupied |
| Utility Gas | 0 (0.0%) | 0 (0.0%) |
| Bottled, Tank, or LP Gas | 0 (0.0%) | 0 (0.0%) |
| Electricity | 59 (51.3%) | 0 (0.0%) |
| Fuel Oil or Kerosene | 56 (48.7%) | 11 (100.0%) |
| Coal or Coke | 0 (0.0%) | 0 (0.0%) |
| All other Fuels | 0 (0.0%) | 0 (0.0%) |
| No Fuel Used | 0 (0.0%) | 0 (0.0%) |
| Total | 115 (100.0%) | 11 (100.0%) |
Household Vehicle Usage in Ackermanville
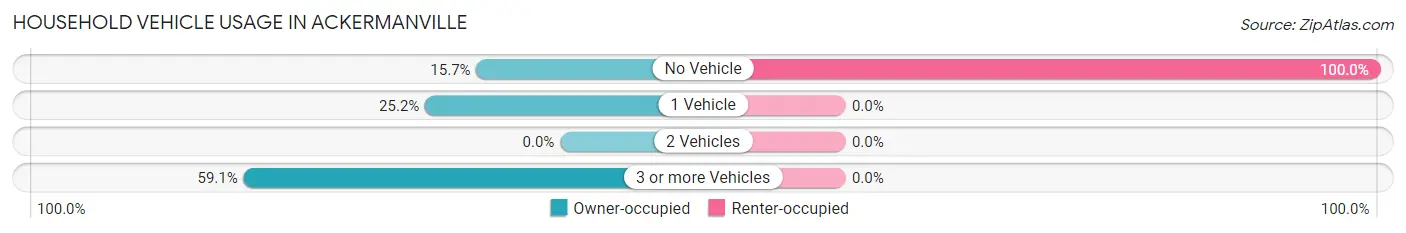
| Vehicles per Household | Owner-occupied | Renter-occupied |
| No Vehicle | 18 (15.7%) | 11 (100.0%) |
| 1 Vehicle | 29 (25.2%) | 0 (0.0%) |
| 2 Vehicles | 0 (0.0%) | 0 (0.0%) |
| 3 or more Vehicles | 68 (59.1%) | 0 (0.0%) |
| Total | 115 (100.0%) | 11 (100.0%) |
Real Estate & Mortgages in Ackermanville
Real Estate and Mortgage Overview in Ackermanville
| Characteristic | Without Mortgage | With Mortgage |
| Housing Units | 36 | 79 |
| Median Property Value | - | - |
| Median Household Income | $19,750 | $0 |
| Monthly Housing Costs | $650 | $0 |
| Real Estate Taxes | - | - |
Property Value by Mortgage Status in Ackermanville
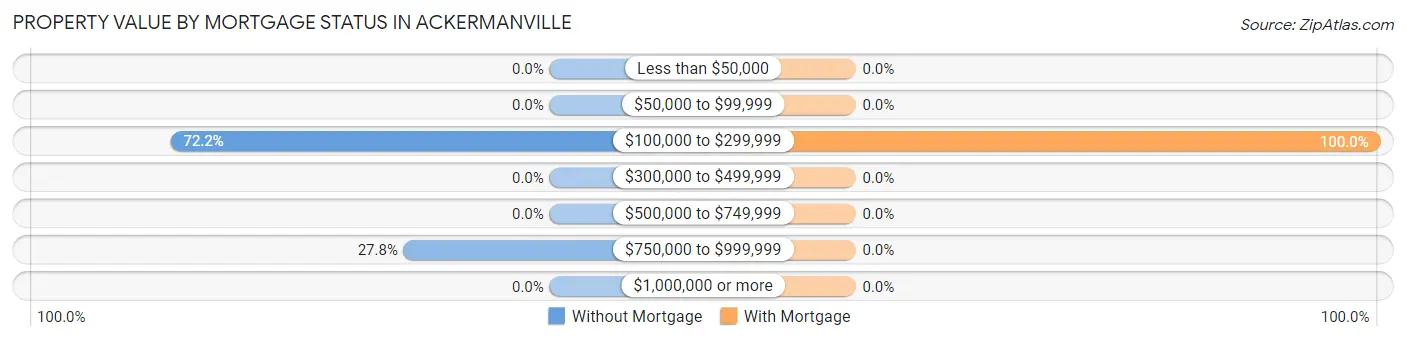
| Property Value | Without Mortgage | With Mortgage |
| Less than $50,000 | 0 (0.0%) | 0 (0.0%) |
| $50,000 to $99,999 | 0 (0.0%) | 0 (0.0%) |
| $100,000 to $299,999 | 26 (72.2%) | 79 (100.0%) |
| $300,000 to $499,999 | 0 (0.0%) | 0 (0.0%) |
| $500,000 to $749,999 | 0 (0.0%) | 0 (0.0%) |
| $750,000 to $999,999 | 10 (27.8%) | 0 (0.0%) |
| $1,000,000 or more | 0 (0.0%) | 0 (0.0%) |
| Total | 36 (100.0%) | 79 (100.0%) |
Household Income by Mortgage Status in Ackermanville
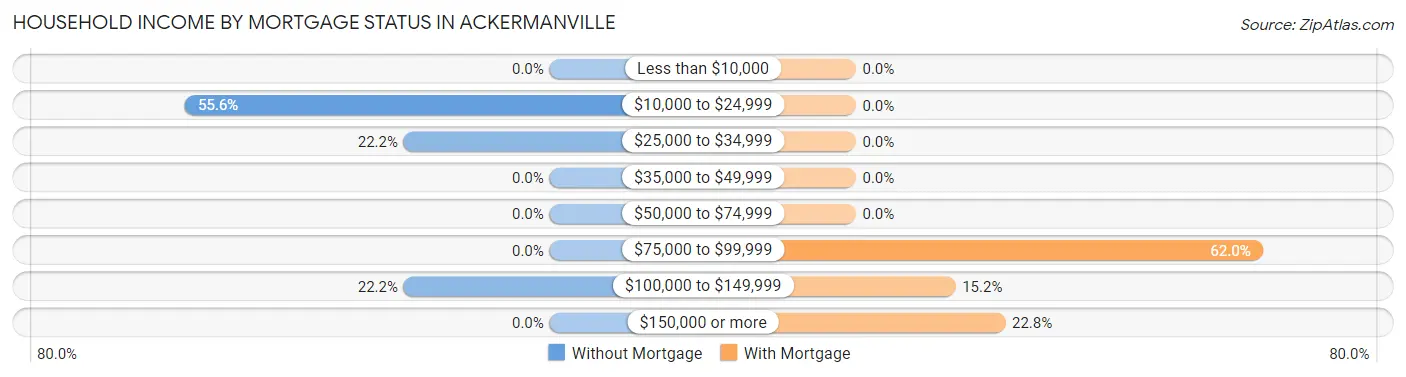
| Household Income | Without Mortgage | With Mortgage |
| Less than $10,000 | 0 (0.0%) | 0 (0.0%) |
| $10,000 to $24,999 | 20 (55.6%) | 0 (0.0%) |
| $25,000 to $34,999 | 8 (22.2%) | 0 (0.0%) |
| $35,000 to $49,999 | 0 (0.0%) | 0 (0.0%) |
| $50,000 to $74,999 | 0 (0.0%) | 0 (0.0%) |
| $75,000 to $99,999 | 0 (0.0%) | 49 (62.0%) |
| $100,000 to $149,999 | 8 (22.2%) | 12 (15.2%) |
| $150,000 or more | 0 (0.0%) | 18 (22.8%) |
| Total | 36 (100.0%) | 79 (100.0%) |
Property Value to Household Income Ratio in Ackermanville
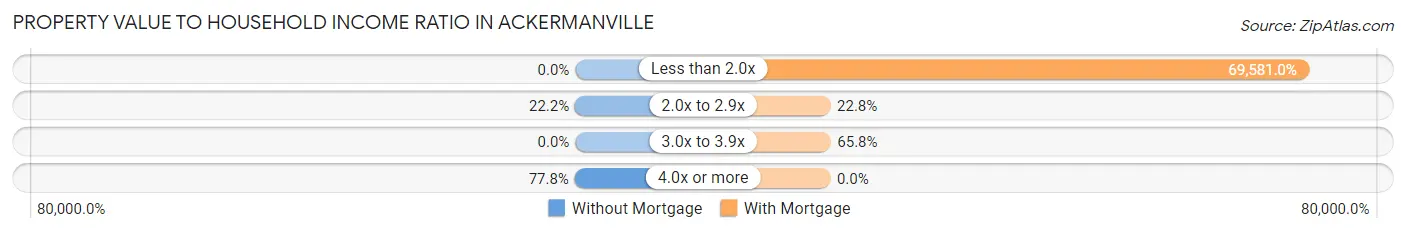
| Value-to-Income Ratio | Without Mortgage | With Mortgage |
| Less than 2.0x | 0 (0.0%) | 54,969 (69,581.0%) |
| 2.0x to 2.9x | 8 (22.2%) | 18 (22.8%) |
| 3.0x to 3.9x | 0 (0.0%) | 52 (65.8%) |
| 4.0x or more | 28 (77.8%) | 0 (0.0%) |
| Total | 36 (100.0%) | 79 (100.0%) |
Real Estate Taxes by Mortgage Status in Ackermanville
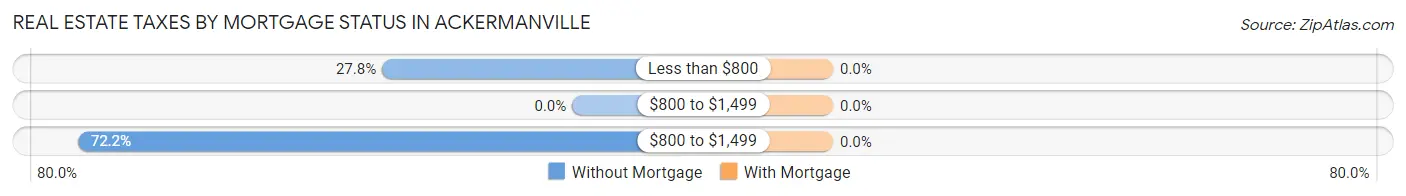
| Property Taxes | Without Mortgage | With Mortgage |
| Less than $800 | 10 (27.8%) | 0 (0.0%) |
| $800 to $1,499 | 0 (0.0%) | 0 (0.0%) |
| $800 to $1,499 | 26 (72.2%) | 0 (0.0%) |
| Total | 36 (100.0%) | 79 (100.0%) |
Health & Disability in Ackermanville
Health Insurance Coverage by Age in Ackermanville
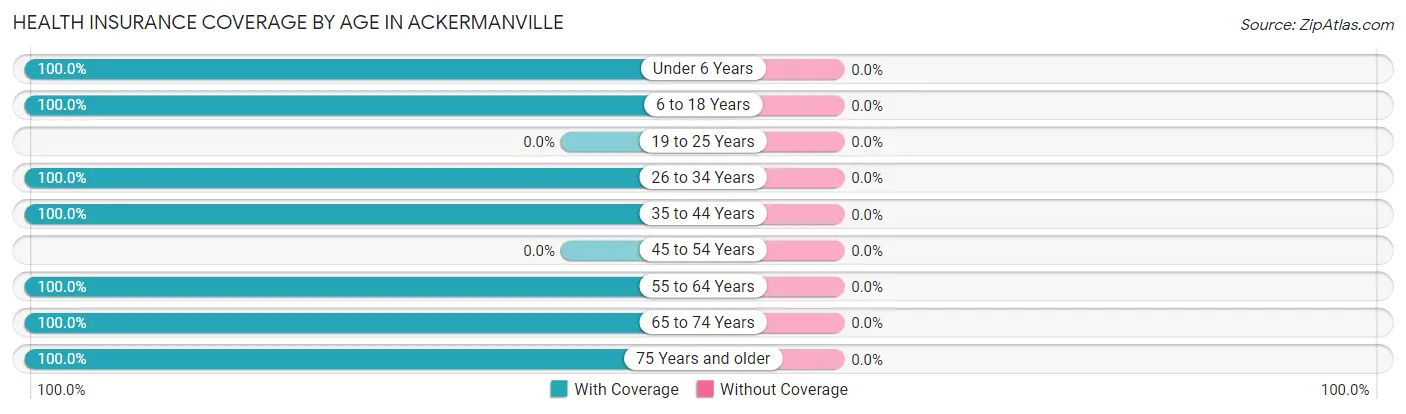
| Age Bracket | With Coverage | Without Coverage |
| Under 6 Years | 40 (100.0%) | 0 (0.0%) |
| 6 to 18 Years | 41 (100.0%) | 0 (0.0%) |
| 19 to 25 Years | 0 (0.0%) | 0 (0.0%) |
| 26 to 34 Years | 117 (100.0%) | 0 (0.0%) |
| 35 to 44 Years | 11 (100.0%) | 0 (0.0%) |
| 45 to 54 Years | 0 (0.0%) | 0 (0.0%) |
| 55 to 64 Years | 8 (100.0%) | 0 (0.0%) |
| 65 to 74 Years | 35 (100.0%) | 0 (0.0%) |
| 75 Years and older | 28 (100.0%) | 0 (0.0%) |
| Total | 280 (100.0%) | 0 (0.0%) |
Health Insurance Coverage by Citizenship Status in Ackermanville
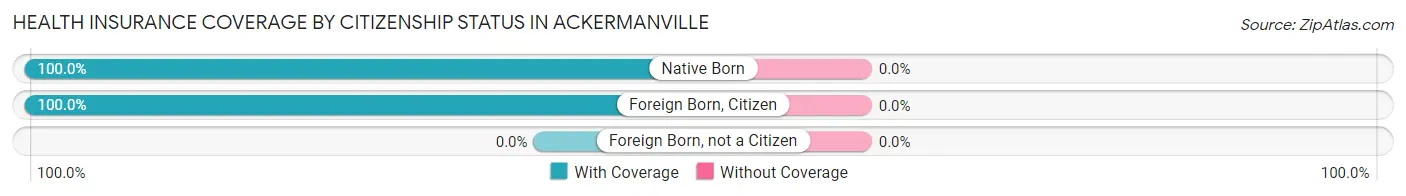
| Citizenship Status | With Coverage | Without Coverage |
| Native Born | 40 (100.0%) | 0 (0.0%) |
| Foreign Born, Citizen | 41 (100.0%) | 0 (0.0%) |
| Foreign Born, not a Citizen | 0 (0.0%) | 0 (0.0%) |
Health Insurance Coverage by Household Income in Ackermanville
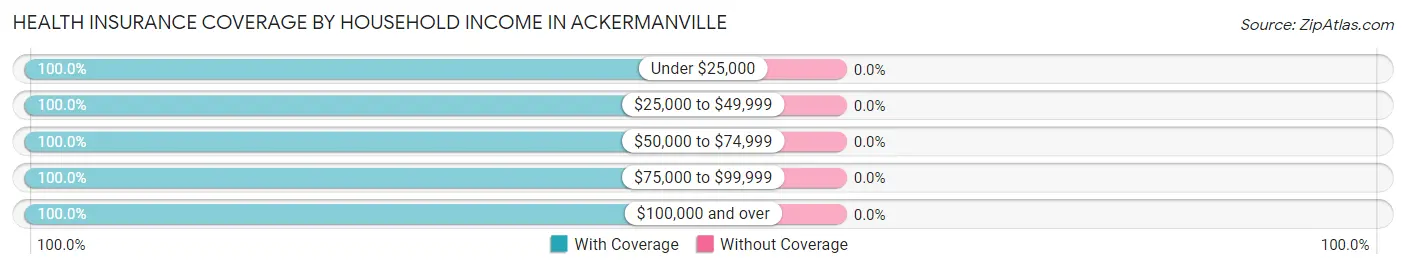
| Household Income | With Coverage | Without Coverage |
| Under $25,000 | 30 (100.0%) | 0 (0.0%) |
| $25,000 to $49,999 | 29 (100.0%) | 0 (0.0%) |
| $50,000 to $74,999 | 160 (100.0%) | 0 (0.0%) |
| $75,000 to $99,999 | 12 (100.0%) | 0 (0.0%) |
| $100,000 and over | 49 (100.0%) | 0 (0.0%) |
Public vs Private Health Insurance Coverage by Age in Ackermanville
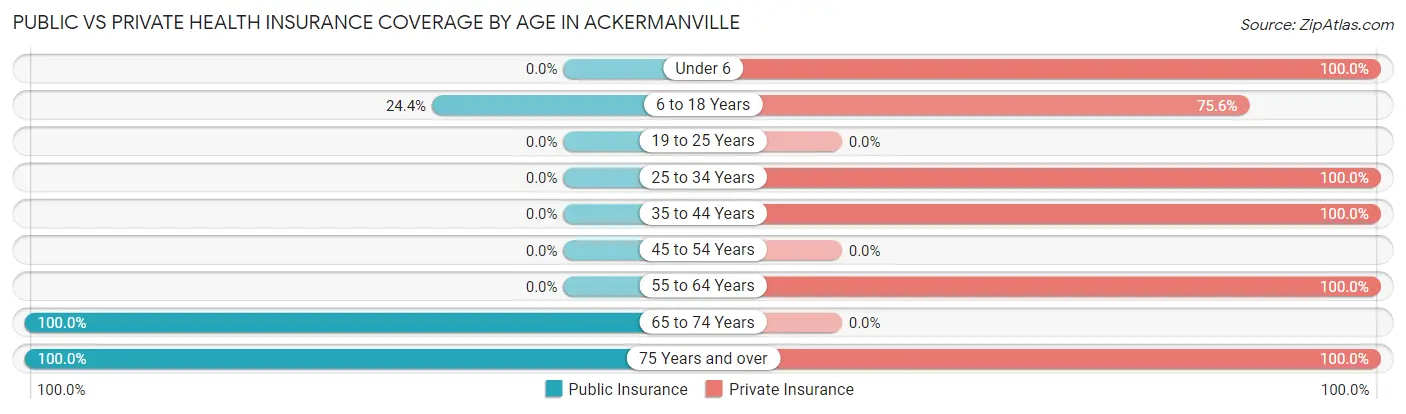
| Age Bracket | Public Insurance | Private Insurance |
| Under 6 | 0 (0.0%) | 40 (100.0%) |
| 6 to 18 Years | 10 (24.4%) | 31 (75.6%) |
| 19 to 25 Years | 0 (0.0%) | 0 (0.0%) |
| 25 to 34 Years | 0 (0.0%) | 117 (100.0%) |
| 35 to 44 Years | 0 (0.0%) | 11 (100.0%) |
| 45 to 54 Years | 0 (0.0%) | 0 (0.0%) |
| 55 to 64 Years | 0 (0.0%) | 8 (100.0%) |
| 65 to 74 Years | 35 (100.0%) | 0 (0.0%) |
| 75 Years and over | 28 (100.0%) | 28 (100.0%) |
| Total | 73 (26.1%) | 235 (83.9%) |
Disability Status by Sex by Age in Ackermanville
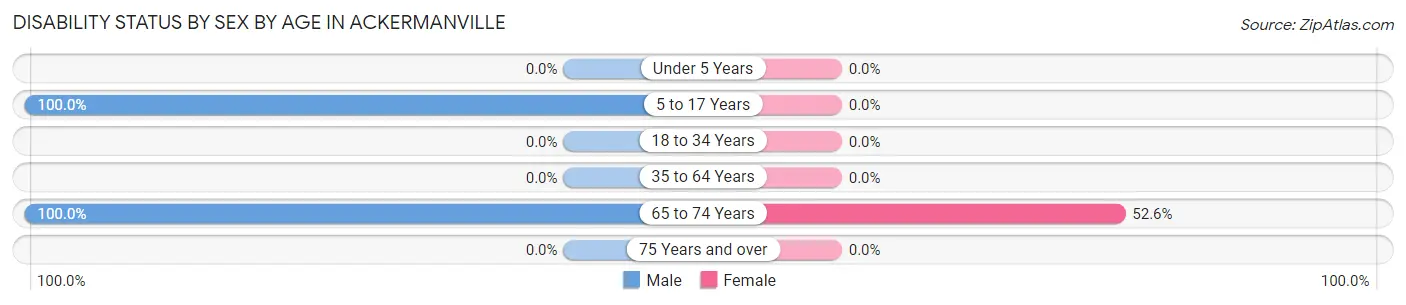
| Age Bracket | Male | Female |
| Under 5 Years | 0 (0.0%) | 0 (0.0%) |
| 5 to 17 Years | 31 (100.0%) | 0 (0.0%) |
| 18 to 34 Years | 0 (0.0%) | 0 (0.0%) |
| 35 to 64 Years | 0 (0.0%) | 0 (0.0%) |
| 65 to 74 Years | 16 (100.0%) | 10 (52.6%) |
| 75 Years and over | 0 (0.0%) | 0 (0.0%) |
Disability Class by Sex by Age in Ackermanville
Disability Class: Hearing Difficulty
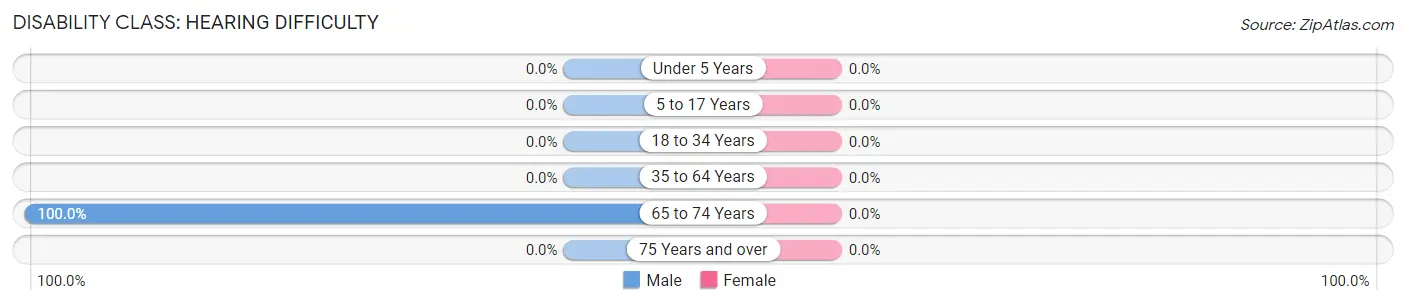
| Age Bracket | Male | Female |
| Under 5 Years | 0 (0.0%) | 0 (0.0%) |
| 5 to 17 Years | 0 (0.0%) | 0 (0.0%) |
| 18 to 34 Years | 0 (0.0%) | 0 (0.0%) |
| 35 to 64 Years | 0 (0.0%) | 0 (0.0%) |
| 65 to 74 Years | 16 (100.0%) | 0 (0.0%) |
| 75 Years and over | 0 (0.0%) | 0 (0.0%) |
Disability Class: Vision Difficulty
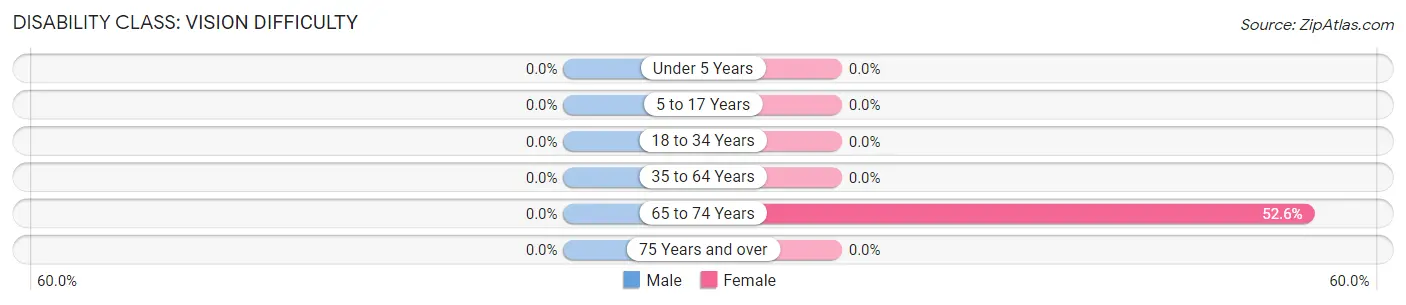
| Age Bracket | Male | Female |
| Under 5 Years | 0 (0.0%) | 0 (0.0%) |
| 5 to 17 Years | 0 (0.0%) | 0 (0.0%) |
| 18 to 34 Years | 0 (0.0%) | 0 (0.0%) |
| 35 to 64 Years | 0 (0.0%) | 0 (0.0%) |
| 65 to 74 Years | 0 (0.0%) | 10 (52.6%) |
| 75 Years and over | 0 (0.0%) | 0 (0.0%) |
Disability Class: Cognitive Difficulty
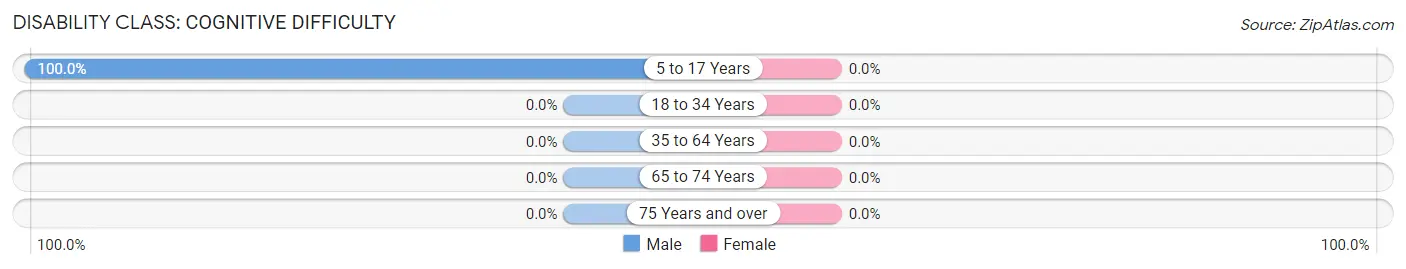
| Age Bracket | Male | Female |
| 5 to 17 Years | 31 (100.0%) | 0 (0.0%) |
| 18 to 34 Years | 0 (0.0%) | 0 (0.0%) |
| 35 to 64 Years | 0 (0.0%) | 0 (0.0%) |
| 65 to 74 Years | 0 (0.0%) | 0 (0.0%) |
| 75 Years and over | 0 (0.0%) | 0 (0.0%) |
Disability Class: Ambulatory Difficulty
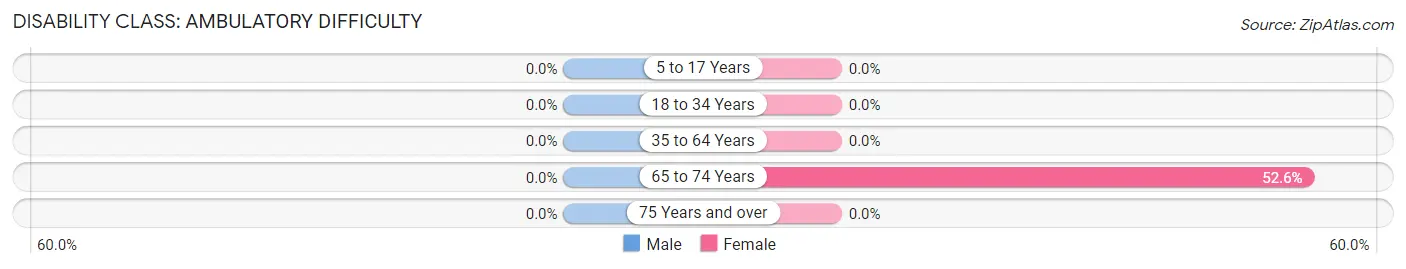
| Age Bracket | Male | Female |
| 5 to 17 Years | 0 (0.0%) | 0 (0.0%) |
| 18 to 34 Years | 0 (0.0%) | 0 (0.0%) |
| 35 to 64 Years | 0 (0.0%) | 0 (0.0%) |
| 65 to 74 Years | 0 (0.0%) | 10 (52.6%) |
| 75 Years and over | 0 (0.0%) | 0 (0.0%) |
Disability Class: Self-Care Difficulty
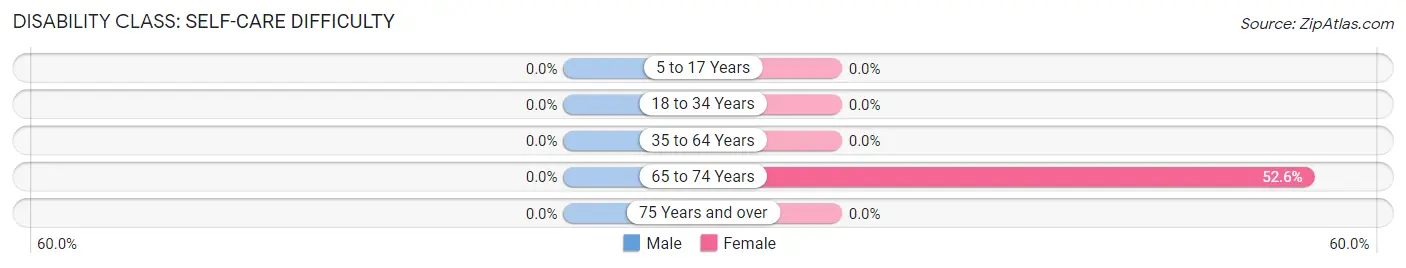
| Age Bracket | Male | Female |
| 5 to 17 Years | 0 (0.0%) | 0 (0.0%) |
| 18 to 34 Years | 0 (0.0%) | 0 (0.0%) |
| 35 to 64 Years | 0 (0.0%) | 0 (0.0%) |
| 65 to 74 Years | 0 (0.0%) | 10 (52.6%) |
| 75 Years and over | 0 (0.0%) | 0 (0.0%) |
Technology Access in Ackermanville
Computing Device Access in Ackermanville
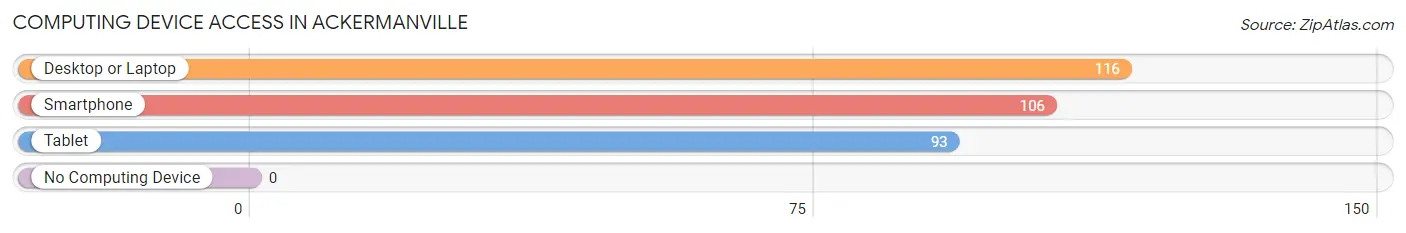
| Device Type | # Households | % Households |
| Desktop or Laptop | 116 | 92.1% |
| Smartphone | 106 | 84.1% |
| Tablet | 93 | 73.8% |
| No Computing Device | 0 | 0.0% |
| Total | 126 | 100.0% |
Internet Access in Ackermanville
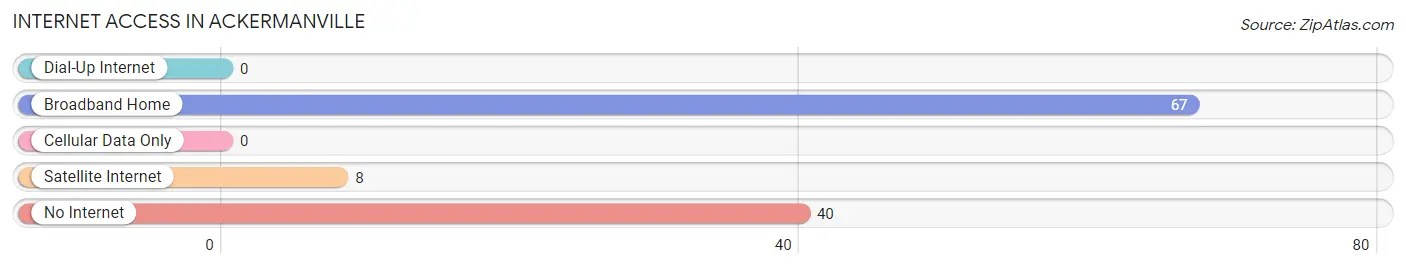
| Internet Type | # Households | % Households |
| Dial-Up Internet | 0 | 0.0% |
| Broadband Home | 67 | 53.2% |
| Cellular Data Only | 0 | 0.0% |
| Satellite Internet | 8 | 6.4% |
| No Internet | 40 | 31.8% |
| Total | 126 | 100.0% |
Ackermanville Summary
Ackermanville is a small unincorporated community located in the northern part of Bucks County, Pennsylvania. It is situated in the heart of the Lehigh Valley, a region of the state known for its rich history and culture. The community is located just off of Route 611, and is bordered by the towns of Richlandtown, Quakertown, and Perkasie.
History
Ackermanville was founded in 1790 by John Ackerman, a German immigrant who had come to the area in search of a better life. He purchased a large tract of land and began to build a small village. The village was named after him, and it quickly grew into a thriving community. By the mid-1800s, Ackermanville had become a bustling center of commerce and industry, with a variety of businesses and services.
The village was also home to a number of churches, including the Ackermanville United Methodist Church, which was founded in 1845. The church is still active today, and is a popular destination for visitors to the area.
Geography
Ackermanville is located in the northern part of Bucks County, Pennsylvania. It is situated in the heart of the Lehigh Valley, a region of the state known for its rich history and culture. The community is located just off of Route 611, and is bordered by the towns of Richlandtown, Quakertown, and Perkasie.
The village is situated on a small hill, and is surrounded by rolling hills and farmland. The area is known for its picturesque views and rural charm. The nearby towns of Quakertown and Perkasie offer a variety of shopping and dining options, as well as a variety of recreational activities.
Economy
Ackermanville is a small, rural community, and its economy is largely based on agriculture. The area is home to a number of farms, which produce a variety of crops, including corn, soybeans, and hay. The village also has a number of small businesses, including a general store, a hardware store, and a few restaurants.
The village is also home to a number of small manufacturing companies, which produce a variety of products, including furniture, clothing, and electronics. The village is also home to a number of small businesses, including a bakery, a florist, and a few antique stores.
Demographics
As of the 2010 census, Ackermanville had a population of 1,845. The population is largely white (94.3%), with a small percentage of African Americans (2.2%) and Hispanics (2.5%). The median household income is $50,945, and the median age is 43.
The village is home to a number of churches, including the Ackermanville United Methodist Church, which was founded in 1845. The village is also home to a number of small businesses, including a general store, a hardware store, and a few restaurants.
Conclusion
Ackermanville is a small, rural community located in the northern part of Bucks County, Pennsylvania. It is situated in the heart of the Lehigh Valley, a region of the state known for its rich history and culture. The village is home to a number of churches, small businesses, and farms, and is a popular destination for visitors to the area. The population is largely white, with a small percentage of African Americans and Hispanics. The median household income is $50,945, and the median age is 43. Ackermanville is a charming community with a rich history and a bright future.
Common Questions
What is the Total Population of Ackermanville?
Total Population of Ackermanville is 280.
What is the Total Male Population of Ackermanville?
Total Male Population of Ackermanville is 146.
What is the Total Female Population of Ackermanville?
Total Female Population of Ackermanville is 134.
What is the Ratio of Males per 100 Females in Ackermanville?
There are 108.96 Males per 100 Females in Ackermanville.
What is the Ratio of Females per 100 Males in Ackermanville?
There are 91.78 Females per 100 Males in Ackermanville.
What is the Median Population Age in Ackermanville?
Median Population Age in Ackermanville is 33.0 Years.
What is the Average Family Size in Ackermanville
Average Family Size in Ackermanville is 2.7 People.
What is the Average Household Size in Ackermanville
Average Household Size in Ackermanville is 2.2 People.
What is Per Capita Income in Ackermanville?
Per Capita income in Ackermanville is $27,213.
What is the Median Family Income in Ackermanville?
Median Family Income in Ackermanville is $54,281.
What is the Median Household income in Ackermanville?
Median Household Income in Ackermanville is $54,000.
What is Inequality or Gini Index in Ackermanville?
Inequality or Gini Index in Ackermanville is 0.30.
How Large is the Labor Force in Ackermanville?
There are 136 People in the Labor Forcein in Ackermanville.
What is the Percentage of People in the Labor Force in Ackermanville?
68.3% of People are in the Labor Force in Ackermanville.