Atkinson Mills, PA
Atkinson Mills Map
Atkinson Mills Overview
126
TOTAL POPULATION
77
MALE POPULATION
49
FEMALE POPULATION
157.14
MALES / 100 FEMALES
63.64
FEMALES / 100 MALES
55.5
MEDIAN AGE
2.9
AVG FAMILY SIZE
2.5
AVG HOUSEHOLD SIZE
$27,676
PER CAPITA INCOME
$86,750
AVG FAMILY INCOME
$71,250
AVG HOUSEHOLD INCOME
0.29
INEQUALITY / GINI INDEX
80
LABOR FORCE [ PEOPLE ]
81.6%
PERCENT IN LABOR FORCE
5.3%
UNEMPLOYMENT RATE
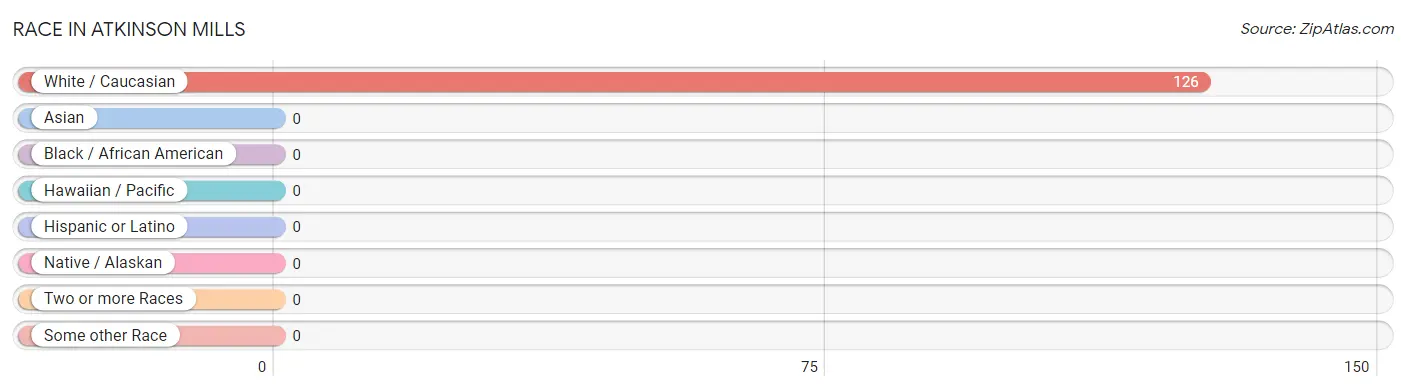
Race in Atkinson Mills
The most populous races in Atkinson Mills are , and White / Caucasian (126 | 100.0%).
| Race | # Population | % Population |
| Asian | 0 | 0.0% |
| Black / African American | 0 | 0.0% |
| Hawaiian / Pacific | 0 | 0.0% |
| Hispanic or Latino | 0 | 0.0% |
| Native / Alaskan | 0 | 0.0% |
| White / Caucasian | 126 | 100.0% |
| Two or more Races | 0 | 0.0% |
| Some other Race | 0 | 0.0% |
| Total | 126 | 100.0% |
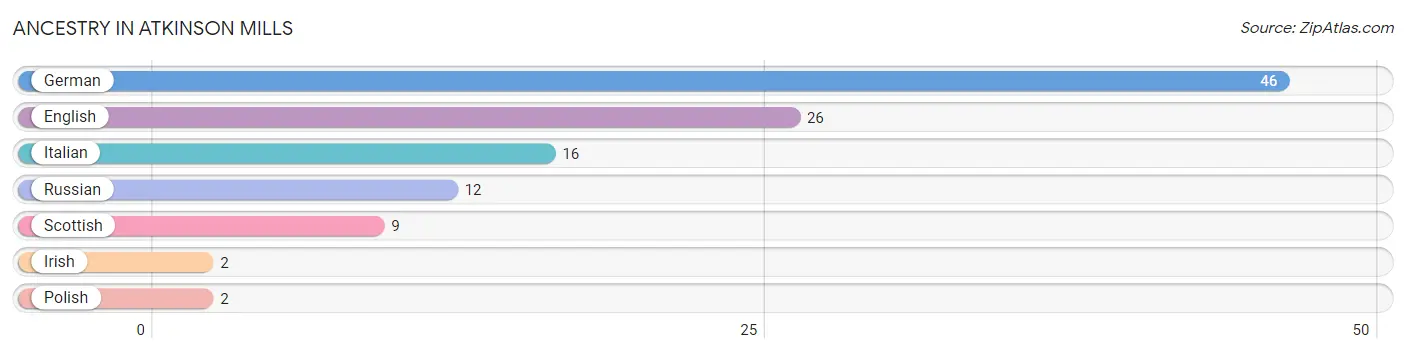
Ancestry in Atkinson Mills
The most populous ancestries reported in Atkinson Mills are German (46 | 36.5%), English (26 | 20.6%), Italian (16 | 12.7%), Russian (12 | 9.5%), and Scottish (9 | 7.1%), together accounting for 86.5% of all Atkinson Mills residents.
| Ancestry | # Population | % Population |
| English | 26 | 20.6% |
| German | 46 | 36.5% |
| Irish | 2 | 1.6% |
| Italian | 16 | 12.7% |
| Polish | 2 | 1.6% |
| Russian | 12 | 9.5% |
| Scottish | 9 | 7.1% | View All 7 Rows |
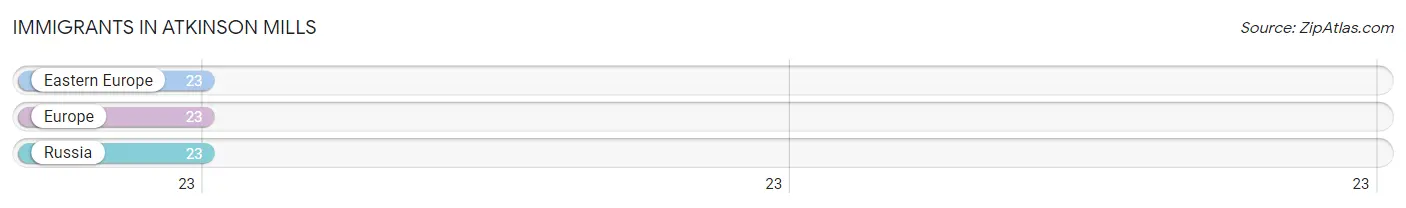
Immigrants in Atkinson Mills
The most numerous immigrant groups reported in Atkinson Mills came from Eastern Europe (23 | 18.2%), Europe (23 | 18.2%), and Russia (23 | 18.2%), together accounting for 54.7% of all Atkinson Mills residents.
| Immigration Origin | # Population | % Population |
| Eastern Europe | 23 | 18.2% |
| Europe | 23 | 18.2% |
| Russia | 23 | 18.2% | View All 3 Rows |
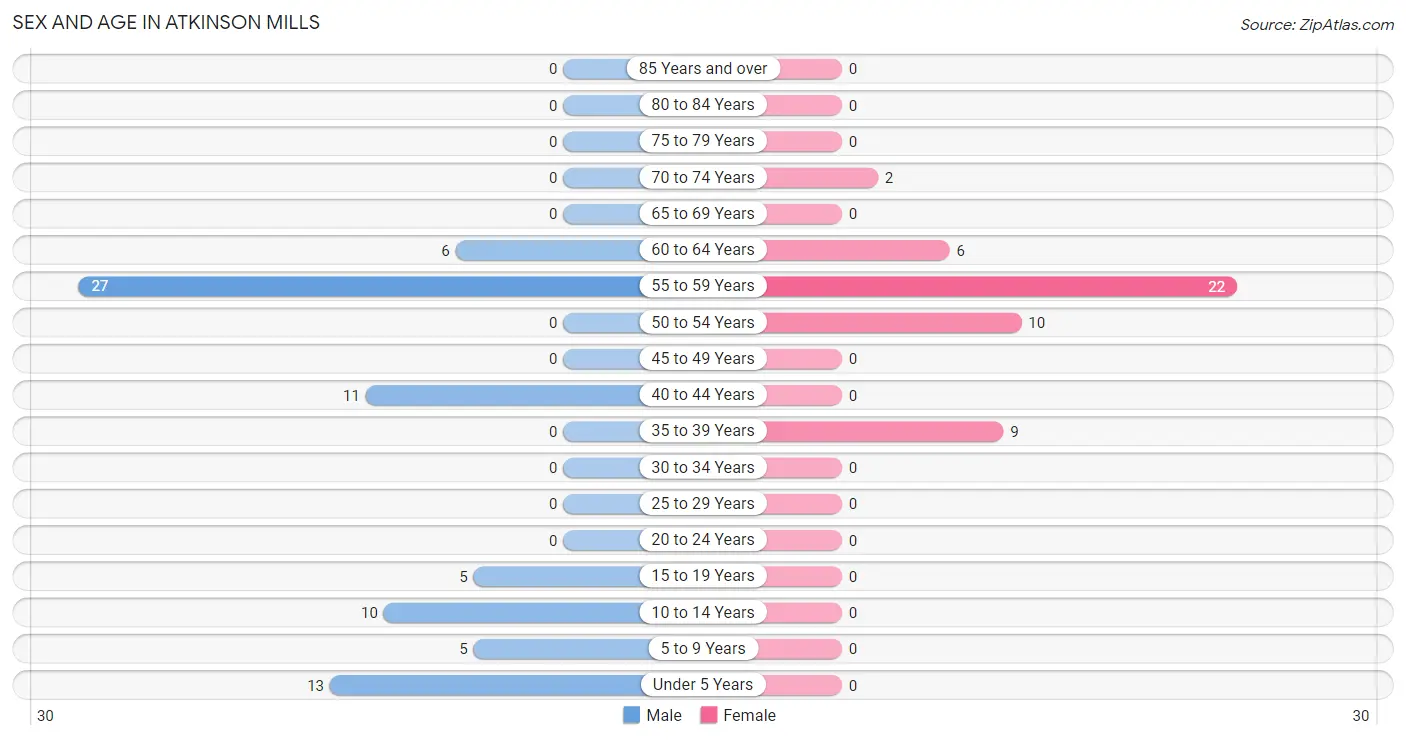
Sex and Age in Atkinson Mills
Sex and Age in Atkinson Mills
The most populous age groups in Atkinson Mills are 55 to 59 Years (27 | 35.1%) for men and 55 to 59 Years (22 | 44.9%) for women.
| Age Bracket | Male | Female |
| Under 5 Years | 13 (16.9%) | 0 (0.0%) |
| 5 to 9 Years | 5 (6.5%) | 0 (0.0%) |
| 10 to 14 Years | 10 (13.0%) | 0 (0.0%) |
| 15 to 19 Years | 5 (6.5%) | 0 (0.0%) |
| 20 to 24 Years | 0 (0.0%) | 0 (0.0%) |
| 25 to 29 Years | 0 (0.0%) | 0 (0.0%) |
| 30 to 34 Years | 0 (0.0%) | 0 (0.0%) |
| 35 to 39 Years | 0 (0.0%) | 9 (18.4%) |
| 40 to 44 Years | 11 (14.3%) | 0 (0.0%) |
| 45 to 49 Years | 0 (0.0%) | 0 (0.0%) |
| 50 to 54 Years | 0 (0.0%) | 10 (20.4%) |
| 55 to 59 Years | 27 (35.1%) | 22 (44.9%) |
| 60 to 64 Years | 6 (7.8%) | 6 (12.2%) |
| 65 to 69 Years | 0 (0.0%) | 0 (0.0%) |
| 70 to 74 Years | 0 (0.0%) | 2 (4.1%) |
| 75 to 79 Years | 0 (0.0%) | 0 (0.0%) |
| 80 to 84 Years | 0 (0.0%) | 0 (0.0%) |
| 85 Years and over | 0 (0.0%) | 0 (0.0%) |
| Total | 77 (100.0%) | 49 (100.0%) |
Families and Households in Atkinson Mills
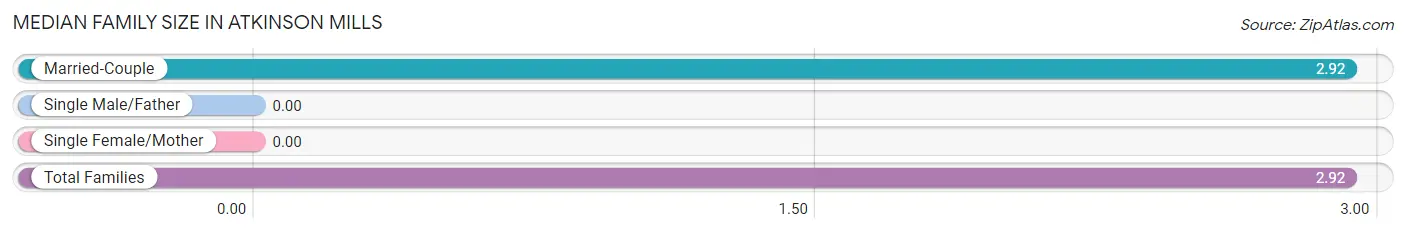
Median Family Size in Atkinson Mills
| Family Type | # Families | Family Size |
| Married-Couple | 39 (100.0%) | 2.92 |
| Single Male/Father | 0 (0.0%) | - |
| Single Female/Mother | 0 (0.0%) | - |
| Total Families | 39 (100.0%) | 2.92 |
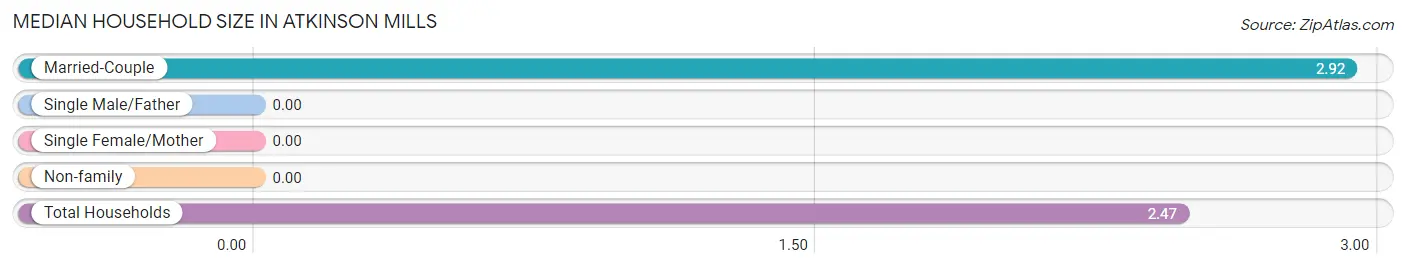
Median Household Size in Atkinson Mills
| Household Type | # Households | Household Size |
| Married-Couple | 39 (76.5%) | 2.92 |
| Single Male/Father | 0 (0.0%) | - |
| Single Female/Mother | 0 (0.0%) | - |
| Non-family | 12 (23.5%) | - |
| Total Households | 51 (100.0%) | 2.47 |
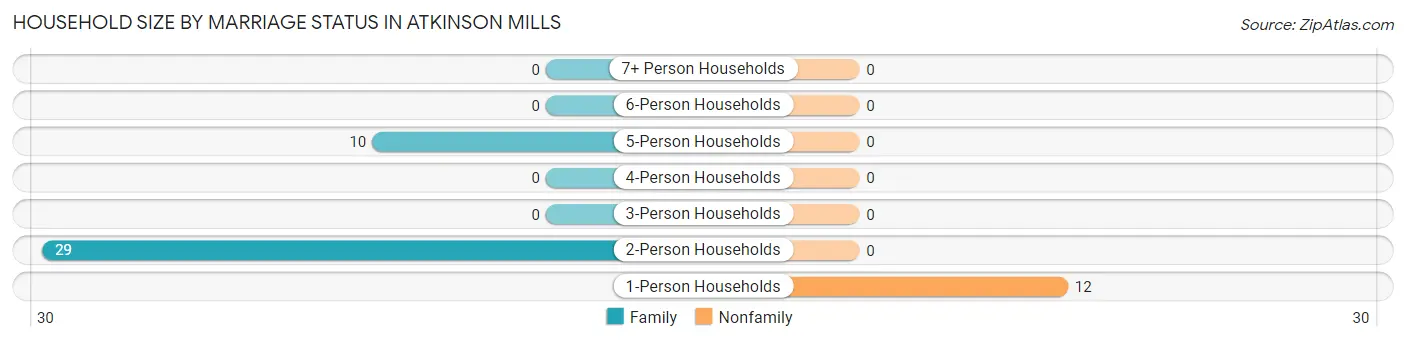
Household Size by Marriage Status in Atkinson Mills
Out of a total of 51 households in Atkinson Mills, 39 (76.5%) are family households, while 12 (23.5%) are nonfamily households. The most numerous type of family households are 2-person households, comprising 29, and the most common type of nonfamily households are 1-person households, comprising 12.
| Household Size | Family Households | Nonfamily Households |
| 1-Person Households | - | 12 (23.5%) |
| 2-Person Households | 29 (56.9%) | 0 (0.0%) |
| 3-Person Households | 0 (0.0%) | 0 (0.0%) |
| 4-Person Households | 0 (0.0%) | 0 (0.0%) |
| 5-Person Households | 10 (19.6%) | 0 (0.0%) |
| 6-Person Households | 0 (0.0%) | 0 (0.0%) |
| 7+ Person Households | 0 (0.0%) | 0 (0.0%) |
| Total | 39 (76.5%) | 12 (23.5%) |
Female Fertility in Atkinson Mills
Fertility by Age in Atkinson Mills
Average fertility rate in Atkinson Mills is 444.0 births per 1,000 women. Women in the age bracket of 35 to 50 years have the highest fertility rate with 444.0 births per 1,000 women. Women in the age bracket of 35 to 50 years acount for 100.0% of all women with births.
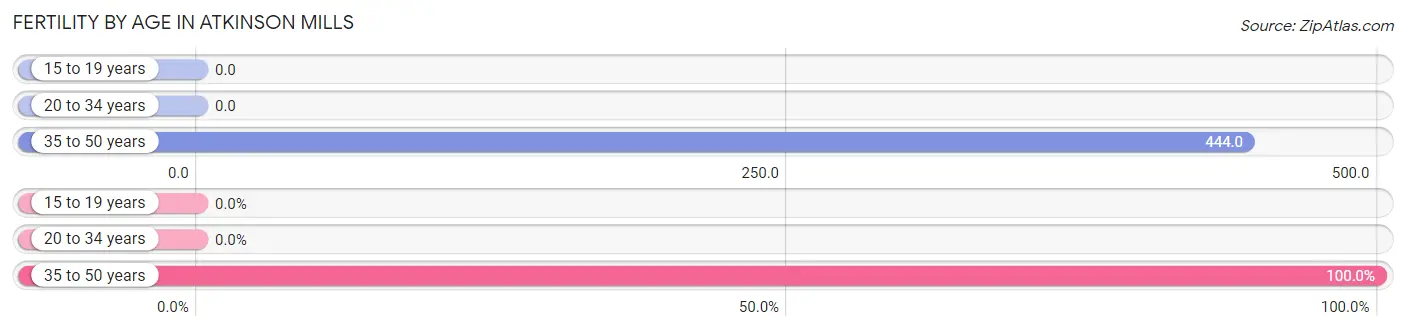
| Age Bracket | Women with Births | Births / 1,000 Women |
| 15 to 19 years | 0 (0.0%) | 0.0 |
| 20 to 34 years | 0 (0.0%) | 0.0 |
| 35 to 50 years | 4 (100.0%) | 444.0 |
| Total | 4 (100.0%) | 444.0 |
Fertility by Age by Marriage Status in Atkinson Mills
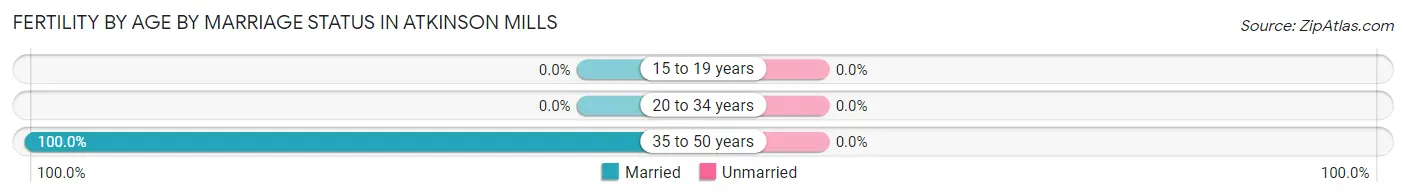
| Age Bracket | Married | Unmarried |
| 15 to 19 years | 0 (0.0%) | 0 (0.0%) |
| 20 to 34 years | 0 (0.0%) | 0 (0.0%) |
| 35 to 50 years | 4 (100.0%) | 0 (0.0%) |
| Total | 4 (100.0%) | 0 (0.0%) |
Fertility by Education in Atkinson Mills
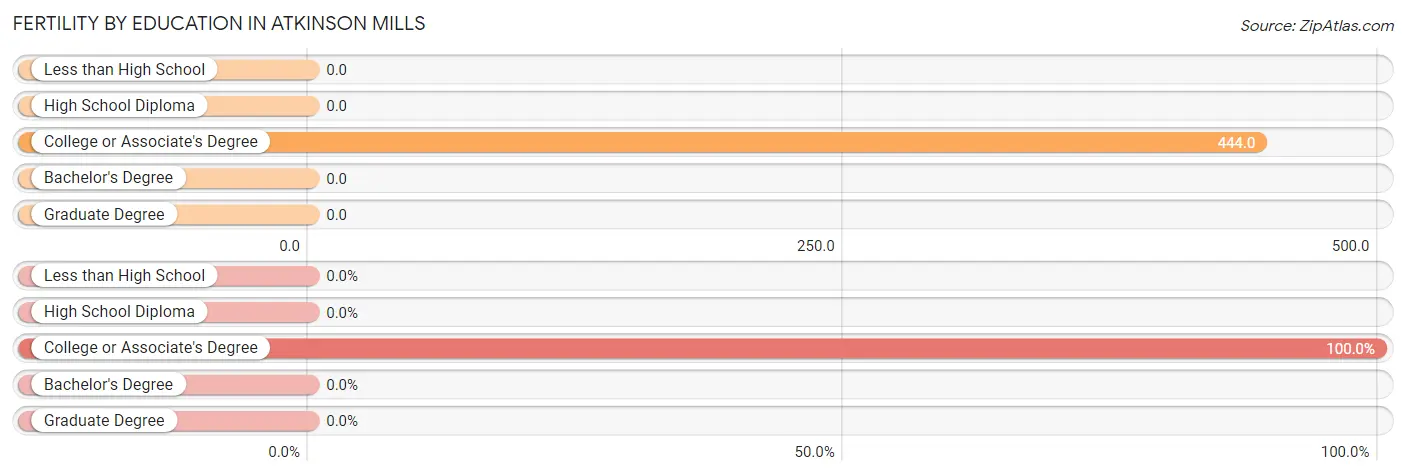
| Educational Attainment | Women with Births | Births / 1,000 Women |
| Less than High School | 0 (0.0%) | 0.0 |
| High School Diploma | 0 (0.0%) | 0.0 |
| College or Associate's Degree | 4 (100.0%) | 444.0 |
| Bachelor's Degree | 0 (0.0%) | 0.0 |
| Graduate Degree | 0 (0.0%) | 0.0 |
| Total | 4 (100.0%) | 444.0 |
Fertility by Education by Marriage Status in Atkinson Mills
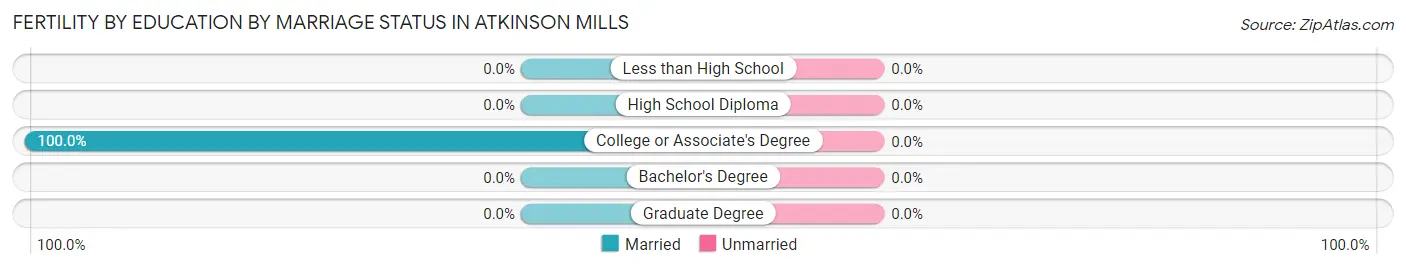
| Educational Attainment | Married | Unmarried |
| Less than High School | 0 (0.0%) | 0 (0.0%) |
| High School Diploma | 0 (0.0%) | 0 (0.0%) |
| College or Associate's Degree | 4 (100.0%) | 0 (0.0%) |
| Bachelor's Degree | 0 (0.0%) | 0 (0.0%) |
| Graduate Degree | 0 (0.0%) | 0 (0.0%) |
| Total | 4 (100.0%) | 0 (0.0%) |
Income in Atkinson Mills
Income Overview in Atkinson Mills
Per Capita Income in Atkinson Mills is $27,676, while median incomes of families and households are $86,750 and $71,250 respectively.
| Characteristic | Number | Measure |
| Per Capita Income | 126 | $27,676 |
| Median Family Income | 39 | $86,750 |
| Mean Family Income | 39 | $81,110 |
| Median Household Income | 51 | $71,250 |
| Mean Household Income | 51 | $64,249 |
| Income Deficit | 39 | $0 |
| Wage / Income Gap (%) | 126 | 0.00% |
| Wage / Income Gap ($) | 126 | 100.00¢ per $1 |
| Gini / Inequality Index | 126 | 0.29 |
Earnings by Sex in Atkinson Mills
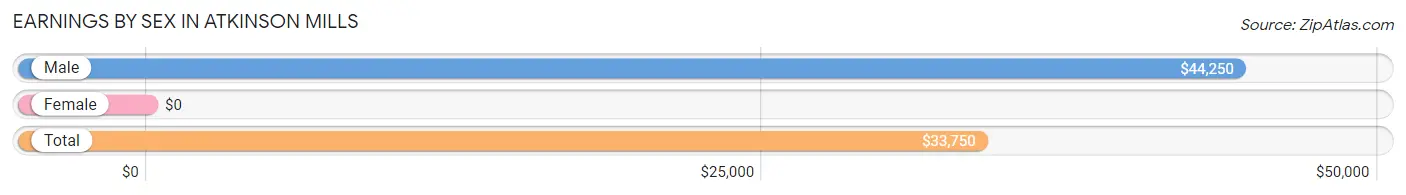
| Sex | Number | Average Earnings |
| Male | 43 (53.7%) | $44,250 |
| Female | 37 (46.3%) | $0 |
| Total | 80 (100.0%) | $33,750 |
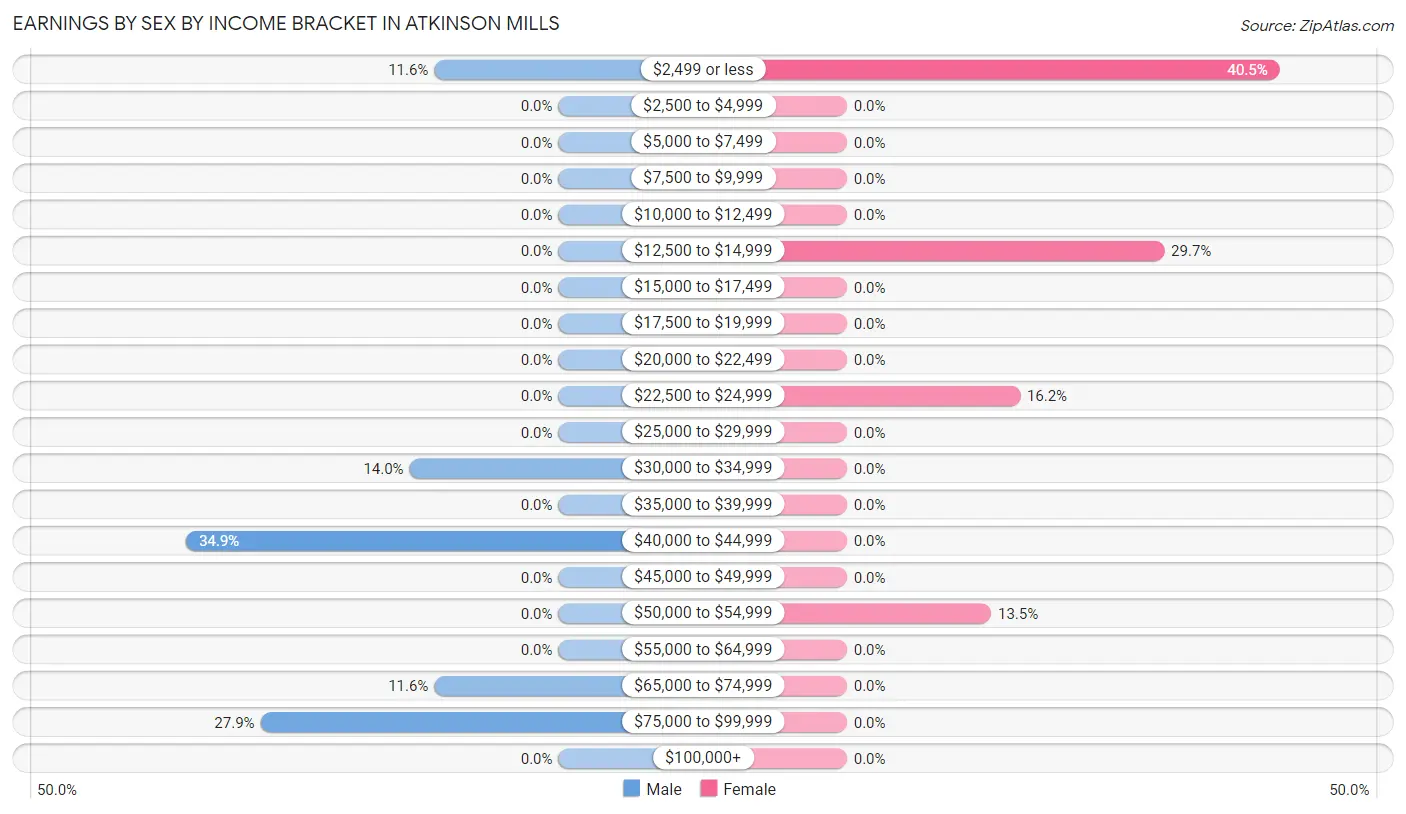
Earnings by Sex by Income Bracket in Atkinson Mills
The most common earnings brackets in Atkinson Mills are $40,000 to $44,999 for men (15 | 34.9%) and $2,499 or less for women (15 | 40.5%).
| Income | Male | Female |
| $2,499 or less | 5 (11.6%) | 15 (40.5%) |
| $2,500 to $4,999 | 0 (0.0%) | 0 (0.0%) |
| $5,000 to $7,499 | 0 (0.0%) | 0 (0.0%) |
| $7,500 to $9,999 | 0 (0.0%) | 0 (0.0%) |
| $10,000 to $12,499 | 0 (0.0%) | 0 (0.0%) |
| $12,500 to $14,999 | 0 (0.0%) | 11 (29.7%) |
| $15,000 to $17,499 | 0 (0.0%) | 0 (0.0%) |
| $17,500 to $19,999 | 0 (0.0%) | 0 (0.0%) |
| $20,000 to $22,499 | 0 (0.0%) | 0 (0.0%) |
| $22,500 to $24,999 | 0 (0.0%) | 6 (16.2%) |
| $25,000 to $29,999 | 0 (0.0%) | 0 (0.0%) |
| $30,000 to $34,999 | 6 (14.0%) | 0 (0.0%) |
| $35,000 to $39,999 | 0 (0.0%) | 0 (0.0%) |
| $40,000 to $44,999 | 15 (34.9%) | 0 (0.0%) |
| $45,000 to $49,999 | 0 (0.0%) | 0 (0.0%) |
| $50,000 to $54,999 | 0 (0.0%) | 5 (13.5%) |
| $55,000 to $64,999 | 0 (0.0%) | 0 (0.0%) |
| $65,000 to $74,999 | 5 (11.6%) | 0 (0.0%) |
| $75,000 to $99,999 | 12 (27.9%) | 0 (0.0%) |
| $100,000+ | 0 (0.0%) | 0 (0.0%) |
| Total | 43 (100.0%) | 37 (100.0%) |
Earnings by Sex by Educational Attainment in Atkinson Mills
| Educational Attainment | Male Income | Female Income |
| Less than High School | - | - |
| High School Diploma | - | - |
| College or Associate's Degree | - | - |
| Bachelor's Degree | - | - |
| Graduate Degree | - | - |
| Total | - | - |
Family Income in Atkinson Mills
Family Income Brackets in Atkinson Mills
According to the Atkinson Mills family income data, there are 16 families falling into the $50,000 to $74,999 income range, which is the most common income bracket and makes up 41.0% of all families.
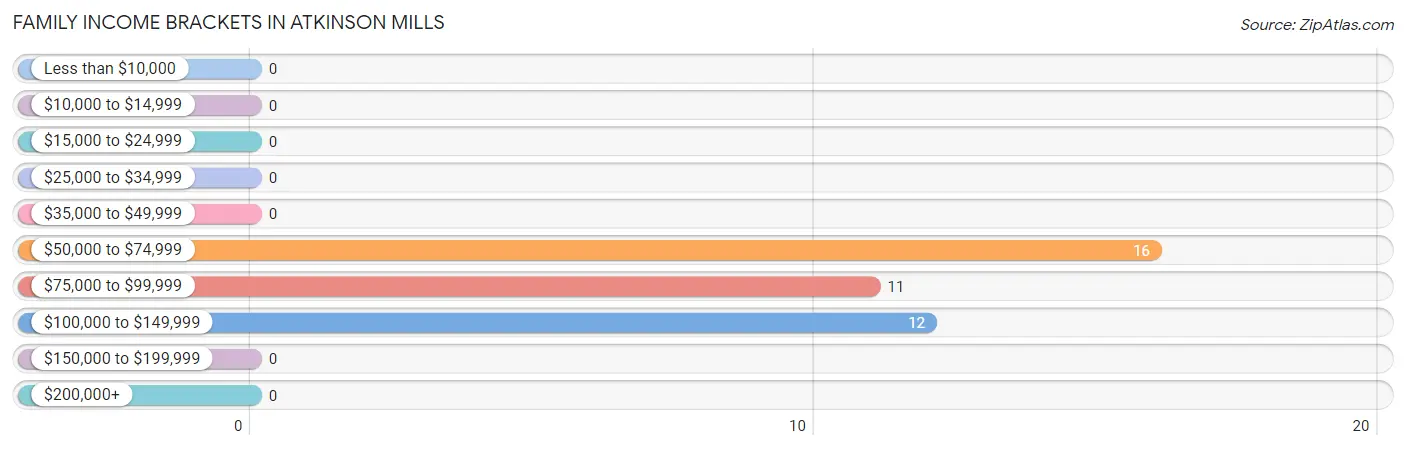
| Income Bracket | # Families | % Families |
| Less than $10,000 | 0 | 0.0% |
| $10,000 to $14,999 | 0 | 0.0% |
| $15,000 to $24,999 | 0 | 0.0% |
| $25,000 to $34,999 | 0 | 0.0% |
| $35,000 to $49,999 | 0 | 0.0% |
| $50,000 to $74,999 | 16 | 41.0% |
| $75,000 to $99,999 | 11 | 28.2% |
| $100,000 to $149,999 | 12 | 30.8% |
| $150,000 to $199,999 | 0 | 0.0% |
| $200,000+ | 0 | 0.0% |
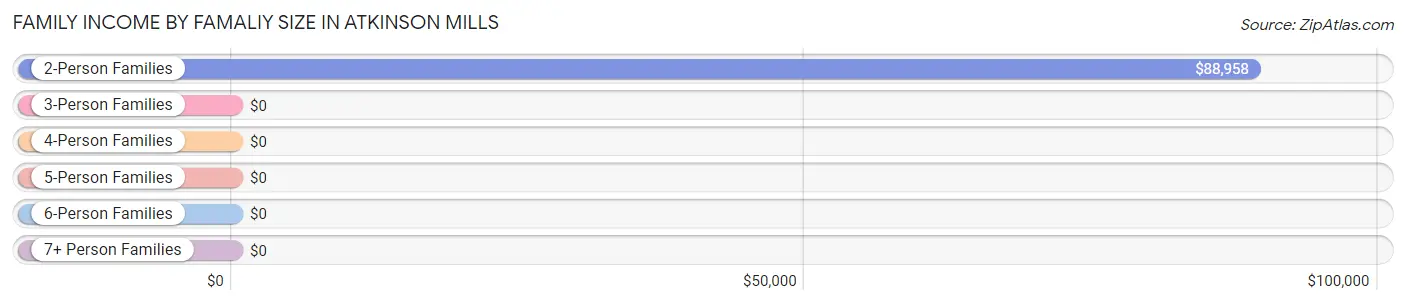
Family Income by Famaliy Size in Atkinson Mills
2-person families (29 | 74.4%) account for the highest median family income in Atkinson Mills with $88,958 per family, while 2-person families (29 | 74.4%) have the highest median income of $44,479 per family member.
| Income Bracket | # Families | Median Income |
| 2-Person Families | 29 (74.4%) | $88,958 |
| 3-Person Families | 0 (0.0%) | $0 |
| 4-Person Families | 0 (0.0%) | $0 |
| 5-Person Families | 10 (25.6%) | $0 |
| 6-Person Families | 0 (0.0%) | $0 |
| 7+ Person Families | 0 (0.0%) | $0 |
| Total | 39 (100.0%) | $86,750 |
Family Income by Number of Earners in Atkinson Mills
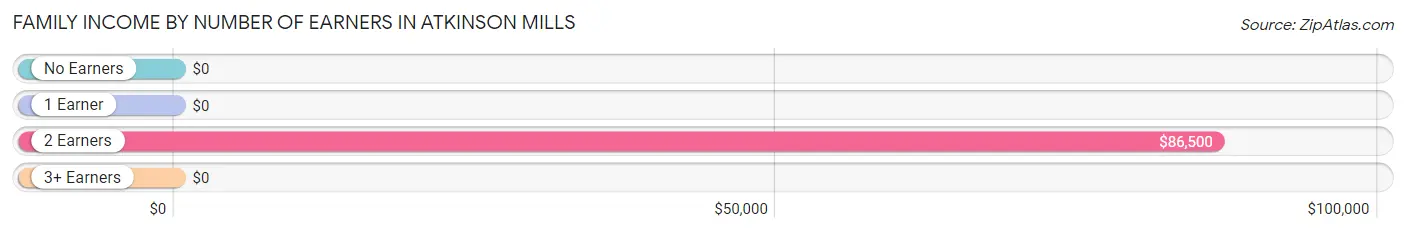
| Number of Earners | # Families | Median Income |
| No Earners | 0 (0.0%) | $0 |
| 1 Earner | 6 (15.4%) | $0 |
| 2 Earners | 28 (71.8%) | $86,500 |
| 3+ Earners | 5 (12.8%) | $0 |
| Total | 39 (100.0%) | $86,750 |
Household Income in Atkinson Mills
Household Income Brackets in Atkinson Mills
With 16 households falling in the category, the $50,000 to $74,999 income range is the most frequent in Atkinson Mills, accounting for 31.4% of all households.
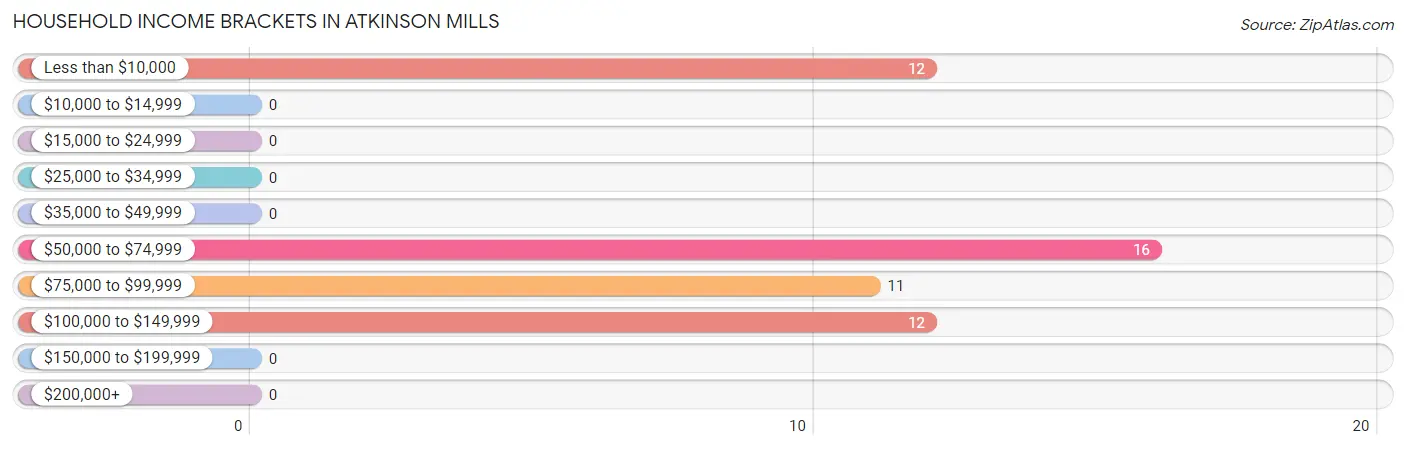
| Income Bracket | # Households | % Households |
| Less than $10,000 | 12 | 23.5% |
| $10,000 to $14,999 | 0 | 0.0% |
| $15,000 to $24,999 | 0 | 0.0% |
| $25,000 to $34,999 | 0 | 0.0% |
| $35,000 to $49,999 | 0 | 0.0% |
| $50,000 to $74,999 | 16 | 31.4% |
| $75,000 to $99,999 | 11 | 21.6% |
| $100,000 to $149,999 | 12 | 23.5% |
| $150,000 to $199,999 | 0 | 0.0% |
| $200,000+ | 0 | 0.0% |
Household Income by Householder Age in Atkinson Mills
| Income Bracket | # Households | Median Income |
| 15 to 24 Years | 0 (0.0%) | $0 |
| 25 to 44 Years | 10 (19.6%) | $0 |
| 45 to 64 Years | 39 (76.5%) | $0 |
| 65+ Years | 2 (3.9%) | $0 |
| Total | 51 (100.0%) | $71,250 |
Poverty in Atkinson Mills
Income Below Poverty by Sex and Age in Atkinson Mills
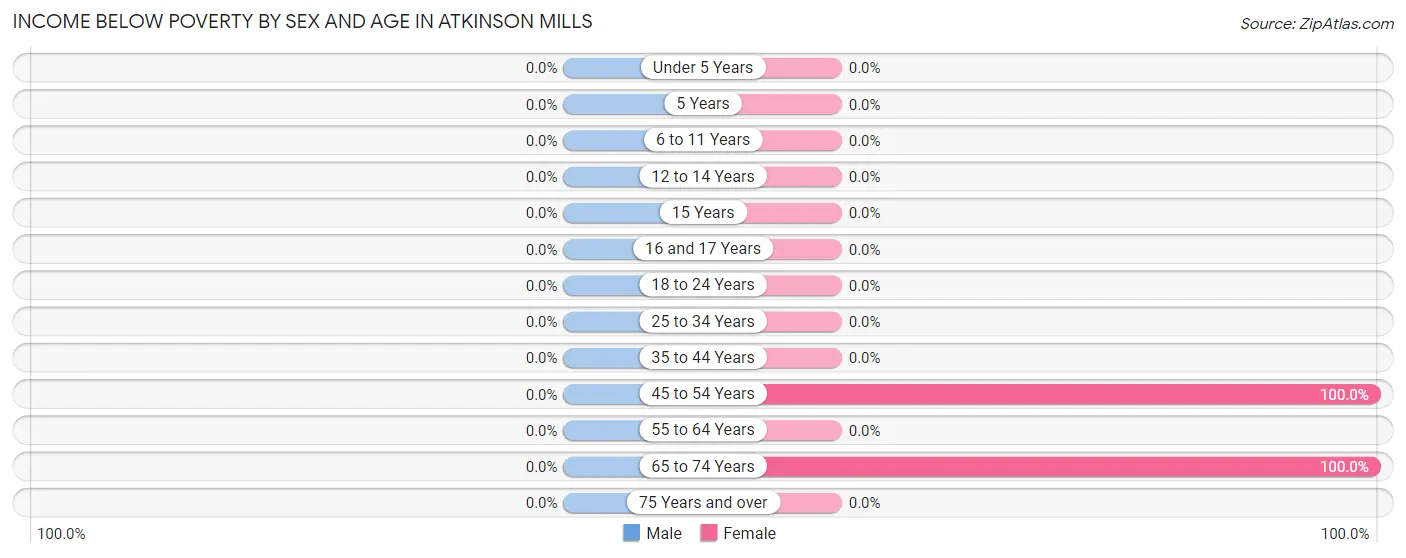
| Age Bracket | Male | Female |
| Under 5 Years | 0 (0.0%) | 0 (0.0%) |
| 5 Years | 0 (0.0%) | 0 (0.0%) |
| 6 to 11 Years | 0 (0.0%) | 0 (0.0%) |
| 12 to 14 Years | 0 (0.0%) | 0 (0.0%) |
| 15 Years | 0 (0.0%) | 0 (0.0%) |
| 16 and 17 Years | 0 (0.0%) | 0 (0.0%) |
| 18 to 24 Years | 0 (0.0%) | 0 (0.0%) |
| 25 to 34 Years | 0 (0.0%) | 0 (0.0%) |
| 35 to 44 Years | 0 (0.0%) | 0 (0.0%) |
| 45 to 54 Years | 0 (0.0%) | 10 (100.0%) |
| 55 to 64 Years | 0 (0.0%) | 0 (0.0%) |
| 65 to 74 Years | 0 (0.0%) | 2 (100.0%) |
| 75 Years and over | 0 (0.0%) | 0 (0.0%) |
| Total | 0 (0.0%) | 12 (24.5%) |
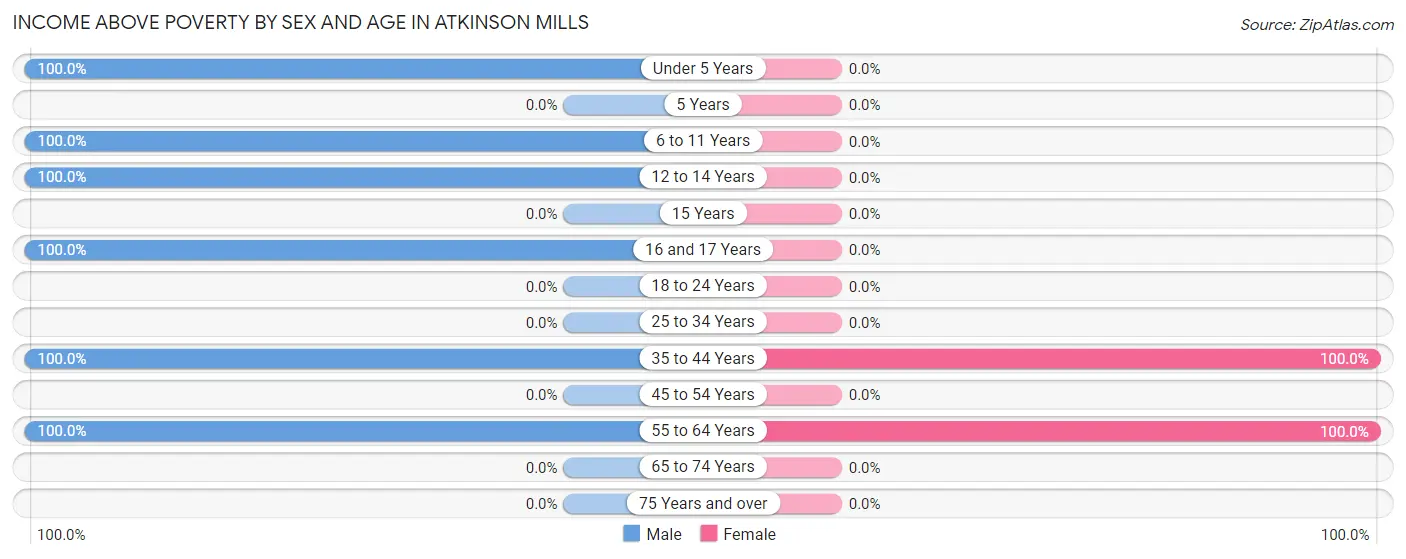
Income Above Poverty by Sex and Age in Atkinson Mills
According to the poverty statistics in Atkinson Mills, males aged under 5 years and females aged 35 to 44 years are the age groups that are most secure financially, with 100.0% of males and 100.0% of females in these age groups living above the poverty line.
| Age Bracket | Male | Female |
| Under 5 Years | 13 (100.0%) | 0 (0.0%) |
| 5 Years | 0 (0.0%) | 0 (0.0%) |
| 6 to 11 Years | 10 (100.0%) | 0 (0.0%) |
| 12 to 14 Years | 5 (100.0%) | 0 (0.0%) |
| 15 Years | 0 (0.0%) | 0 (0.0%) |
| 16 and 17 Years | 5 (100.0%) | 0 (0.0%) |
| 18 to 24 Years | 0 (0.0%) | 0 (0.0%) |
| 25 to 34 Years | 0 (0.0%) | 0 (0.0%) |
| 35 to 44 Years | 11 (100.0%) | 9 (100.0%) |
| 45 to 54 Years | 0 (0.0%) | 0 (0.0%) |
| 55 to 64 Years | 33 (100.0%) | 28 (100.0%) |
| 65 to 74 Years | 0 (0.0%) | 0 (0.0%) |
| 75 Years and over | 0 (0.0%) | 0 (0.0%) |
| Total | 77 (100.0%) | 37 (75.5%) |
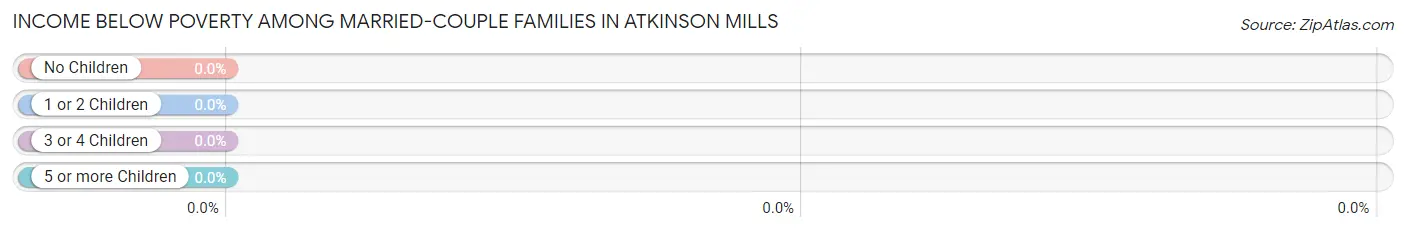
Income Below Poverty Among Married-Couple Families in Atkinson Mills
| Children | Above Poverty | Below Poverty |
| No Children | 29 (100.0%) | 0 (0.0%) |
| 1 or 2 Children | 0 (0.0%) | 0 (0.0%) |
| 3 or 4 Children | 10 (100.0%) | 0 (0.0%) |
| 5 or more Children | 0 (0.0%) | 0 (0.0%) |
| Total | 39 (100.0%) | 0 (0.0%) |
Income Below Poverty Among Single-Parent Households in Atkinson Mills
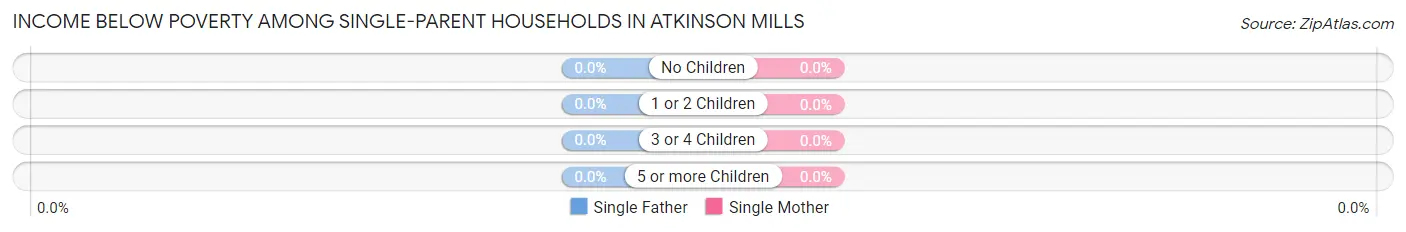
| Children | Single Father | Single Mother |
| No Children | 0 (0.0%) | 0 (0.0%) |
| 1 or 2 Children | 0 (0.0%) | 0 (0.0%) |
| 3 or 4 Children | 0 (0.0%) | 0 (0.0%) |
| 5 or more Children | 0 (0.0%) | 0 (0.0%) |
| Total | 0 (0.0%) | 0 (0.0%) |
Income Below Poverty Among Married-Couple vs Single-Parent Households in Atkinson Mills
| Children | Married-Couple Families | Single-Parent Households |
| No Children | 0 (0.0%) | 0 (0.0%) |
| 1 or 2 Children | 0 (0.0%) | 0 (0.0%) |
| 3 or 4 Children | 0 (0.0%) | 0 (0.0%) |
| 5 or more Children | 0 (0.0%) | 0 (0.0%) |
| Total | 0 (0.0%) | 0 (0.0%) |
Employment Characteristics in Atkinson Mills
Employment by Class of Employer in Atkinson Mills
Among the 76 employed individuals in Atkinson Mills, private company employees (34 | 44.7%), state government employees (15 | 19.7%), and self-employed (not incorporated) (11 | 14.5%) make up the most common classes of employment.
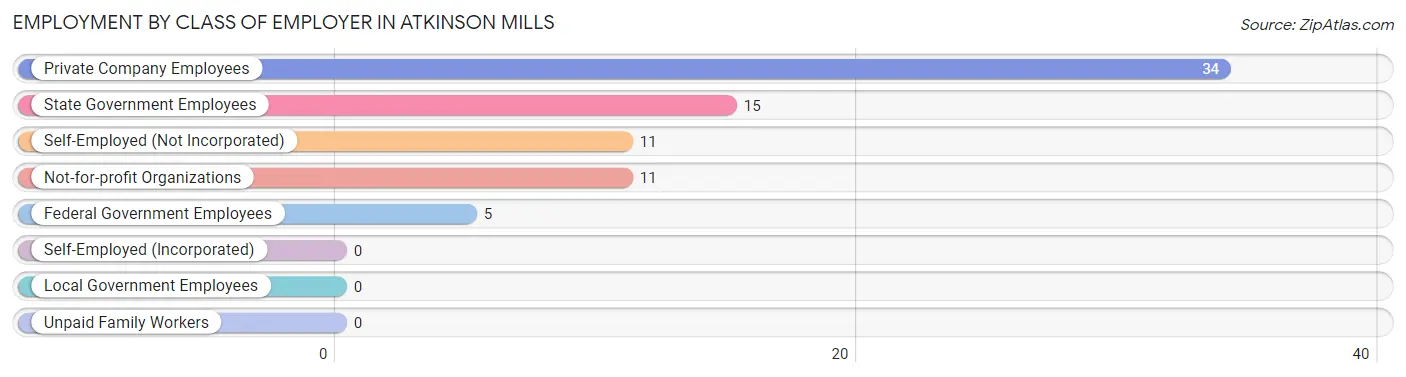
| Employer Class | # Employees | % Employees |
| Private Company Employees | 34 | 44.7% |
| Self-Employed (Incorporated) | 0 | 0.0% |
| Self-Employed (Not Incorporated) | 11 | 14.5% |
| Not-for-profit Organizations | 11 | 14.5% |
| Local Government Employees | 0 | 0.0% |
| State Government Employees | 15 | 19.7% |
| Federal Government Employees | 5 | 6.6% |
| Unpaid Family Workers | 0 | 0.0% |
| Total | 76 | 100.0% |
Employment Status by Age in Atkinson Mills
According to the labor force statistics for Atkinson Mills, out of the total population over 16 years of age (98), 81.6% or 80 individuals are in the labor force, with 5.3% or 4 of them unemployed. The age group with the highest labor force participation rate is 16 to 19 years, with 100.0% or 5 individuals in the labor force. Within the labor force, the 35 to 44 years age range has the highest percentage of unemployed individuals, with 20.0% or 4 of them being unemployed.
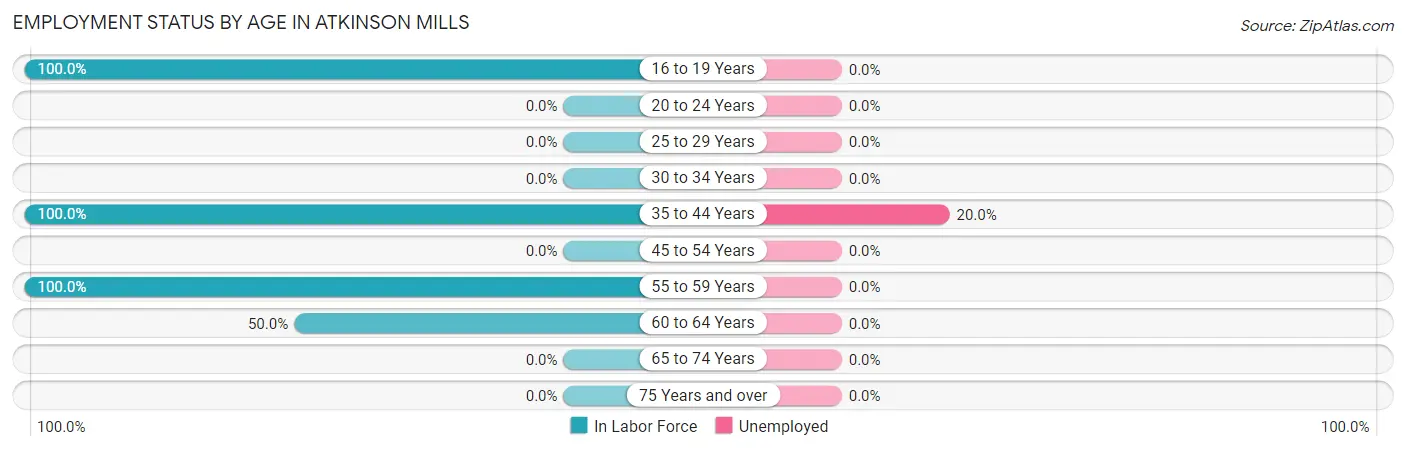
| Age Bracket | In Labor Force | Unemployed |
| 16 to 19 Years | 5 (100.0%) | 0 (0.0%) |
| 20 to 24 Years | 0 (0.0%) | 0 (0.0%) |
| 25 to 29 Years | 0 (0.0%) | 0 (0.0%) |
| 30 to 34 Years | 0 (0.0%) | 0 (0.0%) |
| 35 to 44 Years | 20 (100.0%) | 4 (20.0%) |
| 45 to 54 Years | 0 (0.0%) | 0 (0.0%) |
| 55 to 59 Years | 49 (100.0%) | 0 (0.0%) |
| 60 to 64 Years | 6 (50.0%) | 0 (0.0%) |
| 65 to 74 Years | 0 (0.0%) | 0 (0.0%) |
| 75 Years and over | 0 (0.0%) | 0 (0.0%) |
| Total | 80 (81.6%) | 4 (5.3%) |
Employment Status by Educational Attainment in Atkinson Mills
According to labor force statistics for Atkinson Mills, 82.4% of individuals (75) out of the total population between 25 and 64 years of age (91) are in the labor force, with 5.3% or 4 of them being unemployed. The group with the highest labor force participation rate are those with the educational attainment of college / associate degree, with 100.0% or 14 individuals in the labor force. Within the labor force, individuals with college / associate degree education have the highest percentage of unemployment, with 28.6% or 4 of them being unemployed.
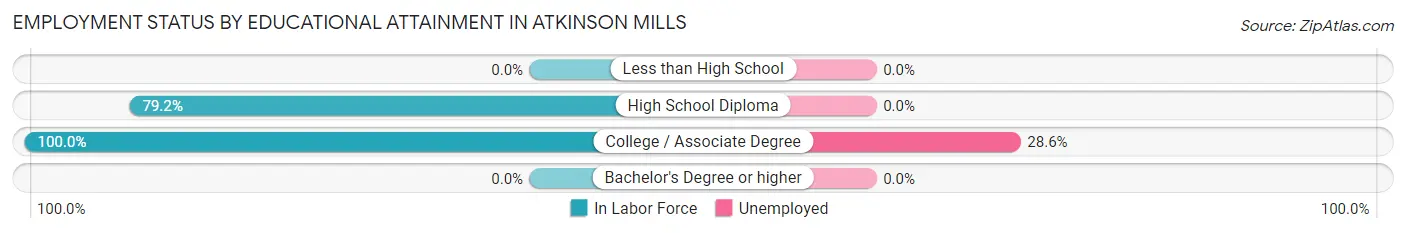
| Educational Attainment | In Labor Force | Unemployed |
| Less than High School | 0 (0.0%) | 0 (0.0%) |
| High School Diploma | 61 (79.2%) | 0 (0.0%) |
| College / Associate Degree | 14 (100.0%) | 4 (28.6%) |
| Bachelor's Degree or higher | 0 (0.0%) | 0 (0.0%) |
| Total | 75 (82.4%) | 5 (5.3%) |
Employment Occupations by Sex in Atkinson Mills
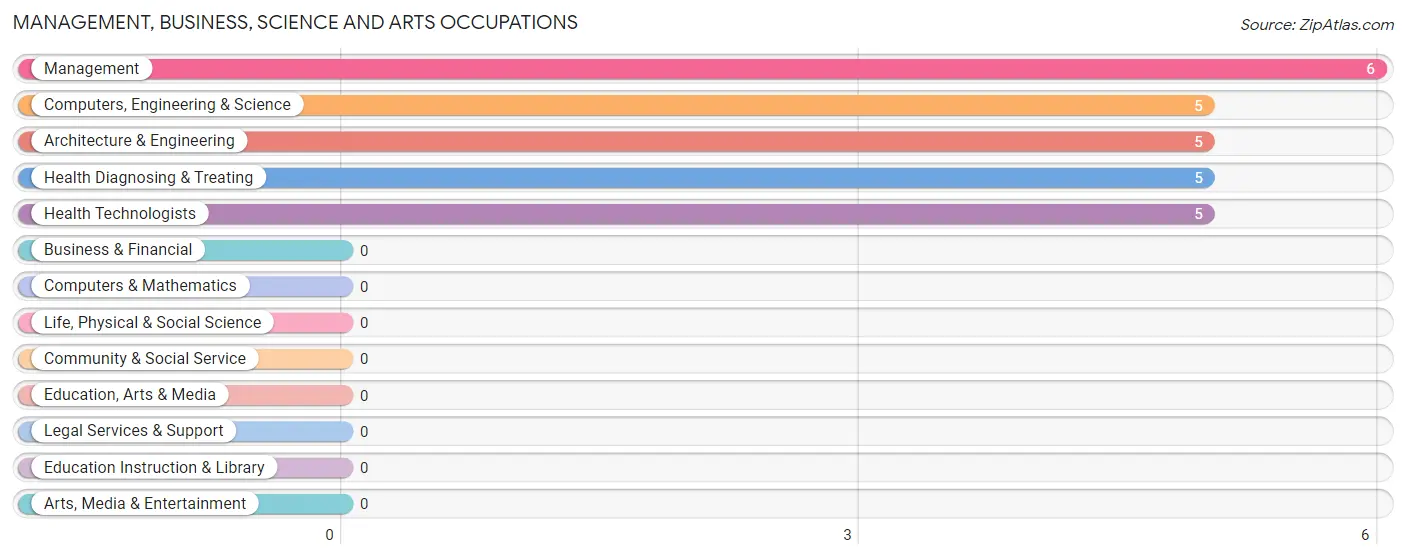
Management, Business, Science and Arts Occupations
The most common Management, Business, Science and Arts occupations in Atkinson Mills are Management (6 | 8.5%), Computers, Engineering & Science (5 | 7.0%), Architecture & Engineering (5 | 7.0%), Health Diagnosing & Treating (5 | 7.0%), and Health Technologists (5 | 7.0%).
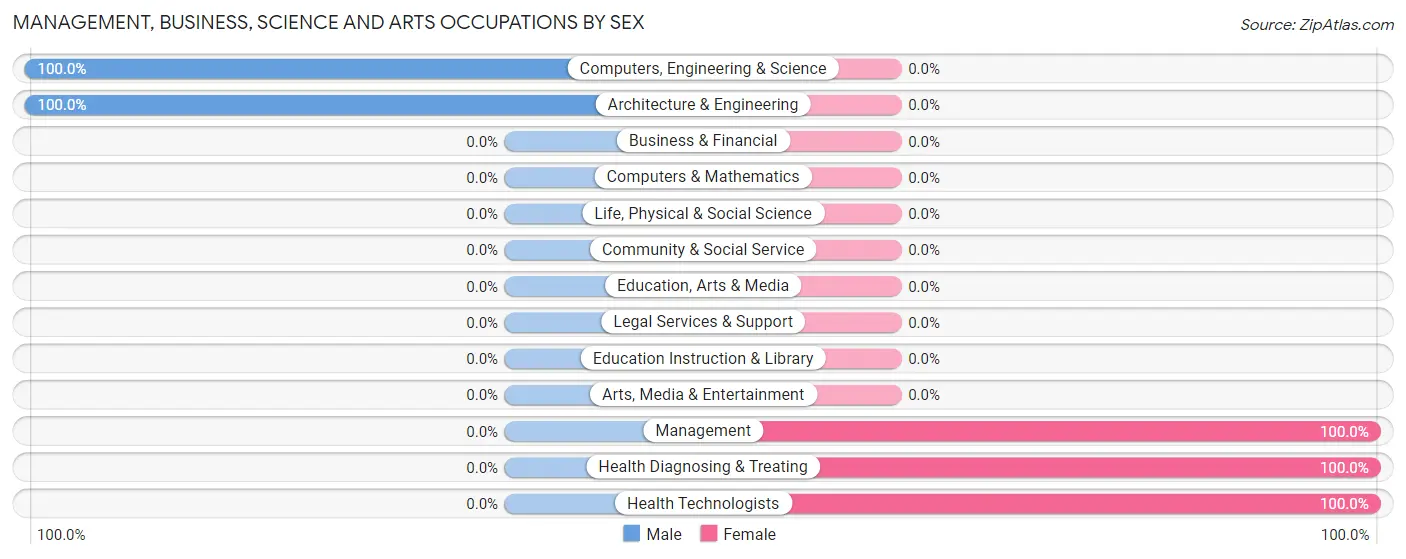
Management, Business, Science and Arts Occupations by Sex
Within the Management, Business, Science and Arts occupations in Atkinson Mills, the most male-oriented occupations are Computers, Engineering & Science (100.0%), and Architecture & Engineering (100.0%), while the most female-oriented occupations are Management (100.0%), Health Diagnosing & Treating (100.0%), and Health Technologists (100.0%).
| Occupation | Male | Female |
| Management | 0 (0.0%) | 6 (100.0%) |
| Business & Financial | 0 (0.0%) | 0 (0.0%) |
| Computers, Engineering & Science | 5 (100.0%) | 0 (0.0%) |
| Computers & Mathematics | 0 (0.0%) | 0 (0.0%) |
| Architecture & Engineering | 5 (100.0%) | 0 (0.0%) |
| Life, Physical & Social Science | 0 (0.0%) | 0 (0.0%) |
| Community & Social Service | 0 (0.0%) | 0 (0.0%) |
| Education, Arts & Media | 0 (0.0%) | 0 (0.0%) |
| Legal Services & Support | 0 (0.0%) | 0 (0.0%) |
| Education Instruction & Library | 0 (0.0%) | 0 (0.0%) |
| Arts, Media & Entertainment | 0 (0.0%) | 0 (0.0%) |
| Health Diagnosing & Treating | 0 (0.0%) | 5 (100.0%) |
| Health Technologists | 0 (0.0%) | 5 (100.0%) |
| Total (Category) | 5 (31.2%) | 11 (68.8%) |
| Total (Overall) | 38 (53.5%) | 33 (46.5%) |
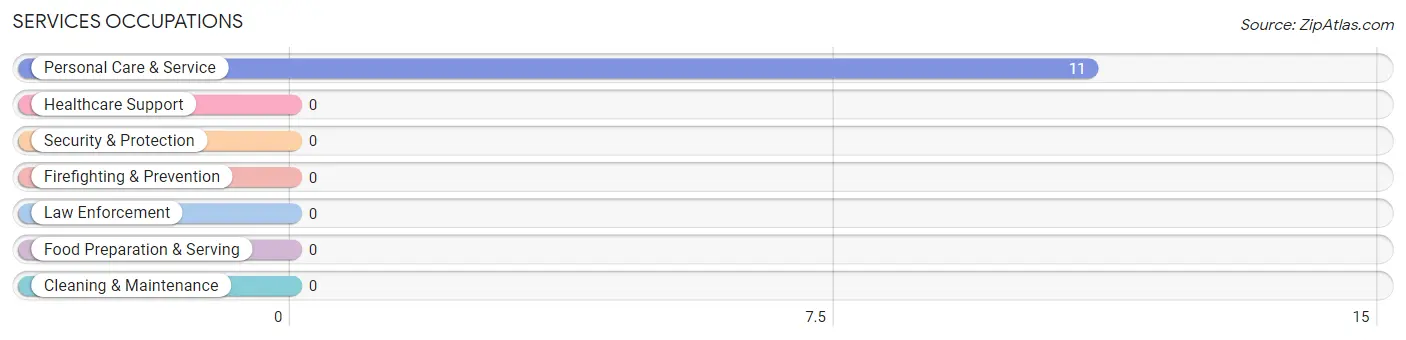
Services Occupations
The most common Services occupations in Atkinson Mills are , and Personal Care & Service (11 | 15.5%).
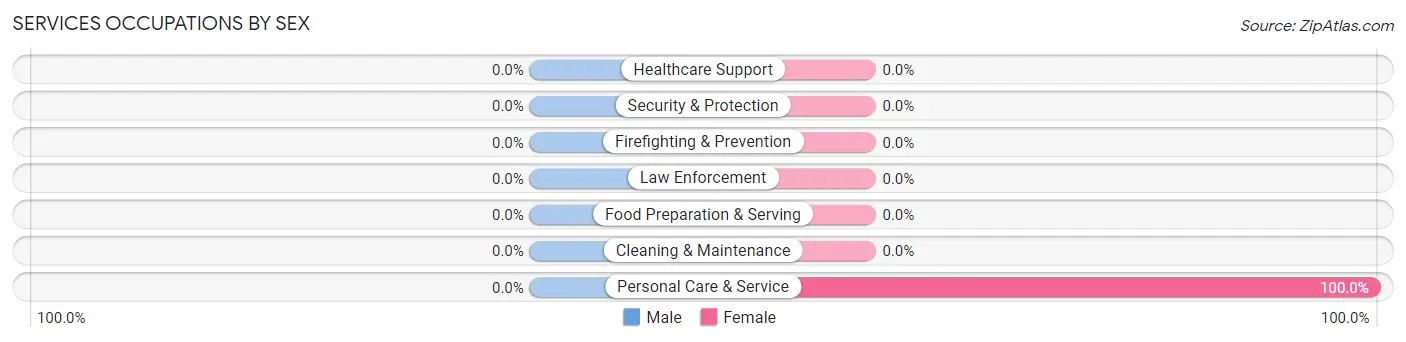
Services Occupations by Sex
| Occupation | Male | Female |
| Healthcare Support | 0 (0.0%) | 0 (0.0%) |
| Security & Protection | 0 (0.0%) | 0 (0.0%) |
| Firefighting & Prevention | 0 (0.0%) | 0 (0.0%) |
| Law Enforcement | 0 (0.0%) | 0 (0.0%) |
| Food Preparation & Serving | 0 (0.0%) | 0 (0.0%) |
| Cleaning & Maintenance | 0 (0.0%) | 0 (0.0%) |
| Personal Care & Service | 0 (0.0%) | 11 (100.0%) |
| Total (Category) | 0 (0.0%) | 11 (100.0%) |
| Total (Overall) | 38 (53.5%) | 33 (46.5%) |
Sales and Office Occupations
The most common Sales and Office occupations in Atkinson Mills are , and Sales & Related (11 | 15.5%).
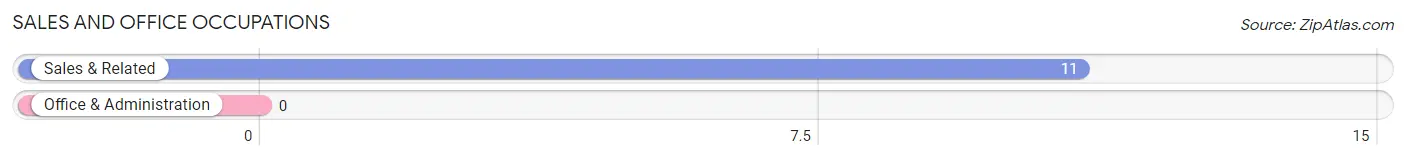
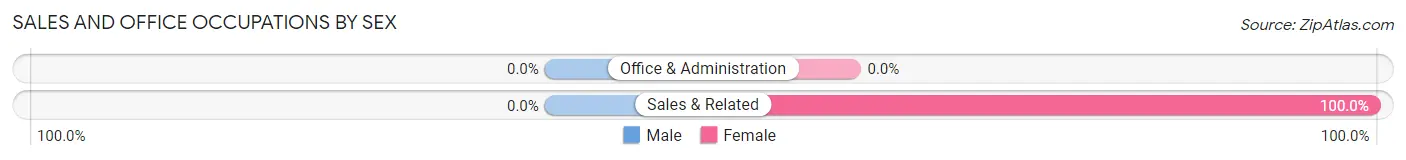
Sales and Office Occupations by Sex
| Occupation | Male | Female |
| Sales & Related | 0 (0.0%) | 11 (100.0%) |
| Office & Administration | 0 (0.0%) | 0 (0.0%) |
| Total (Category) | 0 (0.0%) | 11 (100.0%) |
| Total (Overall) | 38 (53.5%) | 33 (46.5%) |
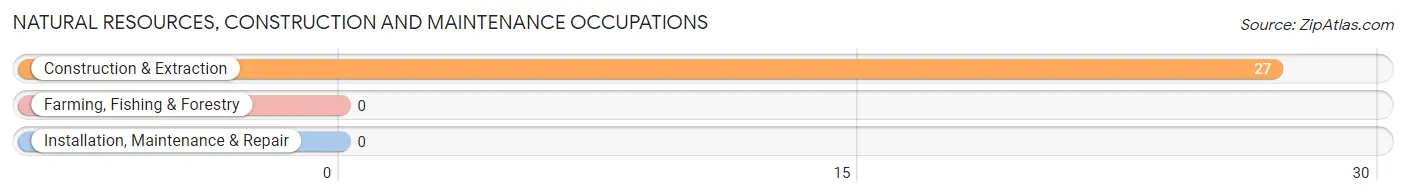
Natural Resources, Construction and Maintenance Occupations
The most common Natural Resources, Construction and Maintenance occupations in Atkinson Mills are , and Construction & Extraction (27 | 38.0%).
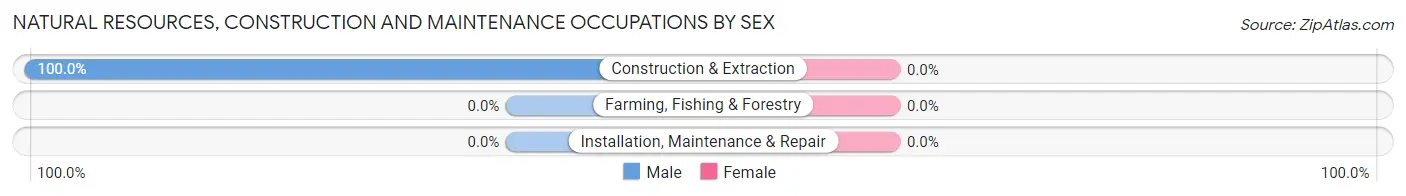
Natural Resources, Construction and Maintenance Occupations by Sex
| Occupation | Male | Female |
| Farming, Fishing & Forestry | 0 (0.0%) | 0 (0.0%) |
| Construction & Extraction | 27 (100.0%) | 0 (0.0%) |
| Installation, Maintenance & Repair | 0 (0.0%) | 0 (0.0%) |
| Total (Category) | 27 (100.0%) | 0 (0.0%) |
| Total (Overall) | 38 (53.5%) | 33 (46.5%) |
Production, Transportation and Moving Occupations
The most common Production, Transportation and Moving occupations in Atkinson Mills are , and Production (6 | 8.5%).
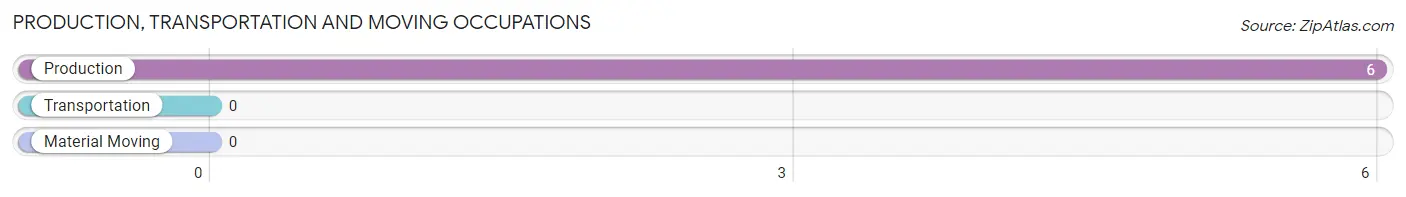
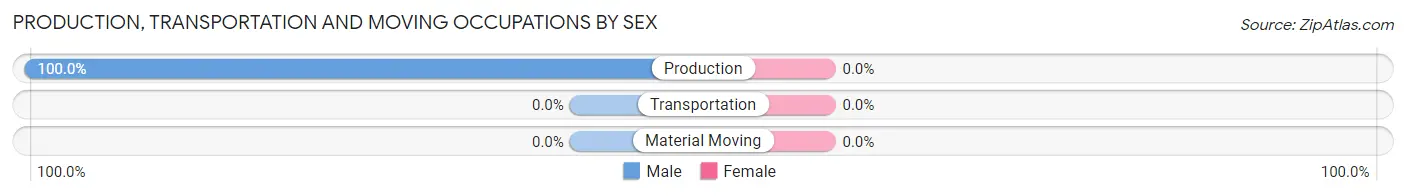
Production, Transportation and Moving Occupations by Sex
| Occupation | Male | Female |
| Production | 6 (100.0%) | 0 (0.0%) |
| Transportation | 0 (0.0%) | 0 (0.0%) |
| Material Moving | 0 (0.0%) | 0 (0.0%) |
| Total (Category) | 6 (100.0%) | 0 (0.0%) |
| Total (Overall) | 38 (53.5%) | 33 (46.5%) |
Employment Industries by Sex in Atkinson Mills
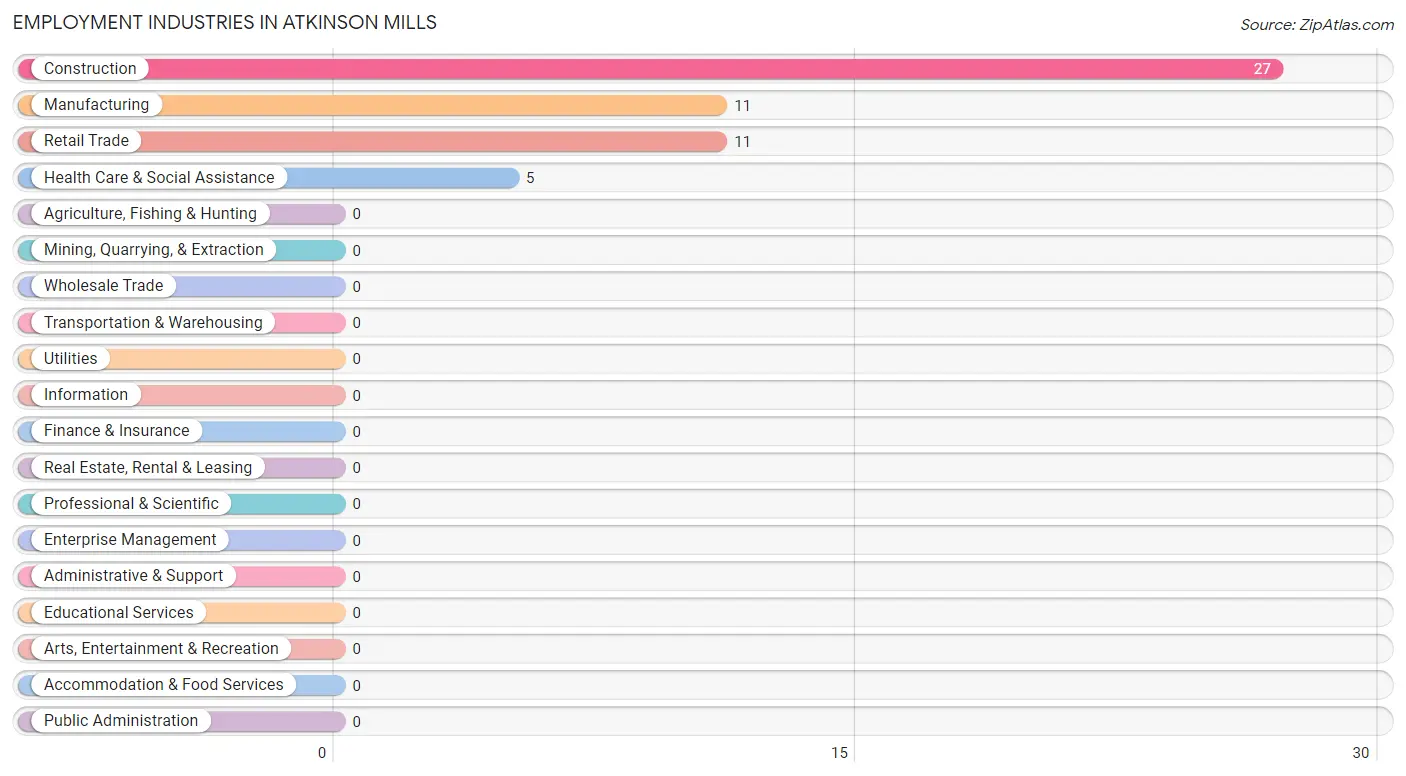
Employment Industries in Atkinson Mills
The major employment industries in Atkinson Mills include Construction (27 | 38.0%), Manufacturing (11 | 15.5%), Retail Trade (11 | 15.5%), and Health Care & Social Assistance (5 | 7.0%).
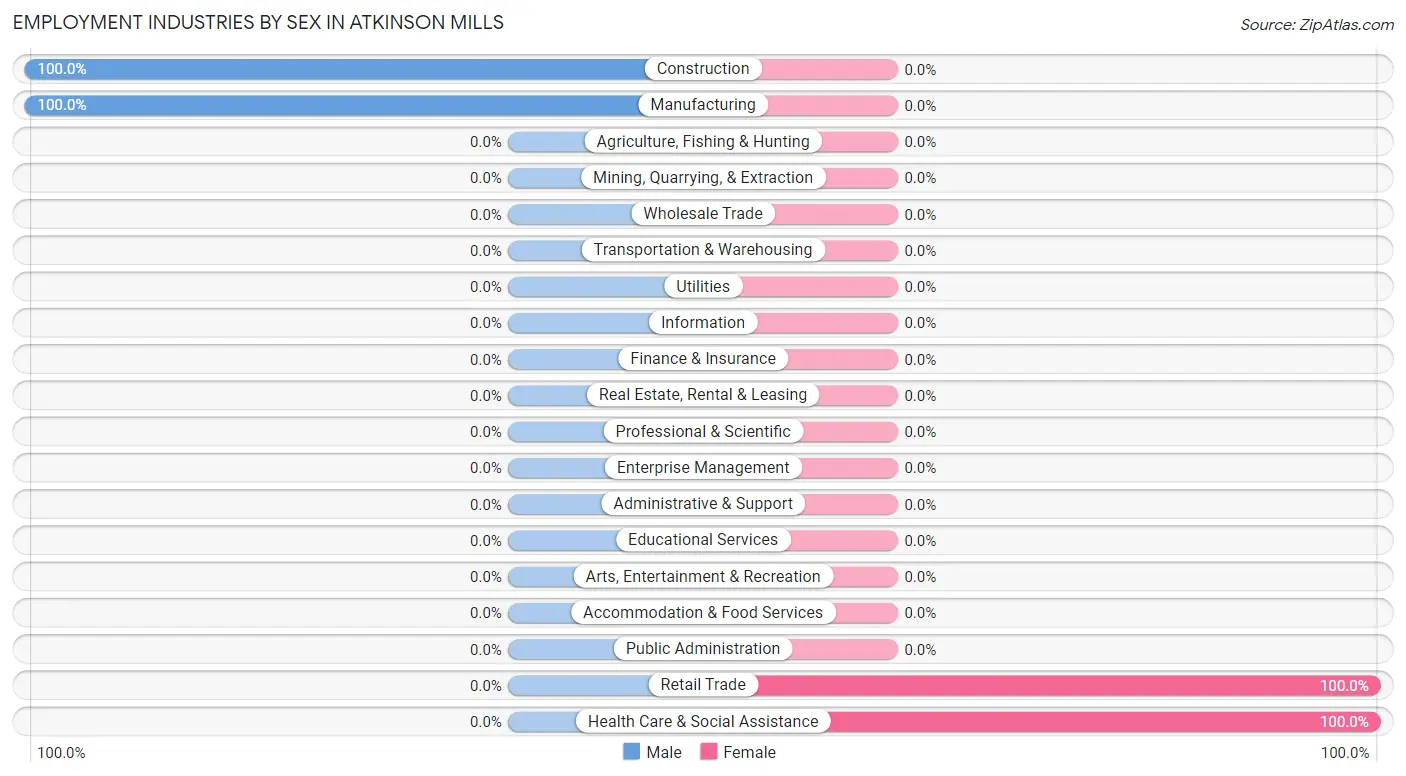
Employment Industries by Sex in Atkinson Mills
The Atkinson Mills industries that see more men than women are Construction (100.0%), and Manufacturing (100.0%), whereas the industries that tend to have a higher number of women are Retail Trade (100.0%), and Health Care & Social Assistance (100.0%).
| Industry | Male | Female |
| Agriculture, Fishing & Hunting | 0 (0.0%) | 0 (0.0%) |
| Mining, Quarrying, & Extraction | 0 (0.0%) | 0 (0.0%) |
| Construction | 27 (100.0%) | 0 (0.0%) |
| Manufacturing | 11 (100.0%) | 0 (0.0%) |
| Wholesale Trade | 0 (0.0%) | 0 (0.0%) |
| Retail Trade | 0 (0.0%) | 11 (100.0%) |
| Transportation & Warehousing | 0 (0.0%) | 0 (0.0%) |
| Utilities | 0 (0.0%) | 0 (0.0%) |
| Information | 0 (0.0%) | 0 (0.0%) |
| Finance & Insurance | 0 (0.0%) | 0 (0.0%) |
| Real Estate, Rental & Leasing | 0 (0.0%) | 0 (0.0%) |
| Professional & Scientific | 0 (0.0%) | 0 (0.0%) |
| Enterprise Management | 0 (0.0%) | 0 (0.0%) |
| Administrative & Support | 0 (0.0%) | 0 (0.0%) |
| Educational Services | 0 (0.0%) | 0 (0.0%) |
| Health Care & Social Assistance | 0 (0.0%) | 5 (100.0%) |
| Arts, Entertainment & Recreation | 0 (0.0%) | 0 (0.0%) |
| Accommodation & Food Services | 0 (0.0%) | 0 (0.0%) |
| Public Administration | 0 (0.0%) | 0 (0.0%) |
| Total | 38 (53.5%) | 33 (46.5%) |
Education in Atkinson Mills
School Enrollment in Atkinson Mills
The most common levels of schooling among the 20 students in Atkinson Mills are middle school (10 | 50.0%), elementary school (5 | 25.0%), and high school (5 | 25.0%).
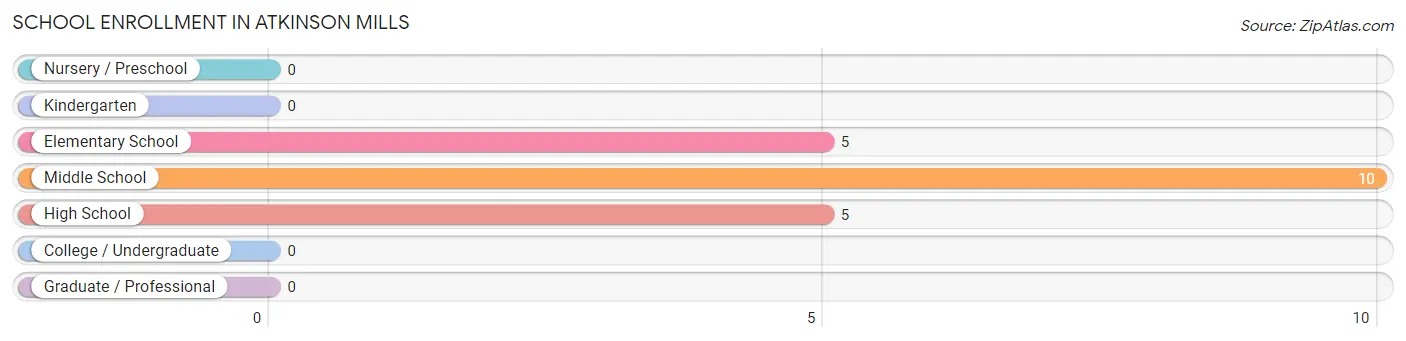
| School Level | # Students | % Students |
| Nursery / Preschool | 0 | 0.0% |
| Kindergarten | 0 | 0.0% |
| Elementary School | 5 | 25.0% |
| Middle School | 10 | 50.0% |
| High School | 5 | 25.0% |
| College / Undergraduate | 0 | 0.0% |
| Graduate / Professional | 0 | 0.0% |
| Total | 20 | 100.0% |
School Enrollment by Age by Funding Source in Atkinson Mills
Out of a total of 20 students who are enrolled in schools in Atkinson Mills, 5 (25.0%) attend a private institution, while the remaining 15 (75.0%) are enrolled in public schools. The age group of 5 to 9 year old has the highest likelihood of being enrolled in private schools, with 5 (100.0% in the age bracket) enrolled. Conversely, the age group of 10 to 14 year olds has the lowest likelihood of being enrolled in a private school, with 10 (100.0% in the age bracket) attending a public institution.
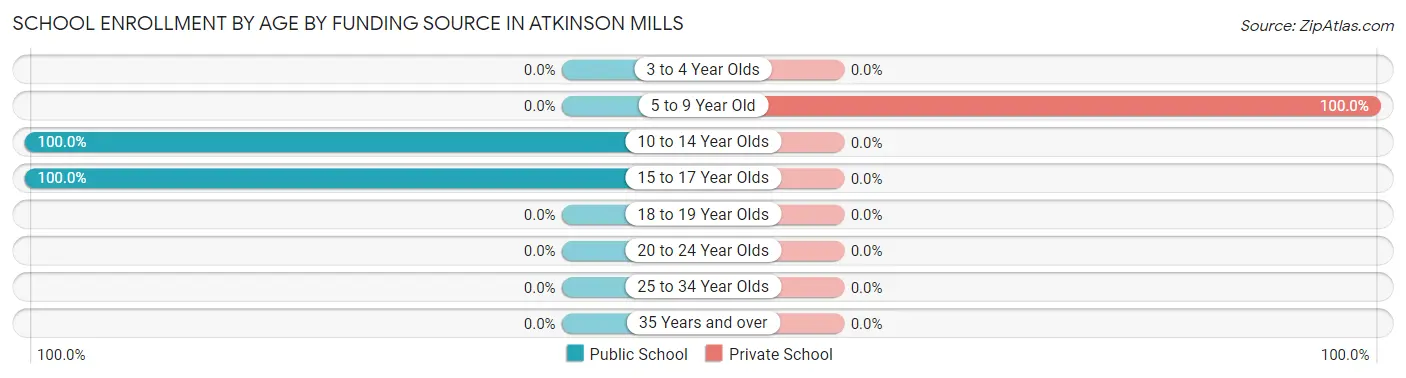
| Age Bracket | Public School | Private School |
| 3 to 4 Year Olds | 0 (0.0%) | 0 (0.0%) |
| 5 to 9 Year Old | 0 (0.0%) | 5 (100.0%) |
| 10 to 14 Year Olds | 10 (100.0%) | 0 (0.0%) |
| 15 to 17 Year Olds | 5 (100.0%) | 0 (0.0%) |
| 18 to 19 Year Olds | 0 (0.0%) | 0 (0.0%) |
| 20 to 24 Year Olds | 0 (0.0%) | 0 (0.0%) |
| 25 to 34 Year Olds | 0 (0.0%) | 0 (0.0%) |
| 35 Years and over | 0 (0.0%) | 0 (0.0%) |
| Total | 15 (75.0%) | 5 (25.0%) |
Educational Attainment by Field of Study in Atkinson Mills
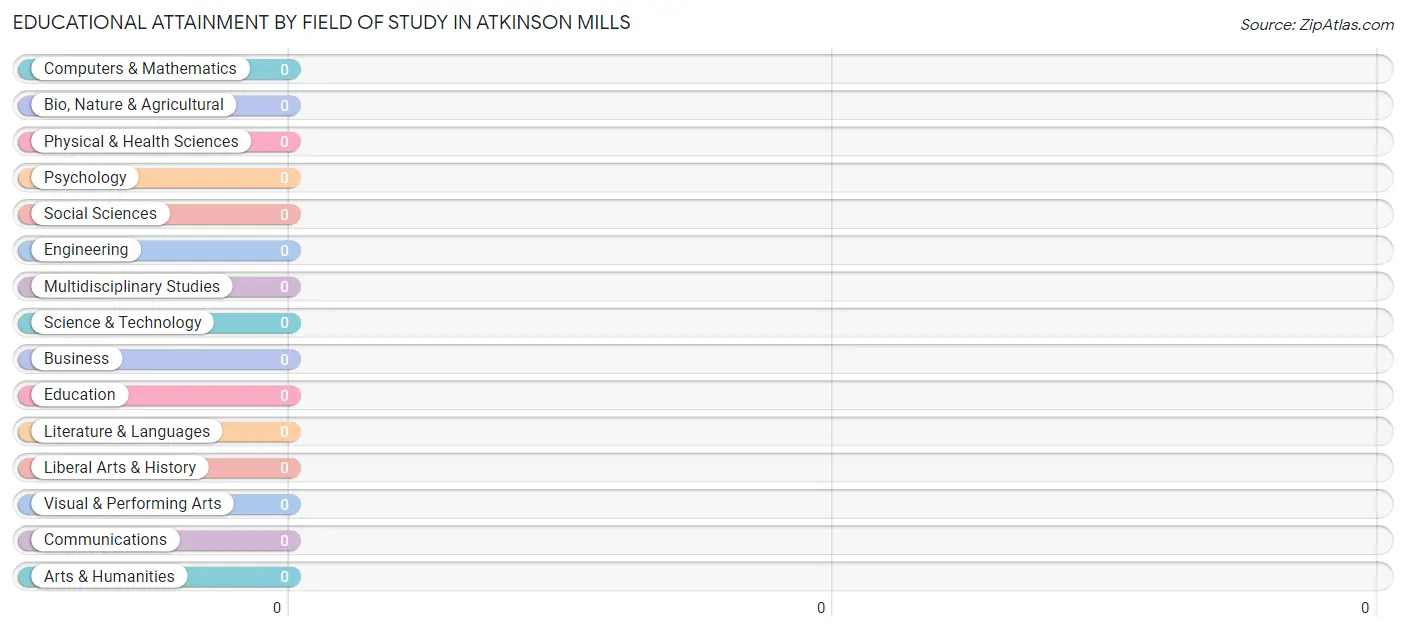
| Field of Study | # Graduates | % Graduates |
| Computers & Mathematics | 0 | 0.0% |
| Bio, Nature & Agricultural | 0 | 0.0% |
| Physical & Health Sciences | 0 | 0.0% |
| Psychology | 0 | 0.0% |
| Social Sciences | 0 | 0.0% |
| Engineering | 0 | 0.0% |
| Multidisciplinary Studies | 0 | 0.0% |
| Science & Technology | 0 | 0.0% |
| Business | 0 | 0.0% |
| Education | 0 | 0.0% |
| Literature & Languages | 0 | 0.0% |
| Liberal Arts & History | 0 | 0.0% |
| Visual & Performing Arts | 0 | 0.0% |
| Communications | 0 | 0.0% |
| Arts & Humanities | 0 | 0.0% |
| Total | 0 | 0.0% |
Transportation & Commute in Atkinson Mills
Vehicle Availability by Sex in Atkinson Mills
The most prevalent vehicle ownership categories in Atkinson Mills are males with 2 vehicles (16, accounting for 37.2%) and females with 2 vehicles (5, making up 48.5%).
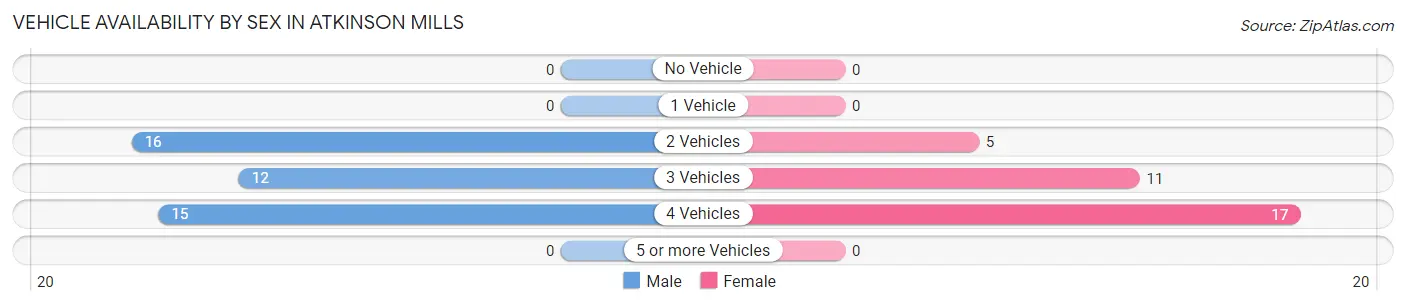
| Vehicles Available | Male | Female |
| No Vehicle | 0 (0.0%) | 0 (0.0%) |
| 1 Vehicle | 0 (0.0%) | 0 (0.0%) |
| 2 Vehicles | 16 (37.2%) | 5 (15.1%) |
| 3 Vehicles | 12 (27.9%) | 11 (33.3%) |
| 4 Vehicles | 15 (34.9%) | 17 (51.5%) |
| 5 or more Vehicles | 0 (0.0%) | 0 (0.0%) |
| Total | 43 (100.0%) | 33 (100.0%) |
Commute Time in Atkinson Mills
The most frequently occuring commute durations in Atkinson Mills are 5 to 9 minutes (33 commuters, 43.4%), 30 to 34 minutes (27 commuters, 35.5%), and 20 to 24 minutes (6 commuters, 7.9%).
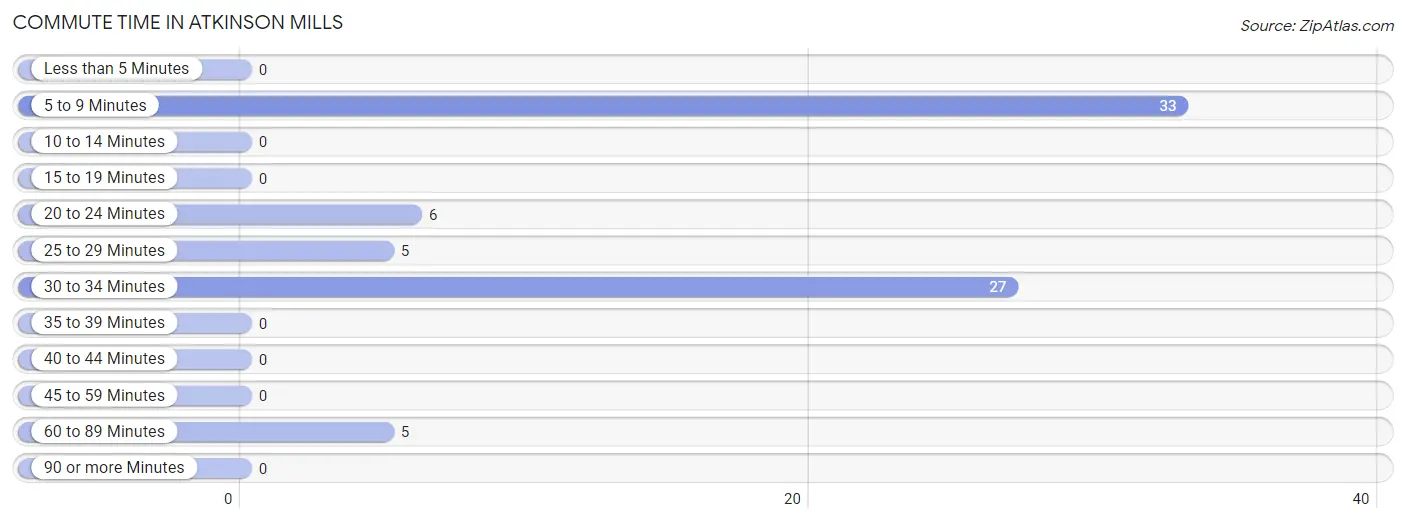
| Commute Time | # Commuters | % Commuters |
| Less than 5 Minutes | 0 | 0.0% |
| 5 to 9 Minutes | 33 | 43.4% |
| 10 to 14 Minutes | 0 | 0.0% |
| 15 to 19 Minutes | 0 | 0.0% |
| 20 to 24 Minutes | 6 | 7.9% |
| 25 to 29 Minutes | 5 | 6.6% |
| 30 to 34 Minutes | 27 | 35.5% |
| 35 to 39 Minutes | 0 | 0.0% |
| 40 to 44 Minutes | 0 | 0.0% |
| 45 to 59 Minutes | 0 | 0.0% |
| 60 to 89 Minutes | 5 | 6.6% |
| 90 or more Minutes | 0 | 0.0% |
Commute Time by Sex in Atkinson Mills
The most common commute times in Atkinson Mills are 5 to 9 minutes (27 commuters, 62.8%) for males and 30 to 34 minutes (22 commuters, 66.7%) for females.
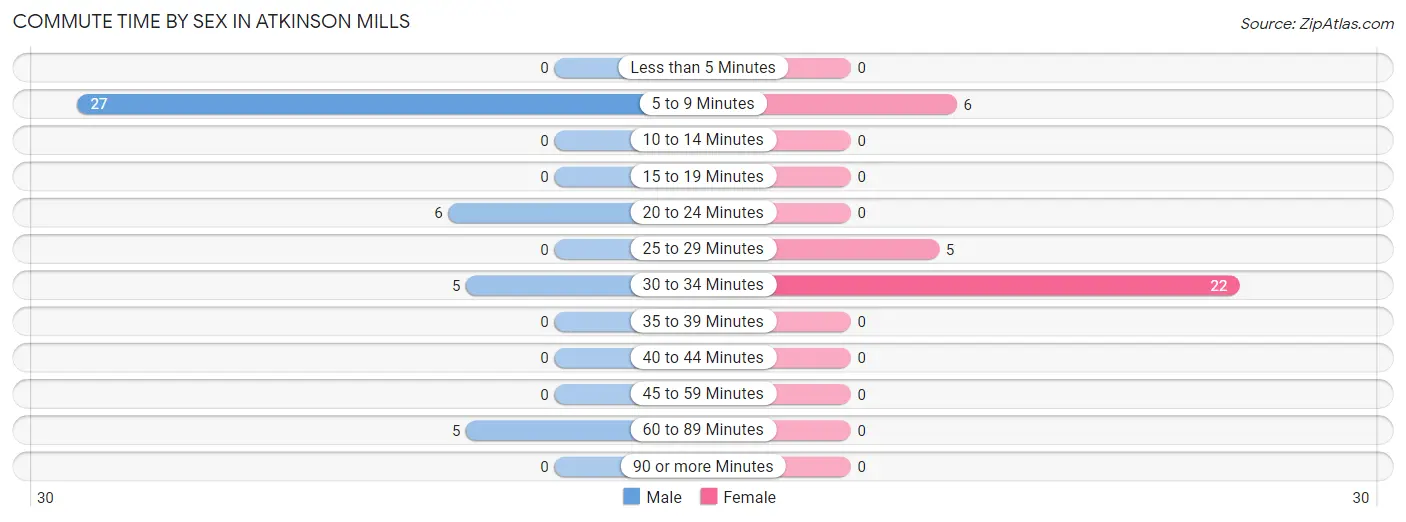
| Commute Time | Male | Female |
| Less than 5 Minutes | 0 (0.0%) | 0 (0.0%) |
| 5 to 9 Minutes | 27 (62.8%) | 6 (18.2%) |
| 10 to 14 Minutes | 0 (0.0%) | 0 (0.0%) |
| 15 to 19 Minutes | 0 (0.0%) | 0 (0.0%) |
| 20 to 24 Minutes | 6 (14.0%) | 0 (0.0%) |
| 25 to 29 Minutes | 0 (0.0%) | 5 (15.1%) |
| 30 to 34 Minutes | 5 (11.6%) | 22 (66.7%) |
| 35 to 39 Minutes | 0 (0.0%) | 0 (0.0%) |
| 40 to 44 Minutes | 0 (0.0%) | 0 (0.0%) |
| 45 to 59 Minutes | 0 (0.0%) | 0 (0.0%) |
| 60 to 89 Minutes | 5 (11.6%) | 0 (0.0%) |
| 90 or more Minutes | 0 (0.0%) | 0 (0.0%) |
Time of Departure to Work by Sex in Atkinson Mills
The most frequent times of departure to work in Atkinson Mills are 7:00 AM to 7:29 AM (27, 62.8%) for males and 8:00 AM to 8:29 AM (28, 84.9%) for females.
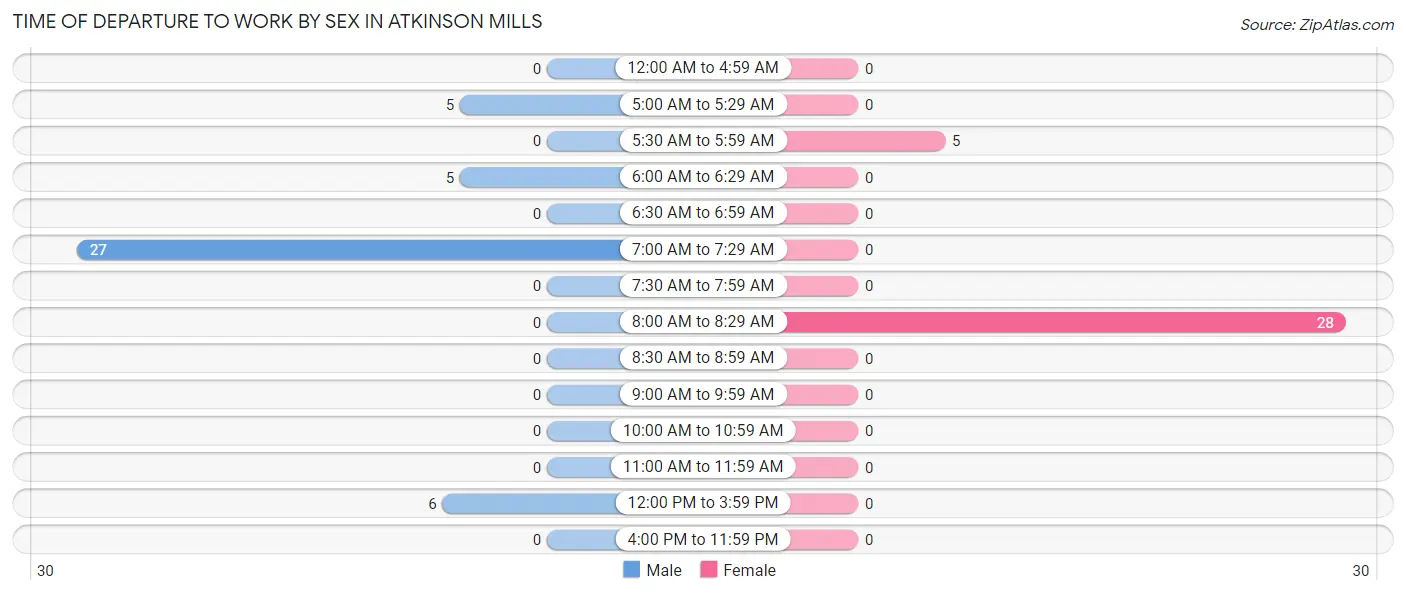
| Time of Departure | Male | Female |
| 12:00 AM to 4:59 AM | 0 (0.0%) | 0 (0.0%) |
| 5:00 AM to 5:29 AM | 5 (11.6%) | 0 (0.0%) |
| 5:30 AM to 5:59 AM | 0 (0.0%) | 5 (15.1%) |
| 6:00 AM to 6:29 AM | 5 (11.6%) | 0 (0.0%) |
| 6:30 AM to 6:59 AM | 0 (0.0%) | 0 (0.0%) |
| 7:00 AM to 7:29 AM | 27 (62.8%) | 0 (0.0%) |
| 7:30 AM to 7:59 AM | 0 (0.0%) | 0 (0.0%) |
| 8:00 AM to 8:29 AM | 0 (0.0%) | 28 (84.9%) |
| 8:30 AM to 8:59 AM | 0 (0.0%) | 0 (0.0%) |
| 9:00 AM to 9:59 AM | 0 (0.0%) | 0 (0.0%) |
| 10:00 AM to 10:59 AM | 0 (0.0%) | 0 (0.0%) |
| 11:00 AM to 11:59 AM | 0 (0.0%) | 0 (0.0%) |
| 12:00 PM to 3:59 PM | 6 (14.0%) | 0 (0.0%) |
| 4:00 PM to 11:59 PM | 0 (0.0%) | 0 (0.0%) |
| Total | 43 (100.0%) | 33 (100.0%) |
Housing Occupancy in Atkinson Mills
Occupancy by Ownership in Atkinson Mills
Of the total 51 dwellings in Atkinson Mills, owner-occupied units account for 46 (90.2%), while renter-occupied units make up 5 (9.8%).
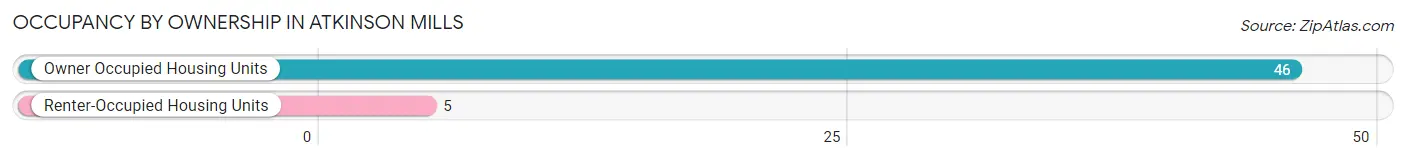
| Occupancy | # Housing Units | % Housing Units |
| Owner Occupied Housing Units | 46 | 90.2% |
| Renter-Occupied Housing Units | 5 | 9.8% |
| Total Occupied Housing Units | 51 | 100.0% |
Occupancy by Household Size in Atkinson Mills
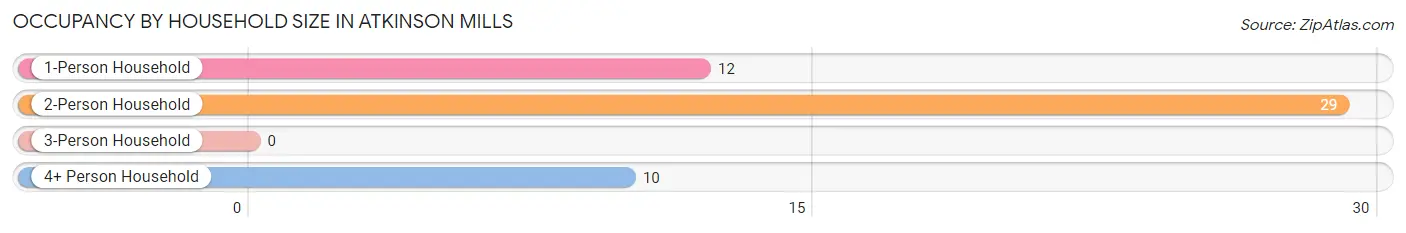
| Household Size | # Housing Units | % Housing Units |
| 1-Person Household | 12 | 23.5% |
| 2-Person Household | 29 | 56.9% |
| 3-Person Household | 0 | 0.0% |
| 4+ Person Household | 10 | 19.6% |
| Total Housing Units | 51 | 100.0% |
Occupancy by Ownership by Household Size in Atkinson Mills
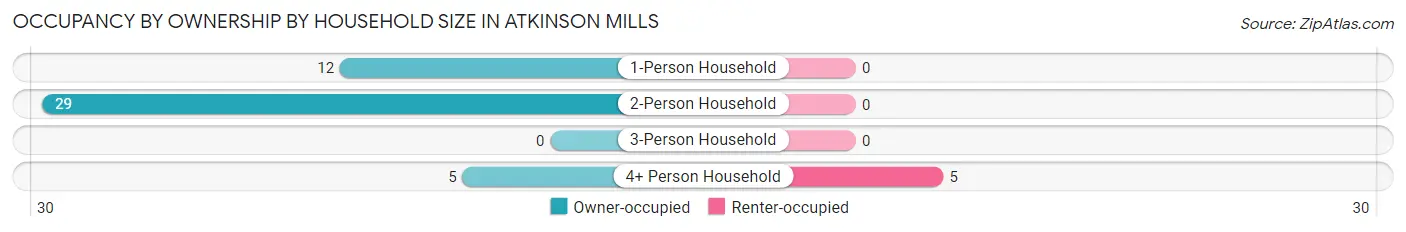
| Household Size | Owner-occupied | Renter-occupied |
| 1-Person Household | 12 (100.0%) | 0 (0.0%) |
| 2-Person Household | 29 (100.0%) | 0 (0.0%) |
| 3-Person Household | 0 (0.0%) | 0 (0.0%) |
| 4+ Person Household | 5 (50.0%) | 5 (50.0%) |
| Total Housing Units | 46 (90.2%) | 5 (9.8%) |
Occupancy by Educational Attainment in Atkinson Mills
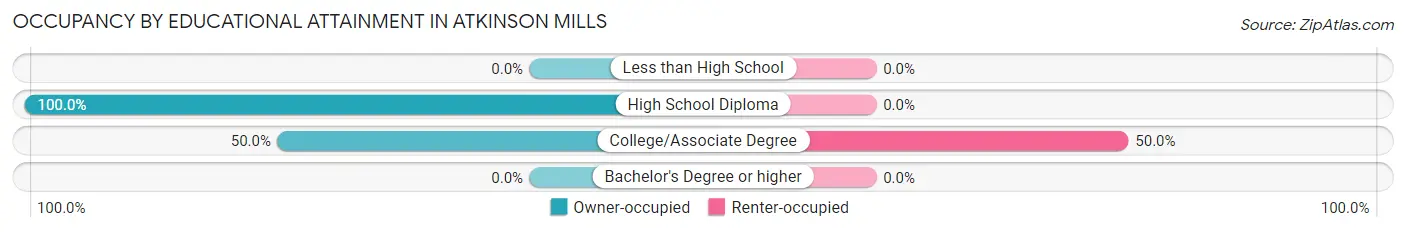
| Household Size | Owner-occupied | Renter-occupied |
| Less than High School | 0 (0.0%) | 0 (0.0%) |
| High School Diploma | 41 (100.0%) | 0 (0.0%) |
| College/Associate Degree | 5 (50.0%) | 5 (50.0%) |
| Bachelor's Degree or higher | 0 (0.0%) | 0 (0.0%) |
Occupancy by Age of Householder in Atkinson Mills
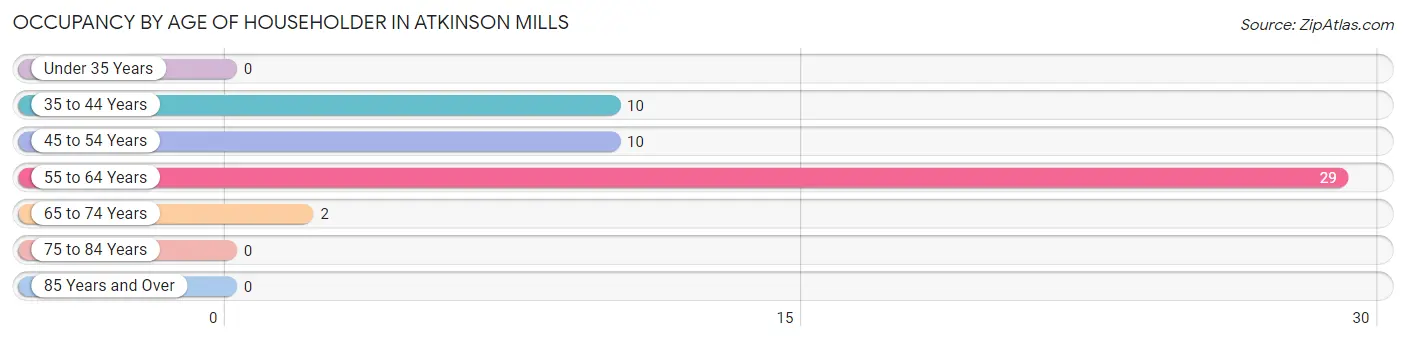
| Age Bracket | # Households | % Households |
| Under 35 Years | 0 | 0.0% |
| 35 to 44 Years | 10 | 19.6% |
| 45 to 54 Years | 10 | 19.6% |
| 55 to 64 Years | 29 | 56.9% |
| 65 to 74 Years | 2 | 3.9% |
| 75 to 84 Years | 0 | 0.0% |
| 85 Years and Over | 0 | 0.0% |
| Total | 51 | 100.0% |
Housing Finances in Atkinson Mills
Median Income by Occupancy in Atkinson Mills
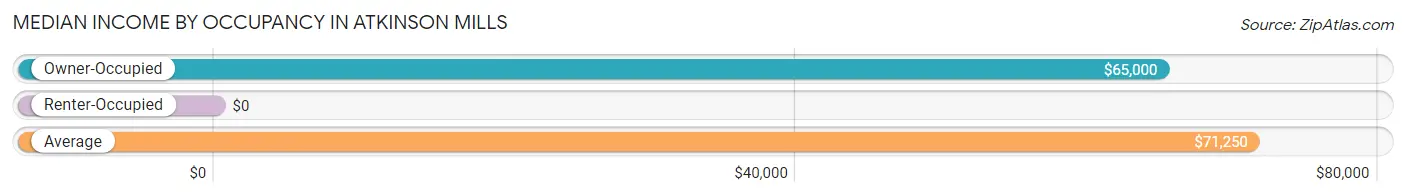
| Occupancy Type | # Households | Median Income |
| Owner-Occupied | 46 (90.2%) | $65,000 |
| Renter-Occupied | 5 (9.8%) | $0 |
| Average | 51 (100.0%) | $71,250 |
Occupancy by Householder Income Bracket in Atkinson Mills
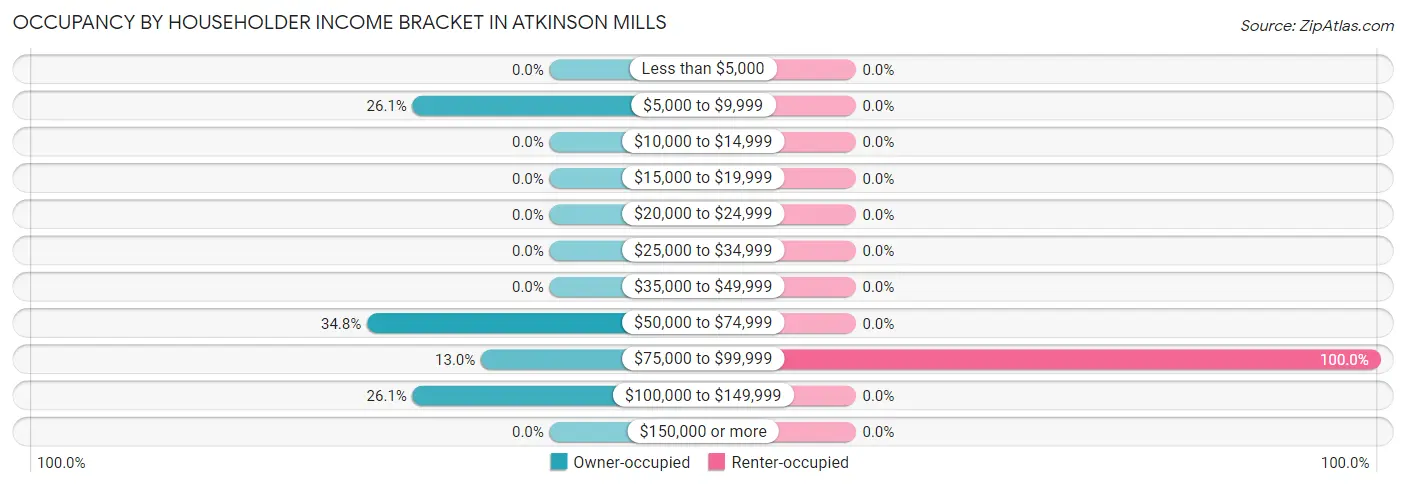
| Income Bracket | Owner-occupied | Renter-occupied |
| Less than $5,000 | 0 (0.0%) | 0 (0.0%) |
| $5,000 to $9,999 | 12 (26.1%) | 0 (0.0%) |
| $10,000 to $14,999 | 0 (0.0%) | 0 (0.0%) |
| $15,000 to $19,999 | 0 (0.0%) | 0 (0.0%) |
| $20,000 to $24,999 | 0 (0.0%) | 0 (0.0%) |
| $25,000 to $34,999 | 0 (0.0%) | 0 (0.0%) |
| $35,000 to $49,999 | 0 (0.0%) | 0 (0.0%) |
| $50,000 to $74,999 | 16 (34.8%) | 0 (0.0%) |
| $75,000 to $99,999 | 6 (13.0%) | 5 (100.0%) |
| $100,000 to $149,999 | 12 (26.1%) | 0 (0.0%) |
| $150,000 or more | 0 (0.0%) | 0 (0.0%) |
| Total | 46 (100.0%) | 5 (100.0%) |
Monthly Housing Cost Tiers in Atkinson Mills
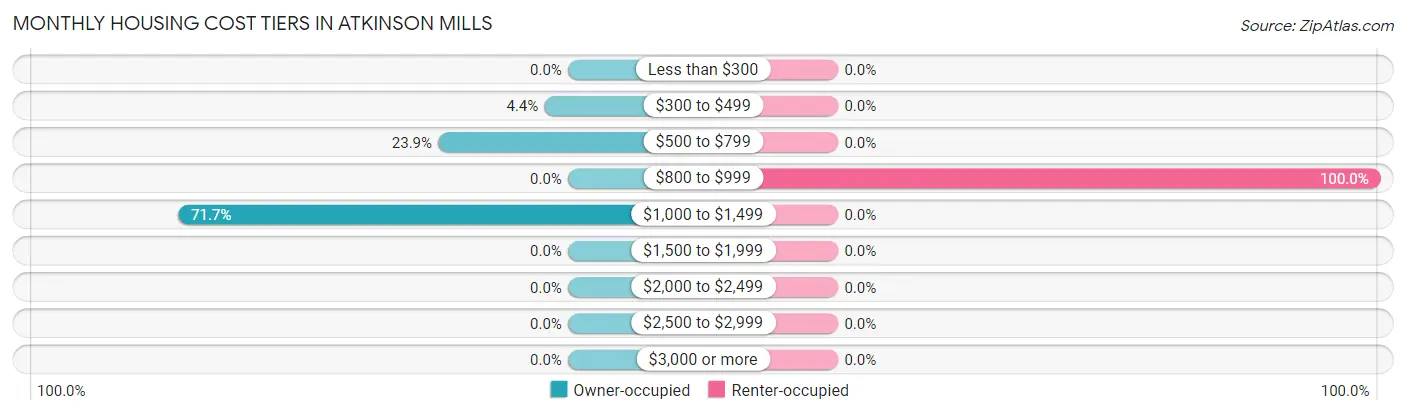
| Monthly Cost | Owner-occupied | Renter-occupied |
| Less than $300 | 0 (0.0%) | 0 (0.0%) |
| $300 to $499 | 2 (4.3%) | 0 (0.0%) |
| $500 to $799 | 11 (23.9%) | 0 (0.0%) |
| $800 to $999 | 0 (0.0%) | 5 (100.0%) |
| $1,000 to $1,499 | 33 (71.7%) | 0 (0.0%) |
| $1,500 to $1,999 | 0 (0.0%) | 0 (0.0%) |
| $2,000 to $2,499 | 0 (0.0%) | 0 (0.0%) |
| $2,500 to $2,999 | 0 (0.0%) | 0 (0.0%) |
| $3,000 or more | 0 (0.0%) | 0 (0.0%) |
| Total | 46 (100.0%) | 5 (100.0%) |
Physical Housing Characteristics in Atkinson Mills
Housing Structures in Atkinson Mills
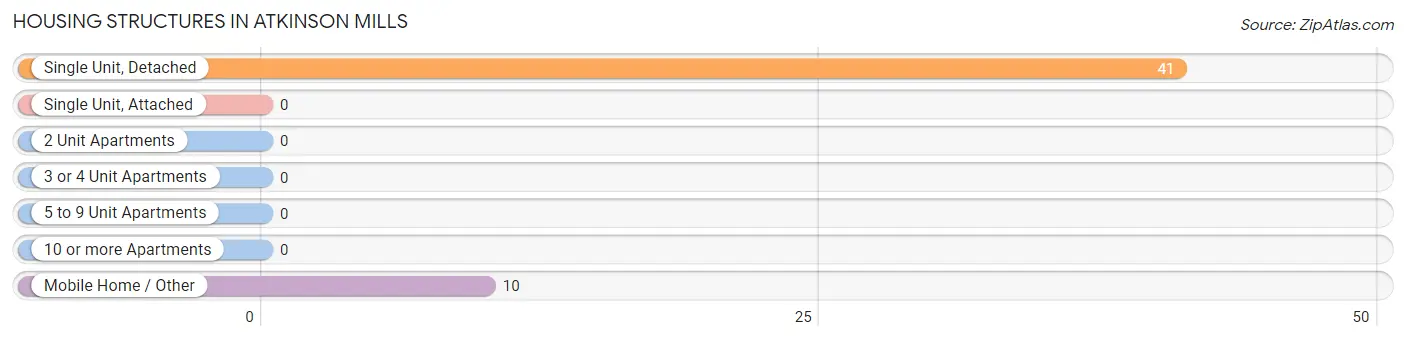
| Structure Type | # Housing Units | % Housing Units |
| Single Unit, Detached | 41 | 80.4% |
| Single Unit, Attached | 0 | 0.0% |
| 2 Unit Apartments | 0 | 0.0% |
| 3 or 4 Unit Apartments | 0 | 0.0% |
| 5 to 9 Unit Apartments | 0 | 0.0% |
| 10 or more Apartments | 0 | 0.0% |
| Mobile Home / Other | 10 | 19.6% |
| Total | 51 | 100.0% |
Housing Structures by Occupancy in Atkinson Mills
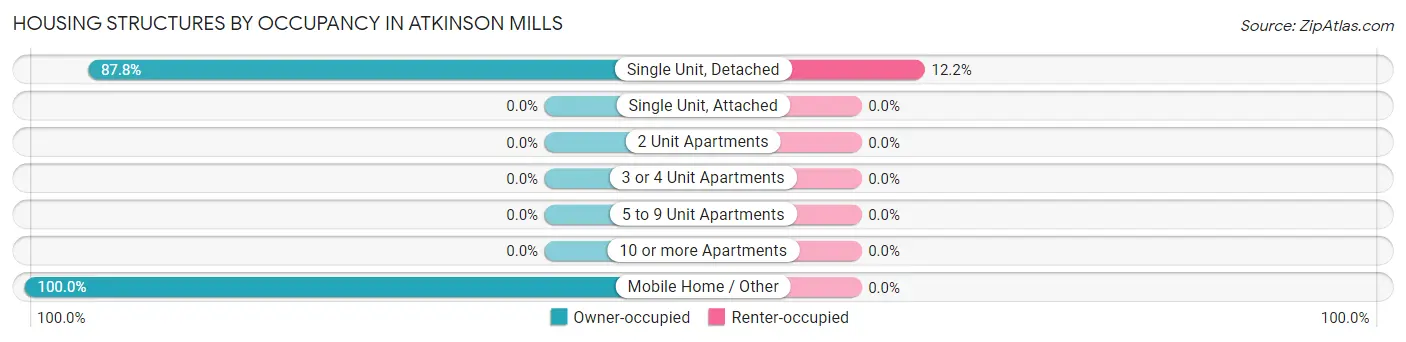
| Structure Type | Owner-occupied | Renter-occupied |
| Single Unit, Detached | 36 (87.8%) | 5 (12.2%) |
| Single Unit, Attached | 0 (0.0%) | 0 (0.0%) |
| 2 Unit Apartments | 0 (0.0%) | 0 (0.0%) |
| 3 or 4 Unit Apartments | 0 (0.0%) | 0 (0.0%) |
| 5 to 9 Unit Apartments | 0 (0.0%) | 0 (0.0%) |
| 10 or more Apartments | 0 (0.0%) | 0 (0.0%) |
| Mobile Home / Other | 10 (100.0%) | 0 (0.0%) |
| Total | 46 (90.2%) | 5 (9.8%) |
Housing Structures by Number of Rooms in Atkinson Mills
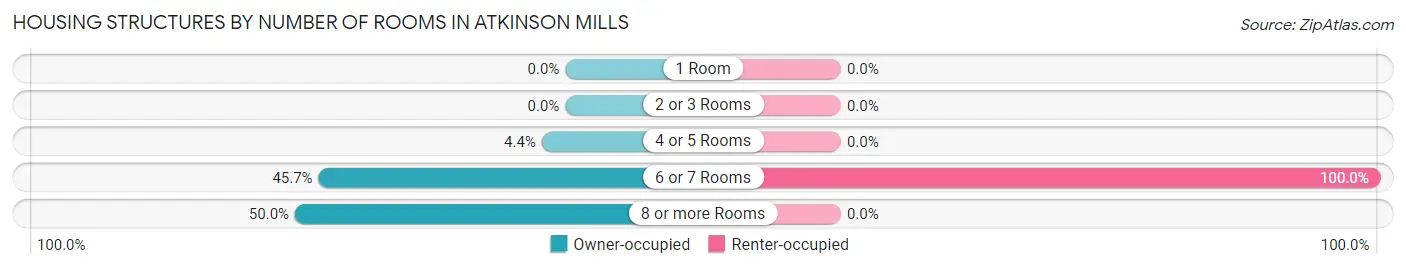
| Number of Rooms | Owner-occupied | Renter-occupied |
| 1 Room | 0 (0.0%) | 0 (0.0%) |
| 2 or 3 Rooms | 0 (0.0%) | 0 (0.0%) |
| 4 or 5 Rooms | 2 (4.3%) | 0 (0.0%) |
| 6 or 7 Rooms | 21 (45.7%) | 5 (100.0%) |
| 8 or more Rooms | 23 (50.0%) | 0 (0.0%) |
| Total | 46 (100.0%) | 5 (100.0%) |
Housing Structure by Heating Type in Atkinson Mills
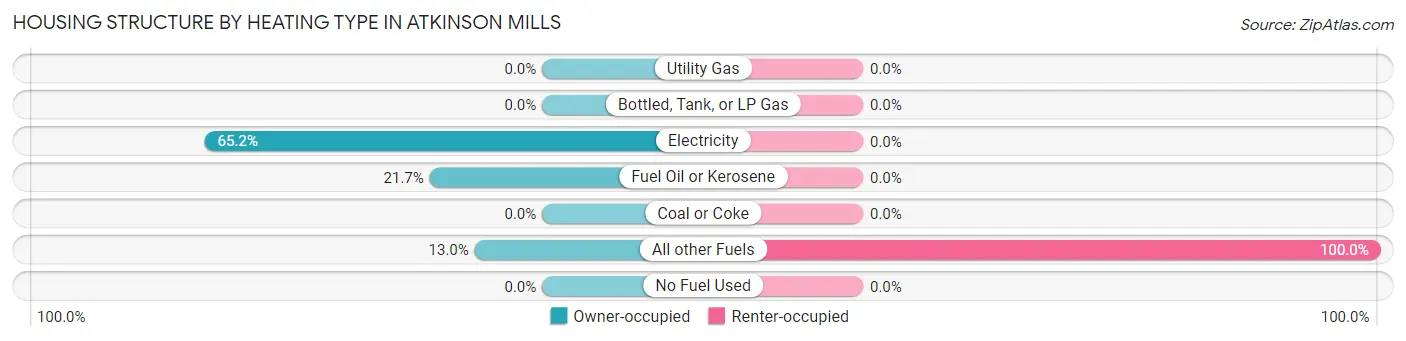
| Heating Type | Owner-occupied | Renter-occupied |
| Utility Gas | 0 (0.0%) | 0 (0.0%) |
| Bottled, Tank, or LP Gas | 0 (0.0%) | 0 (0.0%) |
| Electricity | 30 (65.2%) | 0 (0.0%) |
| Fuel Oil or Kerosene | 10 (21.7%) | 0 (0.0%) |
| Coal or Coke | 0 (0.0%) | 0 (0.0%) |
| All other Fuels | 6 (13.0%) | 5 (100.0%) |
| No Fuel Used | 0 (0.0%) | 0 (0.0%) |
| Total | 46 (100.0%) | 5 (100.0%) |
Household Vehicle Usage in Atkinson Mills
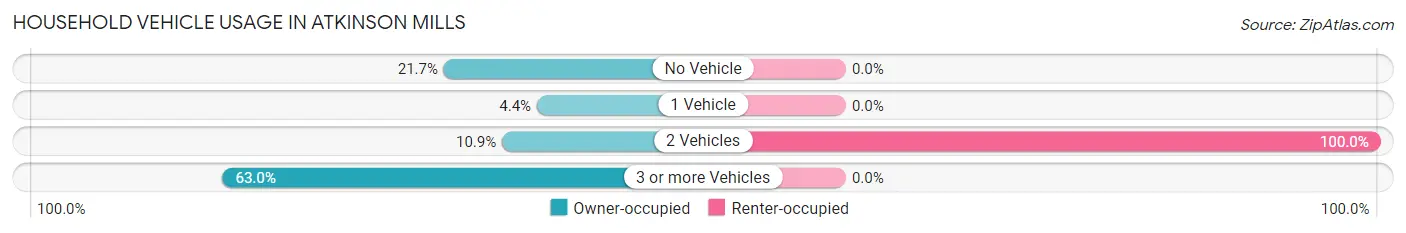
| Vehicles per Household | Owner-occupied | Renter-occupied |
| No Vehicle | 10 (21.7%) | 0 (0.0%) |
| 1 Vehicle | 2 (4.3%) | 0 (0.0%) |
| 2 Vehicles | 5 (10.9%) | 5 (100.0%) |
| 3 or more Vehicles | 29 (63.0%) | 0 (0.0%) |
| Total | 46 (100.0%) | 5 (100.0%) |
Real Estate & Mortgages in Atkinson Mills
Real Estate and Mortgage Overview in Atkinson Mills
| Characteristic | Without Mortgage | With Mortgage |
| Housing Units | 13 | 33 |
| Median Property Value | - | - |
| Median Household Income | - | - |
| Monthly Housing Costs | - | - |
| Real Estate Taxes | - | - |
Property Value by Mortgage Status in Atkinson Mills
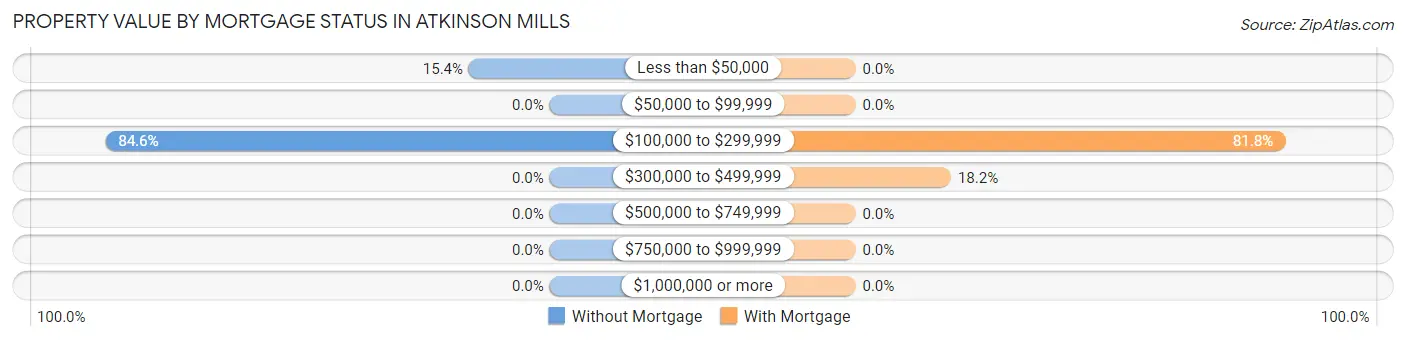
| Property Value | Without Mortgage | With Mortgage |
| Less than $50,000 | 2 (15.4%) | 0 (0.0%) |
| $50,000 to $99,999 | 0 (0.0%) | 0 (0.0%) |
| $100,000 to $299,999 | 11 (84.6%) | 27 (81.8%) |
| $300,000 to $499,999 | 0 (0.0%) | 6 (18.2%) |
| $500,000 to $749,999 | 0 (0.0%) | 0 (0.0%) |
| $750,000 to $999,999 | 0 (0.0%) | 0 (0.0%) |
| $1,000,000 or more | 0 (0.0%) | 0 (0.0%) |
| Total | 13 (100.0%) | 33 (100.0%) |
Household Income by Mortgage Status in Atkinson Mills
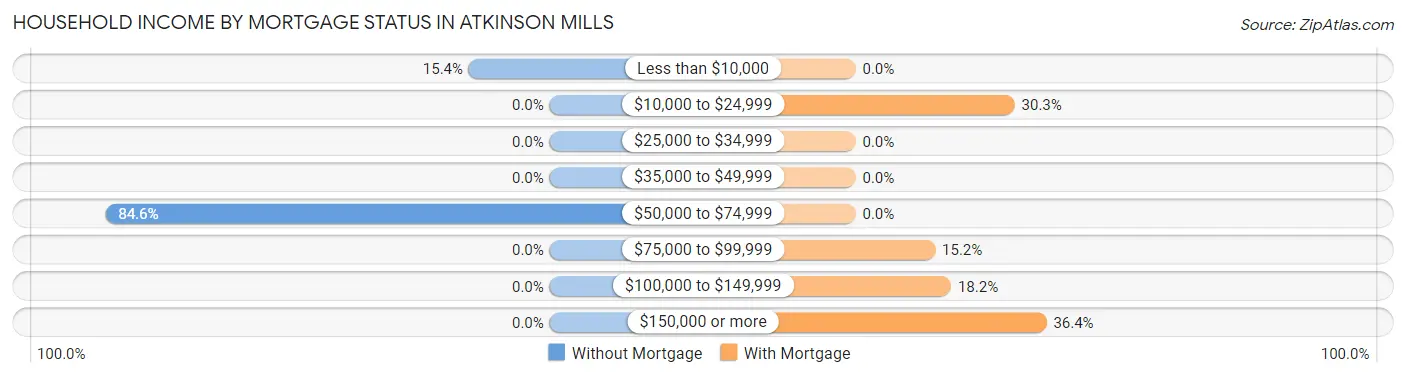
| Household Income | Without Mortgage | With Mortgage |
| Less than $10,000 | 2 (15.4%) | 0 (0.0%) |
| $10,000 to $24,999 | 0 (0.0%) | 10 (30.3%) |
| $25,000 to $34,999 | 0 (0.0%) | 0 (0.0%) |
| $35,000 to $49,999 | 0 (0.0%) | 0 (0.0%) |
| $50,000 to $74,999 | 11 (84.6%) | 0 (0.0%) |
| $75,000 to $99,999 | 0 (0.0%) | 5 (15.1%) |
| $100,000 to $149,999 | 0 (0.0%) | 6 (18.2%) |
| $150,000 or more | 0 (0.0%) | 12 (36.4%) |
| Total | 13 (100.0%) | 33 (100.0%) |
Property Value to Household Income Ratio in Atkinson Mills
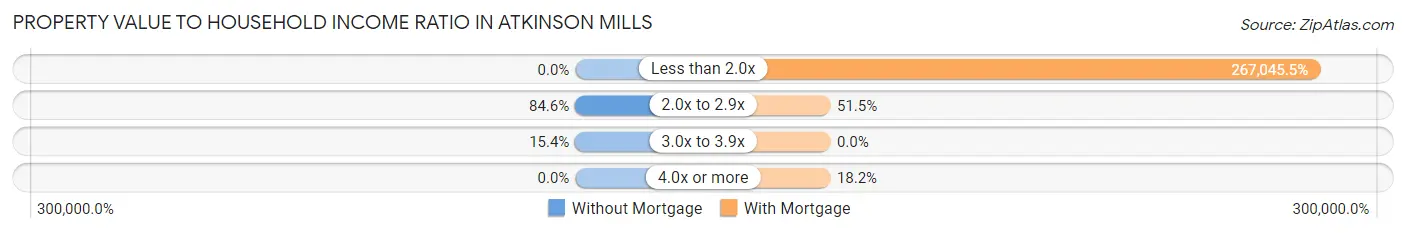
| Value-to-Income Ratio | Without Mortgage | With Mortgage |
| Less than 2.0x | 0 (0.0%) | 88,125 (267,045.4%) |
| 2.0x to 2.9x | 11 (84.6%) | 17 (51.5%) |
| 3.0x to 3.9x | 2 (15.4%) | 0 (0.0%) |
| 4.0x or more | 0 (0.0%) | 6 (18.2%) |
| Total | 13 (100.0%) | 33 (100.0%) |
Real Estate Taxes by Mortgage Status in Atkinson Mills
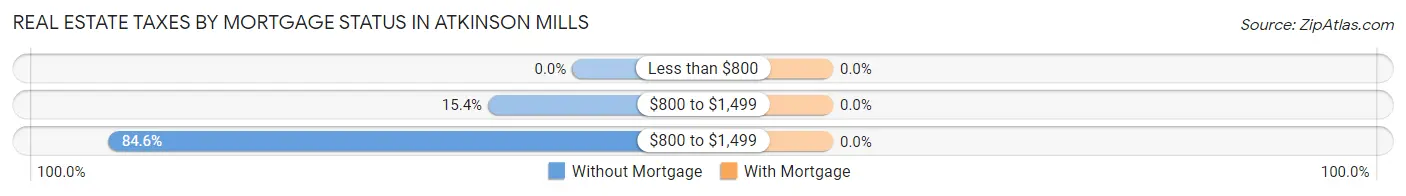
| Property Taxes | Without Mortgage | With Mortgage |
| Less than $800 | 0 (0.0%) | 0 (0.0%) |
| $800 to $1,499 | 2 (15.4%) | 0 (0.0%) |
| $800 to $1,499 | 11 (84.6%) | 0 (0.0%) |
| Total | 13 (100.0%) | 33 (100.0%) |
Health & Disability in Atkinson Mills
Health Insurance Coverage by Age in Atkinson Mills
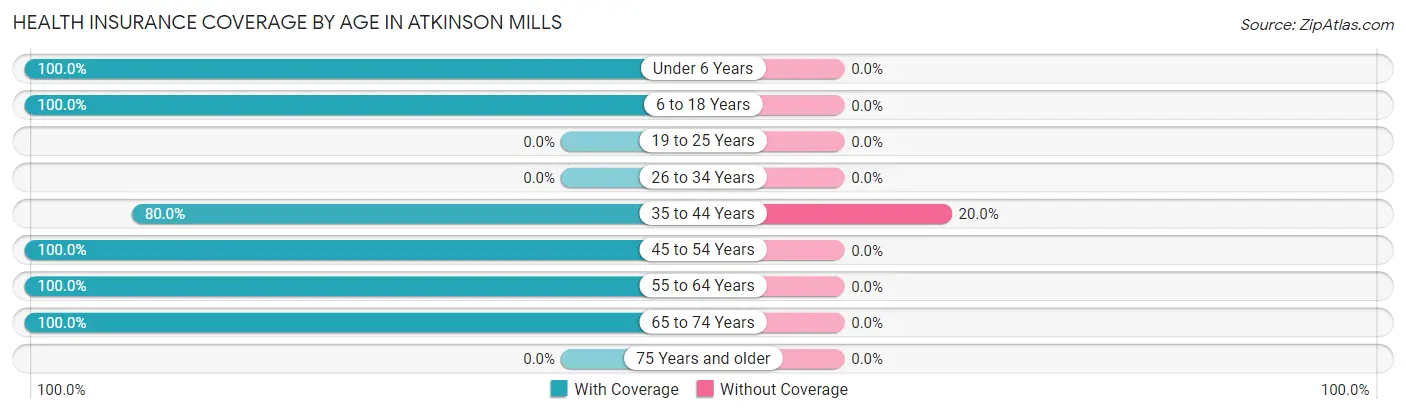
| Age Bracket | With Coverage | Without Coverage |
| Under 6 Years | 13 (100.0%) | 0 (0.0%) |
| 6 to 18 Years | 15 (100.0%) | 0 (0.0%) |
| 19 to 25 Years | 0 (0.0%) | 0 (0.0%) |
| 26 to 34 Years | 0 (0.0%) | 0 (0.0%) |
| 35 to 44 Years | 16 (80.0%) | 4 (20.0%) |
| 45 to 54 Years | 10 (100.0%) | 0 (0.0%) |
| 55 to 64 Years | 61 (100.0%) | 0 (0.0%) |
| 65 to 74 Years | 2 (100.0%) | 0 (0.0%) |
| 75 Years and older | 0 (0.0%) | 0 (0.0%) |
| Total | 117 (96.7%) | 4 (3.3%) |
Health Insurance Coverage by Citizenship Status in Atkinson Mills
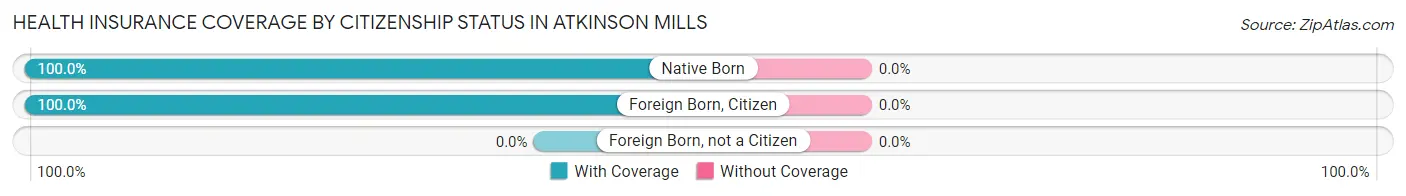
| Citizenship Status | With Coverage | Without Coverage |
| Native Born | 13 (100.0%) | 0 (0.0%) |
| Foreign Born, Citizen | 15 (100.0%) | 0 (0.0%) |
| Foreign Born, not a Citizen | 0 (0.0%) | 0 (0.0%) |
Health Insurance Coverage by Household Income in Atkinson Mills
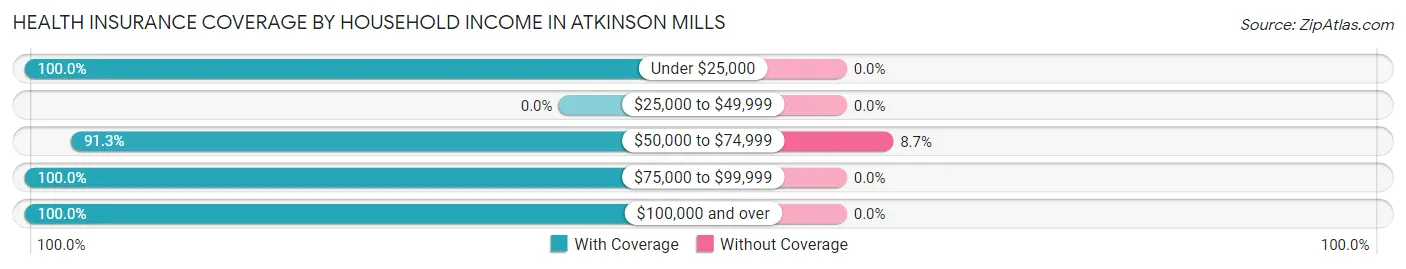
| Household Income | With Coverage | Without Coverage |
| Under $25,000 | 12 (100.0%) | 0 (0.0%) |
| $25,000 to $49,999 | 0 (0.0%) | 0 (0.0%) |
| $50,000 to $74,999 | 42 (91.3%) | 4 (8.7%) |
| $75,000 to $99,999 | 40 (100.0%) | 0 (0.0%) |
| $100,000 and over | 23 (100.0%) | 0 (0.0%) |
Public vs Private Health Insurance Coverage by Age in Atkinson Mills
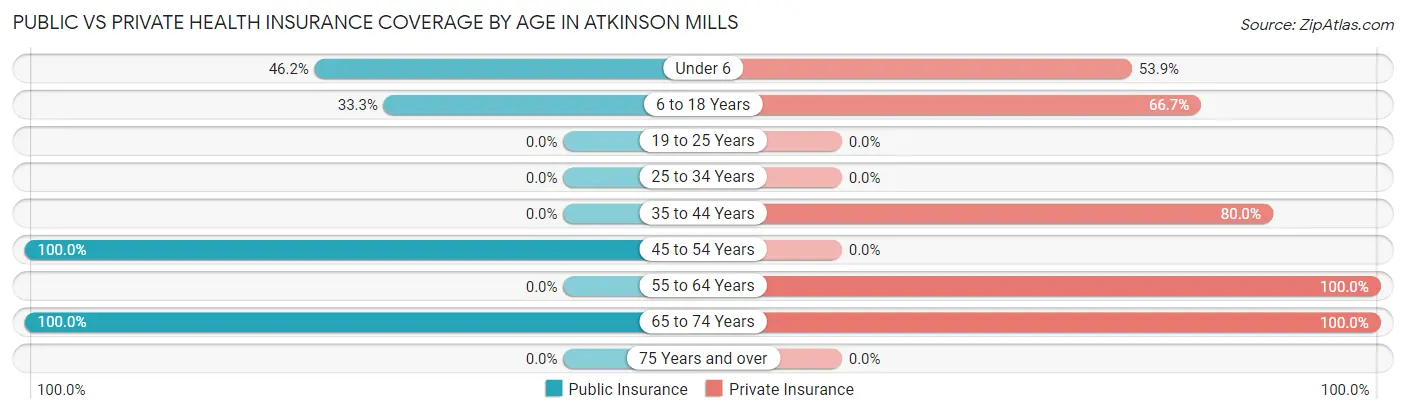
| Age Bracket | Public Insurance | Private Insurance |
| Under 6 | 6 (46.2%) | 7 (53.8%) |
| 6 to 18 Years | 5 (33.3%) | 10 (66.7%) |
| 19 to 25 Years | 0 (0.0%) | 0 (0.0%) |
| 25 to 34 Years | 0 (0.0%) | 0 (0.0%) |
| 35 to 44 Years | 0 (0.0%) | 16 (80.0%) |
| 45 to 54 Years | 10 (100.0%) | 0 (0.0%) |
| 55 to 64 Years | 0 (0.0%) | 61 (100.0%) |
| 65 to 74 Years | 2 (100.0%) | 2 (100.0%) |
| 75 Years and over | 0 (0.0%) | 0 (0.0%) |
| Total | 23 (19.0%) | 96 (79.3%) |
Disability Status by Sex by Age in Atkinson Mills
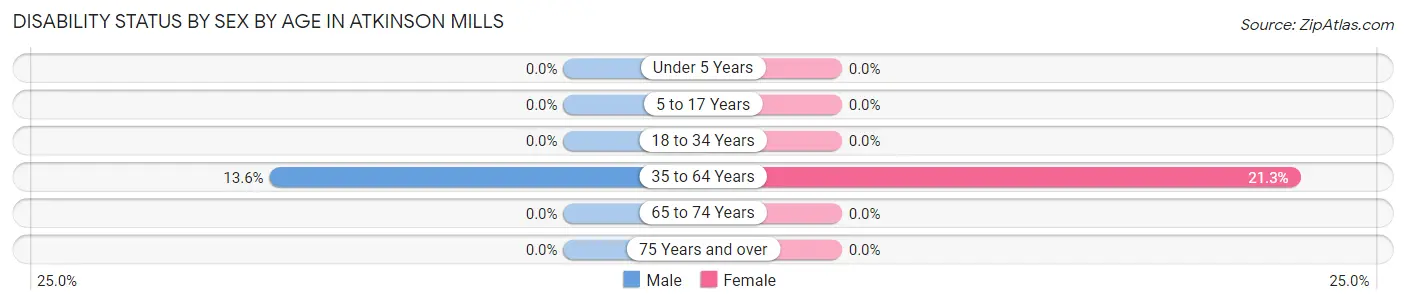
| Age Bracket | Male | Female |
| Under 5 Years | 0 (0.0%) | 0 (0.0%) |
| 5 to 17 Years | 0 (0.0%) | 0 (0.0%) |
| 18 to 34 Years | 0 (0.0%) | 0 (0.0%) |
| 35 to 64 Years | 6 (13.6%) | 10 (21.3%) |
| 65 to 74 Years | 0 (0.0%) | 0 (0.0%) |
| 75 Years and over | 0 (0.0%) | 0 (0.0%) |
Disability Class by Sex by Age in Atkinson Mills
Disability Class: Hearing Difficulty
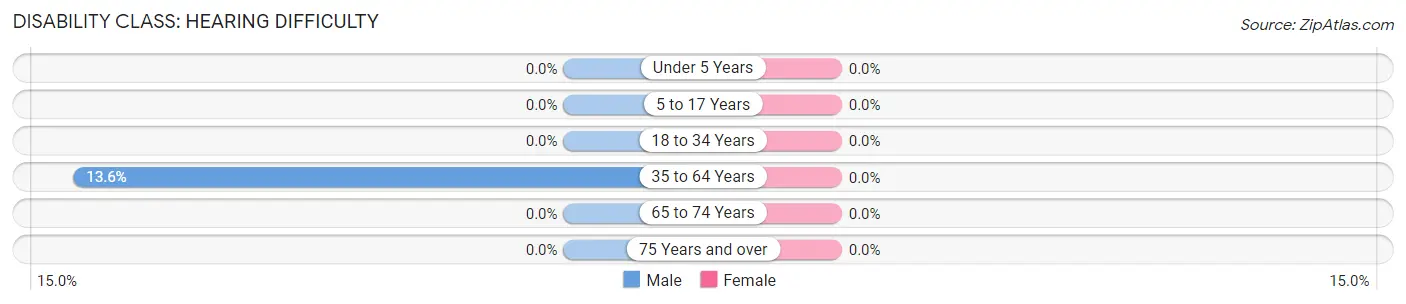
| Age Bracket | Male | Female |
| Under 5 Years | 0 (0.0%) | 0 (0.0%) |
| 5 to 17 Years | 0 (0.0%) | 0 (0.0%) |
| 18 to 34 Years | 0 (0.0%) | 0 (0.0%) |
| 35 to 64 Years | 6 (13.6%) | 0 (0.0%) |
| 65 to 74 Years | 0 (0.0%) | 0 (0.0%) |
| 75 Years and over | 0 (0.0%) | 0 (0.0%) |
Disability Class: Vision Difficulty
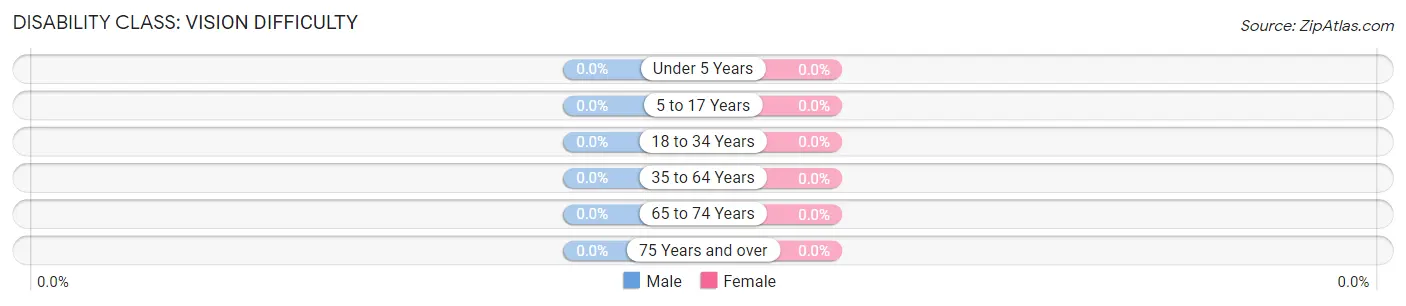
| Age Bracket | Male | Female |
| Under 5 Years | 0 (0.0%) | 0 (0.0%) |
| 5 to 17 Years | 0 (0.0%) | 0 (0.0%) |
| 18 to 34 Years | 0 (0.0%) | 0 (0.0%) |
| 35 to 64 Years | 0 (0.0%) | 0 (0.0%) |
| 65 to 74 Years | 0 (0.0%) | 0 (0.0%) |
| 75 Years and over | 0 (0.0%) | 0 (0.0%) |
Disability Class: Cognitive Difficulty
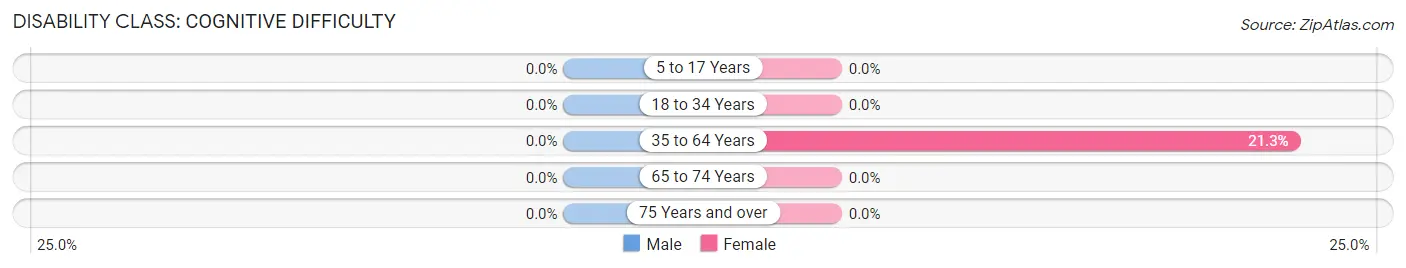
| Age Bracket | Male | Female |
| 5 to 17 Years | 0 (0.0%) | 0 (0.0%) |
| 18 to 34 Years | 0 (0.0%) | 0 (0.0%) |
| 35 to 64 Years | 0 (0.0%) | 10 (21.3%) |
| 65 to 74 Years | 0 (0.0%) | 0 (0.0%) |
| 75 Years and over | 0 (0.0%) | 0 (0.0%) |
Disability Class: Ambulatory Difficulty
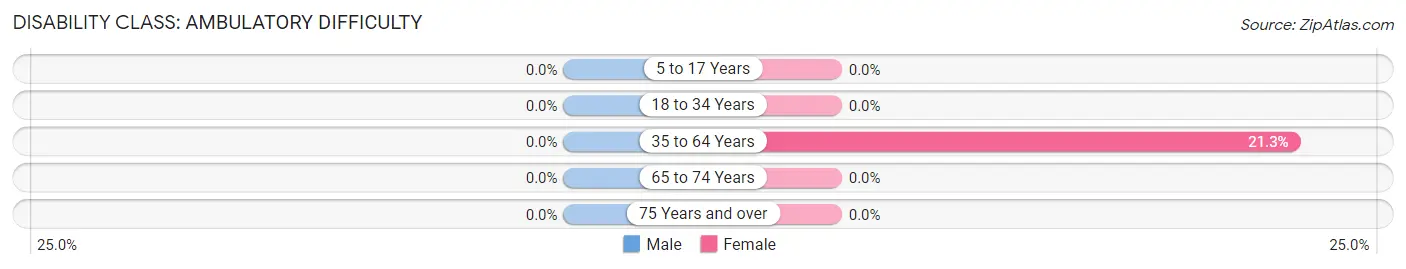
| Age Bracket | Male | Female |
| 5 to 17 Years | 0 (0.0%) | 0 (0.0%) |
| 18 to 34 Years | 0 (0.0%) | 0 (0.0%) |
| 35 to 64 Years | 0 (0.0%) | 10 (21.3%) |
| 65 to 74 Years | 0 (0.0%) | 0 (0.0%) |
| 75 Years and over | 0 (0.0%) | 0 (0.0%) |
Disability Class: Self-Care Difficulty

| Age Bracket | Male | Female |
| 5 to 17 Years | 0 (0.0%) | 0 (0.0%) |
| 18 to 34 Years | 0 (0.0%) | 0 (0.0%) |
| 35 to 64 Years | 0 (0.0%) | 10 (21.3%) |
| 65 to 74 Years | 0 (0.0%) | 0 (0.0%) |
| 75 Years and over | 0 (0.0%) | 0 (0.0%) |
Technology Access in Atkinson Mills
Computing Device Access in Atkinson Mills
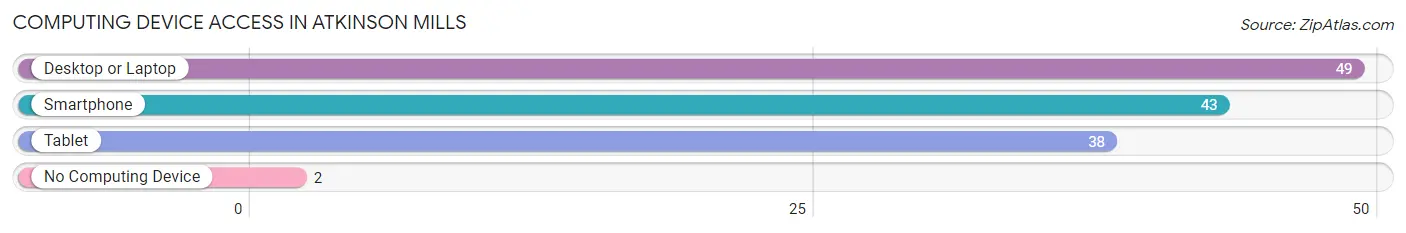
| Device Type | # Households | % Households |
| Desktop or Laptop | 49 | 96.1% |
| Smartphone | 43 | 84.3% |
| Tablet | 38 | 74.5% |
| No Computing Device | 2 | 3.9% |
| Total | 51 | 100.0% |
Internet Access in Atkinson Mills
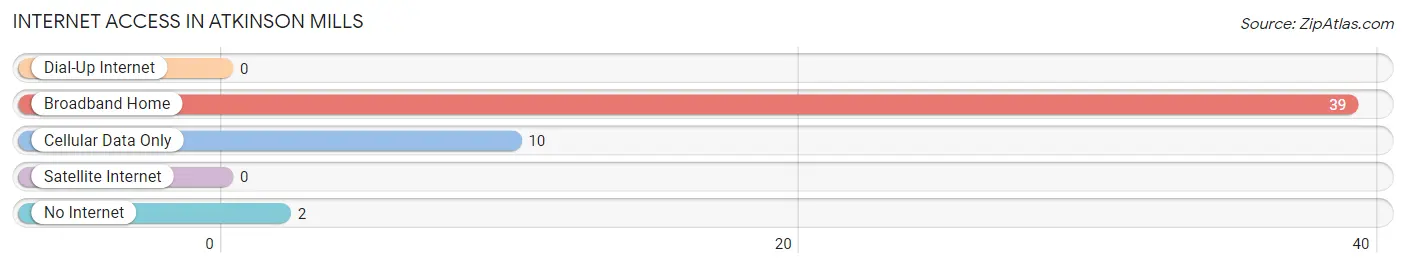
| Internet Type | # Households | % Households |
| Dial-Up Internet | 0 | 0.0% |
| Broadband Home | 39 | 76.5% |
| Cellular Data Only | 10 | 19.6% |
| Satellite Internet | 0 | 0.0% |
| No Internet | 2 | 3.9% |
| Total | 51 | 100.0% |
Atkinson Mills Summary
Atkinson Mills is an unincorporated community located in the western part of Lancaster County, Pennsylvania. It is situated in the rolling hills of the Pennsylvania Dutch Country, and is surrounded by farmland and small towns. The community is located along the Conestoga River, and is home to a variety of businesses, including a sawmill, a general store, and a post office.
History
Atkinson Mills was founded in the late 1700s by a man named John Atkinson. He purchased a large tract of land in the area and built a sawmill, which became the center of the community. The sawmill was used to produce lumber for the local area, and the community grew around it. The sawmill was eventually replaced by a gristmill, which was used to grind grain for the local farmers.
The community was named after John Atkinson, and the name has remained the same since its founding. The community was originally part of Lancaster County, but in 1813 it was annexed to Berks County. In 1844, it was annexed back to Lancaster County.
Geography
Atkinson Mills is located in the western part of Lancaster County, Pennsylvania. It is situated in the rolling hills of the Pennsylvania Dutch Country, and is surrounded by farmland and small towns. The community is located along the Conestoga River, and is home to a variety of businesses, including a sawmill, a general store, and a post office.
The climate in Atkinson Mills is typical of the region, with hot summers and cold winters. The average temperature in the summer is around 75 degrees Fahrenheit, and the average temperature in the winter is around 30 degrees Fahrenheit. The area receives an average of 40 inches of precipitation per year.
Economy
Atkinson Mills is a small, rural community with a limited economy. The primary industry in the area is agriculture, with many of the local farmers growing corn, soybeans, and hay. There is also a sawmill in the area, which produces lumber for the local area. The community also has a general store, which sells a variety of goods, including groceries, hardware, and clothing.
Demographics
Atkinson Mills is a small, rural community with a population of approximately 500 people. The population is primarily white, with a small percentage of African Americans and Hispanics. The median household income in the area is around $50,000, and the median home value is around $150,000. The area is served by the Conestoga Valley School District.
Common Questions
What is the Total Population of Atkinson Mills?
Total Population of Atkinson Mills is 126.
What is the Total Male Population of Atkinson Mills?
Total Male Population of Atkinson Mills is 77.
What is the Total Female Population of Atkinson Mills?
Total Female Population of Atkinson Mills is 49.
What is the Ratio of Males per 100 Females in Atkinson Mills?
There are 157.14 Males per 100 Females in Atkinson Mills.
What is the Ratio of Females per 100 Males in Atkinson Mills?
There are 63.64 Females per 100 Males in Atkinson Mills.
What is the Median Population Age in Atkinson Mills?
Median Population Age in Atkinson Mills is 55.5 Years.
What is the Average Family Size in Atkinson Mills
Average Family Size in Atkinson Mills is 2.9 People.
What is the Average Household Size in Atkinson Mills
Average Household Size in Atkinson Mills is 2.5 People.
What is Per Capita Income in Atkinson Mills?
Per Capita income in Atkinson Mills is $27,676.
What is the Median Family Income in Atkinson Mills?
Median Family Income in Atkinson Mills is $86,750.
What is the Median Household income in Atkinson Mills?
Median Household Income in Atkinson Mills is $71,250.
What is Inequality or Gini Index in Atkinson Mills?
Inequality or Gini Index in Atkinson Mills is 0.29.
How Large is the Labor Force in Atkinson Mills?
There are 80 People in the Labor Forcein in Atkinson Mills.
What is the Percentage of People in the Labor Force in Atkinson Mills?
81.6% of People are in the Labor Force in Atkinson Mills.
What is the Unemployment Rate in Atkinson Mills?
Unemployment Rate in Atkinson Mills is 5.3%.