Ellsworth borough, PA
Ellsworth borough Overview
623
TOTAL POPULATION
322
MALE POPULATION
301
FEMALE POPULATION
106.98
MALES / 100 FEMALES
93.48
FEMALES / 100 MALES
46.3
MEDIAN AGE
2.8
AVG FAMILY SIZE
2.2
AVG HOUSEHOLD SIZE
$34,177
PER CAPITA INCOME
$59,191
AVG FAMILY INCOME
$57,794
AVG HOUSEHOLD INCOME
49.8%
WAGE / INCOME GAP [ % ]
50.2¢/ $1
WAGE / INCOME GAP [ $ ]
0.41
INEQUALITY / GINI INDEX
326
LABOR FORCE [ PEOPLE ]
61.3%
PERCENT IN LABOR FORCE
13.2%
UNEMPLOYMENT RATE
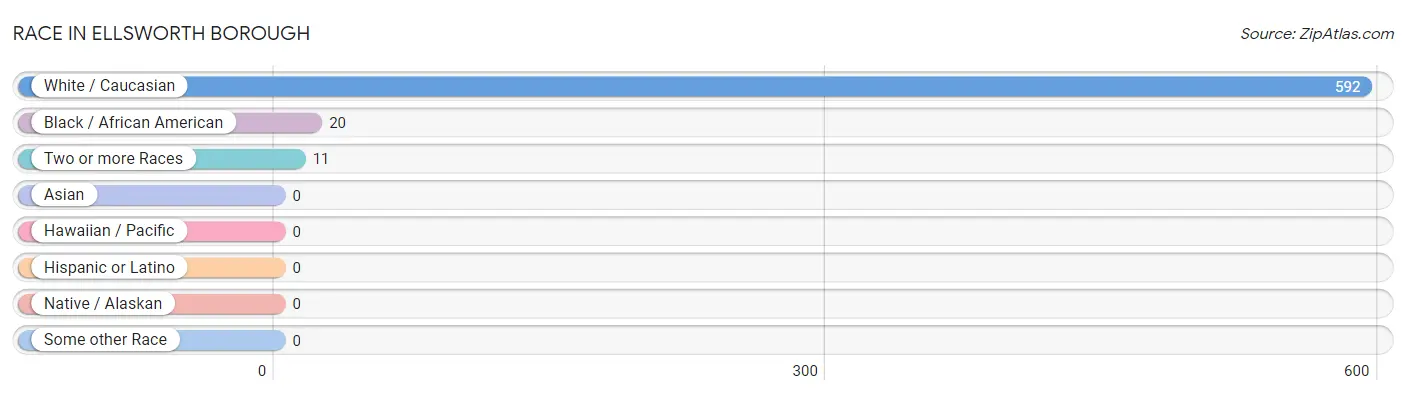
Race in Ellsworth borough
The most populous races in Ellsworth borough are White / Caucasian (592 | 95.0%), Black / African American (20 | 3.2%), and Two or more Races (11 | 1.8%).
| Race | # Population | % Population |
| Asian | 0 | 0.0% |
| Black / African American | 20 | 3.2% |
| Hawaiian / Pacific | 0 | 0.0% |
| Hispanic or Latino | 0 | 0.0% |
| Native / Alaskan | 0 | 0.0% |
| White / Caucasian | 592 | 95.0% |
| Two or more Races | 11 | 1.8% |
| Some other Race | 0 | 0.0% |
| Total | 623 | 100.0% |
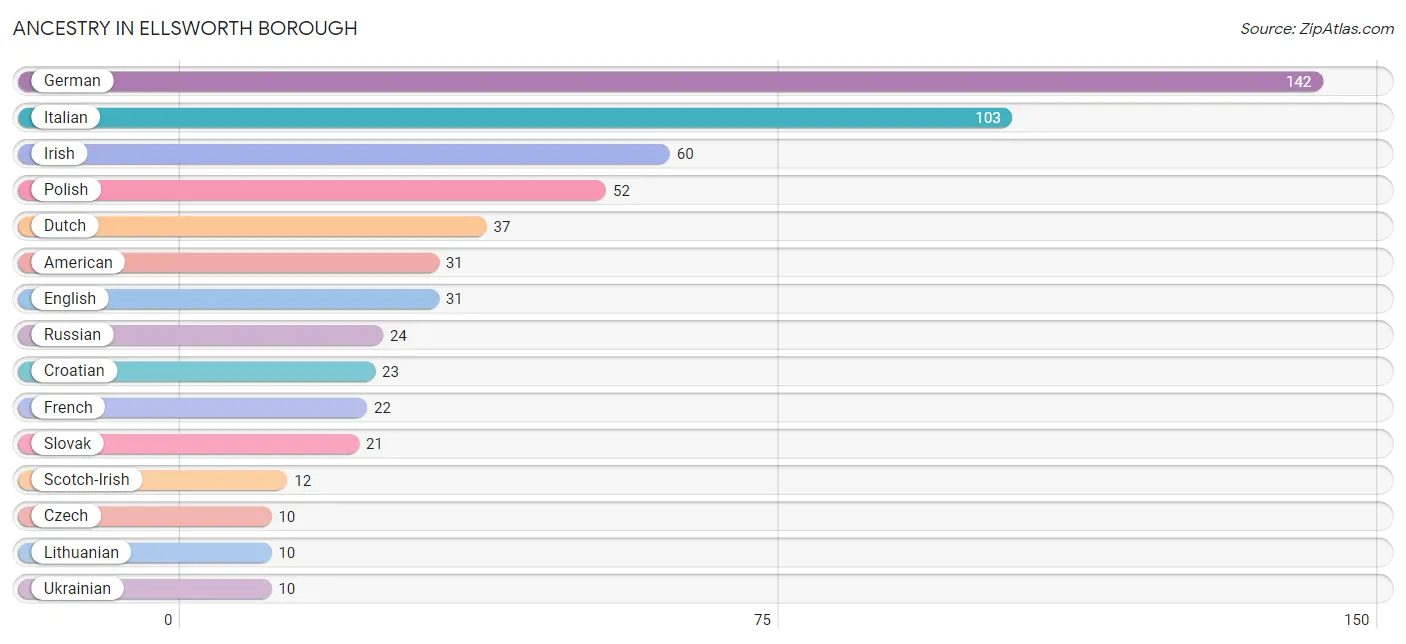
Ancestry in Ellsworth borough
The most populous ancestries reported in Ellsworth borough are German (142 | 22.8%), Italian (103 | 16.5%), Irish (60 | 9.6%), Polish (52 | 8.4%), and Dutch (37 | 5.9%), together accounting for 63.2% of all Ellsworth borough residents.
| Ancestry | # Population | % Population |
| American | 31 | 5.0% |
| Cherokee | 2 | 0.3% |
| Croatian | 23 | 3.7% |
| Czech | 10 | 1.6% |
| Dutch | 37 | 5.9% |
| English | 31 | 5.0% |
| French | 22 | 3.5% |
| German | 142 | 22.8% |
| Irish | 60 | 9.6% |
| Italian | 103 | 16.5% |
| Lithuanian | 10 | 1.6% |
| Polish | 52 | 8.4% |
| Russian | 24 | 3.8% |
| Scotch-Irish | 12 | 1.9% |
| Slovak | 21 | 3.4% |
| Ukrainian | 10 | 1.6% | View All 16 Rows |
Immigrants in Ellsworth borough

| Immigration Origin | # Population | % Population | View All 0 Rows |
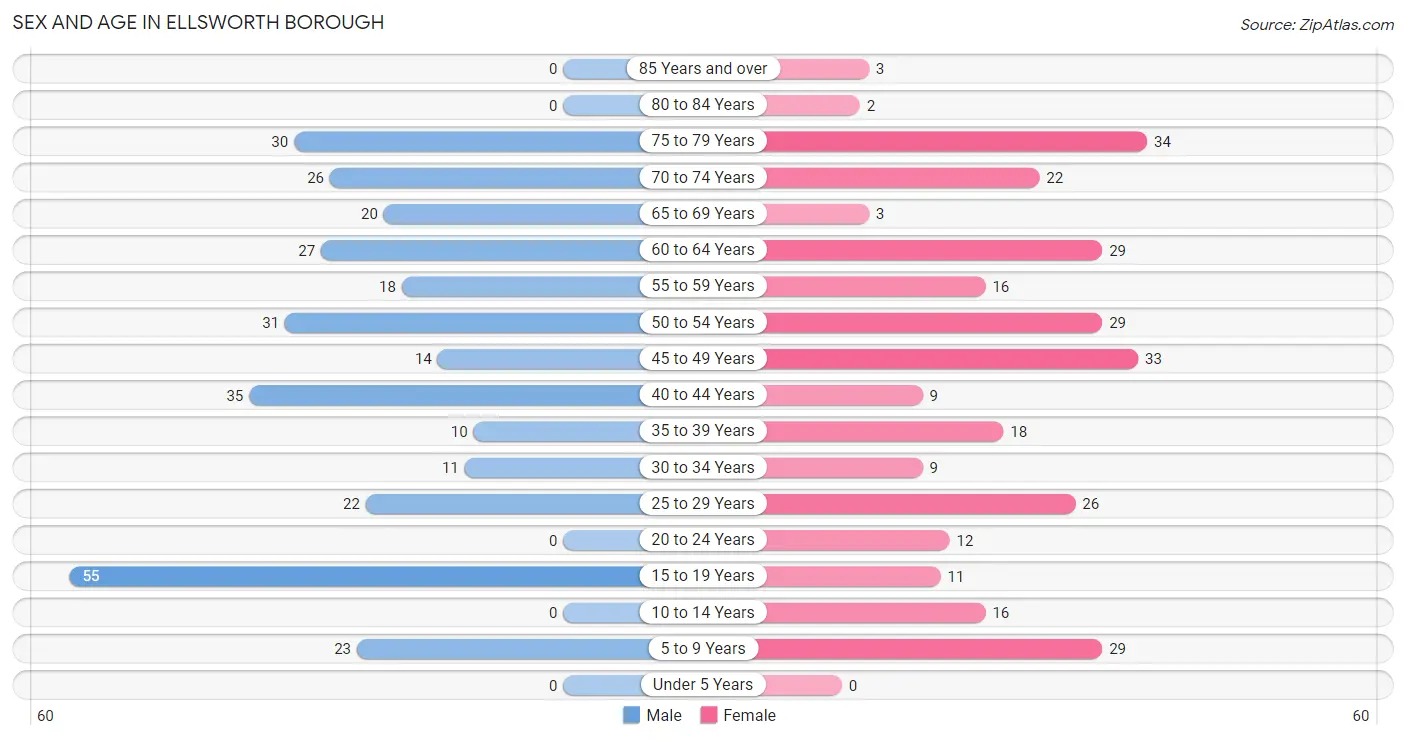
Sex and Age in Ellsworth borough
Sex and Age in Ellsworth borough
The most populous age groups in Ellsworth borough are 15 to 19 Years (55 | 17.1%) for men and 75 to 79 Years (34 | 11.3%) for women.
| Age Bracket | Male | Female |
| Under 5 Years | 0 (0.0%) | 0 (0.0%) |
| 5 to 9 Years | 23 (7.1%) | 29 (9.6%) |
| 10 to 14 Years | 0 (0.0%) | 16 (5.3%) |
| 15 to 19 Years | 55 (17.1%) | 11 (3.6%) |
| 20 to 24 Years | 0 (0.0%) | 12 (4.0%) |
| 25 to 29 Years | 22 (6.8%) | 26 (8.6%) |
| 30 to 34 Years | 11 (3.4%) | 9 (3.0%) |
| 35 to 39 Years | 10 (3.1%) | 18 (6.0%) |
| 40 to 44 Years | 35 (10.9%) | 9 (3.0%) |
| 45 to 49 Years | 14 (4.3%) | 33 (11.0%) |
| 50 to 54 Years | 31 (9.6%) | 29 (9.6%) |
| 55 to 59 Years | 18 (5.6%) | 16 (5.3%) |
| 60 to 64 Years | 27 (8.4%) | 29 (9.6%) |
| 65 to 69 Years | 20 (6.2%) | 3 (1.0%) |
| 70 to 74 Years | 26 (8.1%) | 22 (7.3%) |
| 75 to 79 Years | 30 (9.3%) | 34 (11.3%) |
| 80 to 84 Years | 0 (0.0%) | 2 (0.7%) |
| 85 Years and over | 0 (0.0%) | 3 (1.0%) |
| Total | 322 (100.0%) | 301 (100.0%) |
Families and Households in Ellsworth borough
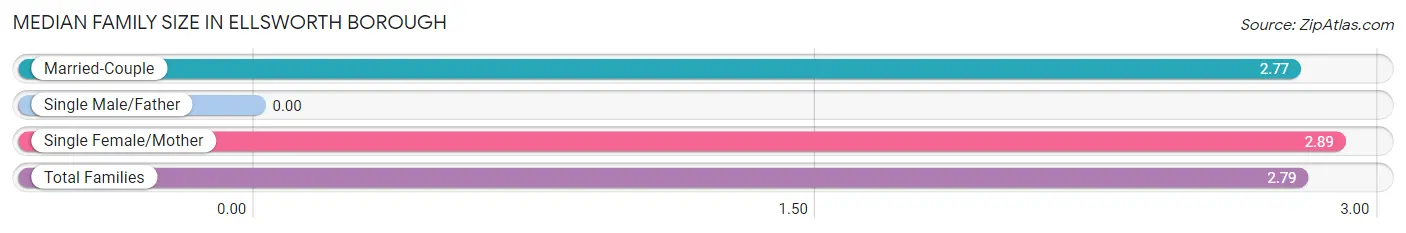
Median Family Size in Ellsworth borough
| Family Type | # Families | Family Size |
| Married-Couple | 134 (79.3%) | 2.77 |
| Single Male/Father | 0 (0.0%) | - |
| Single Female/Mother | 35 (20.7%) | 2.89 |
| Total Families | 169 (100.0%) | 2.79 |
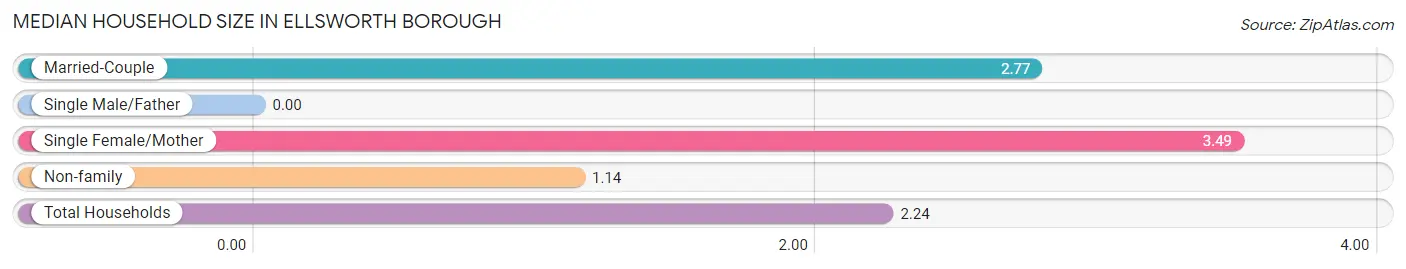
Median Household Size in Ellsworth borough
| Household Type | # Households | Household Size |
| Married-Couple | 134 (48.9%) | 2.77 |
| Single Male/Father | 0 (0.0%) | - |
| Single Female/Mother | 35 (12.8%) | 3.49 |
| Non-family | 105 (38.3%) | 1.14 |
| Total Households | 274 (100.0%) | 2.24 |
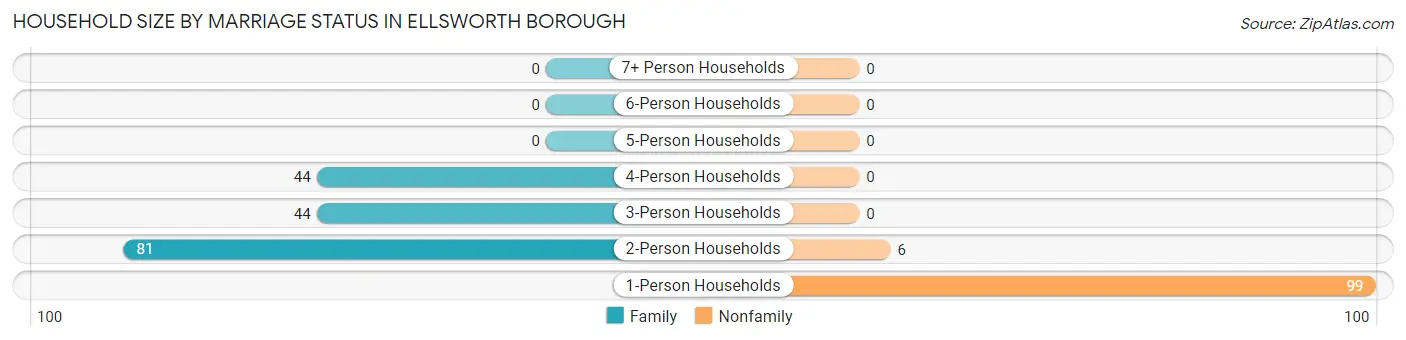
Household Size by Marriage Status in Ellsworth borough
Out of a total of 274 households in Ellsworth borough, 169 (61.7%) are family households, while 105 (38.3%) are nonfamily households. The most numerous type of family households are 2-person households, comprising 81, and the most common type of nonfamily households are 1-person households, comprising 99.
| Household Size | Family Households | Nonfamily Households |
| 1-Person Households | - | 99 (36.1%) |
| 2-Person Households | 81 (29.6%) | 6 (2.2%) |
| 3-Person Households | 44 (16.1%) | 0 (0.0%) |
| 4-Person Households | 44 (16.1%) | 0 (0.0%) |
| 5-Person Households | 0 (0.0%) | 0 (0.0%) |
| 6-Person Households | 0 (0.0%) | 0 (0.0%) |
| 7+ Person Households | 0 (0.0%) | 0 (0.0%) |
| Total | 169 (61.7%) | 105 (38.3%) |
Female Fertility in Ellsworth borough
Fertility by Age in Ellsworth borough
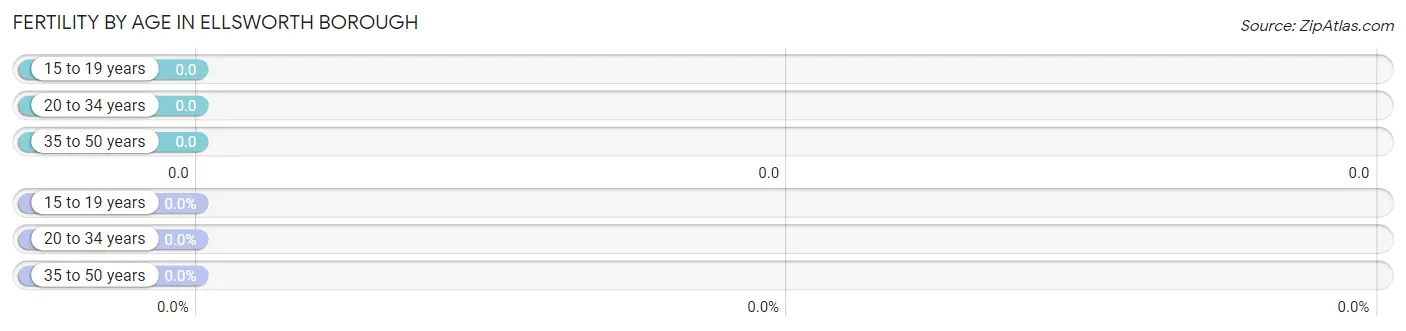
| Age Bracket | Women with Births | Births / 1,000 Women |
| 15 to 19 years | 0 (0.0%) | 0.0 |
| 20 to 34 years | 0 (0.0%) | 0.0 |
| 35 to 50 years | 0 (0.0%) | 0.0 |
| Total | 0 (0.0%) | 0.0 |
Fertility by Age by Marriage Status in Ellsworth borough
| Age Bracket | Married | Unmarried |
| 15 to 19 years | 0 (0.0%) | 0 (0.0%) |
| 20 to 34 years | 0 (0.0%) | 0 (0.0%) |
| 35 to 50 years | 0 (0.0%) | 0 (0.0%) |
| Total | 0 (0.0%) | 0 (0.0%) |
Fertility by Education in Ellsworth borough
| Educational Attainment | Women with Births | Births / 1,000 Women |
| Less than High School | 0 (0.0%) | 0.0 |
| High School Diploma | 0 (0.0%) | 0.0 |
| College or Associate's Degree | 0 (0.0%) | 0.0 |
| Bachelor's Degree | 0 (0.0%) | 0.0 |
| Graduate Degree | 0 (0.0%) | 0.0 |
| Total | 0 (0.0%) | 0.0 |
Fertility by Education by Marriage Status in Ellsworth borough
| Educational Attainment | Married | Unmarried |
| Less than High School | 0 (0.0%) | 0 (0.0%) |
| High School Diploma | 0 (0.0%) | 0 (0.0%) |
| College or Associate's Degree | 0 (0.0%) | 0 (0.0%) |
| Bachelor's Degree | 0 (0.0%) | 0 (0.0%) |
| Graduate Degree | 0 (0.0%) | 0 (0.0%) |
| Total | 0 (0.0%) | 0 (0.0%) |
Income in Ellsworth borough
Income Overview in Ellsworth borough
Per Capita Income in Ellsworth borough is $34,177, while median incomes of families and households are $59,191 and $57,794 respectively.
| Characteristic | Number | Measure |
| Per Capita Income | 623 | $34,177 |
| Median Family Income | 169 | $59,191 |
| Mean Family Income | 169 | $85,822 |
| Median Household Income | 274 | $57,794 |
| Mean Household Income | 274 | $75,955 |
| Income Deficit | 169 | $0 |
| Wage / Income Gap (%) | 623 | 49.78% |
| Wage / Income Gap ($) | 623 | 50.22¢ per $1 |
| Gini / Inequality Index | 623 | 0.41 |
Earnings by Sex in Ellsworth borough
Average Earnings in Ellsworth borough are $27,500, $38,333 for men and $19,250 for women, a difference of 49.8%.
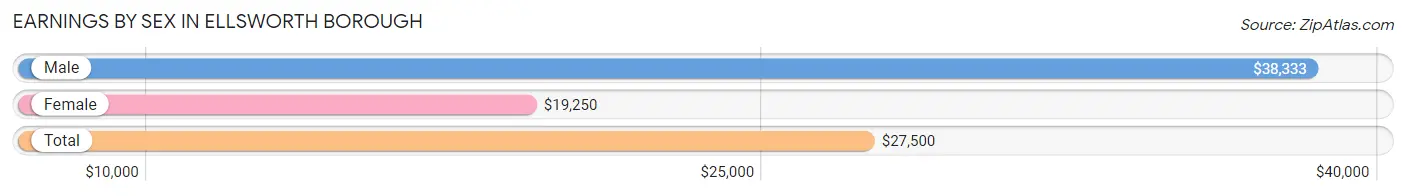
| Sex | Number | Average Earnings |
| Male | 172 (52.8%) | $38,333 |
| Female | 154 (47.2%) | $19,250 |
| Total | 326 (100.0%) | $27,500 |
Earnings by Sex by Income Bracket in Ellsworth borough
The most common earnings brackets in Ellsworth borough are $100,000+ for men (39 | 22.7%) and $17,500 to $19,999 for women (20 | 13.0%).
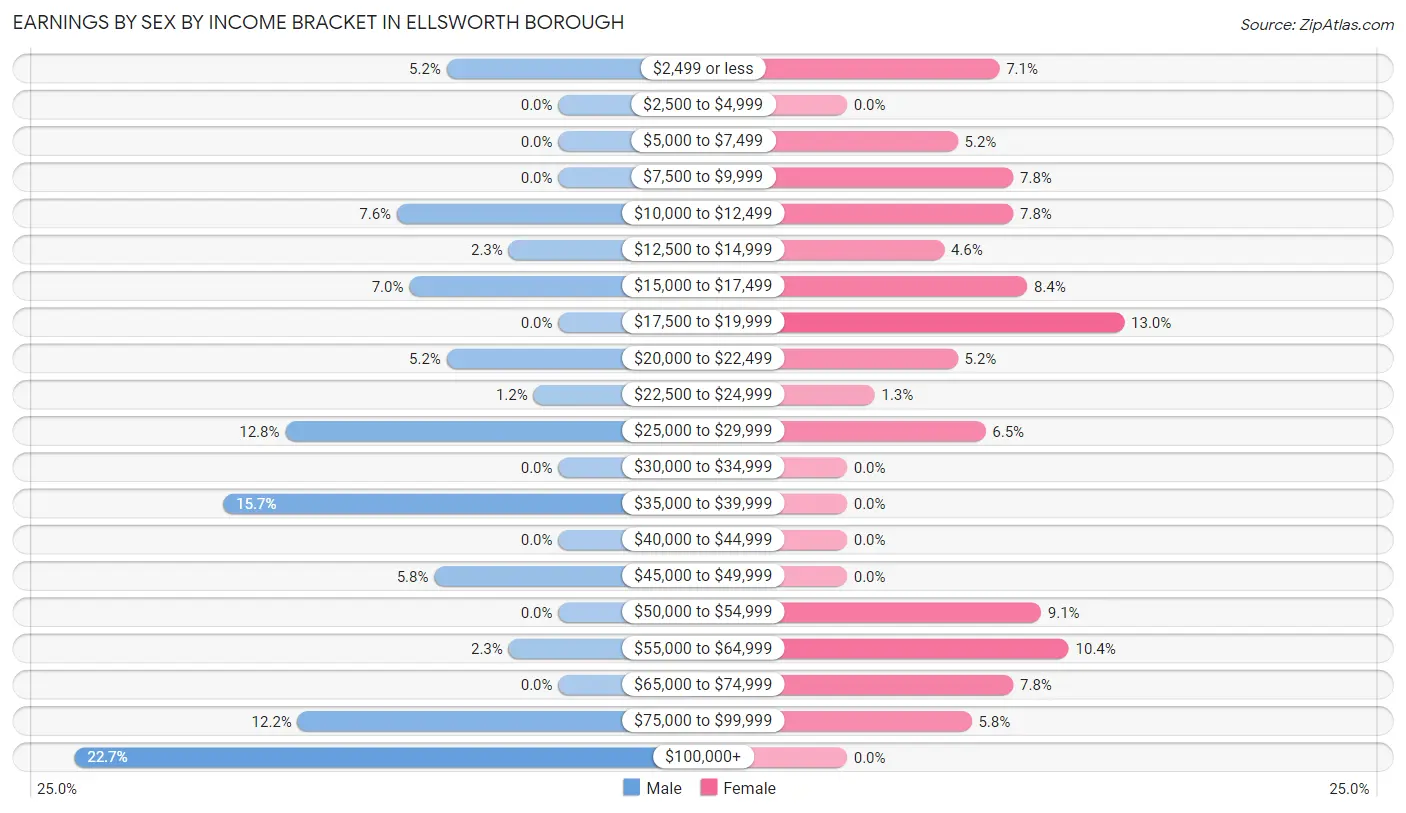
| Income | Male | Female |
| $2,499 or less | 9 (5.2%) | 11 (7.1%) |
| $2,500 to $4,999 | 0 (0.0%) | 0 (0.0%) |
| $5,000 to $7,499 | 0 (0.0%) | 8 (5.2%) |
| $7,500 to $9,999 | 0 (0.0%) | 12 (7.8%) |
| $10,000 to $12,499 | 13 (7.6%) | 12 (7.8%) |
| $12,500 to $14,999 | 4 (2.3%) | 7 (4.5%) |
| $15,000 to $17,499 | 12 (7.0%) | 13 (8.4%) |
| $17,500 to $19,999 | 0 (0.0%) | 20 (13.0%) |
| $20,000 to $22,499 | 9 (5.2%) | 8 (5.2%) |
| $22,500 to $24,999 | 2 (1.2%) | 2 (1.3%) |
| $25,000 to $29,999 | 22 (12.8%) | 10 (6.5%) |
| $30,000 to $34,999 | 0 (0.0%) | 0 (0.0%) |
| $35,000 to $39,999 | 27 (15.7%) | 0 (0.0%) |
| $40,000 to $44,999 | 0 (0.0%) | 0 (0.0%) |
| $45,000 to $49,999 | 10 (5.8%) | 0 (0.0%) |
| $50,000 to $54,999 | 0 (0.0%) | 14 (9.1%) |
| $55,000 to $64,999 | 4 (2.3%) | 16 (10.4%) |
| $65,000 to $74,999 | 0 (0.0%) | 12 (7.8%) |
| $75,000 to $99,999 | 21 (12.2%) | 9 (5.8%) |
| $100,000+ | 39 (22.7%) | 0 (0.0%) |
| Total | 172 (100.0%) | 154 (100.0%) |
Earnings by Sex by Educational Attainment in Ellsworth borough

| Educational Attainment | Male Income | Female Income |
| Less than High School | - | - |
| High School Diploma | $37,813 | $19,688 |
| College or Associate's Degree | - | - |
| Bachelor's Degree | - | - |
| Graduate Degree | - | - |
| Total | $39,236 | $0 |
Family Income in Ellsworth borough
Family Income Brackets in Ellsworth borough
According to the Ellsworth borough family income data, there are 35 families falling into the $50,000 to $74,999 income range, which is the most common income bracket and makes up 20.7% of all families.
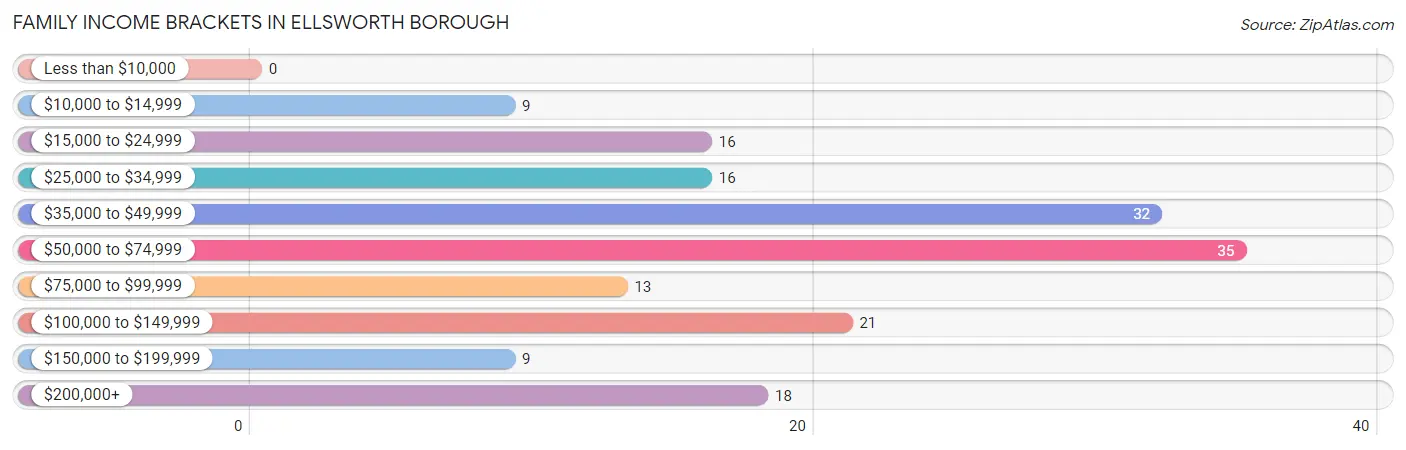
| Income Bracket | # Families | % Families |
| Less than $10,000 | 0 | 0.0% |
| $10,000 to $14,999 | 9 | 5.3% |
| $15,000 to $24,999 | 16 | 9.5% |
| $25,000 to $34,999 | 16 | 9.5% |
| $35,000 to $49,999 | 32 | 18.9% |
| $50,000 to $74,999 | 35 | 20.7% |
| $75,000 to $99,999 | 13 | 7.7% |
| $100,000 to $149,999 | 21 | 12.4% |
| $150,000 to $199,999 | 9 | 5.3% |
| $200,000+ | 18 | 10.7% |
Family Income by Famaliy Size in Ellsworth borough
3-person families (25 | 14.8%) account for the highest median family income in Ellsworth borough with $91,058 per family, while 3-person families (25 | 14.8%) have the highest median income of $30,353 per family member.
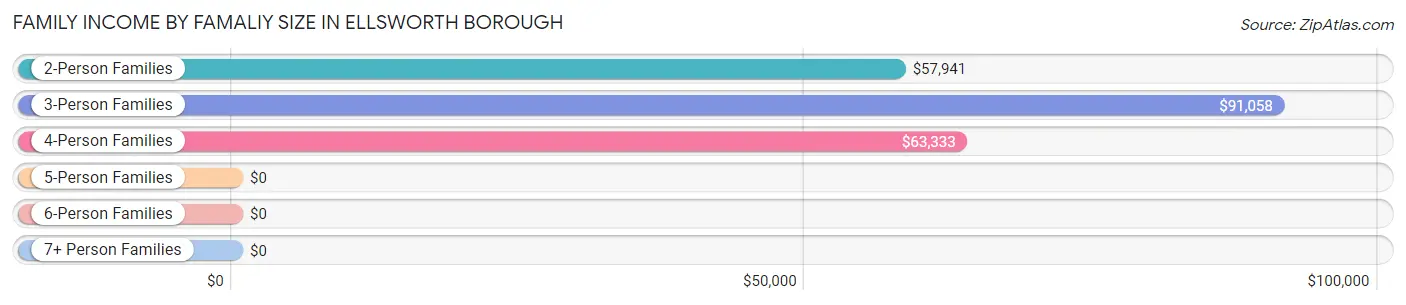
| Income Bracket | # Families | Median Income |
| 2-Person Families | 100 (59.2%) | $57,941 |
| 3-Person Families | 25 (14.8%) | $91,058 |
| 4-Person Families | 44 (26.0%) | $63,333 |
| 5-Person Families | 0 (0.0%) | $0 |
| 6-Person Families | 0 (0.0%) | $0 |
| 7+ Person Families | 0 (0.0%) | $0 |
| Total | 169 (100.0%) | $59,191 |
Family Income by Number of Earners in Ellsworth borough
The median family income in Ellsworth borough is $59,191, with families comprising 2 earners (52) having the highest median family income of $118,750, while families with 1 earner (51) have the lowest median family income of $44,306, accounting for 30.8% and 30.2% of families, respectively.
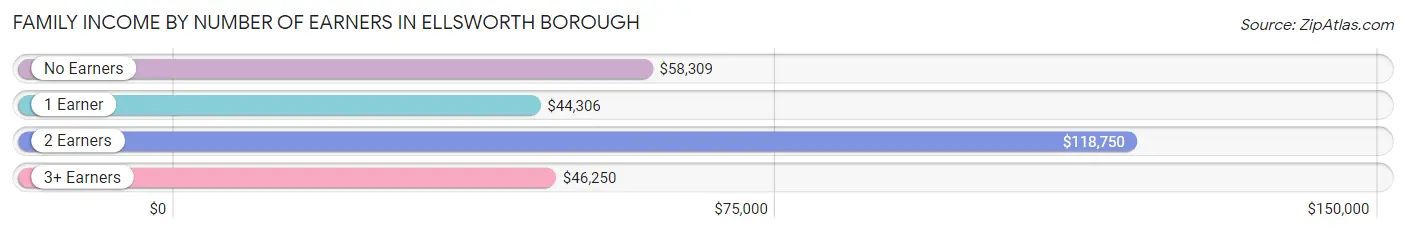
| Number of Earners | # Families | Median Income |
| No Earners | 41 (24.3%) | $58,309 |
| 1 Earner | 51 (30.2%) | $44,306 |
| 2 Earners | 52 (30.8%) | $118,750 |
| 3+ Earners | 25 (14.8%) | $46,250 |
| Total | 169 (100.0%) | $59,191 |
Household Income in Ellsworth borough
Household Income Brackets in Ellsworth borough
With 75 households falling in the category, the $50,000 to $74,999 income range is the most frequent in Ellsworth borough, accounting for 27.4% of all households.
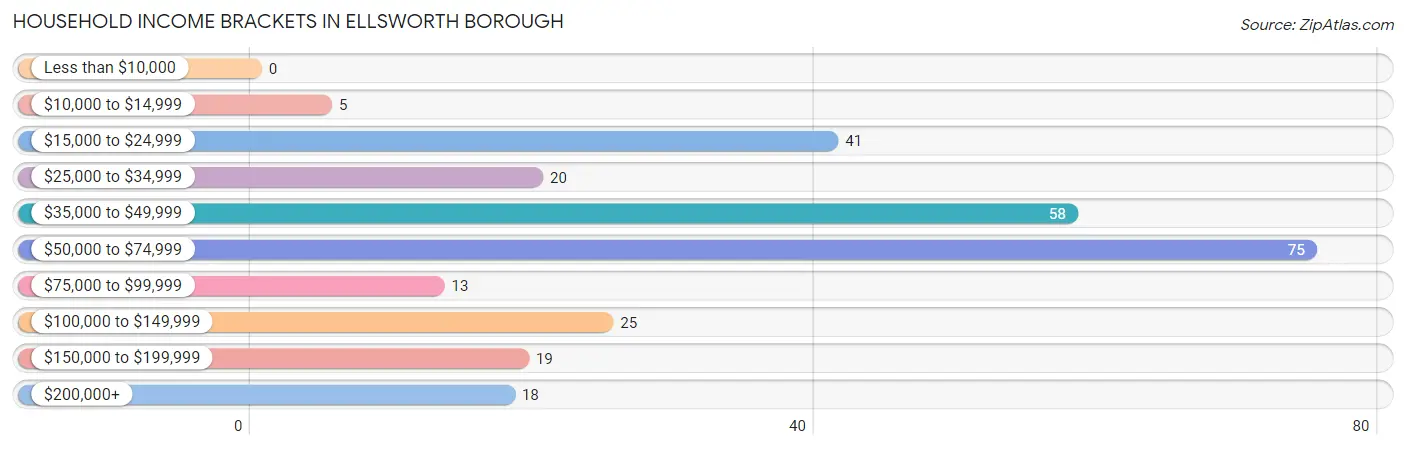
| Income Bracket | # Households | % Households |
| Less than $10,000 | 0 | 0.0% |
| $10,000 to $14,999 | 5 | 1.8% |
| $15,000 to $24,999 | 41 | 15.0% |
| $25,000 to $34,999 | 20 | 7.3% |
| $35,000 to $49,999 | 58 | 21.2% |
| $50,000 to $74,999 | 75 | 27.4% |
| $75,000 to $99,999 | 13 | 4.7% |
| $100,000 to $149,999 | 25 | 9.1% |
| $150,000 to $199,999 | 19 | 6.9% |
| $200,000+ | 18 | 6.6% |
Household Income by Householder Age in Ellsworth borough
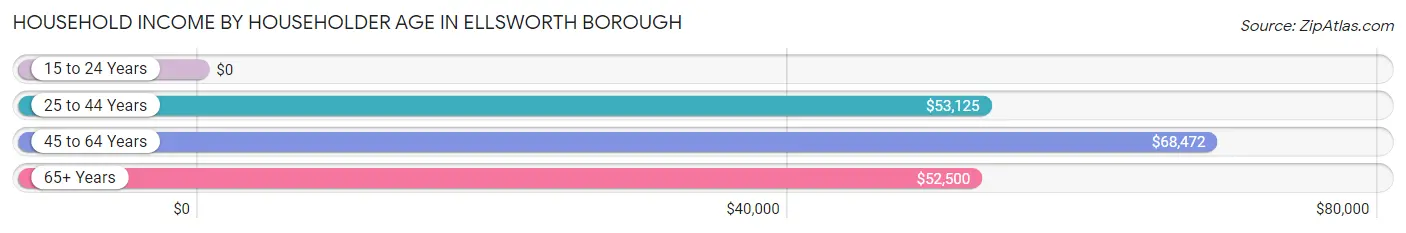
The median household income in Ellsworth borough is $57,794, with the highest median household income of $68,472 found in the 45 to 64 years age bracket for the primary householder. A total of 113 households (41.2%) fall into this category.
| Income Bracket | # Households | Median Income |
| 15 to 24 Years | 0 (0.0%) | $0 |
| 25 to 44 Years | 69 (25.2%) | $53,125 |
| 45 to 64 Years | 113 (41.2%) | $68,472 |
| 65+ Years | 92 (33.6%) | $52,500 |
| Total | 274 (100.0%) | $57,794 |
Poverty in Ellsworth borough
Income Below Poverty by Sex and Age in Ellsworth borough
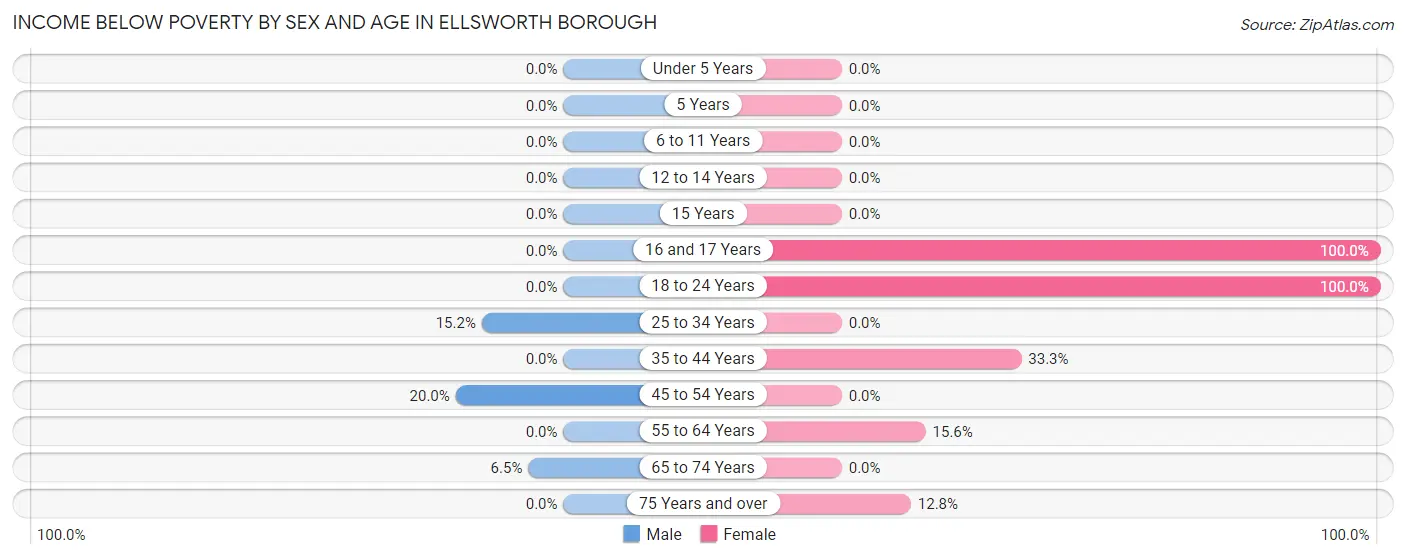
With 5.3% poverty level for males and 14.6% for females among the residents of Ellsworth borough, 45 to 54 year old males and 16 and 17 year old females are the most vulnerable to poverty, with 9 males (20.0%) and 11 females (100.0%) in their respective age groups living below the poverty level.
| Age Bracket | Male | Female |
| Under 5 Years | 0 (0.0%) | 0 (0.0%) |
| 5 Years | 0 (0.0%) | 0 (0.0%) |
| 6 to 11 Years | 0 (0.0%) | 0 (0.0%) |
| 12 to 14 Years | 0 (0.0%) | 0 (0.0%) |
| 15 Years | 0 (0.0%) | 0 (0.0%) |
| 16 and 17 Years | 0 (0.0%) | 11 (100.0%) |
| 18 to 24 Years | 0 (0.0%) | 12 (100.0%) |
| 25 to 34 Years | 5 (15.1%) | 0 (0.0%) |
| 35 to 44 Years | 0 (0.0%) | 9 (33.3%) |
| 45 to 54 Years | 9 (20.0%) | 0 (0.0%) |
| 55 to 64 Years | 0 (0.0%) | 7 (15.6%) |
| 65 to 74 Years | 3 (6.5%) | 0 (0.0%) |
| 75 Years and over | 0 (0.0%) | 5 (12.8%) |
| Total | 17 (5.3%) | 44 (14.6%) |
Income Above Poverty by Sex and Age in Ellsworth borough
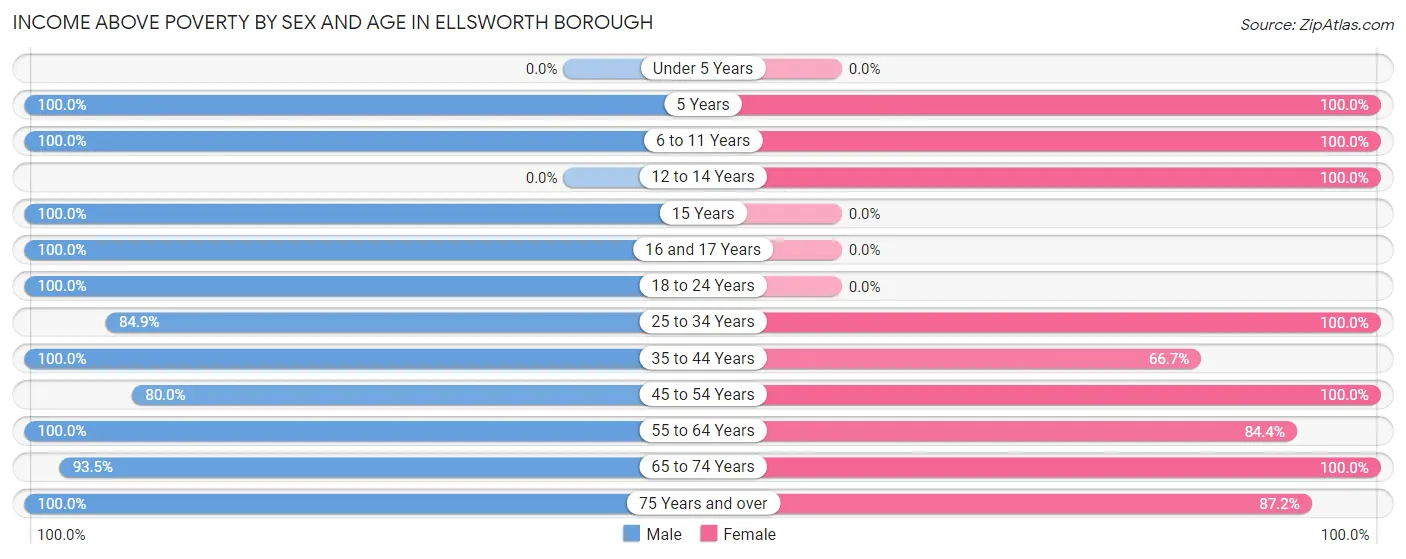
According to the poverty statistics in Ellsworth borough, males aged 5 years and females aged 5 years are the age groups that are most secure financially, with 100.0% of males and 100.0% of females in these age groups living above the poverty line.
| Age Bracket | Male | Female |
| Under 5 Years | 0 (0.0%) | 0 (0.0%) |
| 5 Years | 13 (100.0%) | 10 (100.0%) |
| 6 to 11 Years | 10 (100.0%) | 27 (100.0%) |
| 12 to 14 Years | 0 (0.0%) | 8 (100.0%) |
| 15 Years | 23 (100.0%) | 0 (0.0%) |
| 16 and 17 Years | 13 (100.0%) | 0 (0.0%) |
| 18 to 24 Years | 19 (100.0%) | 0 (0.0%) |
| 25 to 34 Years | 28 (84.9%) | 35 (100.0%) |
| 35 to 44 Years | 45 (100.0%) | 18 (66.7%) |
| 45 to 54 Years | 36 (80.0%) | 62 (100.0%) |
| 55 to 64 Years | 45 (100.0%) | 38 (84.4%) |
| 65 to 74 Years | 43 (93.5%) | 25 (100.0%) |
| 75 Years and over | 30 (100.0%) | 34 (87.2%) |
| Total | 305 (94.7%) | 257 (85.4%) |
Income Below Poverty Among Married-Couple Families in Ellsworth borough
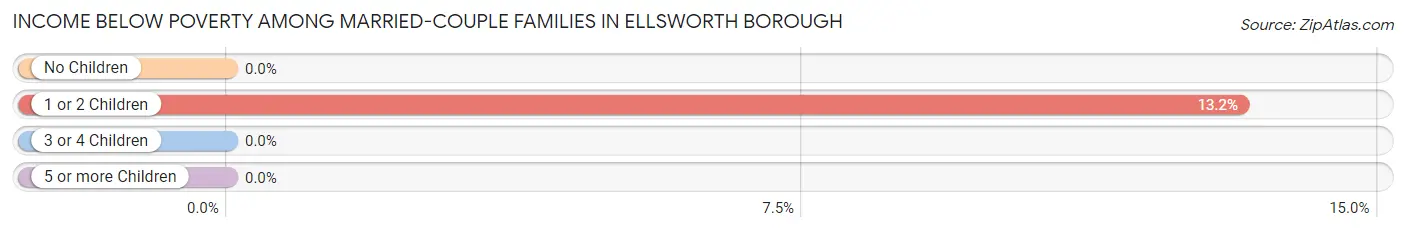
The poverty statistics for married-couple families in Ellsworth borough show that 5.2% or 7 of the total 134 families live below the poverty line. Families with 1 or 2 children have the highest poverty rate of 13.2%, comprising of 7 families. On the other hand, families with no children have the lowest poverty rate of 0.0%, which includes 0 families.
| Children | Above Poverty | Below Poverty |
| No Children | 81 (100.0%) | 0 (0.0%) |
| 1 or 2 Children | 46 (86.8%) | 7 (13.2%) |
| 3 or 4 Children | 0 (0.0%) | 0 (0.0%) |
| 5 or more Children | 0 (0.0%) | 0 (0.0%) |
| Total | 127 (94.8%) | 7 (5.2%) |
Income Below Poverty Among Single-Parent Households in Ellsworth borough
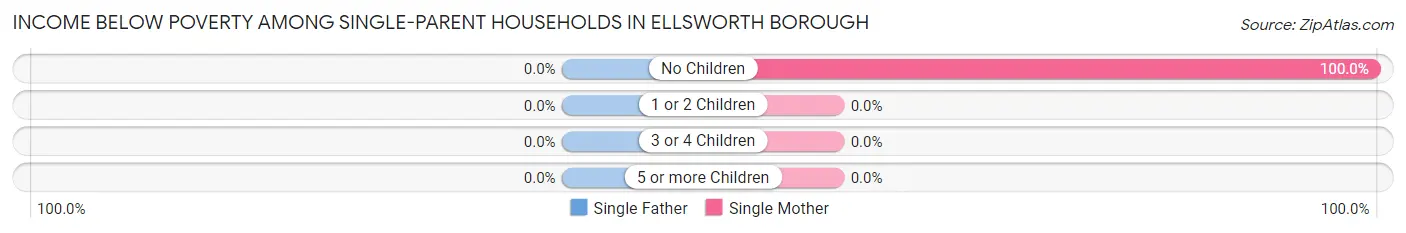
| Children | Single Father | Single Mother |
| No Children | 0 (0.0%) | 9 (100.0%) |
| 1 or 2 Children | 0 (0.0%) | 0 (0.0%) |
| 3 or 4 Children | 0 (0.0%) | 0 (0.0%) |
| 5 or more Children | 0 (0.0%) | 0 (0.0%) |
| Total | 0 (0.0%) | 9 (25.7%) |
Income Below Poverty Among Married-Couple vs Single-Parent Households in Ellsworth borough
The poverty data for Ellsworth borough shows that 7 of the married-couple family households (5.2%) and 9 of the single-parent households (25.7%) are living below the poverty level. Within the married-couple family households, those with 1 or 2 children have the highest poverty rate, with 7 households (13.2%) falling below the poverty line. Among the single-parent households, those with no children have the highest poverty rate, with 9 household (100.0%) living below poverty.
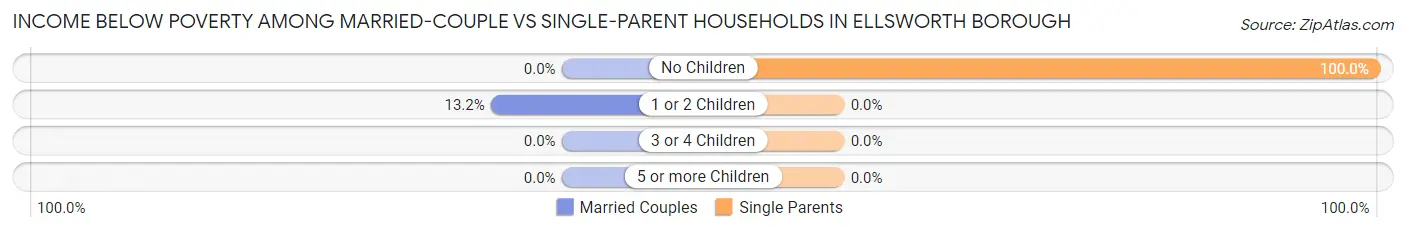
| Children | Married-Couple Families | Single-Parent Households |
| No Children | 0 (0.0%) | 9 (100.0%) |
| 1 or 2 Children | 7 (13.2%) | 0 (0.0%) |
| 3 or 4 Children | 0 (0.0%) | 0 (0.0%) |
| 5 or more Children | 0 (0.0%) | 0 (0.0%) |
| Total | 7 (5.2%) | 9 (25.7%) |
Employment Characteristics in Ellsworth borough
Employment by Class of Employer in Ellsworth borough
Among the 266 employed individuals in Ellsworth borough, private company employees (161 | 60.5%), self-employed (incorporated) (31 | 11.7%), and not-for-profit organizations (28 | 10.5%) make up the most common classes of employment.
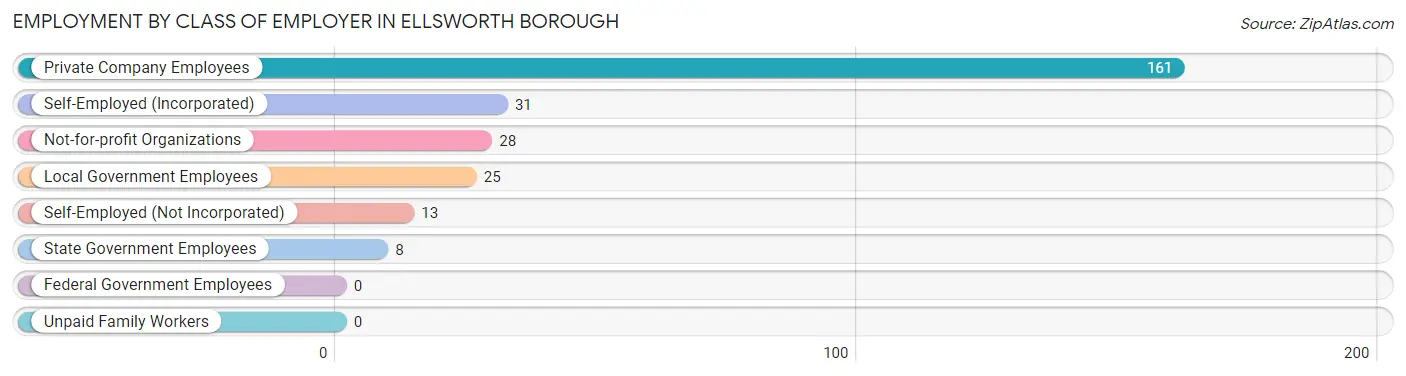
| Employer Class | # Employees | % Employees |
| Private Company Employees | 161 | 60.5% |
| Self-Employed (Incorporated) | 31 | 11.7% |
| Self-Employed (Not Incorporated) | 13 | 4.9% |
| Not-for-profit Organizations | 28 | 10.5% |
| Local Government Employees | 25 | 9.4% |
| State Government Employees | 8 | 3.0% |
| Federal Government Employees | 0 | 0.0% |
| Unpaid Family Workers | 0 | 0.0% |
| Total | 266 | 100.0% |
Employment Status by Age in Ellsworth borough
According to the labor force statistics for Ellsworth borough, out of the total population over 16 years of age (532), 61.3% or 326 individuals are in the labor force, with 13.2% or 43 of them unemployed. The age group with the highest labor force participation rate is 16 to 19 years, with 100.0% or 43 individuals in the labor force. Within the labor force, the 16 to 19 years age range has the highest percentage of unemployed individuals, with 44.2% or 19 of them being unemployed.
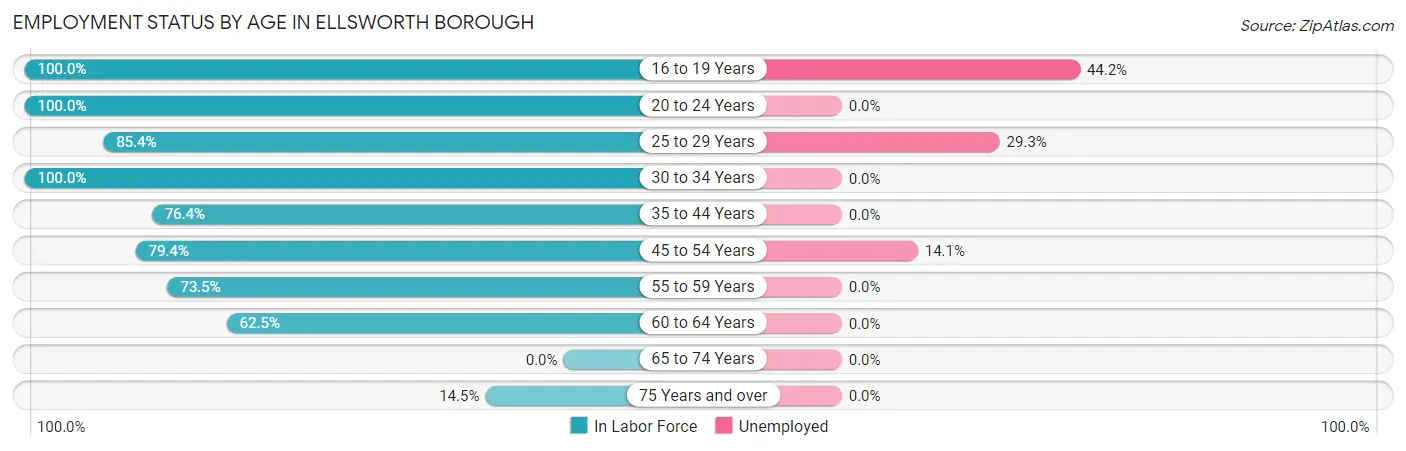
| Age Bracket | In Labor Force | Unemployed |
| 16 to 19 Years | 43 (100.0%) | 19 (44.2%) |
| 20 to 24 Years | 12 (100.0%) | 0 (0.0%) |
| 25 to 29 Years | 41 (85.4%) | 12 (29.3%) |
| 30 to 34 Years | 20 (100.0%) | 0 (0.0%) |
| 35 to 44 Years | 55 (76.4%) | 0 (0.0%) |
| 45 to 54 Years | 85 (79.4%) | 12 (14.1%) |
| 55 to 59 Years | 25 (73.5%) | 0 (0.0%) |
| 60 to 64 Years | 35 (62.5%) | 0 (0.0%) |
| 65 to 74 Years | 0 (0.0%) | 0 (0.0%) |
| 75 Years and over | 10 (14.5%) | 0 (0.0%) |
| Total | 326 (61.3%) | 43 (13.2%) |
Employment Status by Educational Attainment in Ellsworth borough
According to labor force statistics for Ellsworth borough, 77.4% of individuals (261) out of the total population between 25 and 64 years of age (337) are in the labor force, with 9.2% or 24 of them being unemployed. The group with the highest labor force participation rate are those with the educational attainment of less than high school, with 83.3% or 50 individuals in the labor force. Within the labor force, individuals with less than high school education have the highest percentage of unemployment, with 48.0% or 24 of them being unemployed.
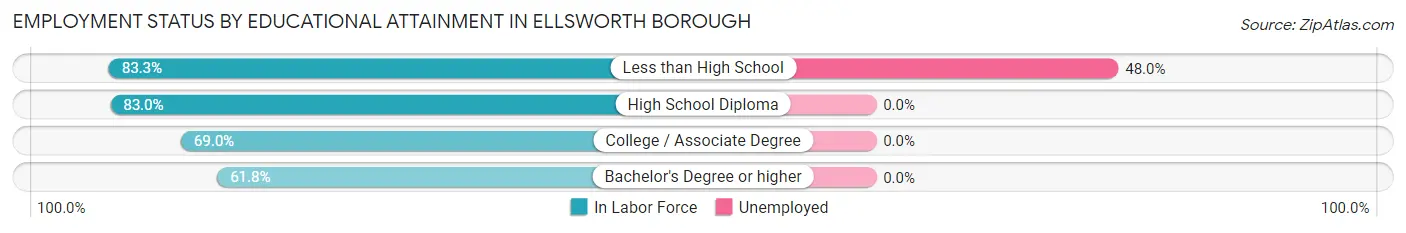
| Educational Attainment | In Labor Force | Unemployed |
| Less than High School | 50 (83.3%) | 29 (48.0%) |
| High School Diploma | 132 (83.0%) | 0 (0.0%) |
| College / Associate Degree | 58 (69.0%) | 0 (0.0%) |
| Bachelor's Degree or higher | 21 (61.8%) | 0 (0.0%) |
| Total | 261 (77.4%) | 31 (9.2%) |
Employment Occupations by Sex in Ellsworth borough
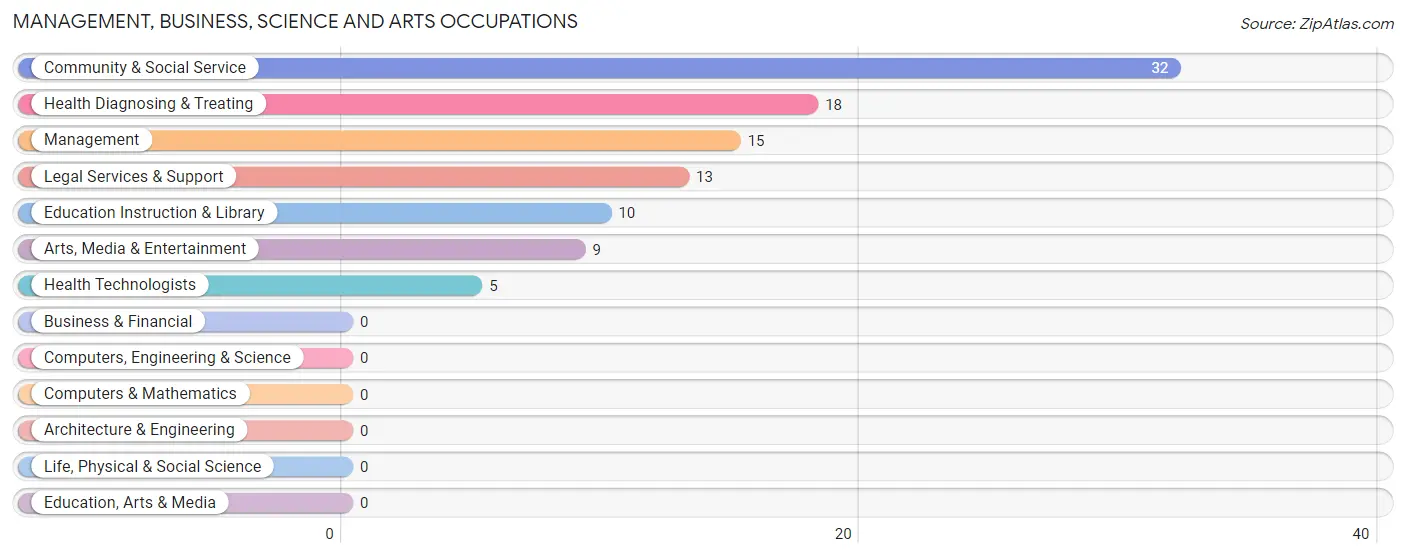
Management, Business, Science and Arts Occupations
The most common Management, Business, Science and Arts occupations in Ellsworth borough are Community & Social Service (32 | 11.3%), Health Diagnosing & Treating (18 | 6.4%), Management (15 | 5.3%), Legal Services & Support (13 | 4.6%), and Education Instruction & Library (10 | 3.5%).
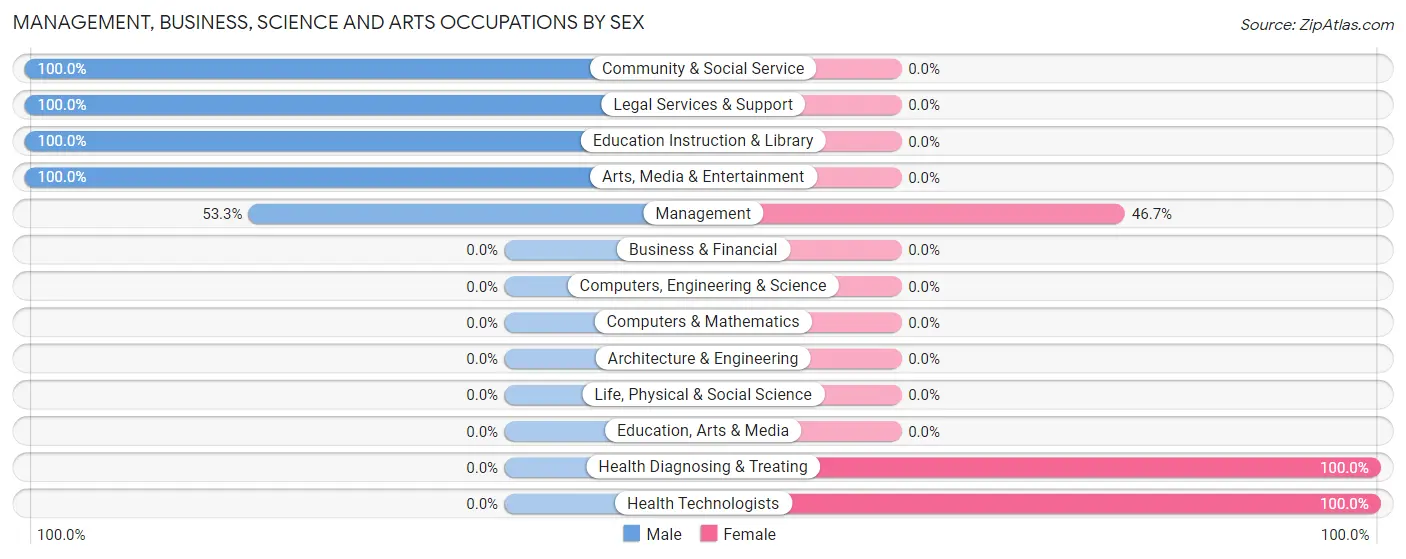
Management, Business, Science and Arts Occupations by Sex
Within the Management, Business, Science and Arts occupations in Ellsworth borough, the most male-oriented occupations are Community & Social Service (100.0%), Legal Services & Support (100.0%), and Education Instruction & Library (100.0%), while the most female-oriented occupations are Health Diagnosing & Treating (100.0%), Health Technologists (100.0%), and Management (46.7%).
| Occupation | Male | Female |
| Management | 8 (53.3%) | 7 (46.7%) |
| Business & Financial | 0 (0.0%) | 0 (0.0%) |
| Computers, Engineering & Science | 0 (0.0%) | 0 (0.0%) |
| Computers & Mathematics | 0 (0.0%) | 0 (0.0%) |
| Architecture & Engineering | 0 (0.0%) | 0 (0.0%) |
| Life, Physical & Social Science | 0 (0.0%) | 0 (0.0%) |
| Community & Social Service | 32 (100.0%) | 0 (0.0%) |
| Education, Arts & Media | 0 (0.0%) | 0 (0.0%) |
| Legal Services & Support | 13 (100.0%) | 0 (0.0%) |
| Education Instruction & Library | 10 (100.0%) | 0 (0.0%) |
| Arts, Media & Entertainment | 9 (100.0%) | 0 (0.0%) |
| Health Diagnosing & Treating | 0 (0.0%) | 18 (100.0%) |
| Health Technologists | 0 (0.0%) | 5 (100.0%) |
| Total (Category) | 40 (61.5%) | 25 (38.5%) |
| Total (Overall) | 154 (54.4%) | 129 (45.6%) |
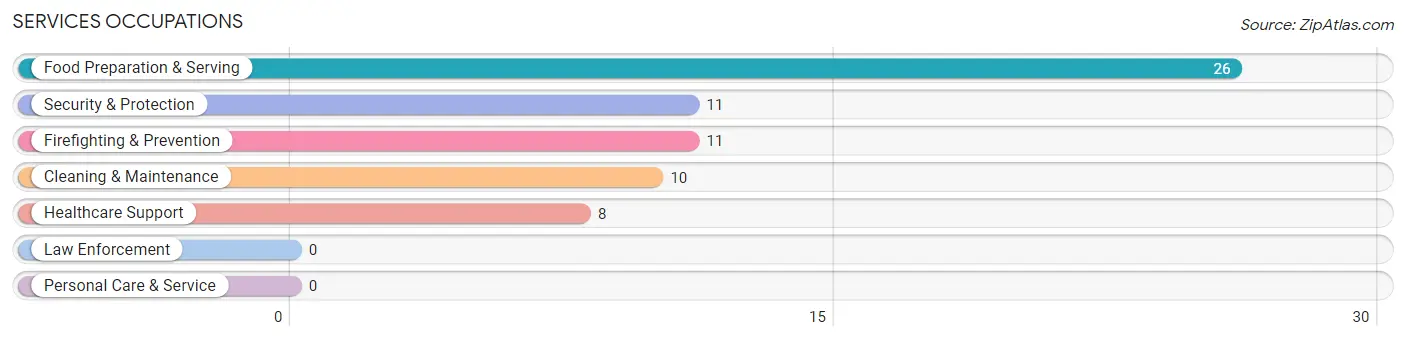
Services Occupations
The most common Services occupations in Ellsworth borough are Food Preparation & Serving (26 | 9.2%), Security & Protection (11 | 3.9%), Firefighting & Prevention (11 | 3.9%), Cleaning & Maintenance (10 | 3.5%), and Healthcare Support (8 | 2.8%).
Services Occupations by Sex
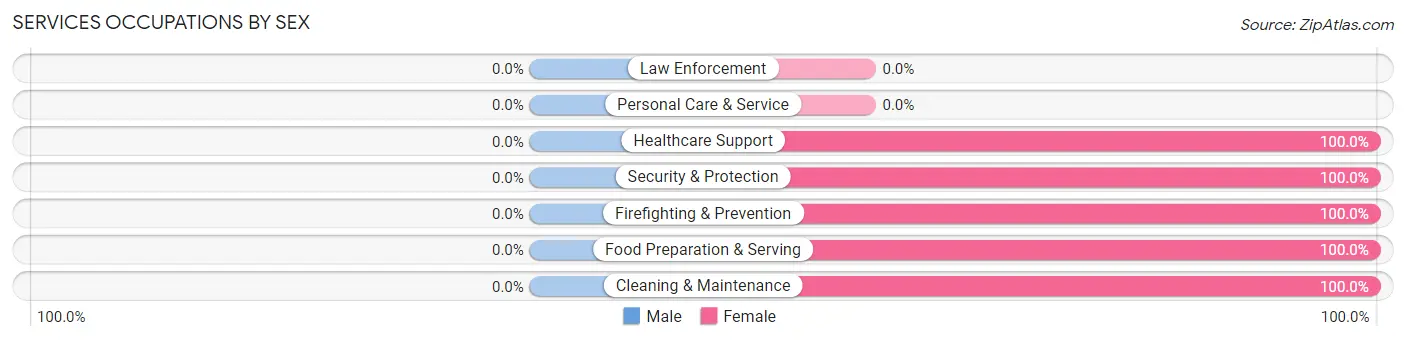
| Occupation | Male | Female |
| Healthcare Support | 0 (0.0%) | 8 (100.0%) |
| Security & Protection | 0 (0.0%) | 11 (100.0%) |
| Firefighting & Prevention | 0 (0.0%) | 11 (100.0%) |
| Law Enforcement | 0 (0.0%) | 0 (0.0%) |
| Food Preparation & Serving | 0 (0.0%) | 26 (100.0%) |
| Cleaning & Maintenance | 0 (0.0%) | 10 (100.0%) |
| Personal Care & Service | 0 (0.0%) | 0 (0.0%) |
| Total (Category) | 0 (0.0%) | 55 (100.0%) |
| Total (Overall) | 154 (54.4%) | 129 (45.6%) |
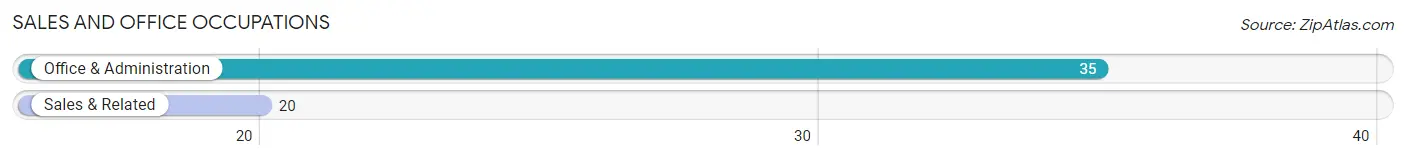
Sales and Office Occupations
The most common Sales and Office occupations in Ellsworth borough are Office & Administration (35 | 12.4%), and Sales & Related (20 | 7.1%).
Sales and Office Occupations by Sex
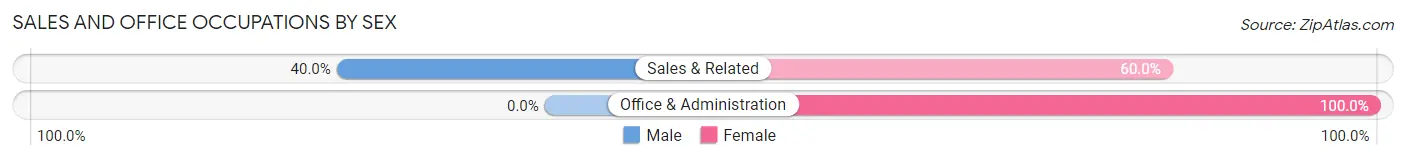
| Occupation | Male | Female |
| Sales & Related | 8 (40.0%) | 12 (60.0%) |
| Office & Administration | 0 (0.0%) | 35 (100.0%) |
| Total (Category) | 8 (14.5%) | 47 (85.5%) |
| Total (Overall) | 154 (54.4%) | 129 (45.6%) |
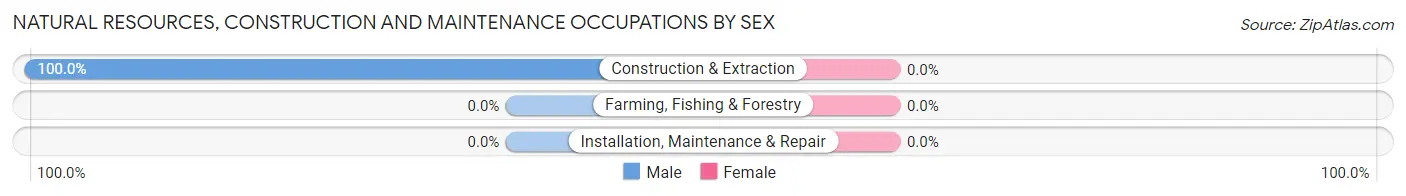
Natural Resources, Construction and Maintenance Occupations
The most common Natural Resources, Construction and Maintenance occupations in Ellsworth borough are , and Construction & Extraction (63 | 22.3%).
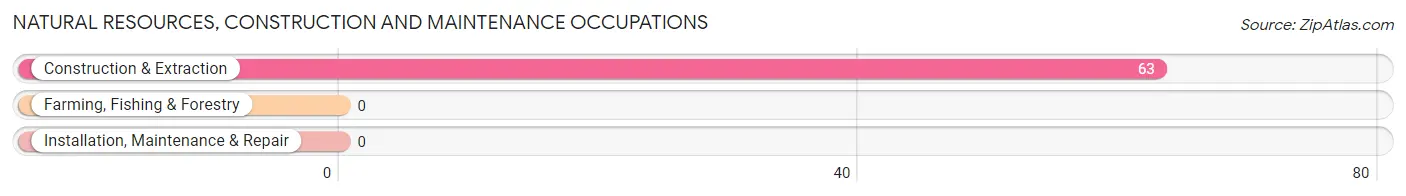
Natural Resources, Construction and Maintenance Occupations by Sex
| Occupation | Male | Female |
| Farming, Fishing & Forestry | 0 (0.0%) | 0 (0.0%) |
| Construction & Extraction | 63 (100.0%) | 0 (0.0%) |
| Installation, Maintenance & Repair | 0 (0.0%) | 0 (0.0%) |
| Total (Category) | 63 (100.0%) | 0 (0.0%) |
| Total (Overall) | 154 (54.4%) | 129 (45.6%) |
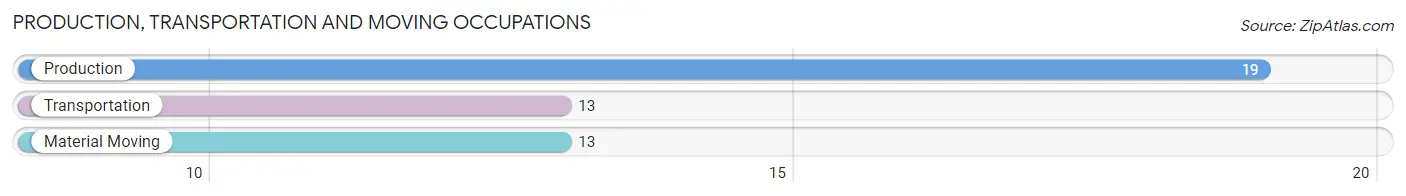
Production, Transportation and Moving Occupations
The most common Production, Transportation and Moving occupations in Ellsworth borough are Production (19 | 6.7%), Transportation (13 | 4.6%), and Material Moving (13 | 4.6%).
Production, Transportation and Moving Occupations by Sex
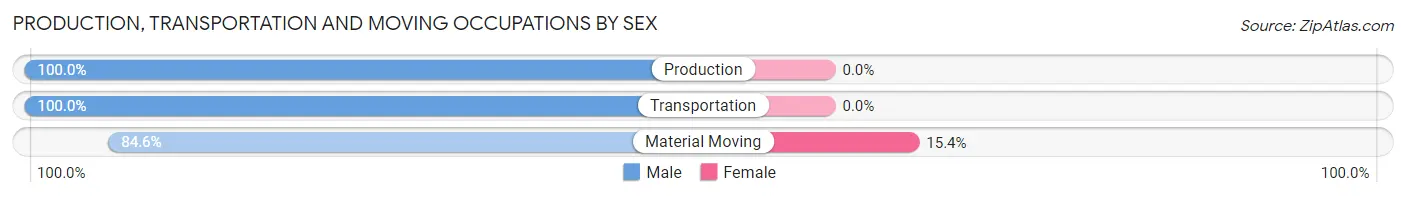
| Occupation | Male | Female |
| Production | 19 (100.0%) | 0 (0.0%) |
| Transportation | 13 (100.0%) | 0 (0.0%) |
| Material Moving | 11 (84.6%) | 2 (15.4%) |
| Total (Category) | 43 (95.6%) | 2 (4.4%) |
| Total (Overall) | 154 (54.4%) | 129 (45.6%) |
Employment Industries by Sex in Ellsworth borough
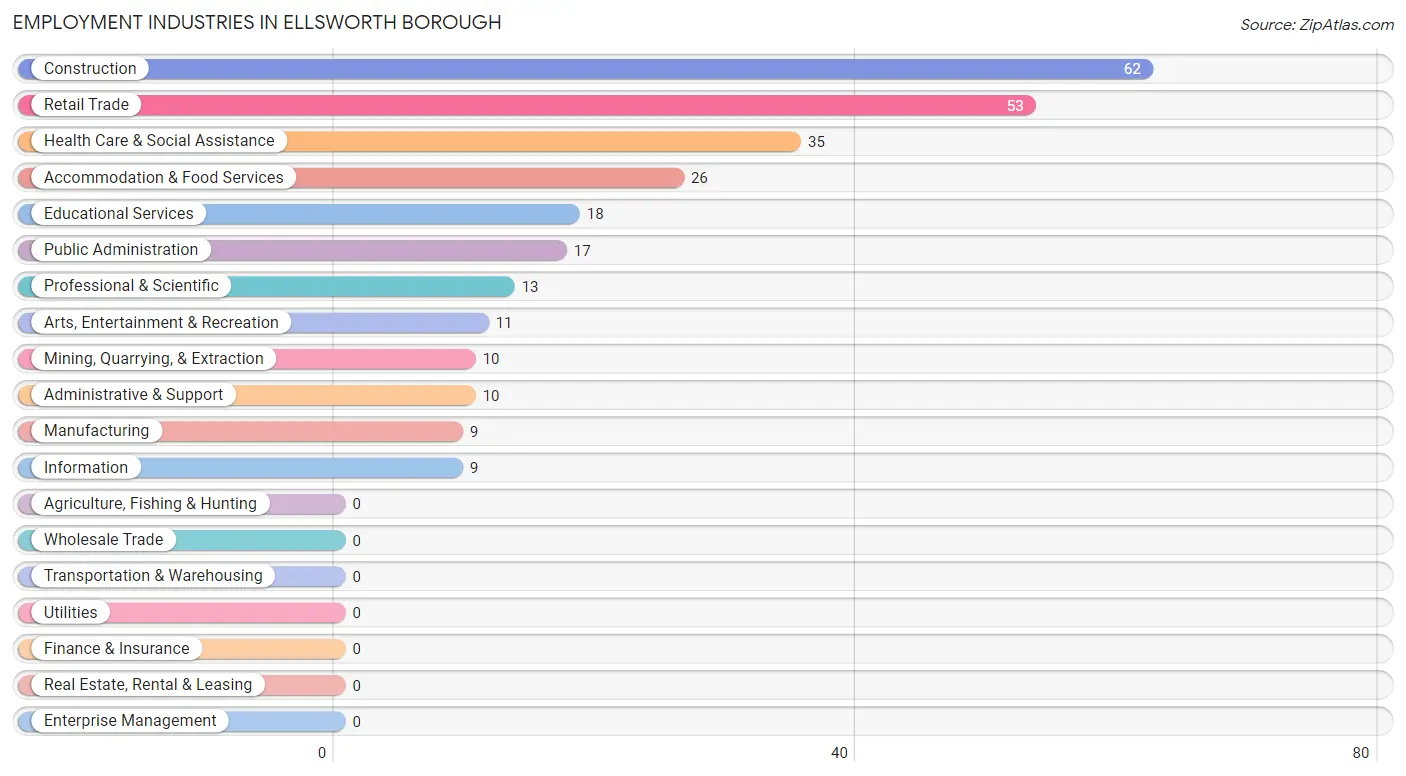
Employment Industries in Ellsworth borough
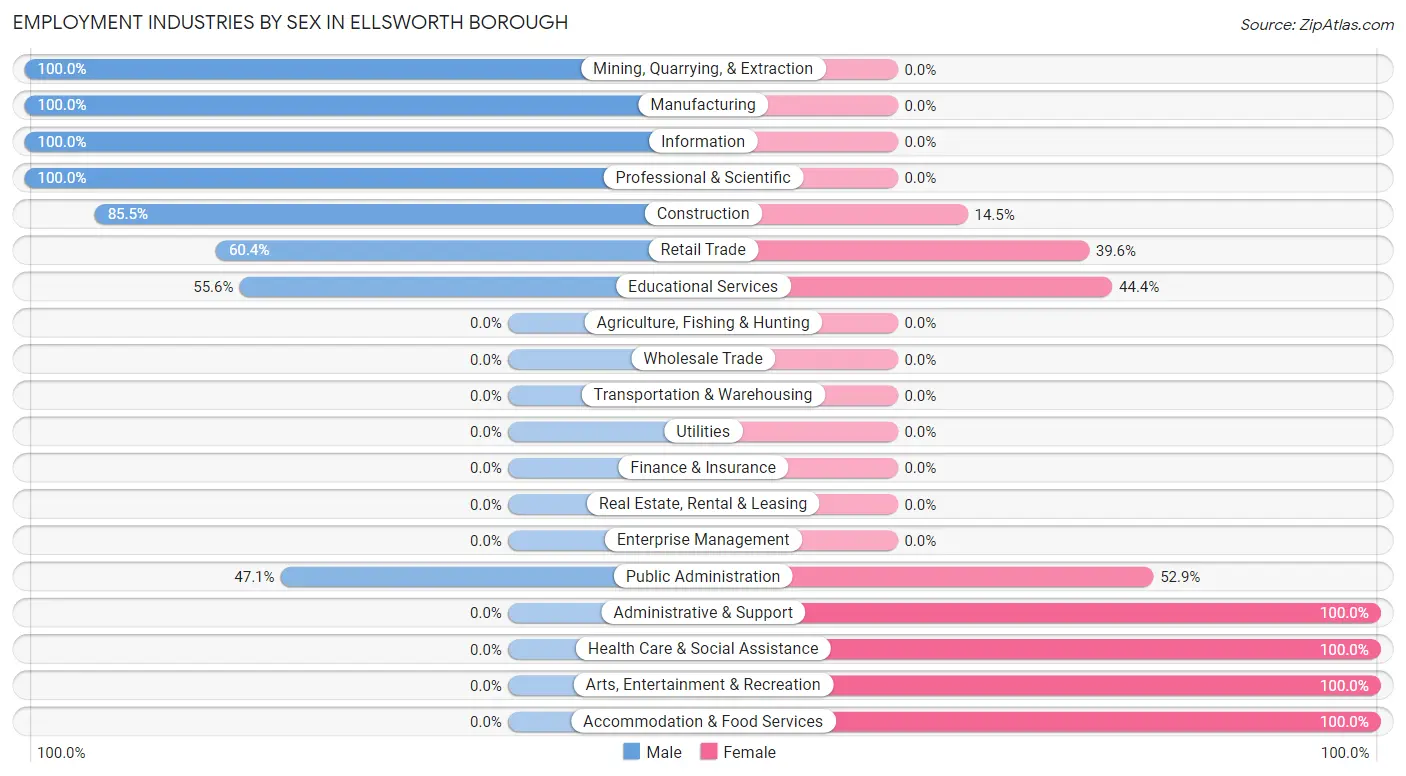
The major employment industries in Ellsworth borough include Construction (62 | 21.9%), Retail Trade (53 | 18.7%), Health Care & Social Assistance (35 | 12.4%), Accommodation & Food Services (26 | 9.2%), and Educational Services (18 | 6.4%).
Employment Industries by Sex in Ellsworth borough
The Ellsworth borough industries that see more men than women are Mining, Quarrying, & Extraction (100.0%), Manufacturing (100.0%), and Information (100.0%), whereas the industries that tend to have a higher number of women are Administrative & Support (100.0%), Health Care & Social Assistance (100.0%), and Arts, Entertainment & Recreation (100.0%).
| Industry | Male | Female |
| Agriculture, Fishing & Hunting | 0 (0.0%) | 0 (0.0%) |
| Mining, Quarrying, & Extraction | 10 (100.0%) | 0 (0.0%) |
| Construction | 53 (85.5%) | 9 (14.5%) |
| Manufacturing | 9 (100.0%) | 0 (0.0%) |
| Wholesale Trade | 0 (0.0%) | 0 (0.0%) |
| Retail Trade | 32 (60.4%) | 21 (39.6%) |
| Transportation & Warehousing | 0 (0.0%) | 0 (0.0%) |
| Utilities | 0 (0.0%) | 0 (0.0%) |
| Information | 9 (100.0%) | 0 (0.0%) |
| Finance & Insurance | 0 (0.0%) | 0 (0.0%) |
| Real Estate, Rental & Leasing | 0 (0.0%) | 0 (0.0%) |
| Professional & Scientific | 13 (100.0%) | 0 (0.0%) |
| Enterprise Management | 0 (0.0%) | 0 (0.0%) |
| Administrative & Support | 0 (0.0%) | 10 (100.0%) |
| Educational Services | 10 (55.6%) | 8 (44.4%) |
| Health Care & Social Assistance | 0 (0.0%) | 35 (100.0%) |
| Arts, Entertainment & Recreation | 0 (0.0%) | 11 (100.0%) |
| Accommodation & Food Services | 0 (0.0%) | 26 (100.0%) |
| Public Administration | 8 (47.1%) | 9 (52.9%) |
| Total | 154 (54.4%) | 129 (45.6%) |
Education in Ellsworth borough
School Enrollment in Ellsworth borough
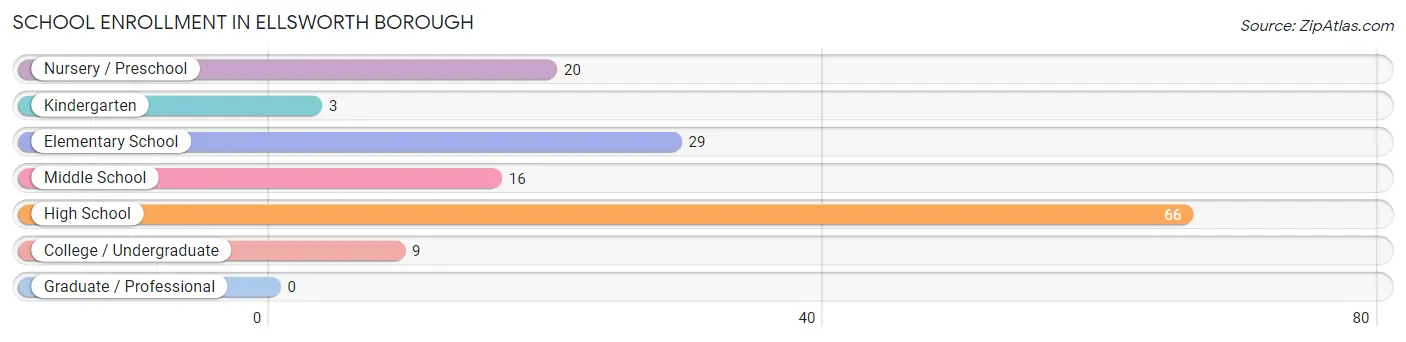
The most common levels of schooling among the 143 students in Ellsworth borough are high school (66 | 46.2%), elementary school (29 | 20.3%), and nursery / preschool (20 | 14.0%).
| School Level | # Students | % Students |
| Nursery / Preschool | 20 | 14.0% |
| Kindergarten | 3 | 2.1% |
| Elementary School | 29 | 20.3% |
| Middle School | 16 | 11.2% |
| High School | 66 | 46.2% |
| College / Undergraduate | 9 | 6.3% |
| Graduate / Professional | 0 | 0.0% |
| Total | 143 | 100.0% |
School Enrollment by Age by Funding Source in Ellsworth borough
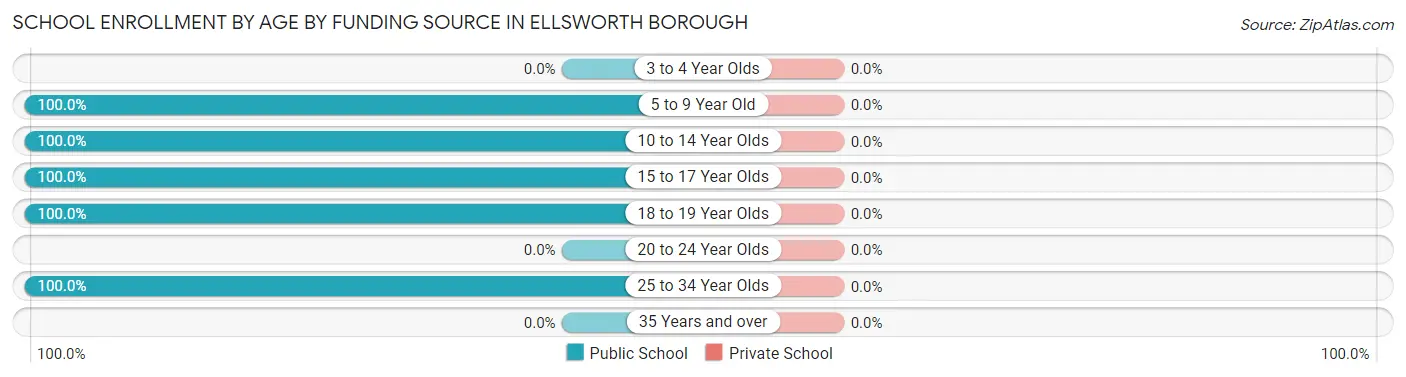
| Age Bracket | Public School | Private School |
| 3 to 4 Year Olds | 0 (0.0%) | 0 (0.0%) |
| 5 to 9 Year Old | 52 (100.0%) | 0 (0.0%) |
| 10 to 14 Year Olds | 16 (100.0%) | 0 (0.0%) |
| 15 to 17 Year Olds | 47 (100.0%) | 0 (0.0%) |
| 18 to 19 Year Olds | 19 (100.0%) | 0 (0.0%) |
| 20 to 24 Year Olds | 0 (0.0%) | 0 (0.0%) |
| 25 to 34 Year Olds | 9 (100.0%) | 0 (0.0%) |
| 35 Years and over | 0 (0.0%) | 0 (0.0%) |
| Total | 143 (100.0%) | 0 (0.0%) |
Educational Attainment by Field of Study in Ellsworth borough
Education (23 | 27.4%), business (21 | 25.0%), bio, nature & agricultural (10 | 11.9%), physical & health sciences (10 | 11.9%), and psychology (10 | 11.9%) are the most common fields of study among 84 individuals in Ellsworth borough who have obtained a bachelor's degree or higher.
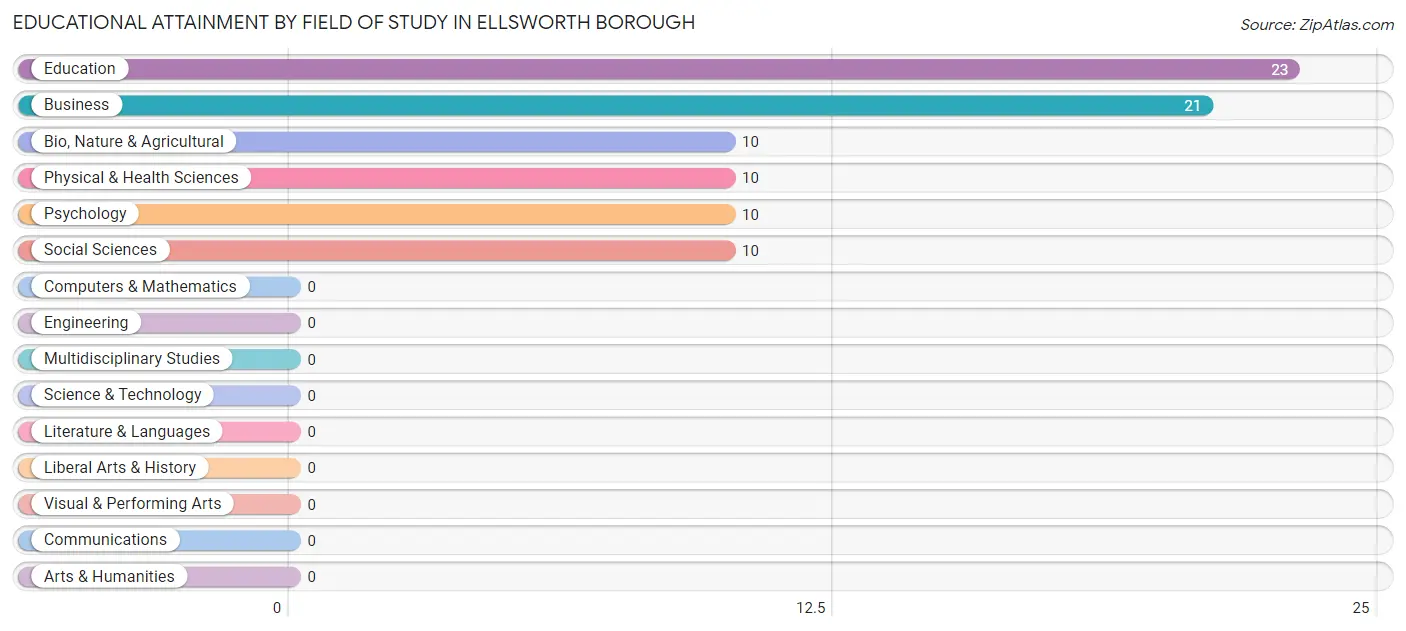
| Field of Study | # Graduates | % Graduates |
| Computers & Mathematics | 0 | 0.0% |
| Bio, Nature & Agricultural | 10 | 11.9% |
| Physical & Health Sciences | 10 | 11.9% |
| Psychology | 10 | 11.9% |
| Social Sciences | 10 | 11.9% |
| Engineering | 0 | 0.0% |
| Multidisciplinary Studies | 0 | 0.0% |
| Science & Technology | 0 | 0.0% |
| Business | 21 | 25.0% |
| Education | 23 | 27.4% |
| Literature & Languages | 0 | 0.0% |
| Liberal Arts & History | 0 | 0.0% |
| Visual & Performing Arts | 0 | 0.0% |
| Communications | 0 | 0.0% |
| Arts & Humanities | 0 | 0.0% |
| Total | 84 | 100.0% |
Transportation & Commute in Ellsworth borough
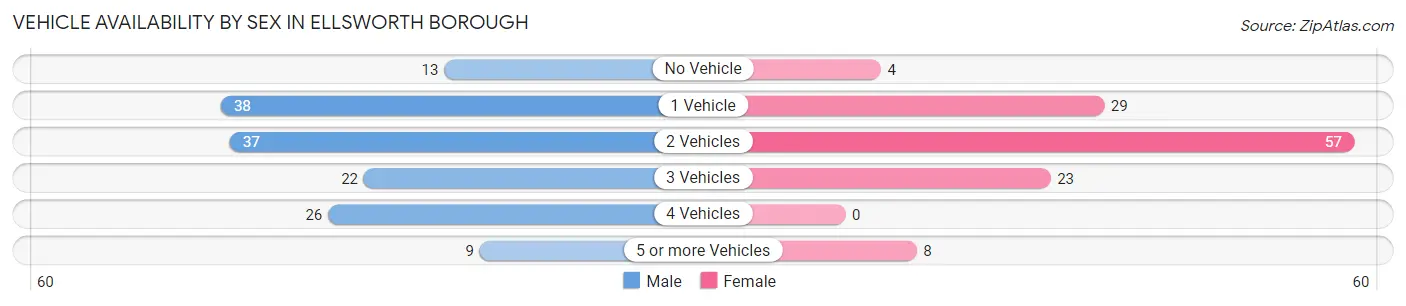
Vehicle Availability by Sex in Ellsworth borough
The most prevalent vehicle ownership categories in Ellsworth borough are males with 1 vehicle (38, accounting for 26.2%) and females with 1 vehicle (29, making up 31.4%).
| Vehicles Available | Male | Female |
| No Vehicle | 13 (9.0%) | 4 (3.3%) |
| 1 Vehicle | 38 (26.2%) | 29 (24.0%) |
| 2 Vehicles | 37 (25.5%) | 57 (47.1%) |
| 3 Vehicles | 22 (15.2%) | 23 (19.0%) |
| 4 Vehicles | 26 (17.9%) | 0 (0.0%) |
| 5 or more Vehicles | 9 (6.2%) | 8 (6.6%) |
| Total | 145 (100.0%) | 121 (100.0%) |
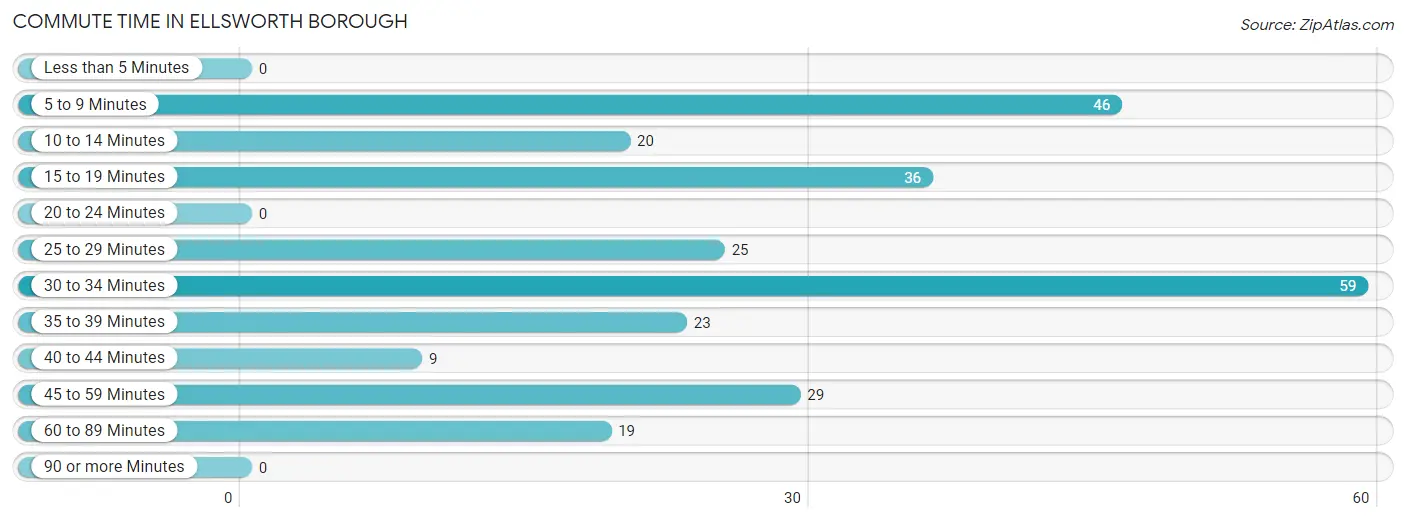
Commute Time in Ellsworth borough
The most frequently occuring commute durations in Ellsworth borough are 30 to 34 minutes (59 commuters, 22.2%), 5 to 9 minutes (46 commuters, 17.3%), and 15 to 19 minutes (36 commuters, 13.5%).
| Commute Time | # Commuters | % Commuters |
| Less than 5 Minutes | 0 | 0.0% |
| 5 to 9 Minutes | 46 | 17.3% |
| 10 to 14 Minutes | 20 | 7.5% |
| 15 to 19 Minutes | 36 | 13.5% |
| 20 to 24 Minutes | 0 | 0.0% |
| 25 to 29 Minutes | 25 | 9.4% |
| 30 to 34 Minutes | 59 | 22.2% |
| 35 to 39 Minutes | 23 | 8.6% |
| 40 to 44 Minutes | 9 | 3.4% |
| 45 to 59 Minutes | 29 | 10.9% |
| 60 to 89 Minutes | 19 | 7.1% |
| 90 or more Minutes | 0 | 0.0% |
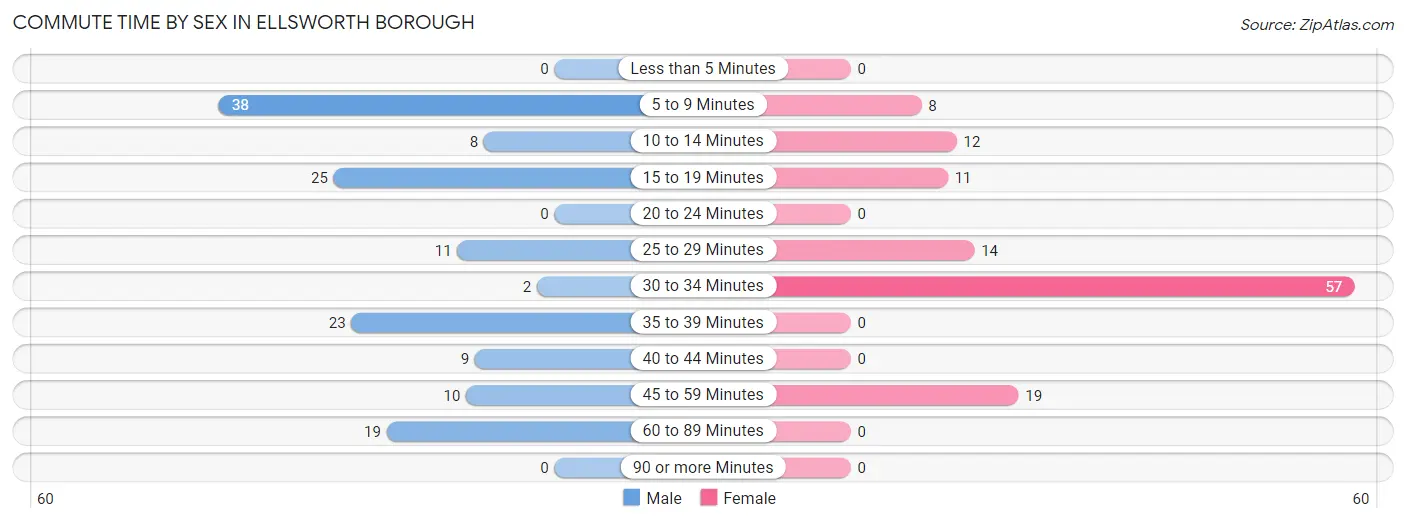
Commute Time by Sex in Ellsworth borough
The most common commute times in Ellsworth borough are 5 to 9 minutes (38 commuters, 26.2%) for males and 30 to 34 minutes (57 commuters, 47.1%) for females.
| Commute Time | Male | Female |
| Less than 5 Minutes | 0 (0.0%) | 0 (0.0%) |
| 5 to 9 Minutes | 38 (26.2%) | 8 (6.6%) |
| 10 to 14 Minutes | 8 (5.5%) | 12 (9.9%) |
| 15 to 19 Minutes | 25 (17.2%) | 11 (9.1%) |
| 20 to 24 Minutes | 0 (0.0%) | 0 (0.0%) |
| 25 to 29 Minutes | 11 (7.6%) | 14 (11.6%) |
| 30 to 34 Minutes | 2 (1.4%) | 57 (47.1%) |
| 35 to 39 Minutes | 23 (15.9%) | 0 (0.0%) |
| 40 to 44 Minutes | 9 (6.2%) | 0 (0.0%) |
| 45 to 59 Minutes | 10 (6.9%) | 19 (15.7%) |
| 60 to 89 Minutes | 19 (13.1%) | 0 (0.0%) |
| 90 or more Minutes | 0 (0.0%) | 0 (0.0%) |
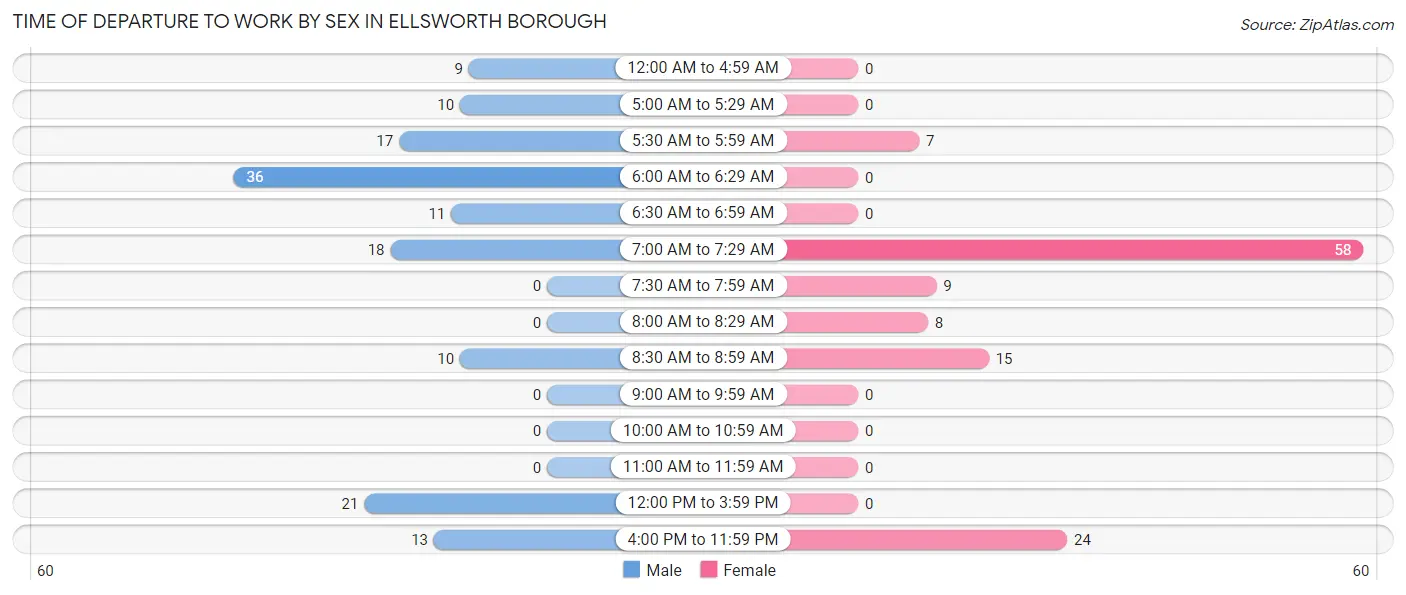
Time of Departure to Work by Sex in Ellsworth borough
The most frequent times of departure to work in Ellsworth borough are 6:00 AM to 6:29 AM (36, 24.8%) for males and 7:00 AM to 7:29 AM (58, 47.9%) for females.
| Time of Departure | Male | Female |
| 12:00 AM to 4:59 AM | 9 (6.2%) | 0 (0.0%) |
| 5:00 AM to 5:29 AM | 10 (6.9%) | 0 (0.0%) |
| 5:30 AM to 5:59 AM | 17 (11.7%) | 7 (5.8%) |
| 6:00 AM to 6:29 AM | 36 (24.8%) | 0 (0.0%) |
| 6:30 AM to 6:59 AM | 11 (7.6%) | 0 (0.0%) |
| 7:00 AM to 7:29 AM | 18 (12.4%) | 58 (47.9%) |
| 7:30 AM to 7:59 AM | 0 (0.0%) | 9 (7.4%) |
| 8:00 AM to 8:29 AM | 0 (0.0%) | 8 (6.6%) |
| 8:30 AM to 8:59 AM | 10 (6.9%) | 15 (12.4%) |
| 9:00 AM to 9:59 AM | 0 (0.0%) | 0 (0.0%) |
| 10:00 AM to 10:59 AM | 0 (0.0%) | 0 (0.0%) |
| 11:00 AM to 11:59 AM | 0 (0.0%) | 0 (0.0%) |
| 12:00 PM to 3:59 PM | 21 (14.5%) | 0 (0.0%) |
| 4:00 PM to 11:59 PM | 13 (9.0%) | 24 (19.8%) |
| Total | 145 (100.0%) | 121 (100.0%) |
Housing Occupancy in Ellsworth borough
Occupancy by Ownership in Ellsworth borough
Of the total 274 dwellings in Ellsworth borough, owner-occupied units account for 186 (67.9%), while renter-occupied units make up 88 (32.1%).
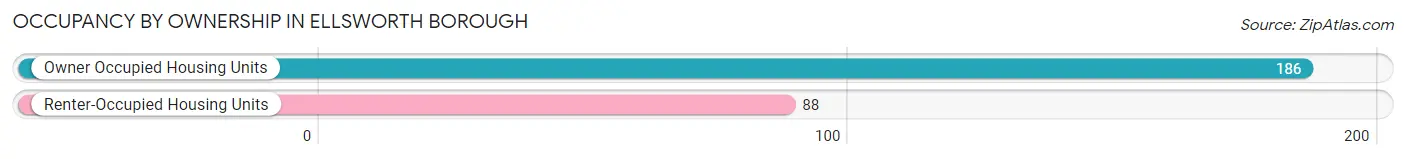
| Occupancy | # Housing Units | % Housing Units |
| Owner Occupied Housing Units | 186 | 67.9% |
| Renter-Occupied Housing Units | 88 | 32.1% |
| Total Occupied Housing Units | 274 | 100.0% |
Occupancy by Household Size in Ellsworth borough
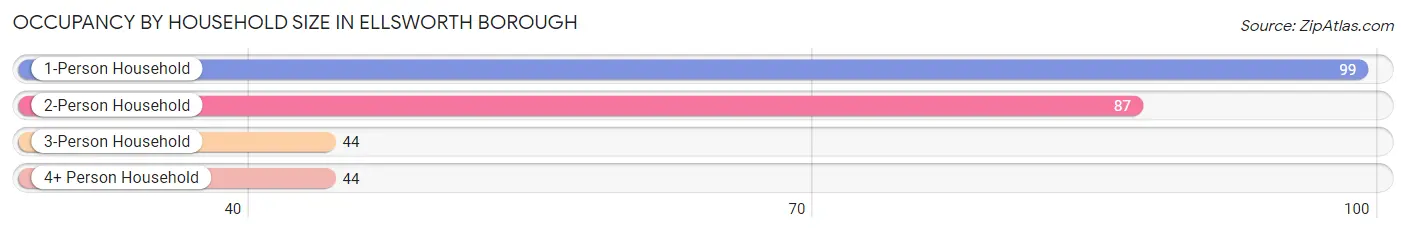
| Household Size | # Housing Units | % Housing Units |
| 1-Person Household | 99 | 36.1% |
| 2-Person Household | 87 | 31.8% |
| 3-Person Household | 44 | 16.1% |
| 4+ Person Household | 44 | 16.1% |
| Total Housing Units | 274 | 100.0% |
Occupancy by Ownership by Household Size in Ellsworth borough
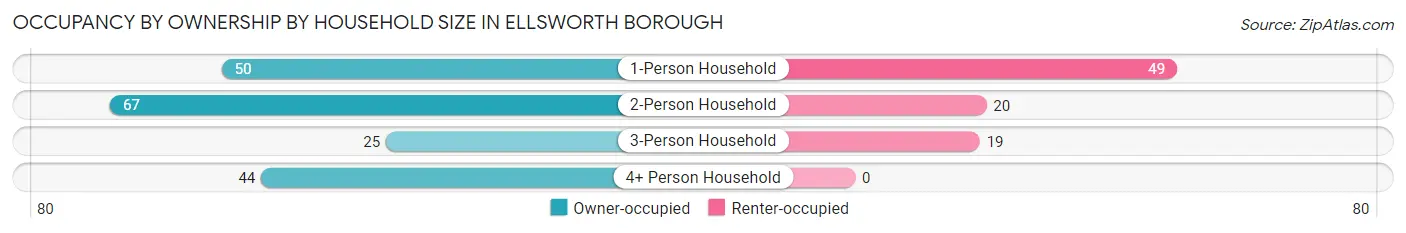
| Household Size | Owner-occupied | Renter-occupied |
| 1-Person Household | 50 (50.5%) | 49 (49.5%) |
| 2-Person Household | 67 (77.0%) | 20 (23.0%) |
| 3-Person Household | 25 (56.8%) | 19 (43.2%) |
| 4+ Person Household | 44 (100.0%) | 0 (0.0%) |
| Total Housing Units | 186 (67.9%) | 88 (32.1%) |
Occupancy by Educational Attainment in Ellsworth borough
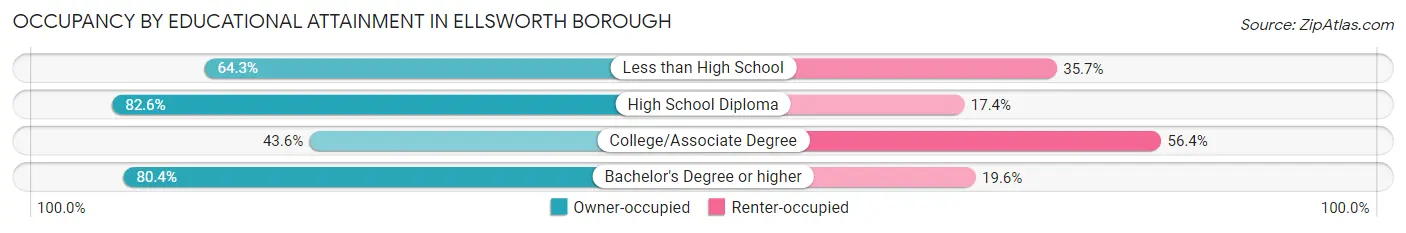
| Household Size | Owner-occupied | Renter-occupied |
| Less than High School | 9 (64.3%) | 5 (35.7%) |
| High School Diploma | 95 (82.6%) | 20 (17.4%) |
| College/Associate Degree | 41 (43.6%) | 53 (56.4%) |
| Bachelor's Degree or higher | 41 (80.4%) | 10 (19.6%) |
Occupancy by Age of Householder in Ellsworth borough
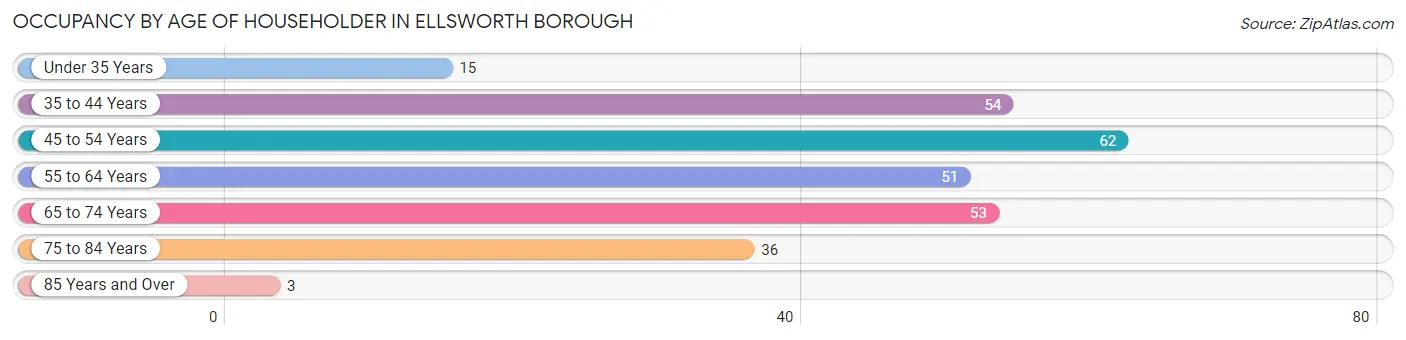
| Age Bracket | # Households | % Households |
| Under 35 Years | 15 | 5.5% |
| 35 to 44 Years | 54 | 19.7% |
| 45 to 54 Years | 62 | 22.6% |
| 55 to 64 Years | 51 | 18.6% |
| 65 to 74 Years | 53 | 19.3% |
| 75 to 84 Years | 36 | 13.1% |
| 85 Years and Over | 3 | 1.1% |
| Total | 274 | 100.0% |
Housing Finances in Ellsworth borough
Median Income by Occupancy in Ellsworth borough
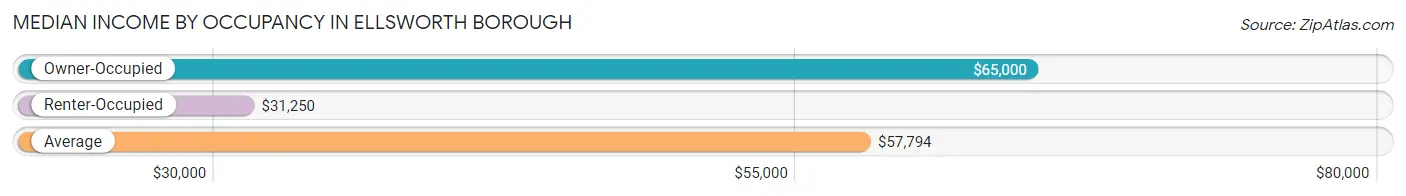
| Occupancy Type | # Households | Median Income |
| Owner-Occupied | 186 (67.9%) | $65,000 |
| Renter-Occupied | 88 (32.1%) | $31,250 |
| Average | 274 (100.0%) | $57,794 |
Occupancy by Householder Income Bracket in Ellsworth borough
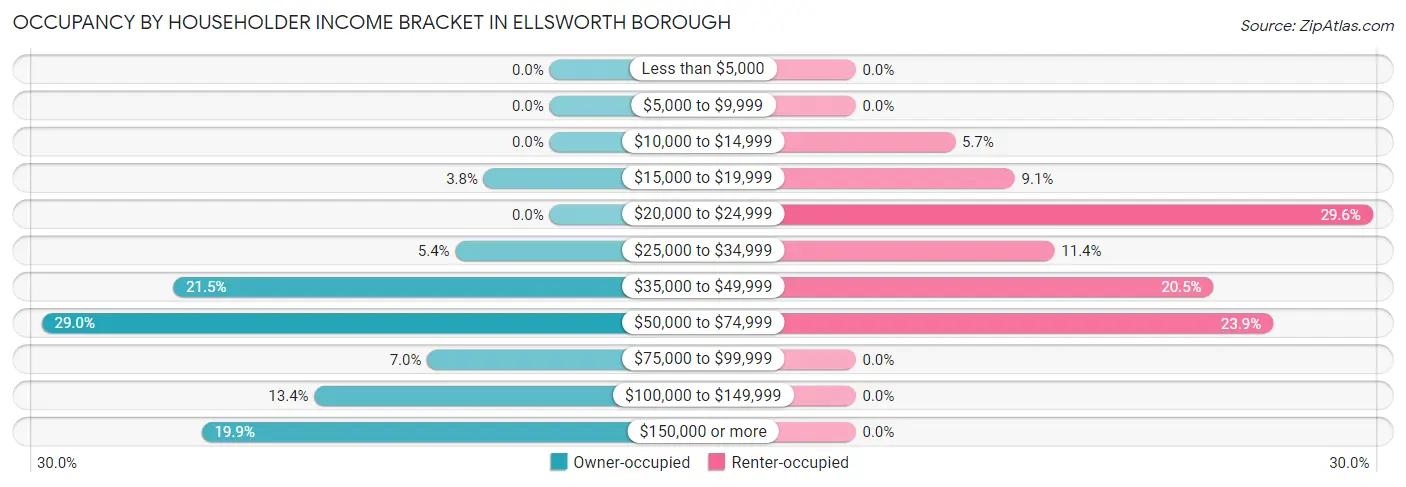
| Income Bracket | Owner-occupied | Renter-occupied |
| Less than $5,000 | 0 (0.0%) | 0 (0.0%) |
| $5,000 to $9,999 | 0 (0.0%) | 0 (0.0%) |
| $10,000 to $14,999 | 0 (0.0%) | 5 (5.7%) |
| $15,000 to $19,999 | 7 (3.8%) | 8 (9.1%) |
| $20,000 to $24,999 | 0 (0.0%) | 26 (29.5%) |
| $25,000 to $34,999 | 10 (5.4%) | 10 (11.4%) |
| $35,000 to $49,999 | 40 (21.5%) | 18 (20.4%) |
| $50,000 to $74,999 | 54 (29.0%) | 21 (23.9%) |
| $75,000 to $99,999 | 13 (7.0%) | 0 (0.0%) |
| $100,000 to $149,999 | 25 (13.4%) | 0 (0.0%) |
| $150,000 or more | 37 (19.9%) | 0 (0.0%) |
| Total | 186 (100.0%) | 88 (100.0%) |
Monthly Housing Cost Tiers in Ellsworth borough
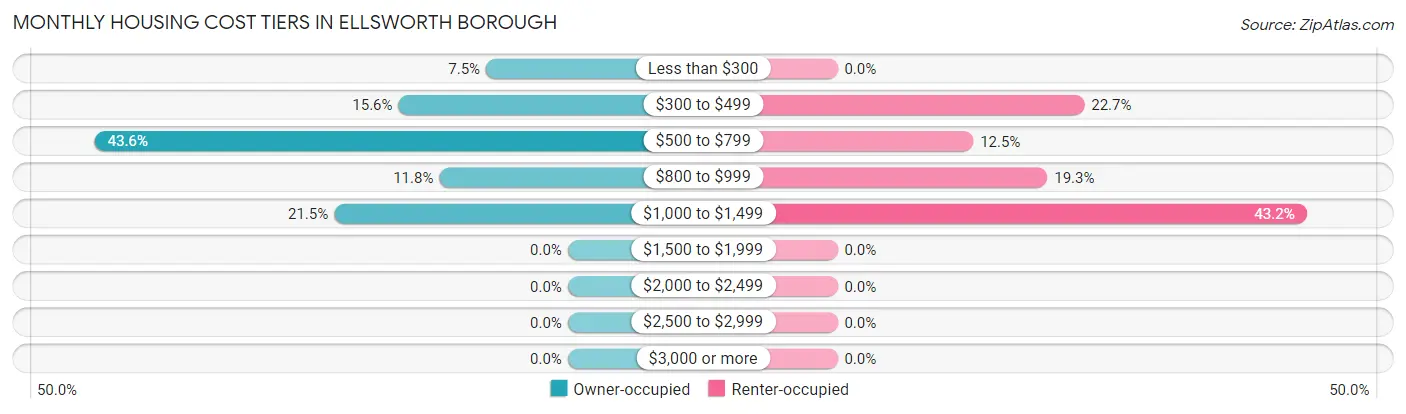
| Monthly Cost | Owner-occupied | Renter-occupied |
| Less than $300 | 14 (7.5%) | 0 (0.0%) |
| $300 to $499 | 29 (15.6%) | 20 (22.7%) |
| $500 to $799 | 81 (43.5%) | 11 (12.5%) |
| $800 to $999 | 22 (11.8%) | 17 (19.3%) |
| $1,000 to $1,499 | 40 (21.5%) | 38 (43.2%) |
| $1,500 to $1,999 | 0 (0.0%) | 0 (0.0%) |
| $2,000 to $2,499 | 0 (0.0%) | 0 (0.0%) |
| $2,500 to $2,999 | 0 (0.0%) | 0 (0.0%) |
| $3,000 or more | 0 (0.0%) | 0 (0.0%) |
| Total | 186 (100.0%) | 88 (100.0%) |
Physical Housing Characteristics in Ellsworth borough
Housing Structures in Ellsworth borough
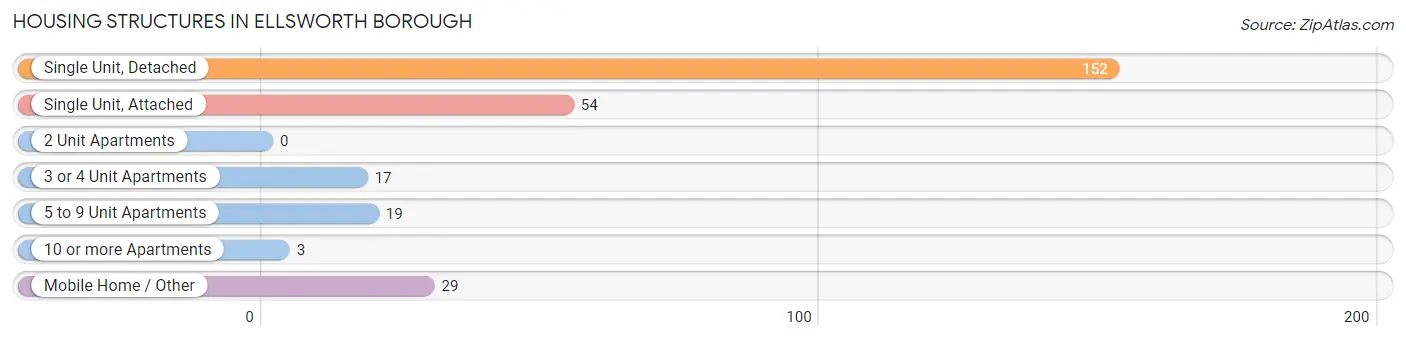
| Structure Type | # Housing Units | % Housing Units |
| Single Unit, Detached | 152 | 55.5% |
| Single Unit, Attached | 54 | 19.7% |
| 2 Unit Apartments | 0 | 0.0% |
| 3 or 4 Unit Apartments | 17 | 6.2% |
| 5 to 9 Unit Apartments | 19 | 6.9% |
| 10 or more Apartments | 3 | 1.1% |
| Mobile Home / Other | 29 | 10.6% |
| Total | 274 | 100.0% |
Housing Structures by Occupancy in Ellsworth borough
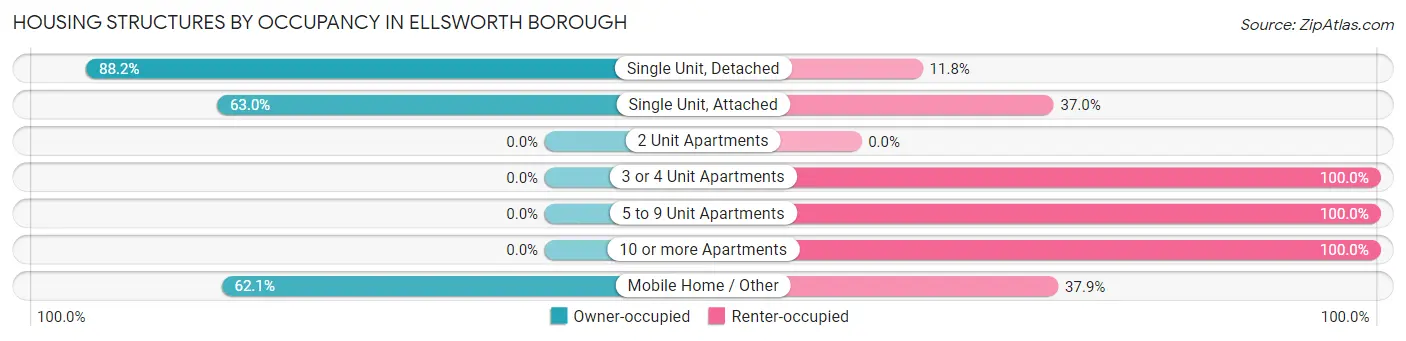
| Structure Type | Owner-occupied | Renter-occupied |
| Single Unit, Detached | 134 (88.2%) | 18 (11.8%) |
| Single Unit, Attached | 34 (63.0%) | 20 (37.0%) |
| 2 Unit Apartments | 0 (0.0%) | 0 (0.0%) |
| 3 or 4 Unit Apartments | 0 (0.0%) | 17 (100.0%) |
| 5 to 9 Unit Apartments | 0 (0.0%) | 19 (100.0%) |
| 10 or more Apartments | 0 (0.0%) | 3 (100.0%) |
| Mobile Home / Other | 18 (62.1%) | 11 (37.9%) |
| Total | 186 (67.9%) | 88 (32.1%) |
Housing Structures by Number of Rooms in Ellsworth borough
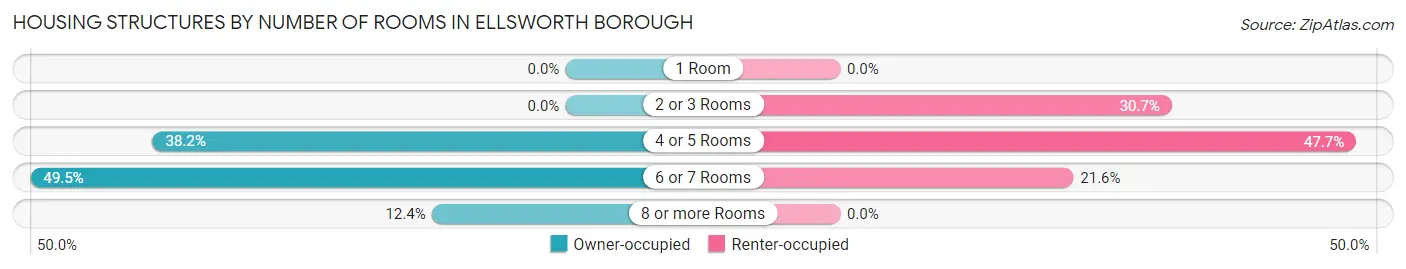
| Number of Rooms | Owner-occupied | Renter-occupied |
| 1 Room | 0 (0.0%) | 0 (0.0%) |
| 2 or 3 Rooms | 0 (0.0%) | 27 (30.7%) |
| 4 or 5 Rooms | 71 (38.2%) | 42 (47.7%) |
| 6 or 7 Rooms | 92 (49.5%) | 19 (21.6%) |
| 8 or more Rooms | 23 (12.4%) | 0 (0.0%) |
| Total | 186 (100.0%) | 88 (100.0%) |
Housing Structure by Heating Type in Ellsworth borough
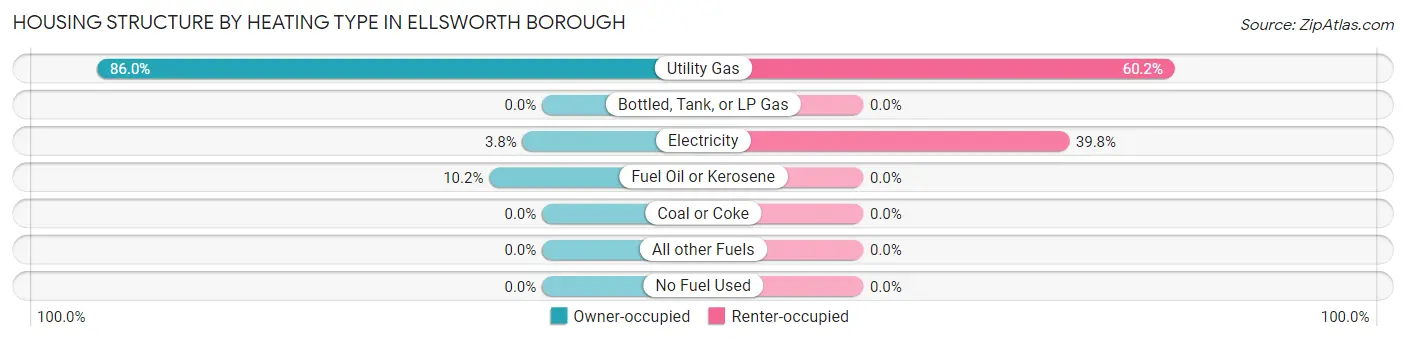
| Heating Type | Owner-occupied | Renter-occupied |
| Utility Gas | 160 (86.0%) | 53 (60.2%) |
| Bottled, Tank, or LP Gas | 0 (0.0%) | 0 (0.0%) |
| Electricity | 7 (3.8%) | 35 (39.8%) |
| Fuel Oil or Kerosene | 19 (10.2%) | 0 (0.0%) |
| Coal or Coke | 0 (0.0%) | 0 (0.0%) |
| All other Fuels | 0 (0.0%) | 0 (0.0%) |
| No Fuel Used | 0 (0.0%) | 0 (0.0%) |
| Total | 186 (100.0%) | 88 (100.0%) |
Household Vehicle Usage in Ellsworth borough
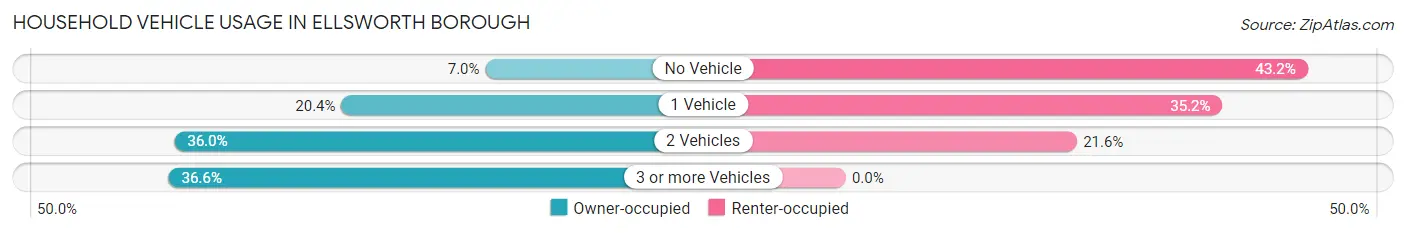
| Vehicles per Household | Owner-occupied | Renter-occupied |
| No Vehicle | 13 (7.0%) | 38 (43.2%) |
| 1 Vehicle | 38 (20.4%) | 31 (35.2%) |
| 2 Vehicles | 67 (36.0%) | 19 (21.6%) |
| 3 or more Vehicles | 68 (36.6%) | 0 (0.0%) |
| Total | 186 (100.0%) | 88 (100.0%) |
Real Estate & Mortgages in Ellsworth borough
Real Estate and Mortgage Overview in Ellsworth borough
| Characteristic | Without Mortgage | With Mortgage |
| Housing Units | 93 | 93 |
| Median Property Value | $99,500 | $93,900 |
| Median Household Income | $61,125 | $18 |
| Monthly Housing Costs | $518 | $0 |
| Real Estate Taxes | $1,237 | $8 |
Property Value by Mortgage Status in Ellsworth borough
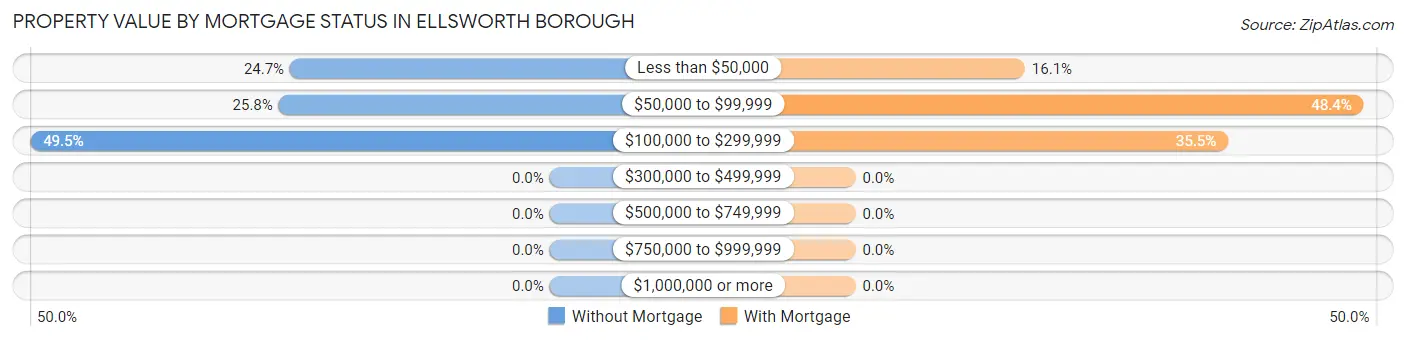
| Property Value | Without Mortgage | With Mortgage |
| Less than $50,000 | 23 (24.7%) | 15 (16.1%) |
| $50,000 to $99,999 | 24 (25.8%) | 45 (48.4%) |
| $100,000 to $299,999 | 46 (49.5%) | 33 (35.5%) |
| $300,000 to $499,999 | 0 (0.0%) | 0 (0.0%) |
| $500,000 to $749,999 | 0 (0.0%) | 0 (0.0%) |
| $750,000 to $999,999 | 0 (0.0%) | 0 (0.0%) |
| $1,000,000 or more | 0 (0.0%) | 0 (0.0%) |
| Total | 93 (100.0%) | 93 (100.0%) |
Household Income by Mortgage Status in Ellsworth borough
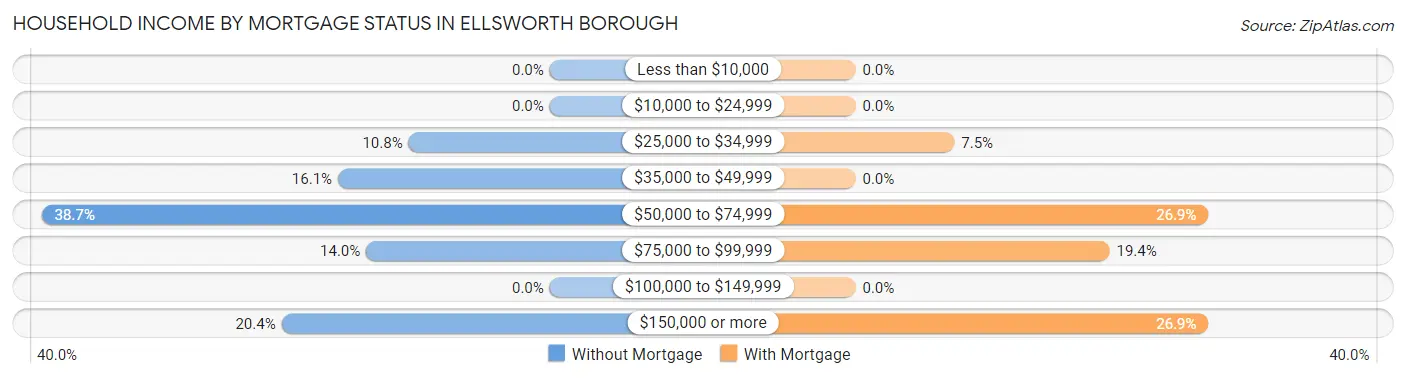
| Household Income | Without Mortgage | With Mortgage |
| Less than $10,000 | 0 (0.0%) | 0 (0.0%) |
| $10,000 to $24,999 | 0 (0.0%) | 0 (0.0%) |
| $25,000 to $34,999 | 10 (10.7%) | 7 (7.5%) |
| $35,000 to $49,999 | 15 (16.1%) | 0 (0.0%) |
| $50,000 to $74,999 | 36 (38.7%) | 25 (26.9%) |
| $75,000 to $99,999 | 13 (14.0%) | 18 (19.4%) |
| $100,000 to $149,999 | 0 (0.0%) | 0 (0.0%) |
| $150,000 or more | 19 (20.4%) | 25 (26.9%) |
| Total | 93 (100.0%) | 93 (100.0%) |
Property Value to Household Income Ratio in Ellsworth borough
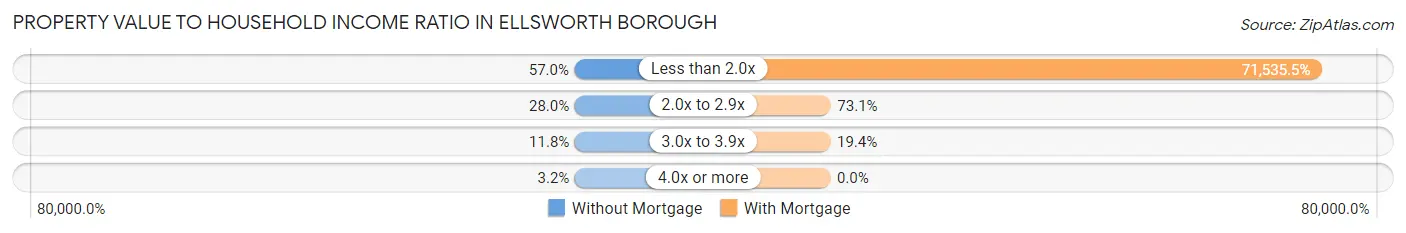
| Value-to-Income Ratio | Without Mortgage | With Mortgage |
| Less than 2.0x | 53 (57.0%) | 66,528 (71,535.5%) |
| 2.0x to 2.9x | 26 (28.0%) | 68 (73.1%) |
| 3.0x to 3.9x | 11 (11.8%) | 18 (19.4%) |
| 4.0x or more | 3 (3.2%) | 0 (0.0%) |
| Total | 93 (100.0%) | 93 (100.0%) |
Real Estate Taxes by Mortgage Status in Ellsworth borough
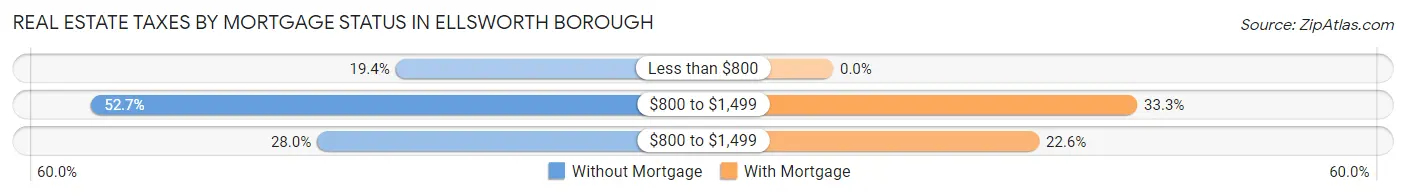
| Property Taxes | Without Mortgage | With Mortgage |
| Less than $800 | 18 (19.4%) | 0 (0.0%) |
| $800 to $1,499 | 49 (52.7%) | 31 (33.3%) |
| $800 to $1,499 | 26 (28.0%) | 21 (22.6%) |
| Total | 93 (100.0%) | 93 (100.0%) |
Health & Disability in Ellsworth borough
Health Insurance Coverage by Age in Ellsworth borough
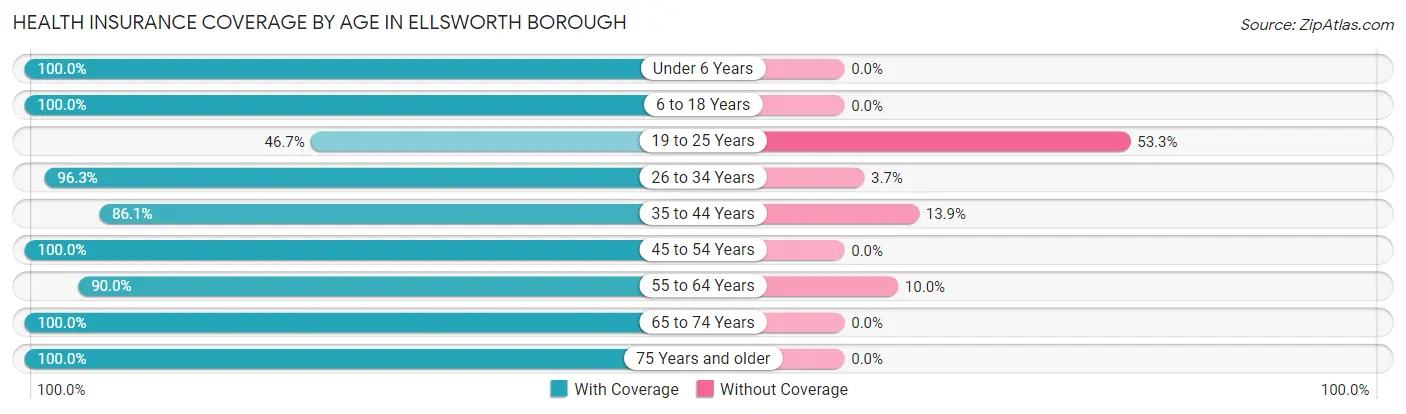
| Age Bracket | With Coverage | Without Coverage |
| Under 6 Years | 23 (100.0%) | 0 (0.0%) |
| 6 to 18 Years | 92 (100.0%) | 0 (0.0%) |
| 19 to 25 Years | 21 (46.7%) | 24 (53.3%) |
| 26 to 34 Years | 52 (96.3%) | 2 (3.7%) |
| 35 to 44 Years | 62 (86.1%) | 10 (13.9%) |
| 45 to 54 Years | 107 (100.0%) | 0 (0.0%) |
| 55 to 64 Years | 81 (90.0%) | 9 (10.0%) |
| 65 to 74 Years | 71 (100.0%) | 0 (0.0%) |
| 75 Years and older | 69 (100.0%) | 0 (0.0%) |
| Total | 578 (92.8%) | 45 (7.2%) |
Health Insurance Coverage by Citizenship Status in Ellsworth borough
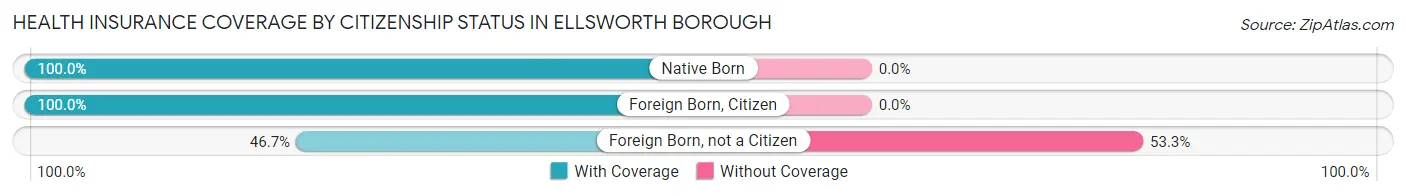
| Citizenship Status | With Coverage | Without Coverage |
| Native Born | 23 (100.0%) | 0 (0.0%) |
| Foreign Born, Citizen | 92 (100.0%) | 0 (0.0%) |
| Foreign Born, not a Citizen | 21 (46.7%) | 24 (53.3%) |
Health Insurance Coverage by Household Income in Ellsworth borough
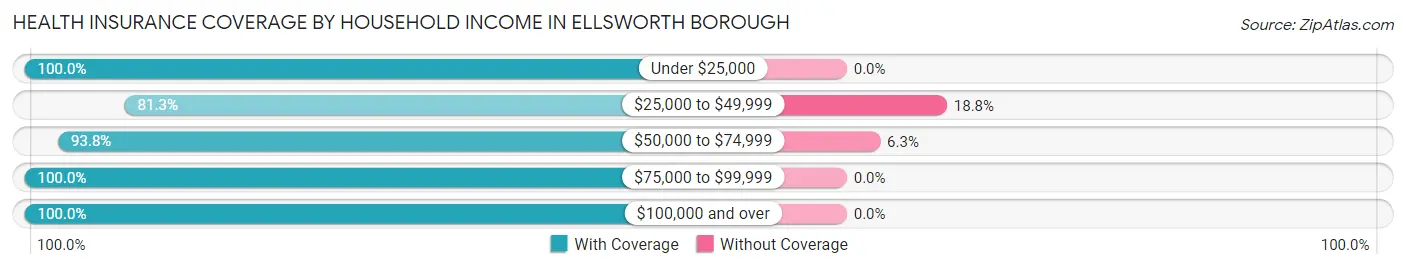
| Household Income | With Coverage | Without Coverage |
| Under $25,000 | 76 (100.0%) | 0 (0.0%) |
| $25,000 to $49,999 | 143 (81.2%) | 33 (18.8%) |
| $50,000 to $74,999 | 150 (93.8%) | 10 (6.2%) |
| $75,000 to $99,999 | 39 (100.0%) | 0 (0.0%) |
| $100,000 and over | 162 (100.0%) | 0 (0.0%) |
Public vs Private Health Insurance Coverage by Age in Ellsworth borough
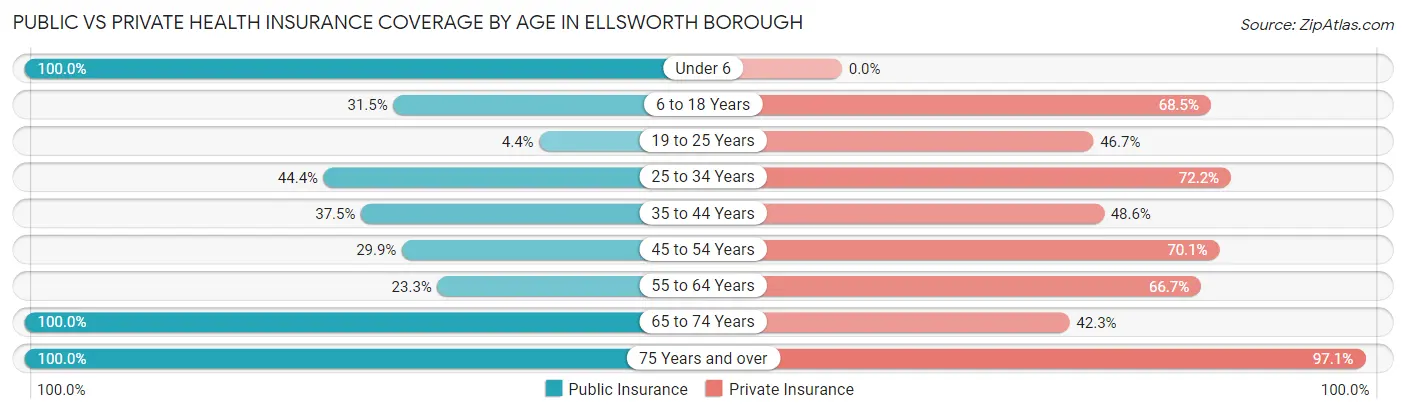
| Age Bracket | Public Insurance | Private Insurance |
| Under 6 | 23 (100.0%) | 0 (0.0%) |
| 6 to 18 Years | 29 (31.5%) | 63 (68.5%) |
| 19 to 25 Years | 2 (4.4%) | 21 (46.7%) |
| 25 to 34 Years | 24 (44.4%) | 39 (72.2%) |
| 35 to 44 Years | 27 (37.5%) | 35 (48.6%) |
| 45 to 54 Years | 32 (29.9%) | 75 (70.1%) |
| 55 to 64 Years | 21 (23.3%) | 60 (66.7%) |
| 65 to 74 Years | 71 (100.0%) | 30 (42.2%) |
| 75 Years and over | 69 (100.0%) | 67 (97.1%) |
| Total | 298 (47.8%) | 390 (62.6%) |
Disability Status by Sex by Age in Ellsworth borough
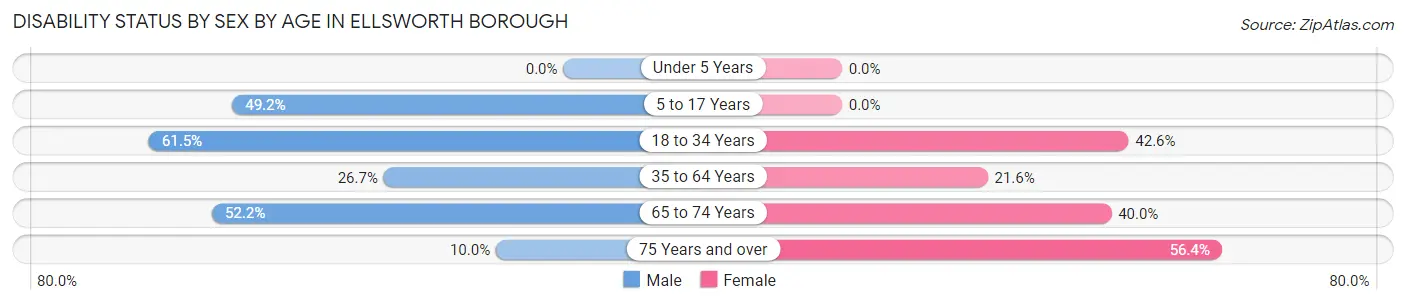
| Age Bracket | Male | Female |
| Under 5 Years | 0 (0.0%) | 0 (0.0%) |
| 5 to 17 Years | 29 (49.1%) | 0 (0.0%) |
| 18 to 34 Years | 32 (61.5%) | 20 (42.5%) |
| 35 to 64 Years | 36 (26.7%) | 29 (21.6%) |
| 65 to 74 Years | 24 (52.2%) | 10 (40.0%) |
| 75 Years and over | 3 (10.0%) | 22 (56.4%) |
Disability Class by Sex by Age in Ellsworth borough
Disability Class: Hearing Difficulty
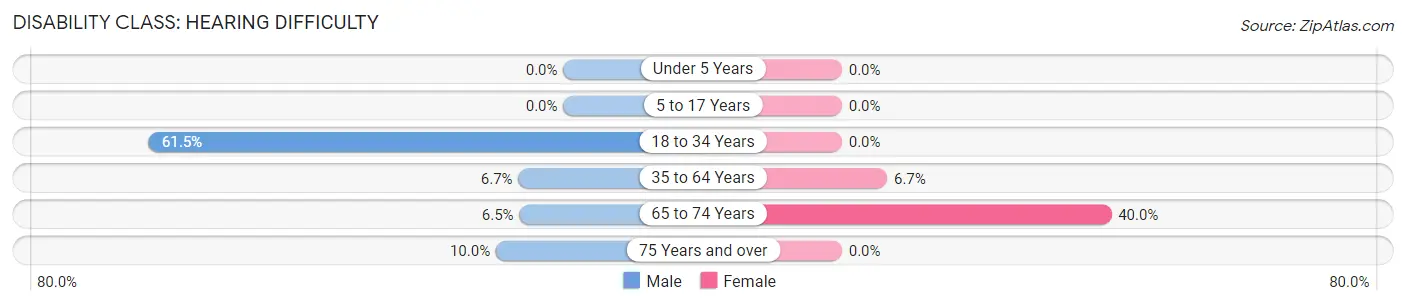
| Age Bracket | Male | Female |
| Under 5 Years | 0 (0.0%) | 0 (0.0%) |
| 5 to 17 Years | 0 (0.0%) | 0 (0.0%) |
| 18 to 34 Years | 32 (61.5%) | 0 (0.0%) |
| 35 to 64 Years | 9 (6.7%) | 9 (6.7%) |
| 65 to 74 Years | 3 (6.5%) | 10 (40.0%) |
| 75 Years and over | 3 (10.0%) | 0 (0.0%) |
Disability Class: Vision Difficulty
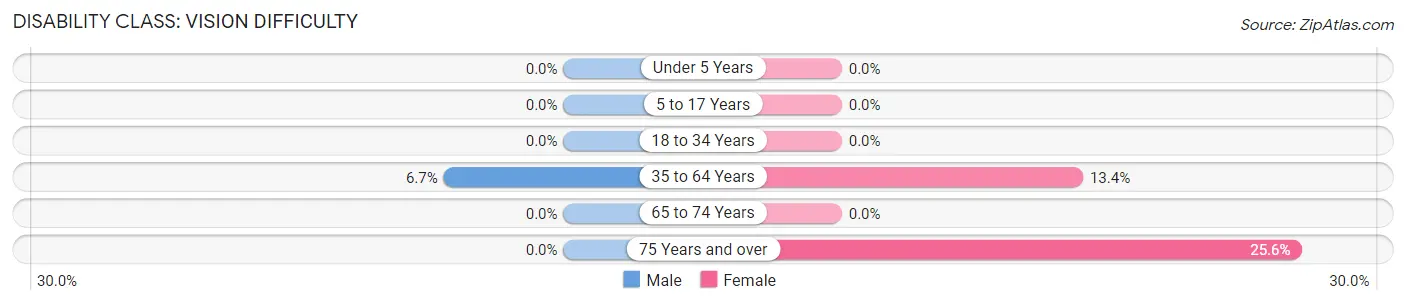
| Age Bracket | Male | Female |
| Under 5 Years | 0 (0.0%) | 0 (0.0%) |
| 5 to 17 Years | 0 (0.0%) | 0 (0.0%) |
| 18 to 34 Years | 0 (0.0%) | 0 (0.0%) |
| 35 to 64 Years | 9 (6.7%) | 18 (13.4%) |
| 65 to 74 Years | 0 (0.0%) | 0 (0.0%) |
| 75 Years and over | 0 (0.0%) | 10 (25.6%) |
Disability Class: Cognitive Difficulty
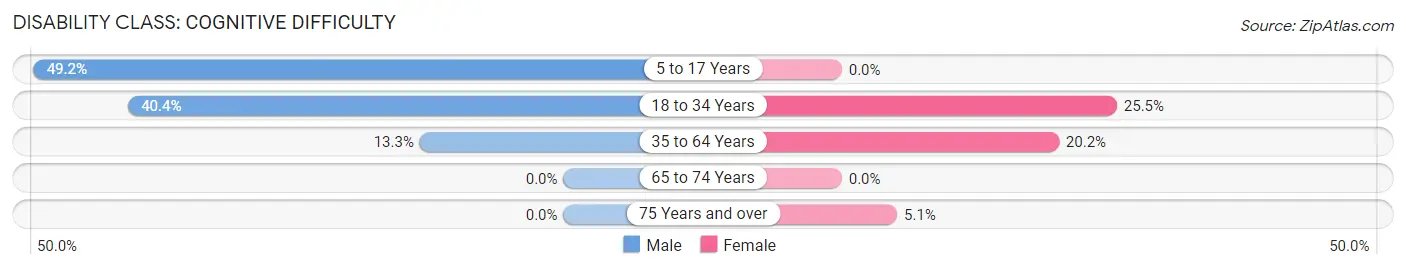
| Age Bracket | Male | Female |
| 5 to 17 Years | 29 (49.1%) | 0 (0.0%) |
| 18 to 34 Years | 21 (40.4%) | 12 (25.5%) |
| 35 to 64 Years | 18 (13.3%) | 27 (20.2%) |
| 65 to 74 Years | 0 (0.0%) | 0 (0.0%) |
| 75 Years and over | 0 (0.0%) | 2 (5.1%) |
Disability Class: Ambulatory Difficulty
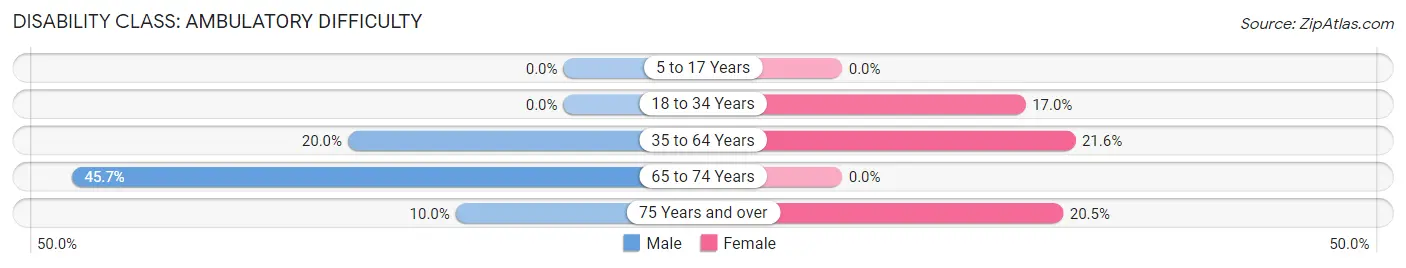
| Age Bracket | Male | Female |
| 5 to 17 Years | 0 (0.0%) | 0 (0.0%) |
| 18 to 34 Years | 0 (0.0%) | 8 (17.0%) |
| 35 to 64 Years | 27 (20.0%) | 29 (21.6%) |
| 65 to 74 Years | 21 (45.7%) | 0 (0.0%) |
| 75 Years and over | 3 (10.0%) | 8 (20.5%) |
Disability Class: Self-Care Difficulty
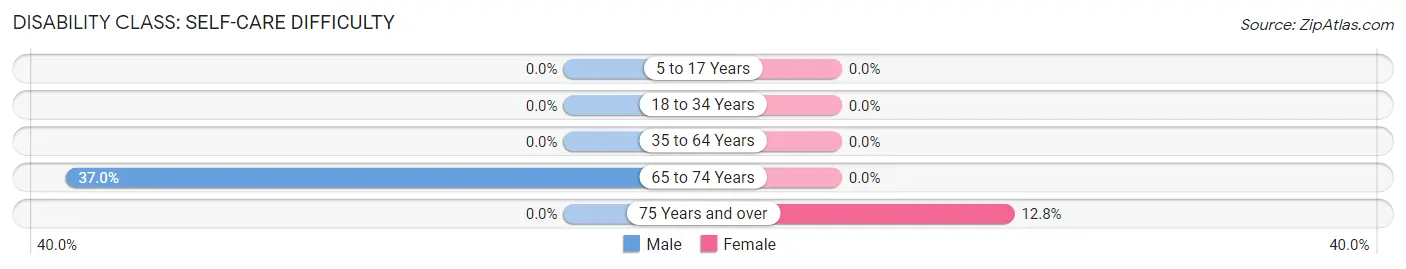
| Age Bracket | Male | Female |
| 5 to 17 Years | 0 (0.0%) | 0 (0.0%) |
| 18 to 34 Years | 0 (0.0%) | 0 (0.0%) |
| 35 to 64 Years | 0 (0.0%) | 0 (0.0%) |
| 65 to 74 Years | 17 (37.0%) | 0 (0.0%) |
| 75 Years and over | 0 (0.0%) | 5 (12.8%) |
Technology Access in Ellsworth borough
Computing Device Access in Ellsworth borough
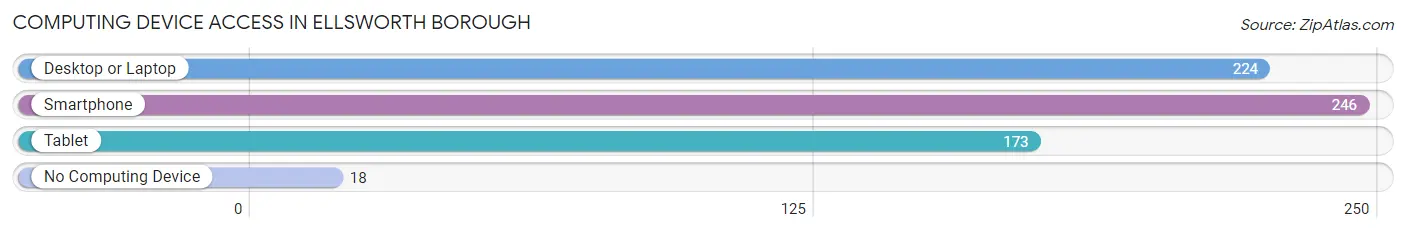
| Device Type | # Households | % Households |
| Desktop or Laptop | 224 | 81.8% |
| Smartphone | 246 | 89.8% |
| Tablet | 173 | 63.1% |
| No Computing Device | 18 | 6.6% |
| Total | 274 | 100.0% |
Internet Access in Ellsworth borough
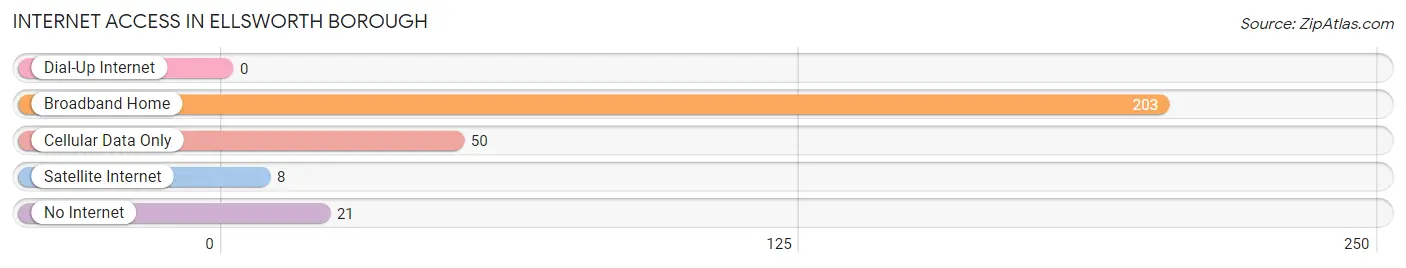
| Internet Type | # Households | % Households |
| Dial-Up Internet | 0 | 0.0% |
| Broadband Home | 203 | 74.1% |
| Cellular Data Only | 50 | 18.2% |
| Satellite Internet | 8 | 2.9% |
| No Internet | 21 | 7.7% |
| Total | 274 | 100.0% |
Ellsworth borough Summary
Ellsworth Borough is a small borough located in the Allegheny Mountains of Pennsylvania. It is situated in the northern part of the state, in the county of Clarion. The borough is located in the heart of the Allegheny National Forest, and is surrounded by the Allegheny River and its tributaries. The borough is home to a population of approximately 1,000 people, and is a popular destination for outdoor recreation and tourism.
History
The area that is now Ellsworth Borough was first settled in the late 1700s by a group of settlers from New England. The settlers were attracted to the area due to its abundance of natural resources, including timber and coal. The first permanent settlement in the area was established in 1820, and the town was named after the Ellsworth family, who were among the first settlers.
In 1836, the borough was officially incorporated, and the first mayor was elected. The town quickly grew, and by the late 1800s, it had become a thriving community with a population of over 1,000 people. The town was home to several businesses, including a sawmill, a gristmill, a tannery, and a blacksmith shop.
Geography
Ellsworth Borough is located in the northern part of Pennsylvania, in the county of Clarion. The borough is situated in the Allegheny Mountains, and is surrounded by the Allegheny River and its tributaries. The borough is located in the heart of the Allegheny National Forest, and is home to a variety of wildlife, including deer, bear, and turkey. The borough is also home to several state parks, including Clear Creek State Park and Cook Forest State Park.
Economy
The economy of Ellsworth Borough is largely based on tourism and outdoor recreation. The borough is home to several state parks, which attract visitors from all over the country. The borough is also home to several businesses, including restaurants, hotels, and retail stores. The borough is also home to several manufacturing companies, including a sawmill, a gristmill, and a tannery.
Demographics
As of the 2010 census, the population of Ellsworth Borough was 1,000 people. The racial makeup of the borough was 97.2% White, 0.7% African American, 0.2% Native American, 0.2% Asian, 0.2% from other races, and 1.7% from two or more races. The median household income in the borough was $37,500, and the median family income was $45,000. The per capita income in the borough was $19,000.
Conclusion
Ellsworth Borough is a small borough located in the Allegheny Mountains of Pennsylvania. It is home to a population of approximately 1,000 people, and is a popular destination for outdoor recreation and tourism. The economy of the borough is largely based on tourism and outdoor recreation, and the borough is home to several businesses, including restaurants, hotels, and retail stores. The racial makeup of the borough is predominantly White, and the median household income is $37,500.
Common Questions
What is the Total Population of Ellsworth borough?
Total Population of Ellsworth borough is 623.
What is the Total Male Population of Ellsworth borough?
Total Male Population of Ellsworth borough is 322.
What is the Total Female Population of Ellsworth borough?
Total Female Population of Ellsworth borough is 301.
What is the Ratio of Males per 100 Females in Ellsworth borough?
There are 106.98 Males per 100 Females in Ellsworth borough.
What is the Ratio of Females per 100 Males in Ellsworth borough?
There are 93.48 Females per 100 Males in Ellsworth borough.
What is the Median Population Age in Ellsworth borough?
Median Population Age in Ellsworth borough is 46.3 Years.
What is the Average Family Size in Ellsworth borough
Average Family Size in Ellsworth borough is 2.8 People.
What is the Average Household Size in Ellsworth borough
Average Household Size in Ellsworth borough is 2.2 People.
What is Per Capita Income in Ellsworth borough?
Per Capita income in Ellsworth borough is $34,177.
What is the Median Family Income in Ellsworth borough?
Median Family Income in Ellsworth borough is $59,191.
What is the Median Household income in Ellsworth borough?
Median Household Income in Ellsworth borough is $57,794.
What is Income or Wage Gap in Ellsworth borough?
Income or Wage Gap in Ellsworth borough is 49.8%.
Women in Ellsworth borough earn 50.2 cents for every dollar earned by a man.
What is Inequality or Gini Index in Ellsworth borough?
Inequality or Gini Index in Ellsworth borough is 0.41.
How Large is the Labor Force in Ellsworth borough?
There are 326 People in the Labor Forcein in Ellsworth borough.
What is the Percentage of People in the Labor Force in Ellsworth borough?
61.3% of People are in the Labor Force in Ellsworth borough.
What is the Unemployment Rate in Ellsworth borough?
Unemployment Rate in Ellsworth borough is 13.2%.