Cherry Valley borough, PA
Cherry Valley borough Overview
60
TOTAL POPULATION
32
MALE POPULATION
28
FEMALE POPULATION
114.29
MALES / 100 FEMALES
87.50
FEMALES / 100 MALES
62.0
MEDIAN AGE
2.3
AVG FAMILY SIZE
1.6
AVG HOUSEHOLD SIZE
$30,847
PER CAPITA INCOME
$35,000
AVG FAMILY INCOME
$41,875
AVG HOUSEHOLD INCOME
0.35
INEQUALITY / GINI INDEX
24
LABOR FORCE [ PEOPLE ]
43.6%
PERCENT IN LABOR FORCE
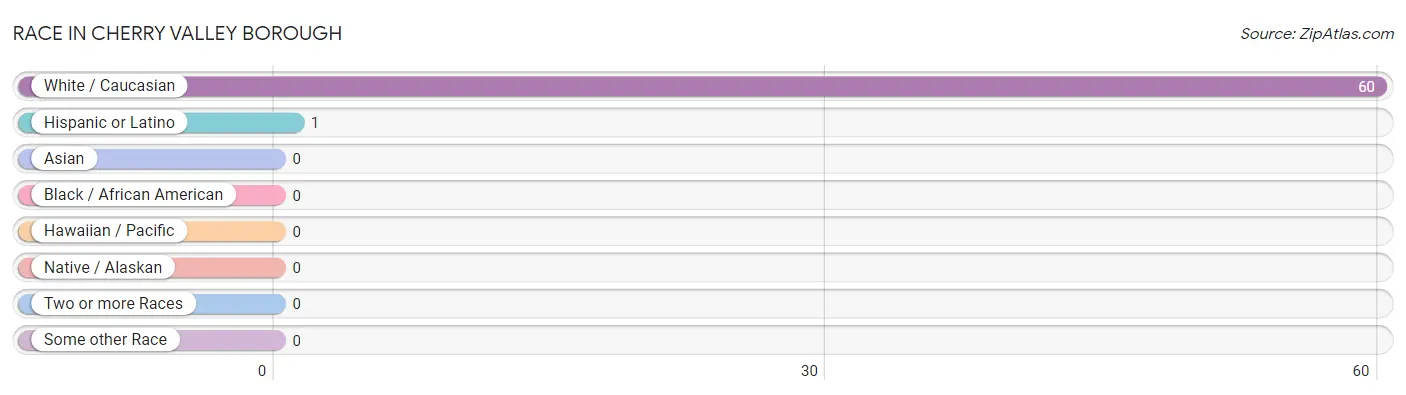
Race in Cherry Valley borough
The most populous races in Cherry Valley borough are White / Caucasian (60 | 100.0%), and Hispanic or Latino (1 | 1.7%).
| Race | # Population | % Population |
| Asian | 0 | 0.0% |
| Black / African American | 0 | 0.0% |
| Hawaiian / Pacific | 0 | 0.0% |
| Hispanic or Latino | 1 | 1.7% |
| Native / Alaskan | 0 | 0.0% |
| White / Caucasian | 60 | 100.0% |
| Two or more Races | 0 | 0.0% |
| Some other Race | 0 | 0.0% |
| Total | 60 | 100.0% |
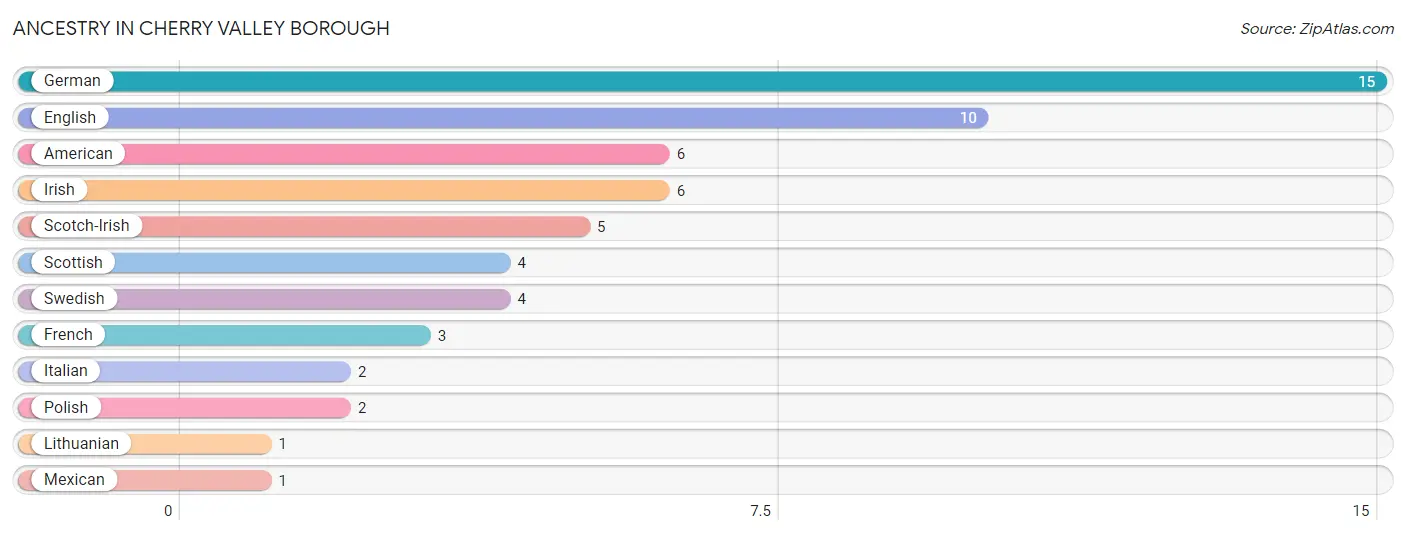
Ancestry in Cherry Valley borough
The most populous ancestries reported in Cherry Valley borough are German (15 | 25.0%), English (10 | 16.7%), American (6 | 10.0%), Irish (6 | 10.0%), and Scotch-Irish (5 | 8.3%), together accounting for 70.0% of all Cherry Valley borough residents.
| Ancestry | # Population | % Population |
| American | 6 | 10.0% |
| English | 10 | 16.7% |
| French | 3 | 5.0% |
| German | 15 | 25.0% |
| Irish | 6 | 10.0% |
| Italian | 2 | 3.3% |
| Lithuanian | 1 | 1.7% |
| Mexican | 1 | 1.7% |
| Polish | 2 | 3.3% |
| Scotch-Irish | 5 | 8.3% |
| Scottish | 4 | 6.7% |
| Swedish | 4 | 6.7% | View All 12 Rows |
Immigrants in Cherry Valley borough

| Immigration Origin | # Population | % Population | View All 0 Rows |
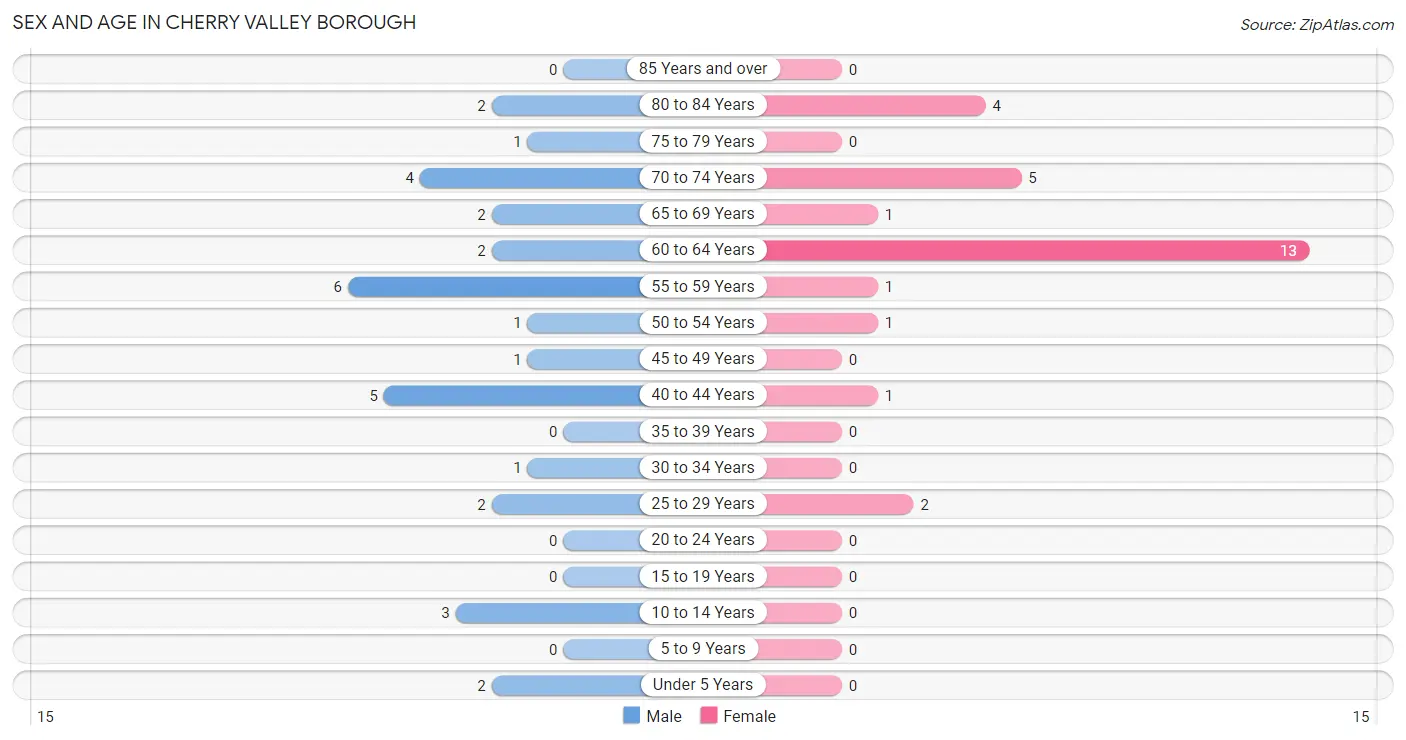
Sex and Age in Cherry Valley borough
Sex and Age in Cherry Valley borough
The most populous age groups in Cherry Valley borough are 55 to 59 Years (6 | 18.8%) for men and 60 to 64 Years (13 | 46.4%) for women.
| Age Bracket | Male | Female |
| Under 5 Years | 2 (6.2%) | 0 (0.0%) |
| 5 to 9 Years | 0 (0.0%) | 0 (0.0%) |
| 10 to 14 Years | 3 (9.4%) | 0 (0.0%) |
| 15 to 19 Years | 0 (0.0%) | 0 (0.0%) |
| 20 to 24 Years | 0 (0.0%) | 0 (0.0%) |
| 25 to 29 Years | 2 (6.2%) | 2 (7.1%) |
| 30 to 34 Years | 1 (3.1%) | 0 (0.0%) |
| 35 to 39 Years | 0 (0.0%) | 0 (0.0%) |
| 40 to 44 Years | 5 (15.6%) | 1 (3.6%) |
| 45 to 49 Years | 1 (3.1%) | 0 (0.0%) |
| 50 to 54 Years | 1 (3.1%) | 1 (3.6%) |
| 55 to 59 Years | 6 (18.8%) | 1 (3.6%) |
| 60 to 64 Years | 2 (6.2%) | 13 (46.4%) |
| 65 to 69 Years | 2 (6.2%) | 1 (3.6%) |
| 70 to 74 Years | 4 (12.5%) | 5 (17.9%) |
| 75 to 79 Years | 1 (3.1%) | 0 (0.0%) |
| 80 to 84 Years | 2 (6.2%) | 4 (14.3%) |
| 85 Years and over | 0 (0.0%) | 0 (0.0%) |
| Total | 32 (100.0%) | 28 (100.0%) |
Families and Households in Cherry Valley borough
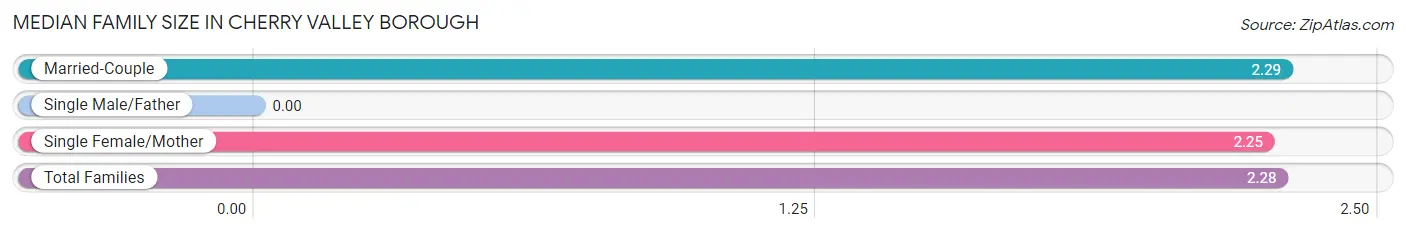
Median Family Size in Cherry Valley borough
| Family Type | # Families | Family Size |
| Married-Couple | 14 (77.8%) | 2.29 |
| Single Male/Father | 0 (0.0%) | - |
| Single Female/Mother | 4 (22.2%) | 2.25 |
| Total Families | 18 (100.0%) | 2.28 |
Median Household Size in Cherry Valley borough
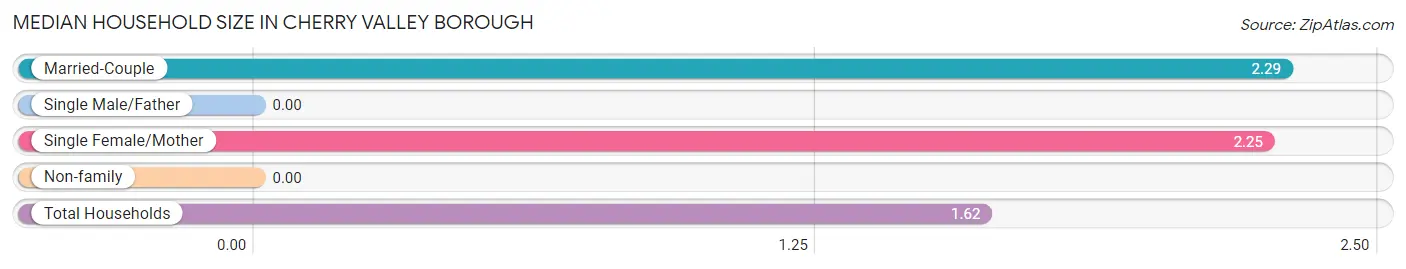
| Household Type | # Households | Household Size |
| Married-Couple | 14 (37.8%) | 2.29 |
| Single Male/Father | 0 (0.0%) | - |
| Single Female/Mother | 4 (10.8%) | 2.25 |
| Non-family | 19 (51.3%) | - |
| Total Households | 37 (100.0%) | 1.62 |
Household Size by Marriage Status in Cherry Valley borough
Out of a total of 37 households in Cherry Valley borough, 18 (48.6%) are family households, while 19 (51.3%) are nonfamily households. The most numerous type of family households are 2-person households, comprising 15, and the most common type of nonfamily households are 1-person households, comprising 19.
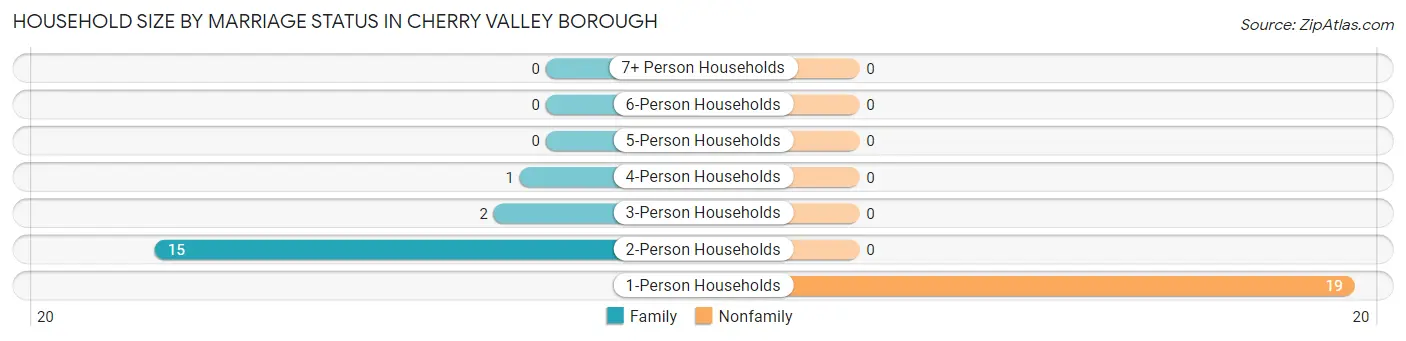
| Household Size | Family Households | Nonfamily Households |
| 1-Person Households | - | 19 (51.3%) |
| 2-Person Households | 15 (40.5%) | 0 (0.0%) |
| 3-Person Households | 2 (5.4%) | 0 (0.0%) |
| 4-Person Households | 1 (2.7%) | 0 (0.0%) |
| 5-Person Households | 0 (0.0%) | 0 (0.0%) |
| 6-Person Households | 0 (0.0%) | 0 (0.0%) |
| 7+ Person Households | 0 (0.0%) | 0 (0.0%) |
| Total | 18 (48.6%) | 19 (51.3%) |
Female Fertility in Cherry Valley borough
Fertility by Age in Cherry Valley borough
Average fertility rate in Cherry Valley borough is 667.0 births per 1,000 women. Women in the age bracket of 20 to 34 years have the highest fertility rate with 1,000.0 births per 1,000 women. Women in the age bracket of 20 to 34 years acount for 100.0% of all women with births.
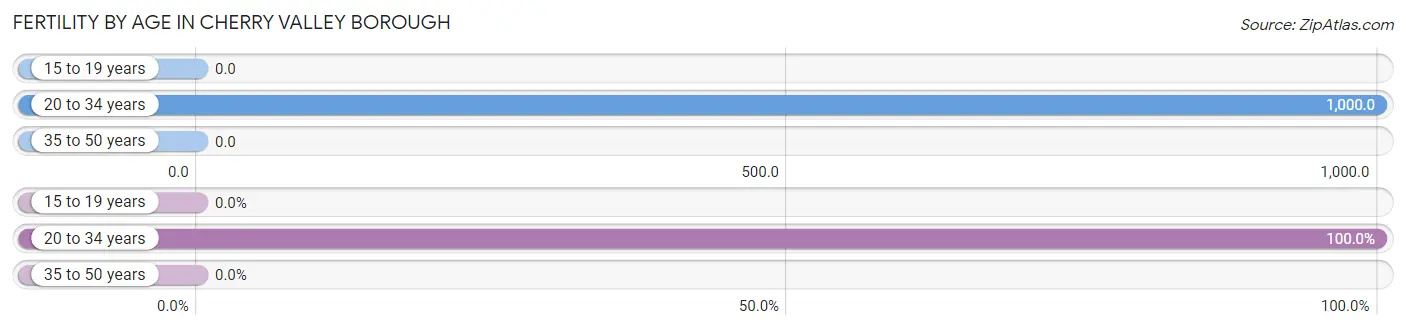
| Age Bracket | Women with Births | Births / 1,000 Women |
| 15 to 19 years | 0 (0.0%) | 0.0 |
| 20 to 34 years | 2 (100.0%) | 1,000.0 |
| 35 to 50 years | 0 (0.0%) | 0.0 |
| Total | 2 (100.0%) | 667.0 |
Fertility by Age by Marriage Status in Cherry Valley borough
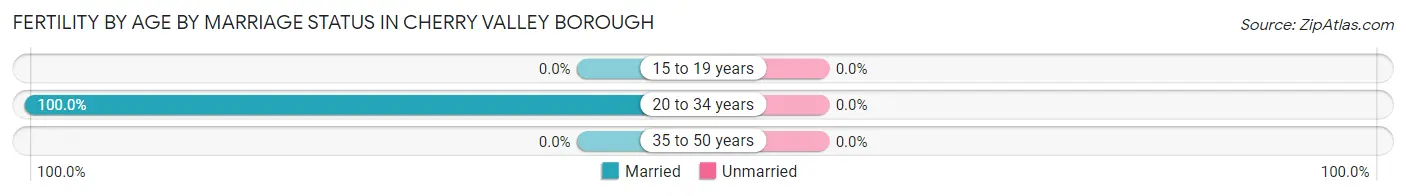
| Age Bracket | Married | Unmarried |
| 15 to 19 years | 0 (0.0%) | 0 (0.0%) |
| 20 to 34 years | 2 (100.0%) | 0 (0.0%) |
| 35 to 50 years | 0 (0.0%) | 0 (0.0%) |
| Total | 2 (100.0%) | 0 (0.0%) |
Fertility by Education in Cherry Valley borough
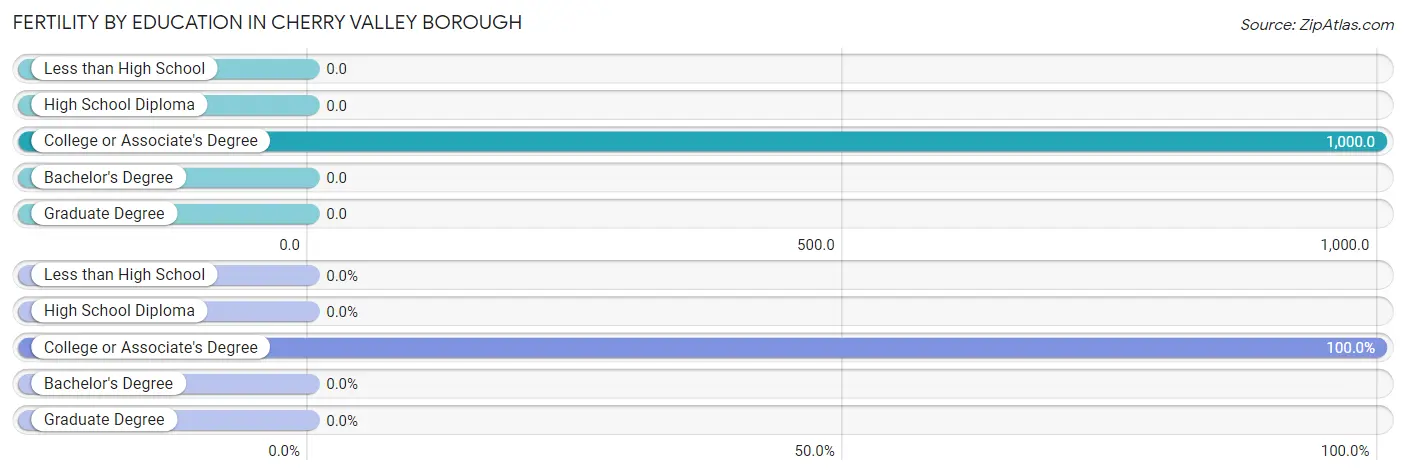
| Educational Attainment | Women with Births | Births / 1,000 Women |
| Less than High School | 0 (0.0%) | 0.0 |
| High School Diploma | 0 (0.0%) | 0.0 |
| College or Associate's Degree | 2 (100.0%) | 1,000.0 |
| Bachelor's Degree | 0 (0.0%) | 0.0 |
| Graduate Degree | 0 (0.0%) | 0.0 |
| Total | 2 (100.0%) | 667.0 |
Fertility by Education by Marriage Status in Cherry Valley borough
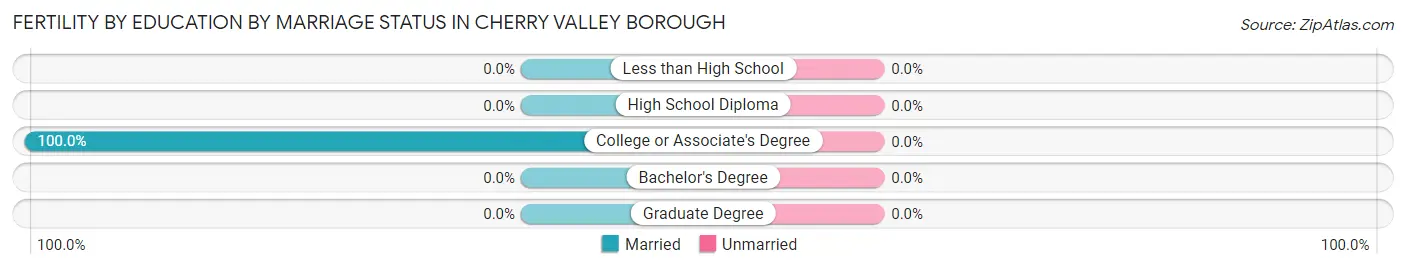
| Educational Attainment | Married | Unmarried |
| Less than High School | 0 (0.0%) | 0 (0.0%) |
| High School Diploma | 0 (0.0%) | 0 (0.0%) |
| College or Associate's Degree | 2 (100.0%) | 0 (0.0%) |
| Bachelor's Degree | 0 (0.0%) | 0 (0.0%) |
| Graduate Degree | 0 (0.0%) | 0 (0.0%) |
| Total | 2 (100.0%) | 0 (0.0%) |
Income in Cherry Valley borough
Income Overview in Cherry Valley borough
Per Capita Income in Cherry Valley borough is $30,847, while median incomes of families and households are $35,000 and $41,875 respectively.
| Characteristic | Number | Measure |
| Per Capita Income | 60 | $30,847 |
| Median Family Income | 18 | $35,000 |
| Mean Family Income | 18 | $57,744 |
| Median Household Income | 37 | $41,875 |
| Mean Household Income | 37 | $50,835 |
| Income Deficit | 18 | $0 |
| Wage / Income Gap (%) | 60 | 0.00% |
| Wage / Income Gap ($) | 60 | 100.00¢ per $1 |
| Gini / Inequality Index | 60 | 0.35 |
Earnings by Sex in Cherry Valley borough
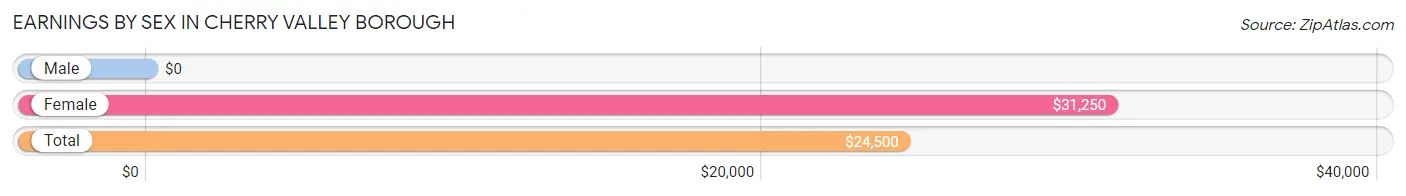
| Sex | Number | Average Earnings |
| Male | 17 (70.8%) | $0 |
| Female | 7 (29.2%) | $31,250 |
| Total | 24 (100.0%) | $24,500 |
Earnings by Sex by Income Bracket in Cherry Valley borough
The most common earnings brackets in Cherry Valley borough are $2,499 or less for men (5 | 29.4%) and $30,000 to $34,999 for women (3 | 42.9%).
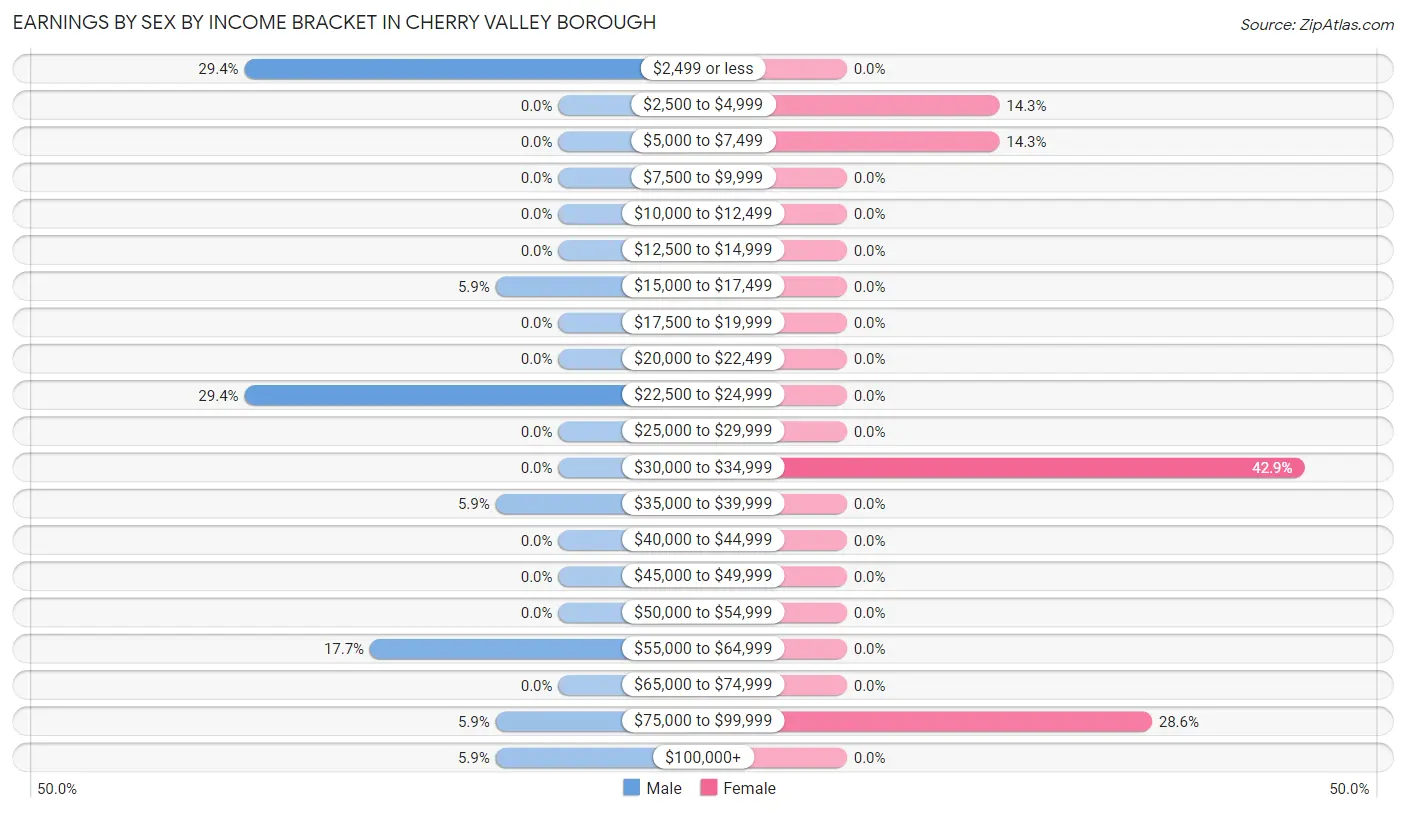
| Income | Male | Female |
| $2,499 or less | 5 (29.4%) | 0 (0.0%) |
| $2,500 to $4,999 | 0 (0.0%) | 1 (14.3%) |
| $5,000 to $7,499 | 0 (0.0%) | 1 (14.3%) |
| $7,500 to $9,999 | 0 (0.0%) | 0 (0.0%) |
| $10,000 to $12,499 | 0 (0.0%) | 0 (0.0%) |
| $12,500 to $14,999 | 0 (0.0%) | 0 (0.0%) |
| $15,000 to $17,499 | 1 (5.9%) | 0 (0.0%) |
| $17,500 to $19,999 | 0 (0.0%) | 0 (0.0%) |
| $20,000 to $22,499 | 0 (0.0%) | 0 (0.0%) |
| $22,500 to $24,999 | 5 (29.4%) | 0 (0.0%) |
| $25,000 to $29,999 | 0 (0.0%) | 0 (0.0%) |
| $30,000 to $34,999 | 0 (0.0%) | 3 (42.9%) |
| $35,000 to $39,999 | 1 (5.9%) | 0 (0.0%) |
| $40,000 to $44,999 | 0 (0.0%) | 0 (0.0%) |
| $45,000 to $49,999 | 0 (0.0%) | 0 (0.0%) |
| $50,000 to $54,999 | 0 (0.0%) | 0 (0.0%) |
| $55,000 to $64,999 | 3 (17.6%) | 0 (0.0%) |
| $65,000 to $74,999 | 0 (0.0%) | 0 (0.0%) |
| $75,000 to $99,999 | 1 (5.9%) | 2 (28.6%) |
| $100,000+ | 1 (5.9%) | 0 (0.0%) |
| Total | 17 (100.0%) | 7 (100.0%) |
Earnings by Sex by Educational Attainment in Cherry Valley borough
| Educational Attainment | Male Income | Female Income |
| Less than High School | - | - |
| High School Diploma | - | - |
| College or Associate's Degree | - | - |
| Bachelor's Degree | - | - |
| Graduate Degree | - | - |
| Total | - | - |
Family Income in Cherry Valley borough
Family Income Brackets in Cherry Valley borough
According to the Cherry Valley borough family income data, there are 5 families falling into the $25,000 to $34,999 income range, which is the most common income bracket and makes up 27.8% of all families.
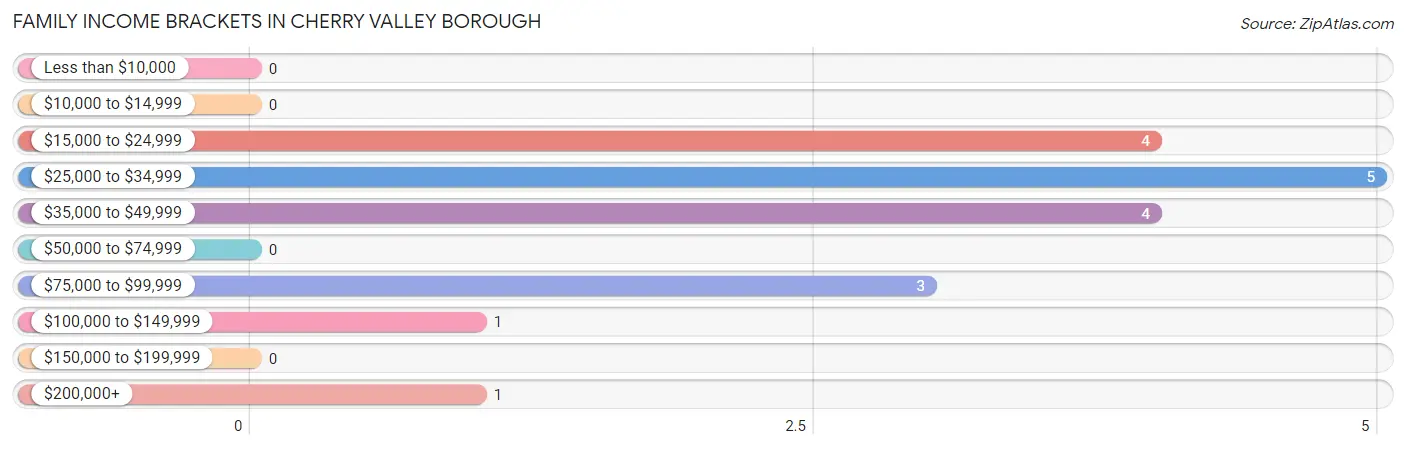
| Income Bracket | # Families | % Families |
| Less than $10,000 | 0 | 0.0% |
| $10,000 to $14,999 | 0 | 0.0% |
| $15,000 to $24,999 | 4 | 22.2% |
| $25,000 to $34,999 | 5 | 27.8% |
| $35,000 to $49,999 | 4 | 22.2% |
| $50,000 to $74,999 | 0 | 0.0% |
| $75,000 to $99,999 | 3 | 16.7% |
| $100,000 to $149,999 | 1 | 5.6% |
| $150,000 to $199,999 | 0 | 0.0% |
| $200,000+ | 1 | 5.6% |
Family Income by Famaliy Size in Cherry Valley borough
2-person families (15 | 83.3%) account for the highest median family income in Cherry Valley borough with $29,688 per family, while 2-person families (15 | 83.3%) have the highest median income of $14,844 per family member.

| Income Bracket | # Families | Median Income |
| 2-Person Families | 15 (83.3%) | $29,688 |
| 3-Person Families | 2 (11.1%) | $0 |
| 4-Person Families | 1 (5.6%) | $0 |
| 5-Person Families | 0 (0.0%) | $0 |
| 6-Person Families | 0 (0.0%) | $0 |
| 7+ Person Families | 0 (0.0%) | $0 |
| Total | 18 (100.0%) | $35,000 |
Family Income by Number of Earners in Cherry Valley borough
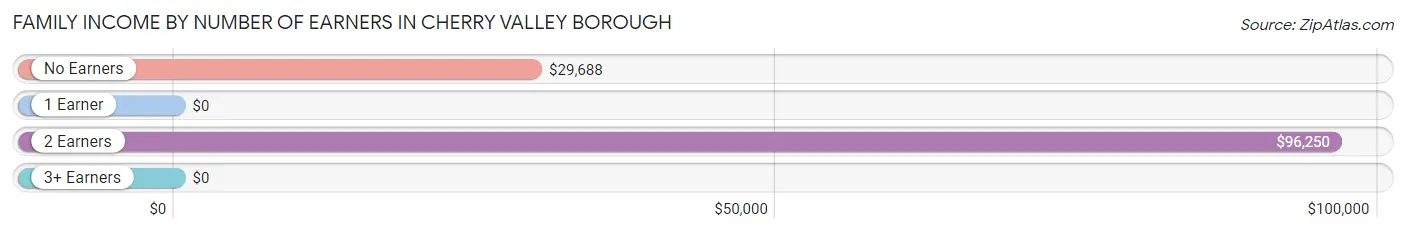
| Number of Earners | # Families | Median Income |
| No Earners | 7 (38.9%) | $29,688 |
| 1 Earner | 5 (27.8%) | $0 |
| 2 Earners | 6 (33.3%) | $96,250 |
| 3+ Earners | 0 (0.0%) | $0 |
| Total | 18 (100.0%) | $35,000 |
Household Income in Cherry Valley borough
Household Income Brackets in Cherry Valley borough
With 15 households falling in the category, the $35,000 to $49,999 income range is the most frequent in Cherry Valley borough, accounting for 40.5% of all households.
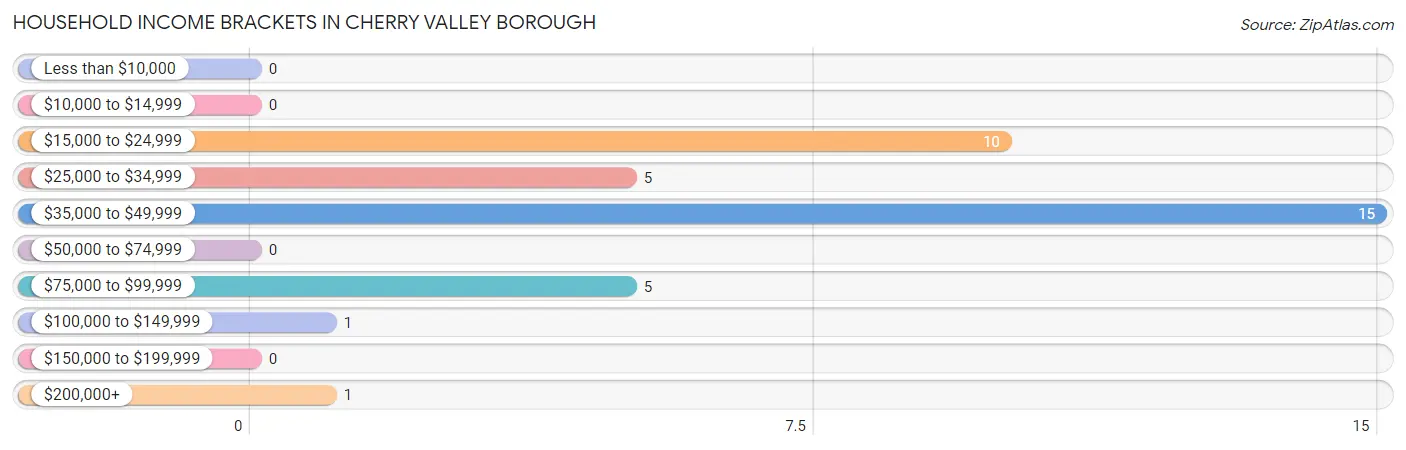
| Income Bracket | # Households | % Households |
| Less than $10,000 | 0 | 0.0% |
| $10,000 to $14,999 | 0 | 0.0% |
| $15,000 to $24,999 | 10 | 27.0% |
| $25,000 to $34,999 | 5 | 13.5% |
| $35,000 to $49,999 | 15 | 40.5% |
| $50,000 to $74,999 | 0 | 0.0% |
| $75,000 to $99,999 | 5 | 13.5% |
| $100,000 to $149,999 | 1 | 2.7% |
| $150,000 to $199,999 | 0 | 0.0% |
| $200,000+ | 1 | 2.7% |
Household Income by Householder Age in Cherry Valley borough
The median household income in Cherry Valley borough is $41,875, with the highest median household income of $48,750 found in the 45 to 64 years age bracket for the primary householder. A total of 16 households (43.2%) fall into this category.
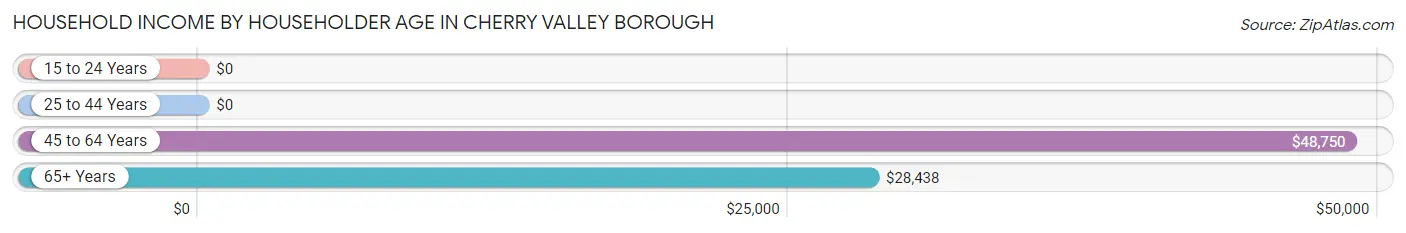
| Income Bracket | # Households | Median Income |
| 15 to 24 Years | 0 (0.0%) | $0 |
| 25 to 44 Years | 8 (21.6%) | $0 |
| 45 to 64 Years | 16 (43.2%) | $48,750 |
| 65+ Years | 13 (35.1%) | $28,438 |
| Total | 37 (100.0%) | $41,875 |
Poverty in Cherry Valley borough
Income Below Poverty by Sex and Age in Cherry Valley borough
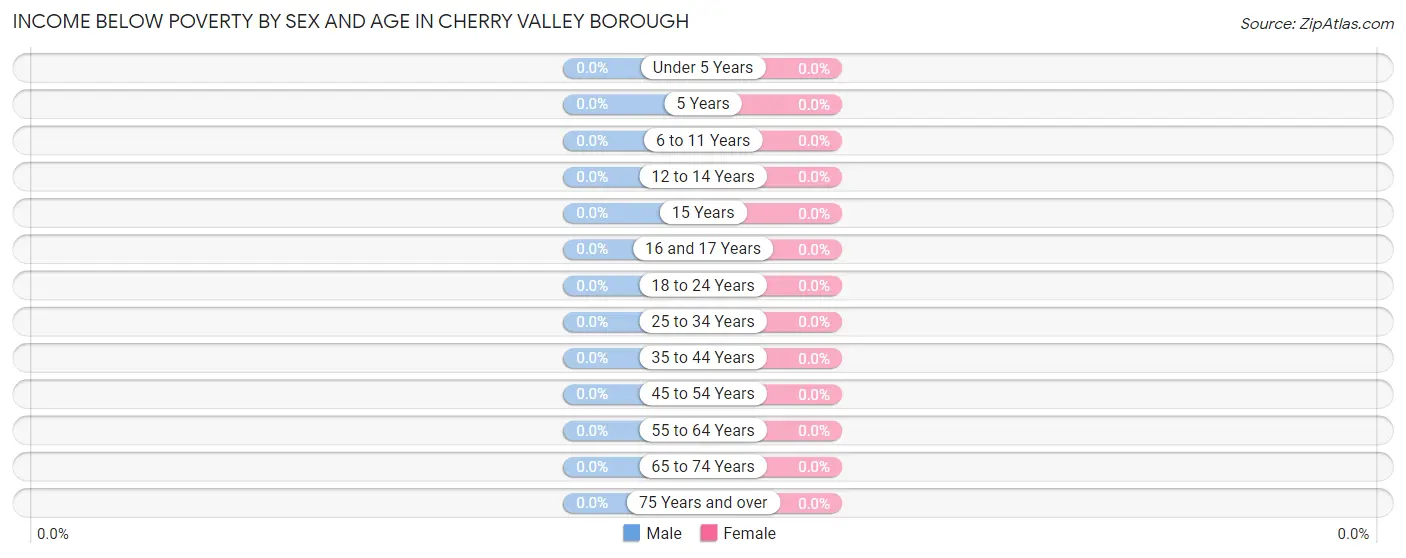
| Age Bracket | Male | Female |
| Under 5 Years | 0 (0.0%) | 0 (0.0%) |
| 5 Years | 0 (0.0%) | 0 (0.0%) |
| 6 to 11 Years | 0 (0.0%) | 0 (0.0%) |
| 12 to 14 Years | 0 (0.0%) | 0 (0.0%) |
| 15 Years | 0 (0.0%) | 0 (0.0%) |
| 16 and 17 Years | 0 (0.0%) | 0 (0.0%) |
| 18 to 24 Years | 0 (0.0%) | 0 (0.0%) |
| 25 to 34 Years | 0 (0.0%) | 0 (0.0%) |
| 35 to 44 Years | 0 (0.0%) | 0 (0.0%) |
| 45 to 54 Years | 0 (0.0%) | 0 (0.0%) |
| 55 to 64 Years | 0 (0.0%) | 0 (0.0%) |
| 65 to 74 Years | 0 (0.0%) | 0 (0.0%) |
| 75 Years and over | 0 (0.0%) | 0 (0.0%) |
| Total | 0 (0.0%) | 0 (0.0%) |
Income Above Poverty by Sex and Age in Cherry Valley borough
According to the poverty statistics in Cherry Valley borough, males aged under 5 years and females aged 25 to 34 years are the age groups that are most secure financially, with 100.0% of males and 100.0% of females in these age groups living above the poverty line.
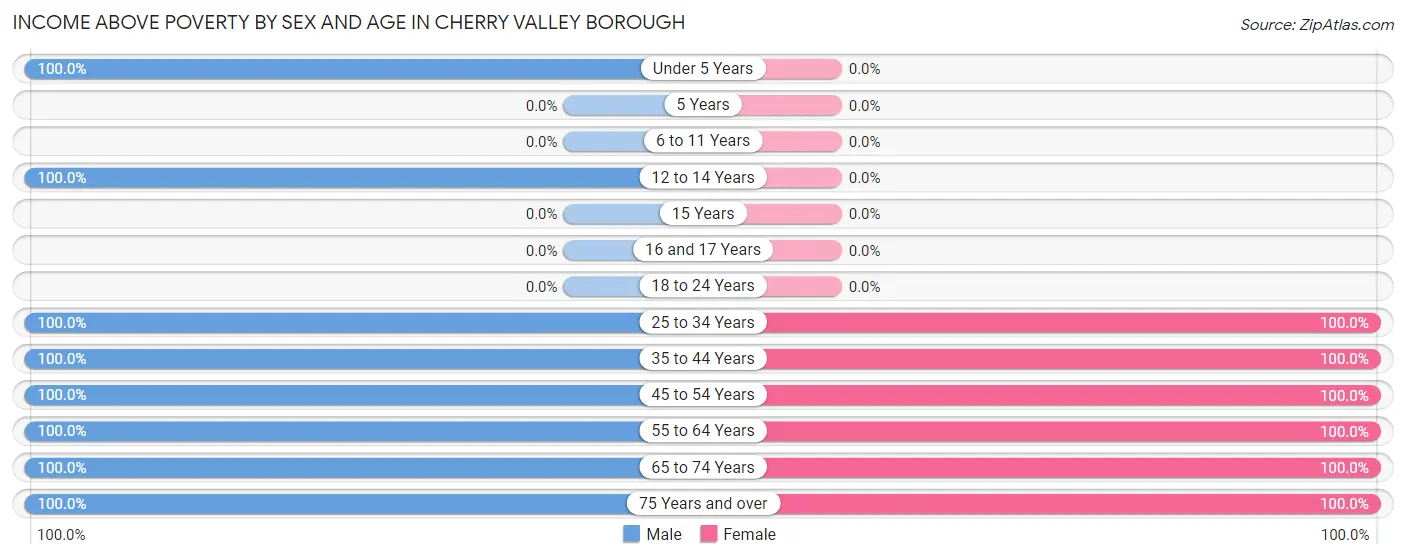
| Age Bracket | Male | Female |
| Under 5 Years | 2 (100.0%) | 0 (0.0%) |
| 5 Years | 0 (0.0%) | 0 (0.0%) |
| 6 to 11 Years | 0 (0.0%) | 0 (0.0%) |
| 12 to 14 Years | 3 (100.0%) | 0 (0.0%) |
| 15 Years | 0 (0.0%) | 0 (0.0%) |
| 16 and 17 Years | 0 (0.0%) | 0 (0.0%) |
| 18 to 24 Years | 0 (0.0%) | 0 (0.0%) |
| 25 to 34 Years | 3 (100.0%) | 2 (100.0%) |
| 35 to 44 Years | 5 (100.0%) | 1 (100.0%) |
| 45 to 54 Years | 2 (100.0%) | 1 (100.0%) |
| 55 to 64 Years | 8 (100.0%) | 14 (100.0%) |
| 65 to 74 Years | 6 (100.0%) | 6 (100.0%) |
| 75 Years and over | 3 (100.0%) | 4 (100.0%) |
| Total | 32 (100.0%) | 28 (100.0%) |
Income Below Poverty Among Married-Couple Families in Cherry Valley borough
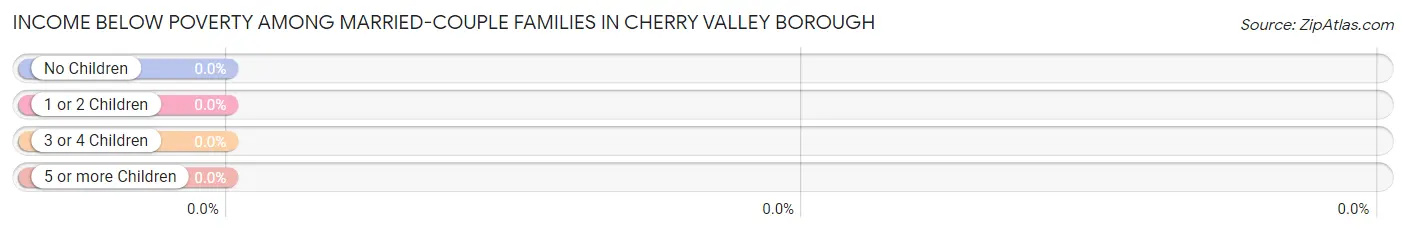
| Children | Above Poverty | Below Poverty |
| No Children | 11 (100.0%) | 0 (0.0%) |
| 1 or 2 Children | 3 (100.0%) | 0 (0.0%) |
| 3 or 4 Children | 0 (0.0%) | 0 (0.0%) |
| 5 or more Children | 0 (0.0%) | 0 (0.0%) |
| Total | 14 (100.0%) | 0 (0.0%) |
Income Below Poverty Among Single-Parent Households in Cherry Valley borough
| Children | Single Father | Single Mother |
| No Children | 0 (0.0%) | 0 (0.0%) |
| 1 or 2 Children | 0 (0.0%) | 0 (0.0%) |
| 3 or 4 Children | 0 (0.0%) | 0 (0.0%) |
| 5 or more Children | 0 (0.0%) | 0 (0.0%) |
| Total | 0 (0.0%) | 0 (0.0%) |
Income Below Poverty Among Married-Couple vs Single-Parent Households in Cherry Valley borough
| Children | Married-Couple Families | Single-Parent Households |
| No Children | 0 (0.0%) | 0 (0.0%) |
| 1 or 2 Children | 0 (0.0%) | 0 (0.0%) |
| 3 or 4 Children | 0 (0.0%) | 0 (0.0%) |
| 5 or more Children | 0 (0.0%) | 0 (0.0%) |
| Total | 0 (0.0%) | 0 (0.0%) |
Employment Characteristics in Cherry Valley borough
Employment by Class of Employer in Cherry Valley borough
Among the 17 employed individuals in Cherry Valley borough, private company employees (11 | 64.7%), and self-employed (not incorporated) (6 | 35.3%) make up the most common classes of employment.
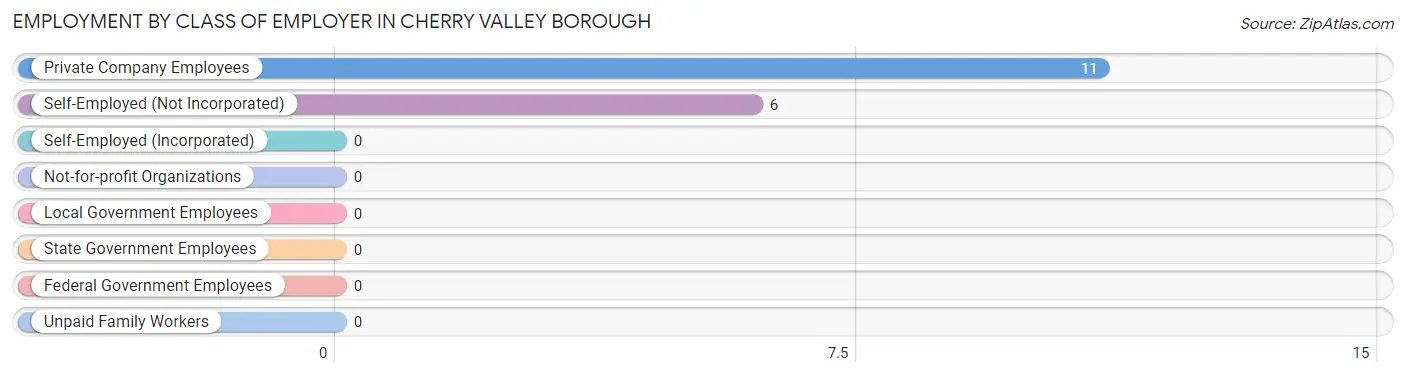
| Employer Class | # Employees | % Employees |
| Private Company Employees | 11 | 64.7% |
| Self-Employed (Incorporated) | 0 | 0.0% |
| Self-Employed (Not Incorporated) | 6 | 35.3% |
| Not-for-profit Organizations | 0 | 0.0% |
| Local Government Employees | 0 | 0.0% |
| State Government Employees | 0 | 0.0% |
| Federal Government Employees | 0 | 0.0% |
| Unpaid Family Workers | 0 | 0.0% |
| Total | 17 | 100.0% |
Employment Status by Age in Cherry Valley borough
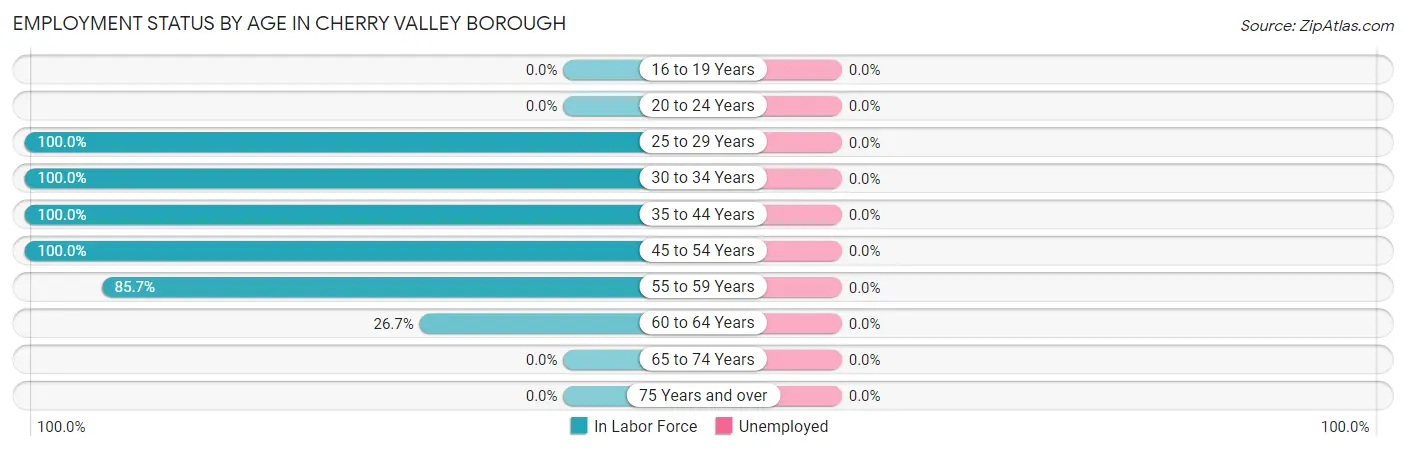
| Age Bracket | In Labor Force | Unemployed |
| 16 to 19 Years | 0 (0.0%) | 0 (0.0%) |
| 20 to 24 Years | 0 (0.0%) | 0 (0.0%) |
| 25 to 29 Years | 4 (100.0%) | 0 (0.0%) |
| 30 to 34 Years | 1 (100.0%) | 0 (0.0%) |
| 35 to 44 Years | 6 (100.0%) | 0 (0.0%) |
| 45 to 54 Years | 3 (100.0%) | 0 (0.0%) |
| 55 to 59 Years | 6 (85.7%) | 0 (0.0%) |
| 60 to 64 Years | 4 (26.7%) | 0 (0.0%) |
| 65 to 74 Years | 0 (0.0%) | 0 (0.0%) |
| 75 Years and over | 0 (0.0%) | 0 (0.0%) |
| Total | 24 (43.6%) | 0 (0.0%) |
Employment Status by Educational Attainment in Cherry Valley borough
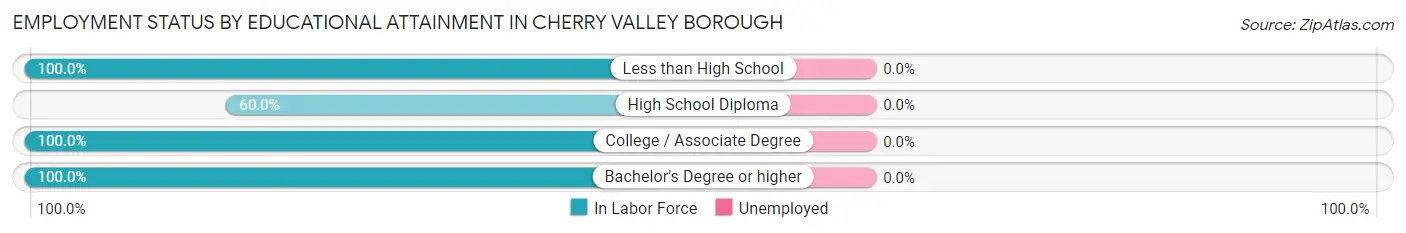
| Educational Attainment | In Labor Force | Unemployed |
| Less than High School | 1 (100.0%) | 0 (0.0%) |
| High School Diploma | 18 (60.0%) | 0 (0.0%) |
| College / Associate Degree | 3 (100.0%) | 0 (0.0%) |
| Bachelor's Degree or higher | 2 (100.0%) | 0 (0.0%) |
| Total | 24 (66.7%) | 0 (0.0%) |
Employment Occupations by Sex in Cherry Valley borough
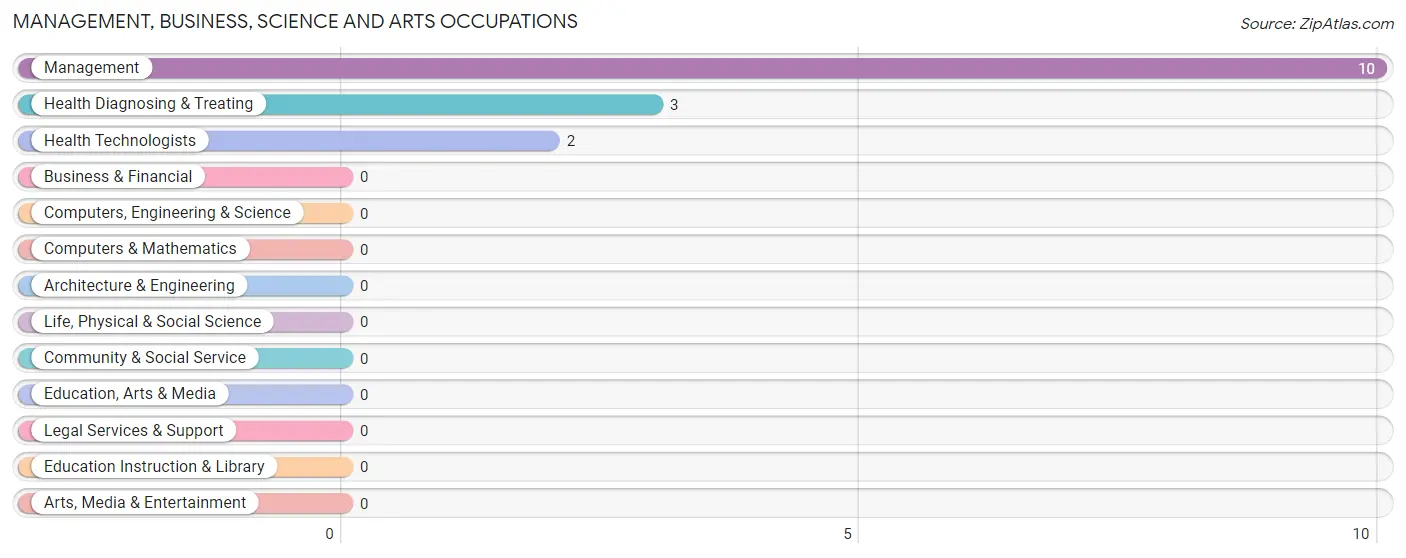
Management, Business, Science and Arts Occupations
The most common Management, Business, Science and Arts occupations in Cherry Valley borough are Management (10 | 41.7%), Health Diagnosing & Treating (3 | 12.5%), and Health Technologists (2 | 8.3%).
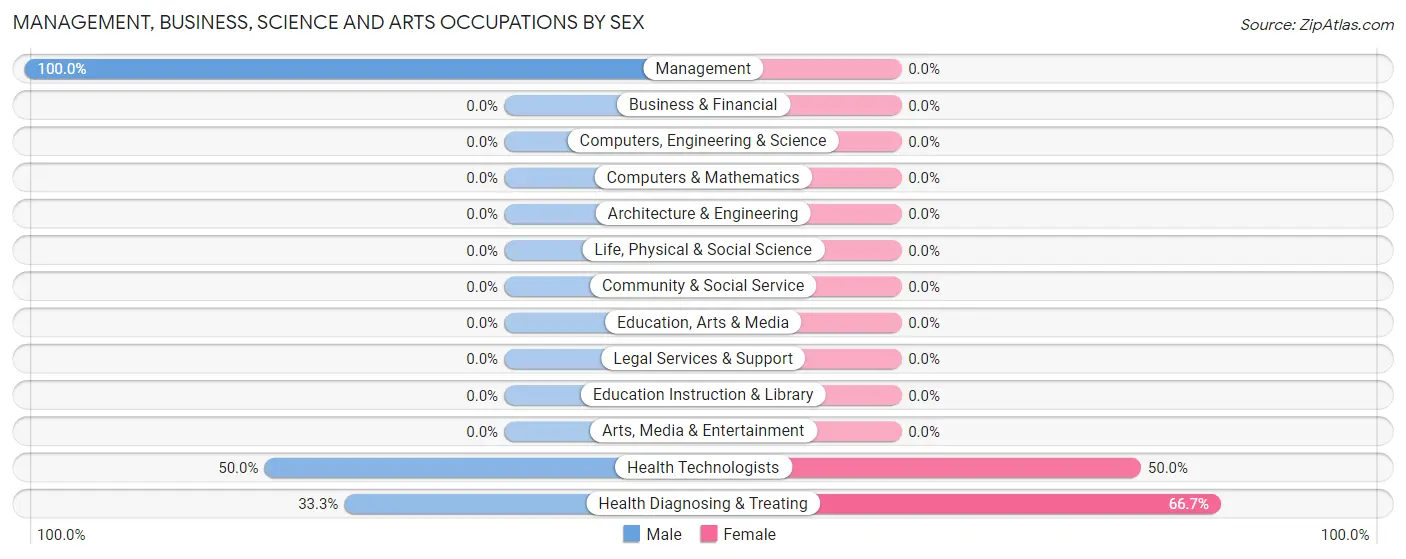
Management, Business, Science and Arts Occupations by Sex
Within the Management, Business, Science and Arts occupations in Cherry Valley borough, the most male-oriented occupations are Management (100.0%), Health Technologists (50.0%), and Health Diagnosing & Treating (33.3%), while the most female-oriented occupations are Health Diagnosing & Treating (66.7%), and Health Technologists (50.0%).
| Occupation | Male | Female |
| Management | 10 (100.0%) | 0 (0.0%) |
| Business & Financial | 0 (0.0%) | 0 (0.0%) |
| Computers, Engineering & Science | 0 (0.0%) | 0 (0.0%) |
| Computers & Mathematics | 0 (0.0%) | 0 (0.0%) |
| Architecture & Engineering | 0 (0.0%) | 0 (0.0%) |
| Life, Physical & Social Science | 0 (0.0%) | 0 (0.0%) |
| Community & Social Service | 0 (0.0%) | 0 (0.0%) |
| Education, Arts & Media | 0 (0.0%) | 0 (0.0%) |
| Legal Services & Support | 0 (0.0%) | 0 (0.0%) |
| Education Instruction & Library | 0 (0.0%) | 0 (0.0%) |
| Arts, Media & Entertainment | 0 (0.0%) | 0 (0.0%) |
| Health Diagnosing & Treating | 1 (33.3%) | 2 (66.7%) |
| Health Technologists | 1 (50.0%) | 1 (50.0%) |
| Total (Category) | 11 (84.6%) | 2 (15.4%) |
| Total (Overall) | 17 (70.8%) | 7 (29.2%) |
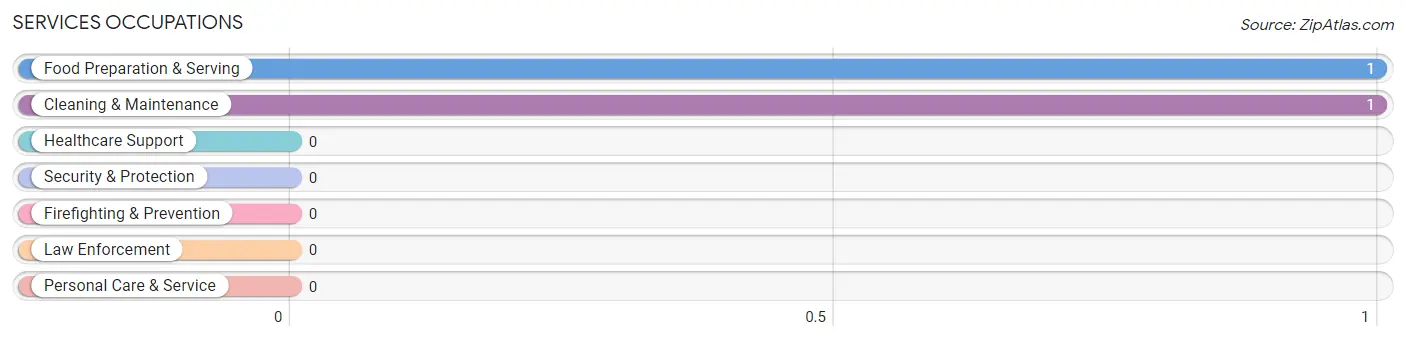
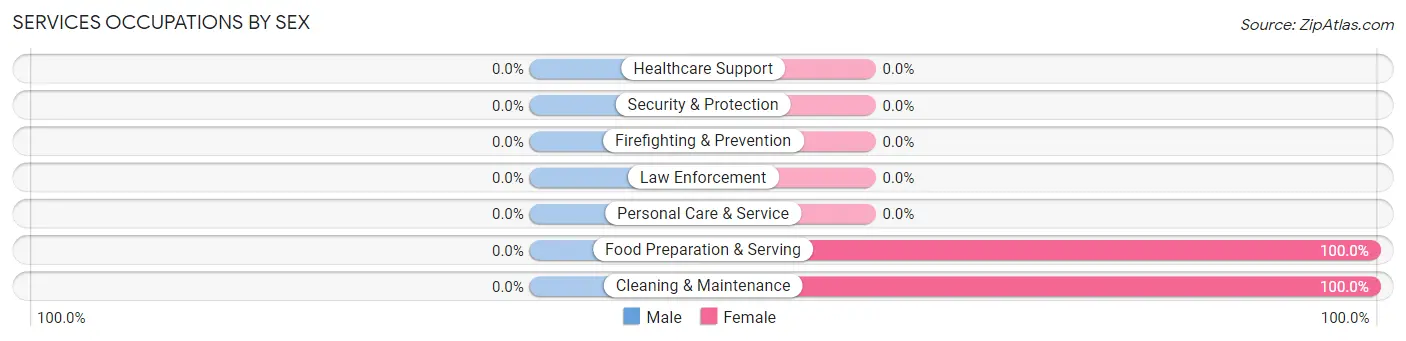
Services Occupations
The most common Services occupations in Cherry Valley borough are Food Preparation & Serving (1 | 4.2%), and Cleaning & Maintenance (1 | 4.2%).
Services Occupations by Sex
| Occupation | Male | Female |
| Healthcare Support | 0 (0.0%) | 0 (0.0%) |
| Security & Protection | 0 (0.0%) | 0 (0.0%) |
| Firefighting & Prevention | 0 (0.0%) | 0 (0.0%) |
| Law Enforcement | 0 (0.0%) | 0 (0.0%) |
| Food Preparation & Serving | 0 (0.0%) | 1 (100.0%) |
| Cleaning & Maintenance | 0 (0.0%) | 1 (100.0%) |
| Personal Care & Service | 0 (0.0%) | 0 (0.0%) |
| Total (Category) | 0 (0.0%) | 2 (100.0%) |
| Total (Overall) | 17 (70.8%) | 7 (29.2%) |
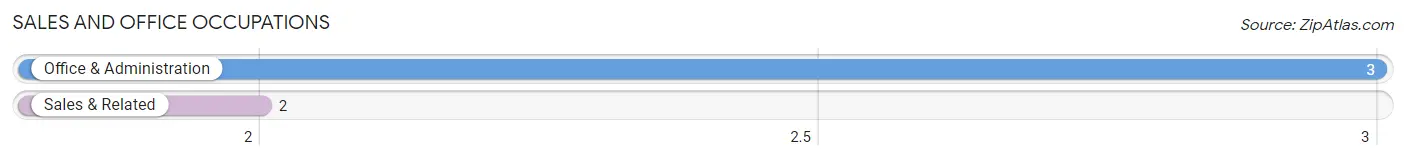
Sales and Office Occupations
The most common Sales and Office occupations in Cherry Valley borough are Office & Administration (3 | 12.5%), and Sales & Related (2 | 8.3%).
Sales and Office Occupations by Sex
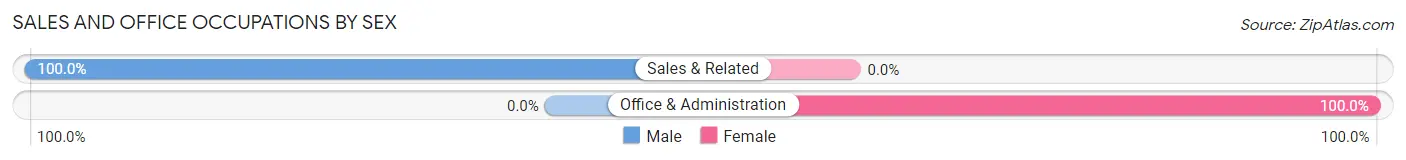
| Occupation | Male | Female |
| Sales & Related | 2 (100.0%) | 0 (0.0%) |
| Office & Administration | 0 (0.0%) | 3 (100.0%) |
| Total (Category) | 2 (40.0%) | 3 (60.0%) |
| Total (Overall) | 17 (70.8%) | 7 (29.2%) |
Natural Resources, Construction and Maintenance Occupations
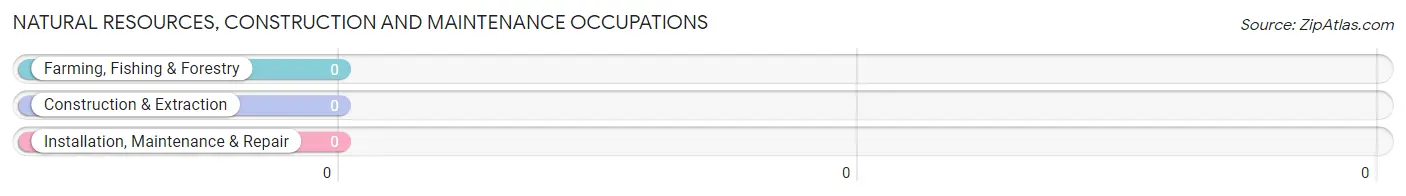
Natural Resources, Construction and Maintenance Occupations by Sex
| Occupation | Male | Female |
| Farming, Fishing & Forestry | 0 (0.0%) | 0 (0.0%) |
| Construction & Extraction | 0 (0.0%) | 0 (0.0%) |
| Installation, Maintenance & Repair | 0 (0.0%) | 0 (0.0%) |
| Total (Category) | 0 (0.0%) | 0 (0.0%) |
| Total (Overall) | 17 (70.8%) | 7 (29.2%) |
Production, Transportation and Moving Occupations
The most common Production, Transportation and Moving occupations in Cherry Valley borough are Production (2 | 8.3%), Transportation (1 | 4.2%), and Material Moving (1 | 4.2%).
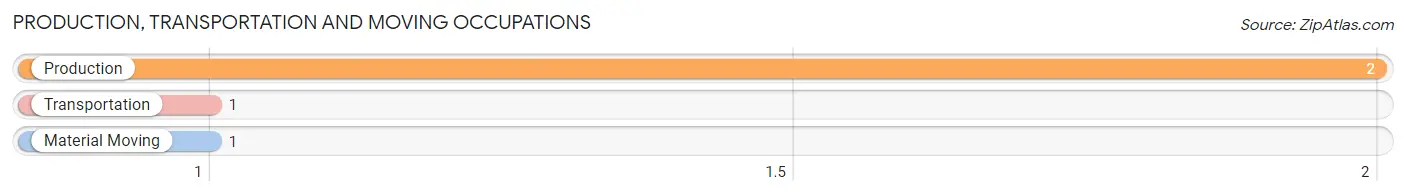
Production, Transportation and Moving Occupations by Sex
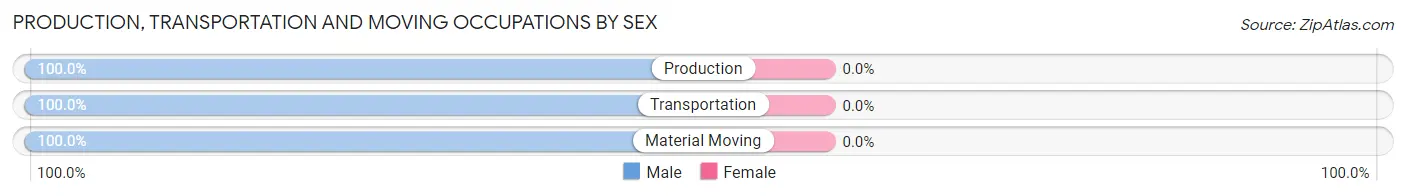
| Occupation | Male | Female |
| Production | 2 (100.0%) | 0 (0.0%) |
| Transportation | 1 (100.0%) | 0 (0.0%) |
| Material Moving | 1 (100.0%) | 0 (0.0%) |
| Total (Category) | 4 (100.0%) | 0 (0.0%) |
| Total (Overall) | 17 (70.8%) | 7 (29.2%) |
Employment Industries by Sex in Cherry Valley borough
Employment Industries in Cherry Valley borough
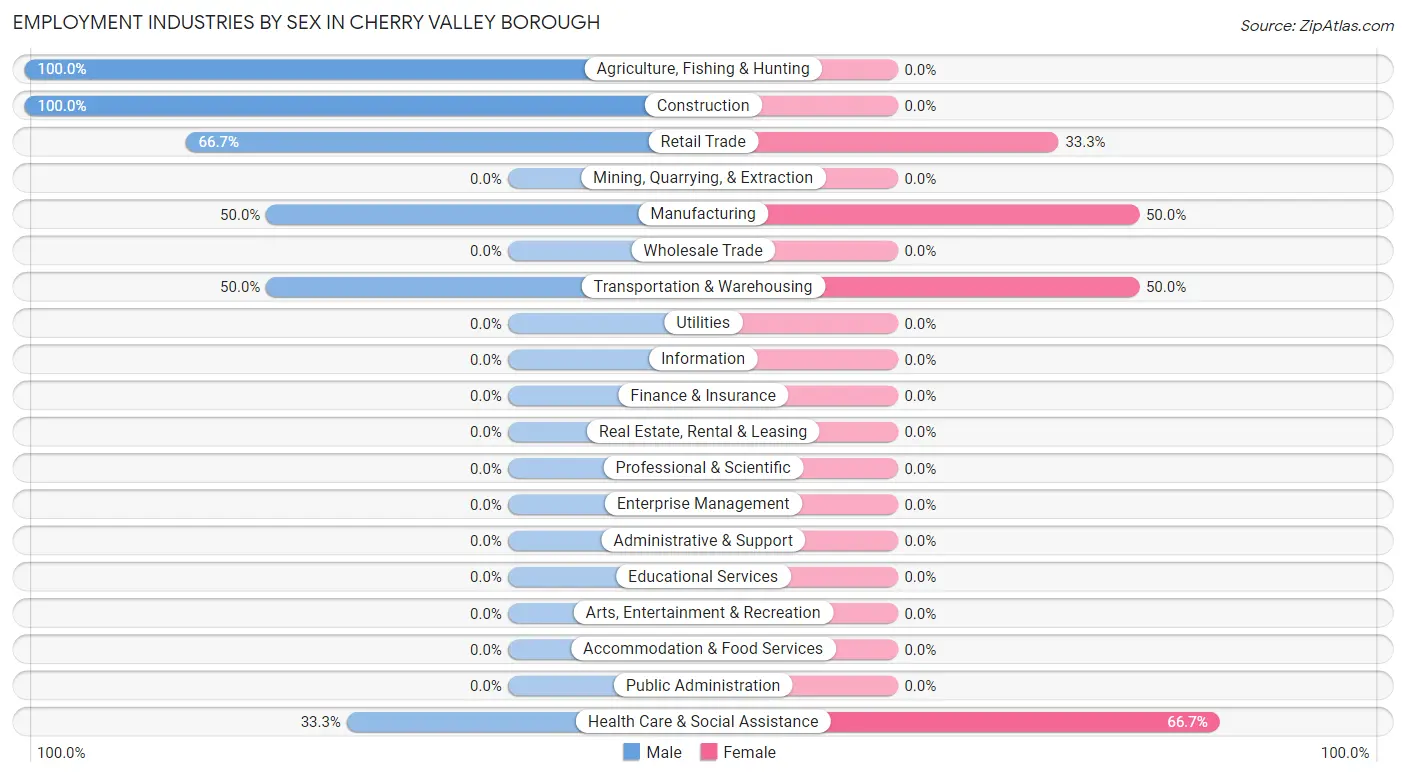
The major employment industries in Cherry Valley borough include Agriculture, Fishing & Hunting (5 | 20.8%), Construction (5 | 20.8%), Manufacturing (4 | 16.7%), Transportation & Warehousing (4 | 16.7%), and Retail Trade (3 | 12.5%).
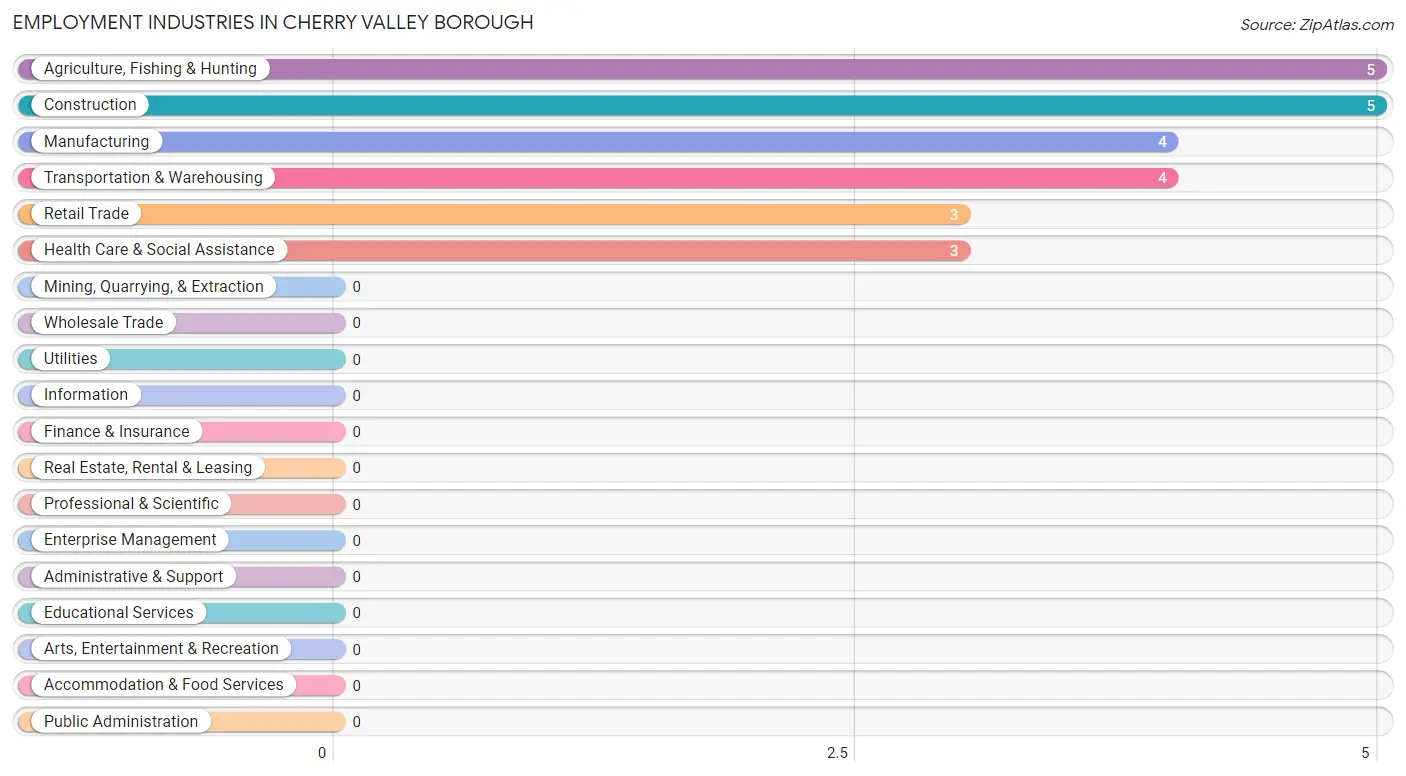
Employment Industries by Sex in Cherry Valley borough
The Cherry Valley borough industries that see more men than women are Agriculture, Fishing & Hunting (100.0%), Construction (100.0%), and Retail Trade (66.7%), whereas the industries that tend to have a higher number of women are Health Care & Social Assistance (66.7%), Manufacturing (50.0%), and Transportation & Warehousing (50.0%).
| Industry | Male | Female |
| Agriculture, Fishing & Hunting | 5 (100.0%) | 0 (0.0%) |
| Mining, Quarrying, & Extraction | 0 (0.0%) | 0 (0.0%) |
| Construction | 5 (100.0%) | 0 (0.0%) |
| Manufacturing | 2 (50.0%) | 2 (50.0%) |
| Wholesale Trade | 0 (0.0%) | 0 (0.0%) |
| Retail Trade | 2 (66.7%) | 1 (33.3%) |
| Transportation & Warehousing | 2 (50.0%) | 2 (50.0%) |
| Utilities | 0 (0.0%) | 0 (0.0%) |
| Information | 0 (0.0%) | 0 (0.0%) |
| Finance & Insurance | 0 (0.0%) | 0 (0.0%) |
| Real Estate, Rental & Leasing | 0 (0.0%) | 0 (0.0%) |
| Professional & Scientific | 0 (0.0%) | 0 (0.0%) |
| Enterprise Management | 0 (0.0%) | 0 (0.0%) |
| Administrative & Support | 0 (0.0%) | 0 (0.0%) |
| Educational Services | 0 (0.0%) | 0 (0.0%) |
| Health Care & Social Assistance | 1 (33.3%) | 2 (66.7%) |
| Arts, Entertainment & Recreation | 0 (0.0%) | 0 (0.0%) |
| Accommodation & Food Services | 0 (0.0%) | 0 (0.0%) |
| Public Administration | 0 (0.0%) | 0 (0.0%) |
| Total | 17 (70.8%) | 7 (29.2%) |
Education in Cherry Valley borough
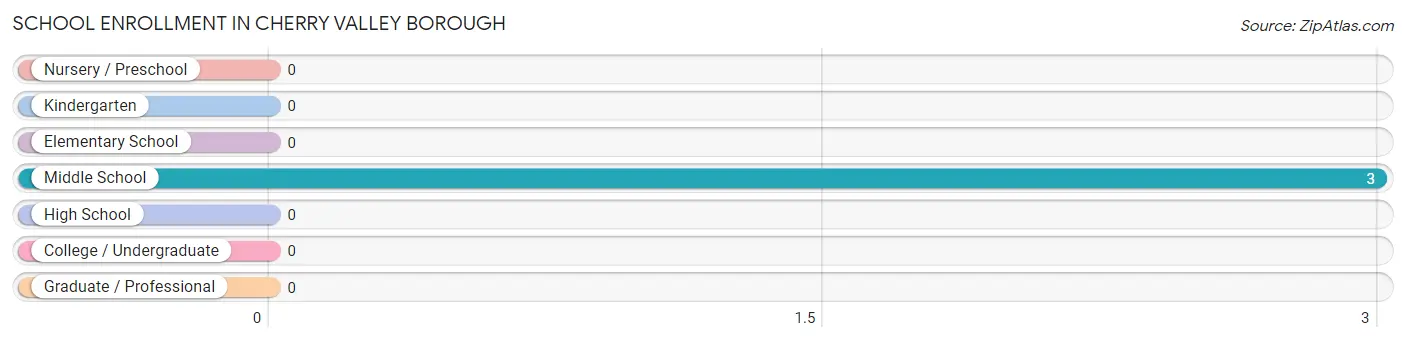
School Enrollment in Cherry Valley borough
| School Level | # Students | % Students |
| Nursery / Preschool | 0 | 0.0% |
| Kindergarten | 0 | 0.0% |
| Elementary School | 0 | 0.0% |
| Middle School | 3 | 100.0% |
| High School | 0 | 0.0% |
| College / Undergraduate | 0 | 0.0% |
| Graduate / Professional | 0 | 0.0% |
| Total | 3 | 100.0% |
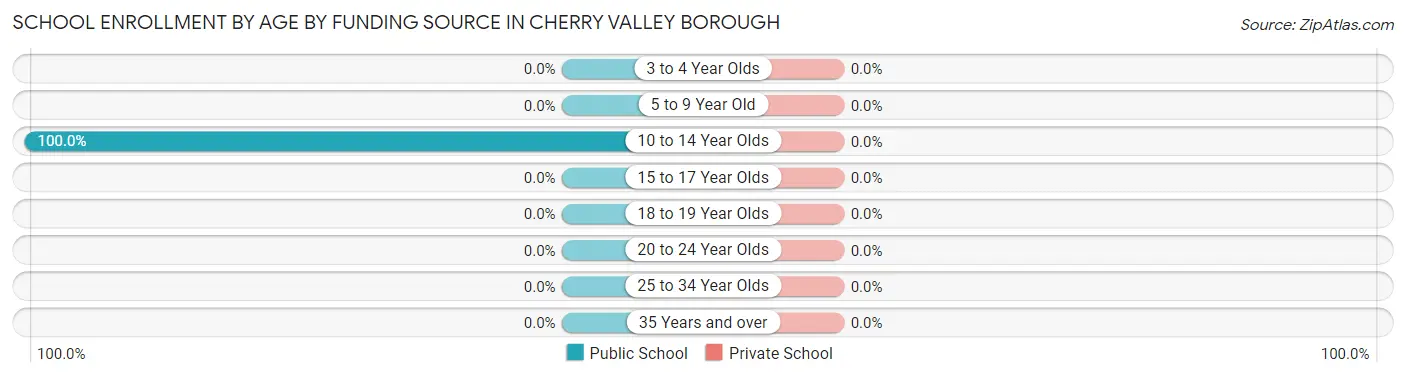
School Enrollment by Age by Funding Source in Cherry Valley borough
| Age Bracket | Public School | Private School |
| 3 to 4 Year Olds | 0 (0.0%) | 0 (0.0%) |
| 5 to 9 Year Old | 0 (0.0%) | 0 (0.0%) |
| 10 to 14 Year Olds | 3 (100.0%) | 0 (0.0%) |
| 15 to 17 Year Olds | 0 (0.0%) | 0 (0.0%) |
| 18 to 19 Year Olds | 0 (0.0%) | 0 (0.0%) |
| 20 to 24 Year Olds | 0 (0.0%) | 0 (0.0%) |
| 25 to 34 Year Olds | 0 (0.0%) | 0 (0.0%) |
| 35 Years and over | 0 (0.0%) | 0 (0.0%) |
| Total | 3 (100.0%) | 0 (0.0%) |
Educational Attainment by Field of Study in Cherry Valley borough
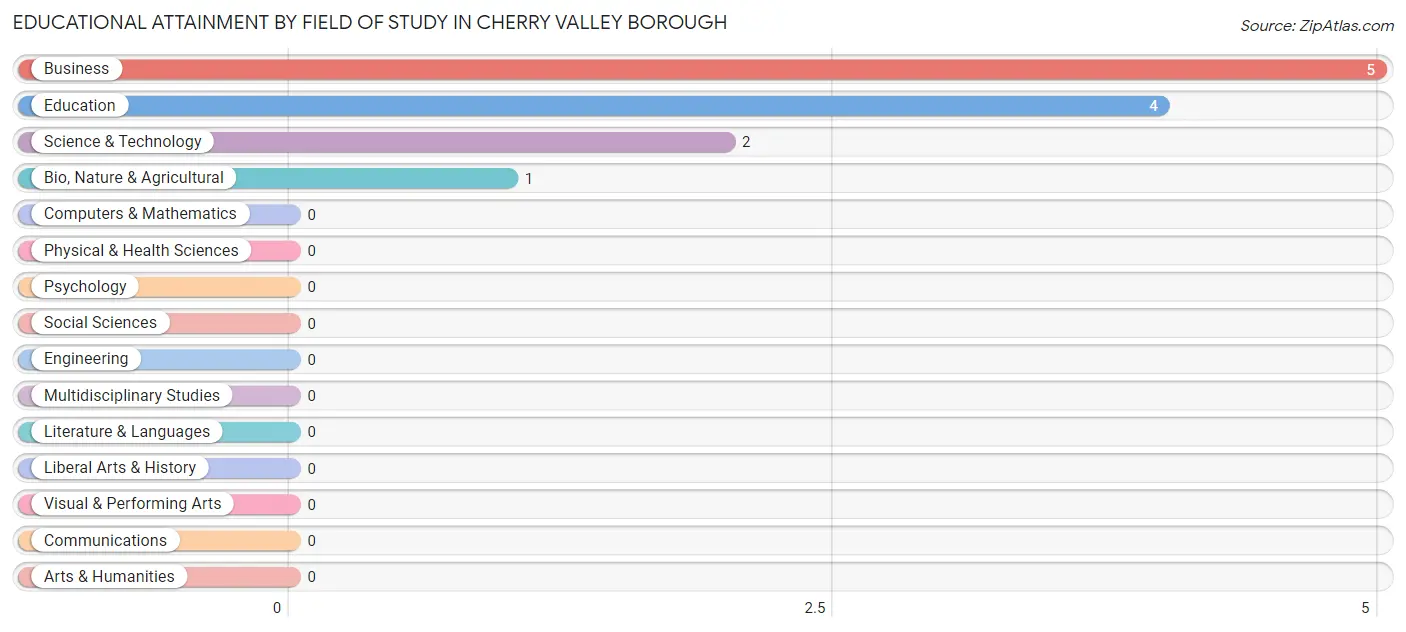
Business (5 | 41.7%), education (4 | 33.3%), science & technology (2 | 16.7%), and bio, nature & agricultural (1 | 8.3%) are the most common fields of study among 12 individuals in Cherry Valley borough who have obtained a bachelor's degree or higher.
| Field of Study | # Graduates | % Graduates |
| Computers & Mathematics | 0 | 0.0% |
| Bio, Nature & Agricultural | 1 | 8.3% |
| Physical & Health Sciences | 0 | 0.0% |
| Psychology | 0 | 0.0% |
| Social Sciences | 0 | 0.0% |
| Engineering | 0 | 0.0% |
| Multidisciplinary Studies | 0 | 0.0% |
| Science & Technology | 2 | 16.7% |
| Business | 5 | 41.7% |
| Education | 4 | 33.3% |
| Literature & Languages | 0 | 0.0% |
| Liberal Arts & History | 0 | 0.0% |
| Visual & Performing Arts | 0 | 0.0% |
| Communications | 0 | 0.0% |
| Arts & Humanities | 0 | 0.0% |
| Total | 12 | 100.0% |
Transportation & Commute in Cherry Valley borough
Vehicle Availability by Sex in Cherry Valley borough
The most prevalent vehicle ownership categories in Cherry Valley borough are males with 5 or more vehicles (5, accounting for 41.7%) and females with 5 or more vehicles (0, making up 100.0%).
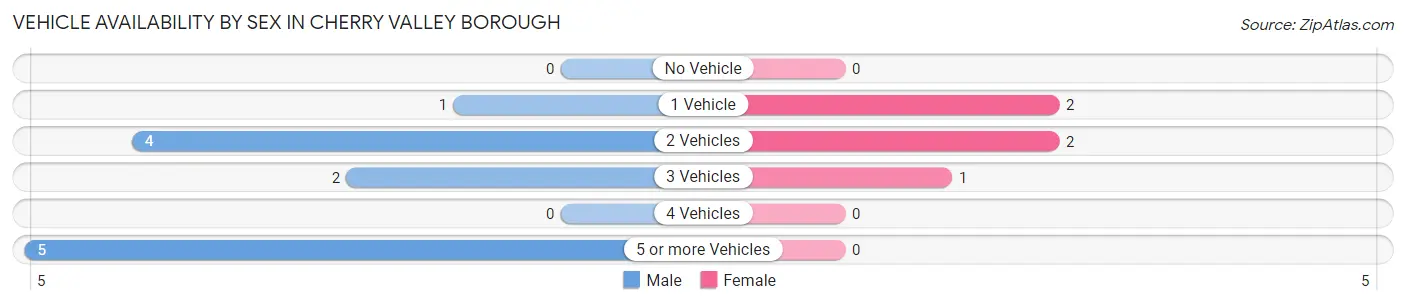
| Vehicles Available | Male | Female |
| No Vehicle | 0 (0.0%) | 0 (0.0%) |
| 1 Vehicle | 1 (8.3%) | 2 (40.0%) |
| 2 Vehicles | 4 (33.3%) | 2 (40.0%) |
| 3 Vehicles | 2 (16.7%) | 1 (20.0%) |
| 4 Vehicles | 0 (0.0%) | 0 (0.0%) |
| 5 or more Vehicles | 5 (41.7%) | 0 (0.0%) |
| Total | 12 (100.0%) | 5 (100.0%) |
Commute Time in Cherry Valley borough
The most frequently occuring commute durations in Cherry Valley borough are 30 to 34 minutes (6 commuters, 35.3%), less than 5 minutes (5 commuters, 29.4%), and 5 to 9 minutes (2 commuters, 11.8%).
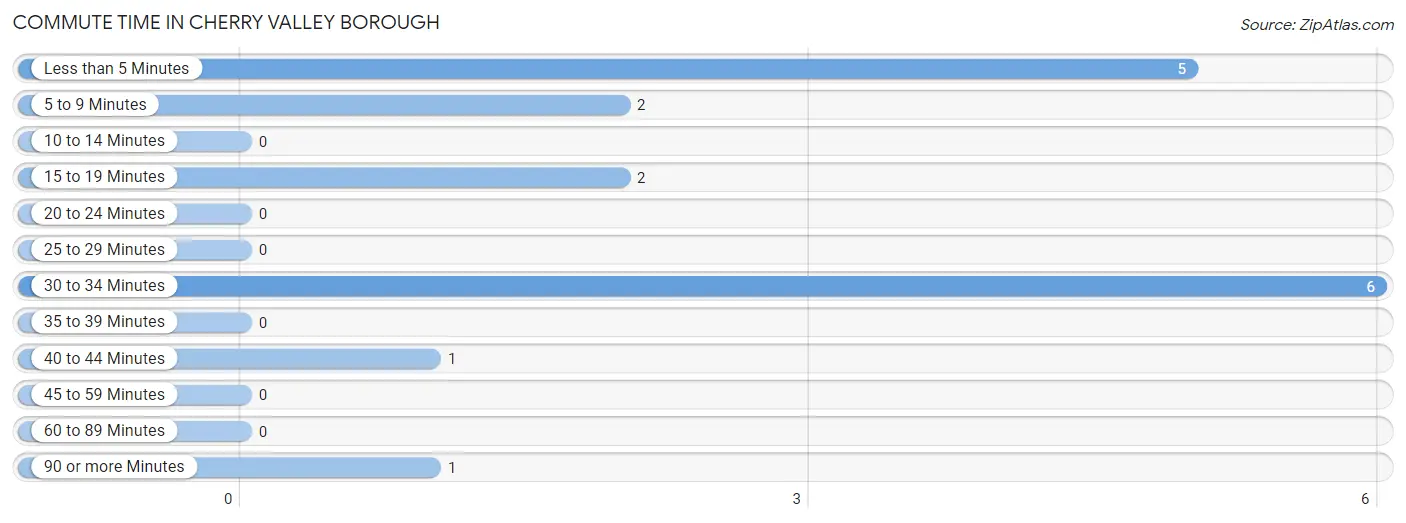
| Commute Time | # Commuters | % Commuters |
| Less than 5 Minutes | 5 | 29.4% |
| 5 to 9 Minutes | 2 | 11.8% |
| 10 to 14 Minutes | 0 | 0.0% |
| 15 to 19 Minutes | 2 | 11.8% |
| 20 to 24 Minutes | 0 | 0.0% |
| 25 to 29 Minutes | 0 | 0.0% |
| 30 to 34 Minutes | 6 | 35.3% |
| 35 to 39 Minutes | 0 | 0.0% |
| 40 to 44 Minutes | 1 | 5.9% |
| 45 to 59 Minutes | 0 | 0.0% |
| 60 to 89 Minutes | 0 | 0.0% |
| 90 or more Minutes | 1 | 5.9% |
Commute Time by Sex in Cherry Valley borough
The most common commute times in Cherry Valley borough are less than 5 minutes (5 commuters, 41.7%) for males and 5 to 9 minutes (1 commuters, 20.0%) for females.
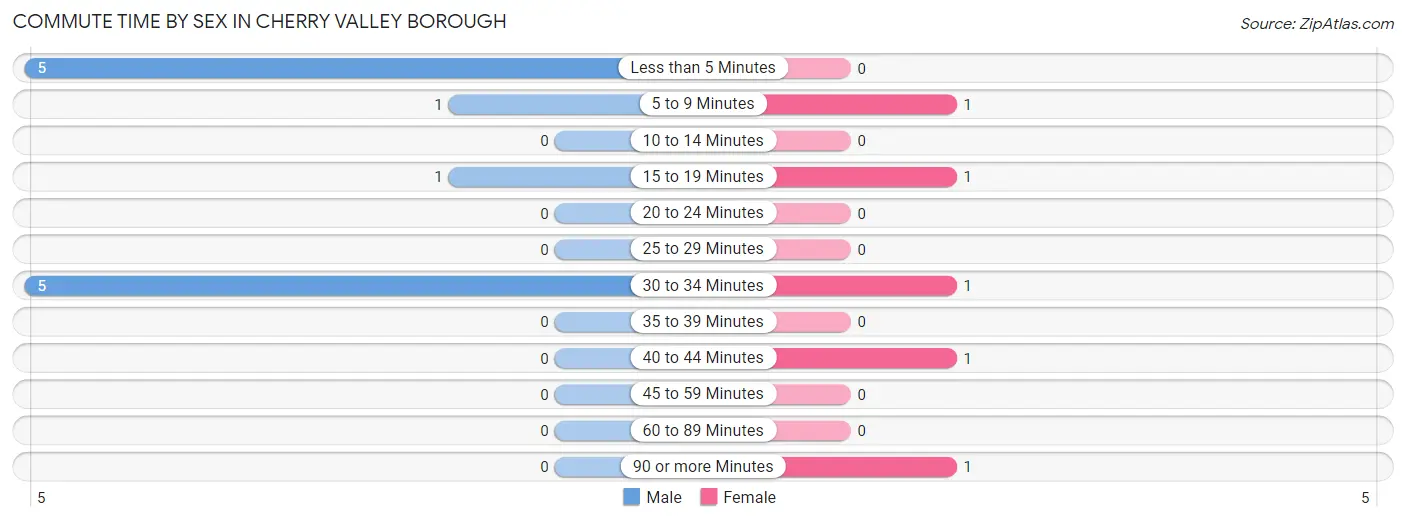
| Commute Time | Male | Female |
| Less than 5 Minutes | 5 (41.7%) | 0 (0.0%) |
| 5 to 9 Minutes | 1 (8.3%) | 1 (20.0%) |
| 10 to 14 Minutes | 0 (0.0%) | 0 (0.0%) |
| 15 to 19 Minutes | 1 (8.3%) | 1 (20.0%) |
| 20 to 24 Minutes | 0 (0.0%) | 0 (0.0%) |
| 25 to 29 Minutes | 0 (0.0%) | 0 (0.0%) |
| 30 to 34 Minutes | 5 (41.7%) | 1 (20.0%) |
| 35 to 39 Minutes | 0 (0.0%) | 0 (0.0%) |
| 40 to 44 Minutes | 0 (0.0%) | 1 (20.0%) |
| 45 to 59 Minutes | 0 (0.0%) | 0 (0.0%) |
| 60 to 89 Minutes | 0 (0.0%) | 0 (0.0%) |
| 90 or more Minutes | 0 (0.0%) | 1 (20.0%) |
Time of Departure to Work by Sex in Cherry Valley borough
The most frequent times of departure to work in Cherry Valley borough are 12:00 AM to 4:59 AM (6, 50.0%) for males and 12:00 AM to 4:59 AM (1, 20.0%) for females.
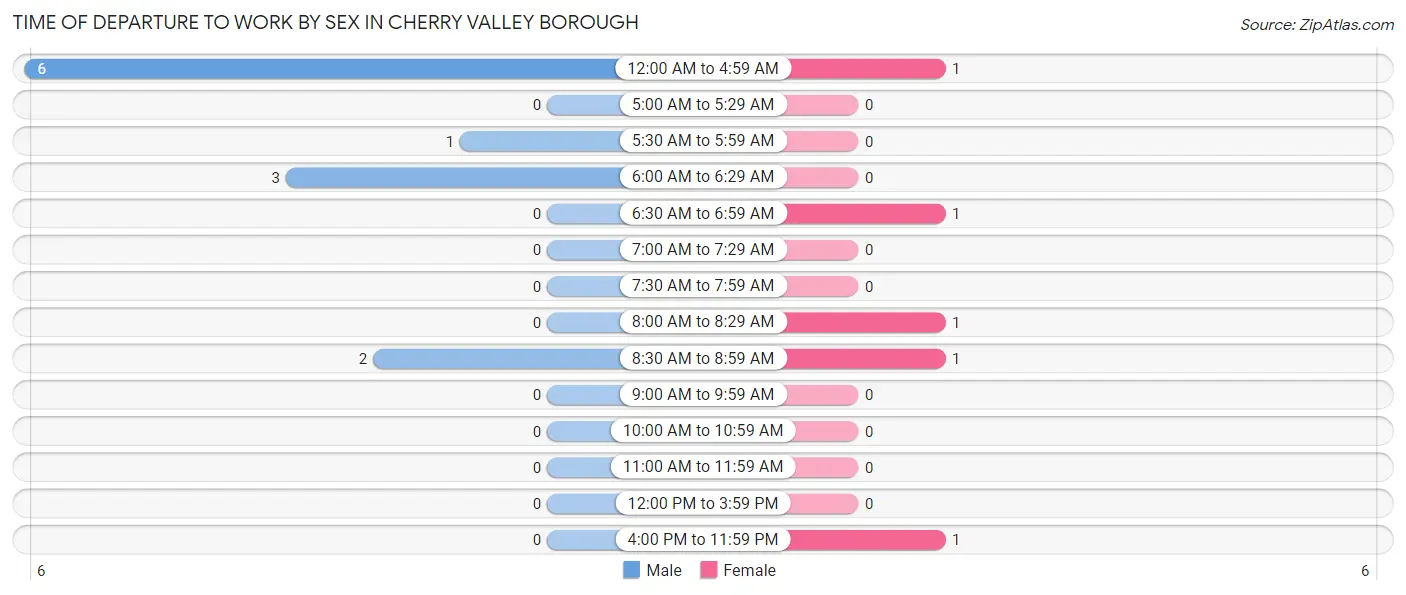
| Time of Departure | Male | Female |
| 12:00 AM to 4:59 AM | 6 (50.0%) | 1 (20.0%) |
| 5:00 AM to 5:29 AM | 0 (0.0%) | 0 (0.0%) |
| 5:30 AM to 5:59 AM | 1 (8.3%) | 0 (0.0%) |
| 6:00 AM to 6:29 AM | 3 (25.0%) | 0 (0.0%) |
| 6:30 AM to 6:59 AM | 0 (0.0%) | 1 (20.0%) |
| 7:00 AM to 7:29 AM | 0 (0.0%) | 0 (0.0%) |
| 7:30 AM to 7:59 AM | 0 (0.0%) | 0 (0.0%) |
| 8:00 AM to 8:29 AM | 0 (0.0%) | 1 (20.0%) |
| 8:30 AM to 8:59 AM | 2 (16.7%) | 1 (20.0%) |
| 9:00 AM to 9:59 AM | 0 (0.0%) | 0 (0.0%) |
| 10:00 AM to 10:59 AM | 0 (0.0%) | 0 (0.0%) |
| 11:00 AM to 11:59 AM | 0 (0.0%) | 0 (0.0%) |
| 12:00 PM to 3:59 PM | 0 (0.0%) | 0 (0.0%) |
| 4:00 PM to 11:59 PM | 0 (0.0%) | 1 (20.0%) |
| Total | 12 (100.0%) | 5 (100.0%) |
Housing Occupancy in Cherry Valley borough
Occupancy by Ownership in Cherry Valley borough
Of the total 37 dwellings in Cherry Valley borough, owner-occupied units account for 26 (70.3%), while renter-occupied units make up 11 (29.7%).
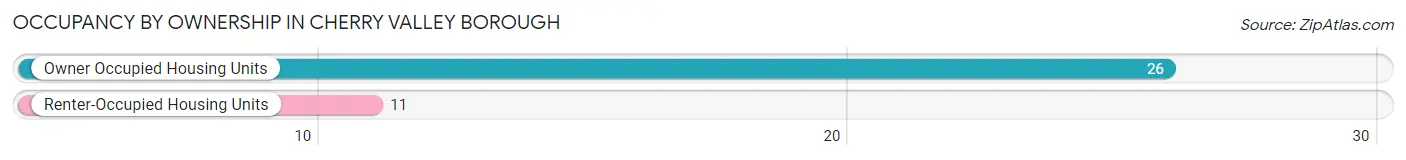
| Occupancy | # Housing Units | % Housing Units |
| Owner Occupied Housing Units | 26 | 70.3% |
| Renter-Occupied Housing Units | 11 | 29.7% |
| Total Occupied Housing Units | 37 | 100.0% |
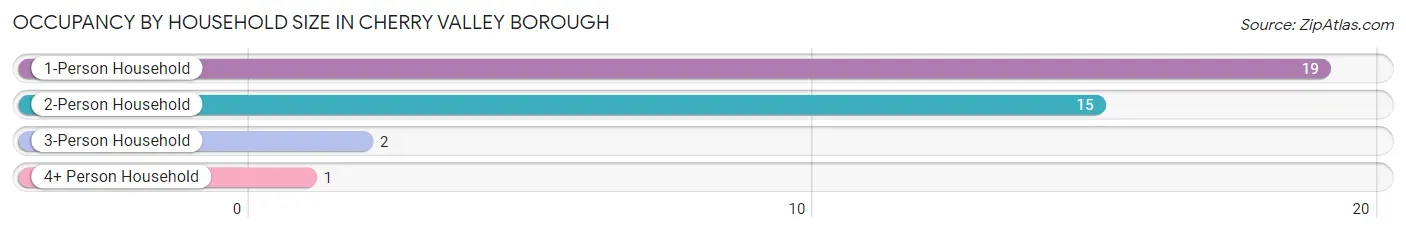
Occupancy by Household Size in Cherry Valley borough
| Household Size | # Housing Units | % Housing Units |
| 1-Person Household | 19 | 51.3% |
| 2-Person Household | 15 | 40.5% |
| 3-Person Household | 2 | 5.4% |
| 4+ Person Household | 1 | 2.7% |
| Total Housing Units | 37 | 100.0% |
Occupancy by Ownership by Household Size in Cherry Valley borough
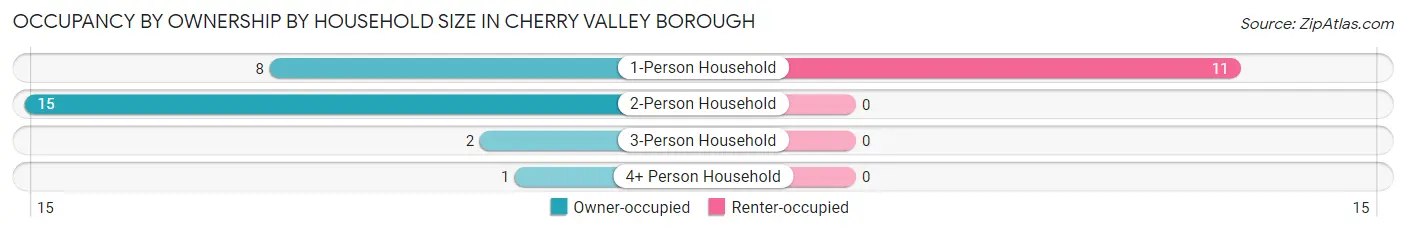
| Household Size | Owner-occupied | Renter-occupied |
| 1-Person Household | 8 (42.1%) | 11 (57.9%) |
| 2-Person Household | 15 (100.0%) | 0 (0.0%) |
| 3-Person Household | 2 (100.0%) | 0 (0.0%) |
| 4+ Person Household | 1 (100.0%) | 0 (0.0%) |
| Total Housing Units | 26 (70.3%) | 11 (29.7%) |
Occupancy by Educational Attainment in Cherry Valley borough
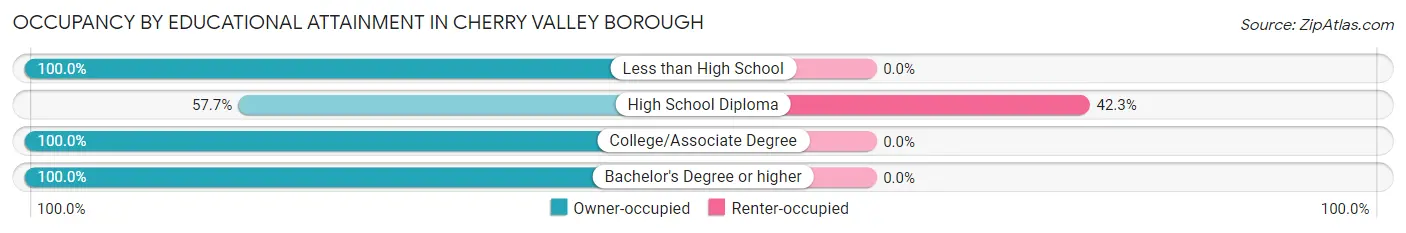
| Household Size | Owner-occupied | Renter-occupied |
| Less than High School | 1 (100.0%) | 0 (0.0%) |
| High School Diploma | 15 (57.7%) | 11 (42.3%) |
| College/Associate Degree | 1 (100.0%) | 0 (0.0%) |
| Bachelor's Degree or higher | 9 (100.0%) | 0 (0.0%) |
Occupancy by Age of Householder in Cherry Valley borough
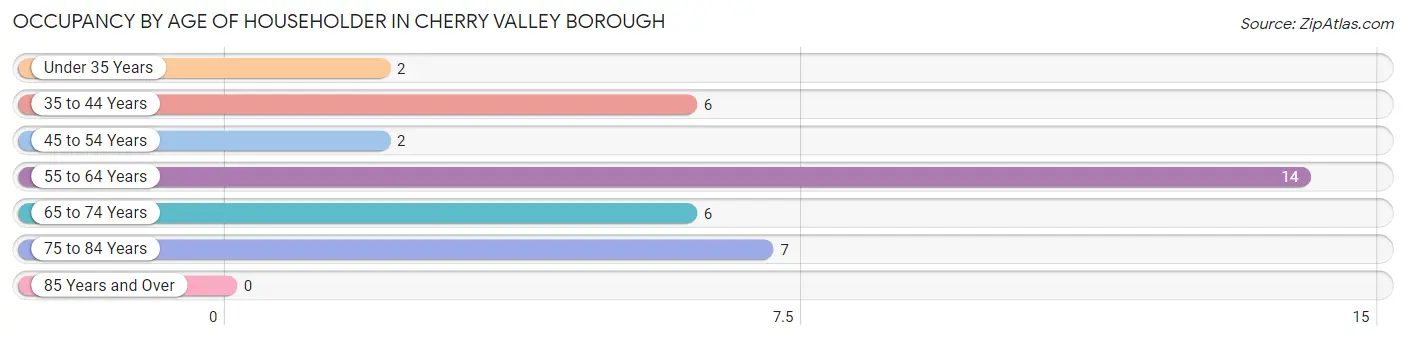
| Age Bracket | # Households | % Households |
| Under 35 Years | 2 | 5.4% |
| 35 to 44 Years | 6 | 16.2% |
| 45 to 54 Years | 2 | 5.4% |
| 55 to 64 Years | 14 | 37.8% |
| 65 to 74 Years | 6 | 16.2% |
| 75 to 84 Years | 7 | 18.9% |
| 85 Years and Over | 0 | 0.0% |
| Total | 37 | 100.0% |
Housing Finances in Cherry Valley borough
Median Income by Occupancy in Cherry Valley borough
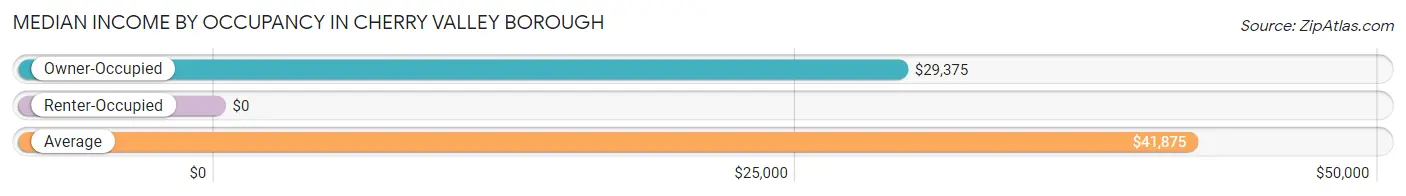
| Occupancy Type | # Households | Median Income |
| Owner-Occupied | 26 (70.3%) | $29,375 |
| Renter-Occupied | 11 (29.7%) | $0 |
| Average | 37 (100.0%) | $41,875 |
Occupancy by Householder Income Bracket in Cherry Valley borough
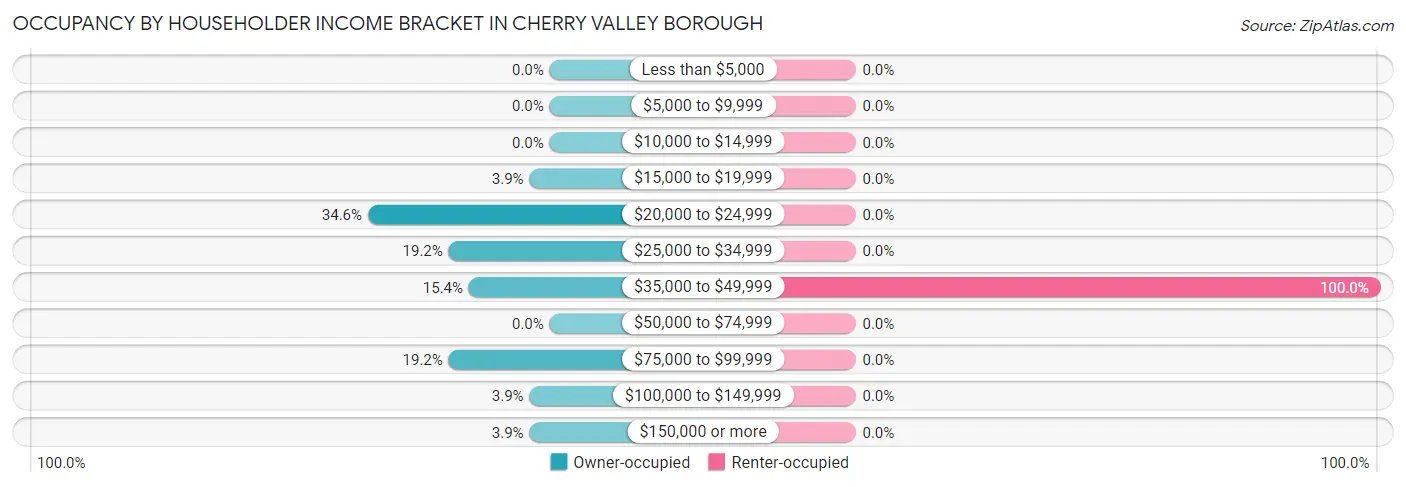
| Income Bracket | Owner-occupied | Renter-occupied |
| Less than $5,000 | 0 (0.0%) | 0 (0.0%) |
| $5,000 to $9,999 | 0 (0.0%) | 0 (0.0%) |
| $10,000 to $14,999 | 0 (0.0%) | 0 (0.0%) |
| $15,000 to $19,999 | 1 (3.8%) | 0 (0.0%) |
| $20,000 to $24,999 | 9 (34.6%) | 0 (0.0%) |
| $25,000 to $34,999 | 5 (19.2%) | 0 (0.0%) |
| $35,000 to $49,999 | 4 (15.4%) | 11 (100.0%) |
| $50,000 to $74,999 | 0 (0.0%) | 0 (0.0%) |
| $75,000 to $99,999 | 5 (19.2%) | 0 (0.0%) |
| $100,000 to $149,999 | 1 (3.8%) | 0 (0.0%) |
| $150,000 or more | 1 (3.8%) | 0 (0.0%) |
| Total | 26 (100.0%) | 11 (100.0%) |
Monthly Housing Cost Tiers in Cherry Valley borough
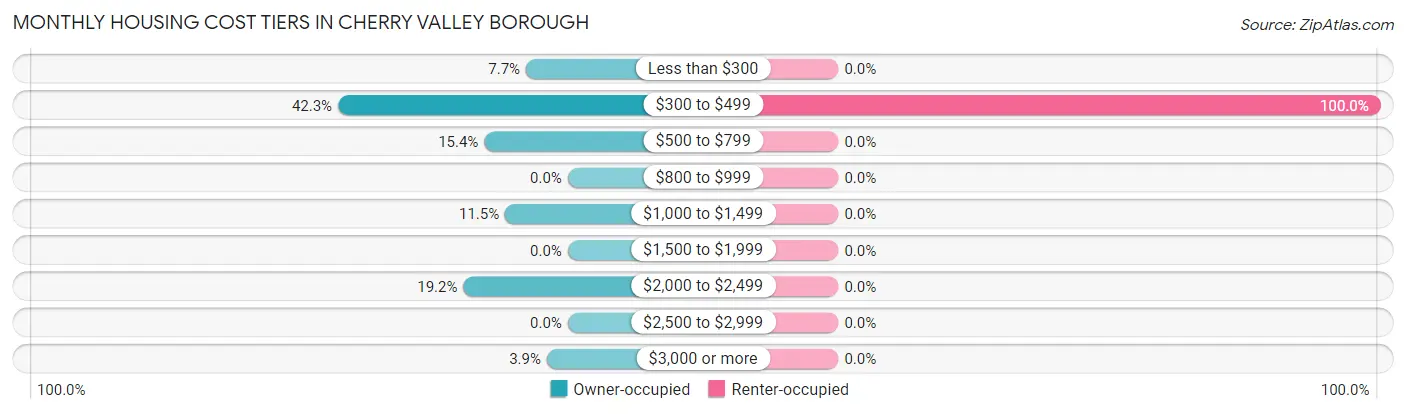
| Monthly Cost | Owner-occupied | Renter-occupied |
| Less than $300 | 2 (7.7%) | 0 (0.0%) |
| $300 to $499 | 11 (42.3%) | 11 (100.0%) |
| $500 to $799 | 4 (15.4%) | 0 (0.0%) |
| $800 to $999 | 0 (0.0%) | 0 (0.0%) |
| $1,000 to $1,499 | 3 (11.5%) | 0 (0.0%) |
| $1,500 to $1,999 | 0 (0.0%) | 0 (0.0%) |
| $2,000 to $2,499 | 5 (19.2%) | 0 (0.0%) |
| $2,500 to $2,999 | 0 (0.0%) | 0 (0.0%) |
| $3,000 or more | 1 (3.8%) | 0 (0.0%) |
| Total | 26 (100.0%) | 11 (100.0%) |
Physical Housing Characteristics in Cherry Valley borough
Housing Structures in Cherry Valley borough
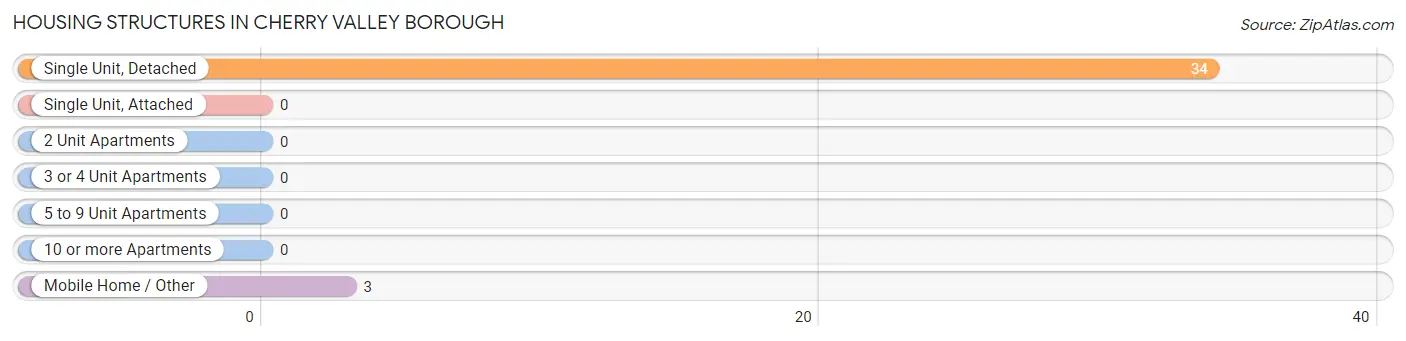
| Structure Type | # Housing Units | % Housing Units |
| Single Unit, Detached | 34 | 91.9% |
| Single Unit, Attached | 0 | 0.0% |
| 2 Unit Apartments | 0 | 0.0% |
| 3 or 4 Unit Apartments | 0 | 0.0% |
| 5 to 9 Unit Apartments | 0 | 0.0% |
| 10 or more Apartments | 0 | 0.0% |
| Mobile Home / Other | 3 | 8.1% |
| Total | 37 | 100.0% |
Housing Structures by Occupancy in Cherry Valley borough
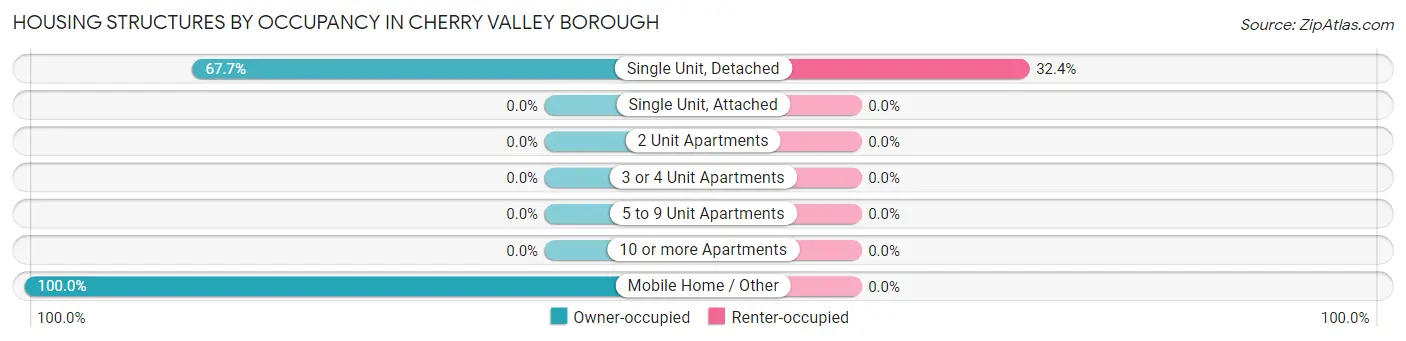
| Structure Type | Owner-occupied | Renter-occupied |
| Single Unit, Detached | 23 (67.6%) | 11 (32.4%) |
| Single Unit, Attached | 0 (0.0%) | 0 (0.0%) |
| 2 Unit Apartments | 0 (0.0%) | 0 (0.0%) |
| 3 or 4 Unit Apartments | 0 (0.0%) | 0 (0.0%) |
| 5 to 9 Unit Apartments | 0 (0.0%) | 0 (0.0%) |
| 10 or more Apartments | 0 (0.0%) | 0 (0.0%) |
| Mobile Home / Other | 3 (100.0%) | 0 (0.0%) |
| Total | 26 (70.3%) | 11 (29.7%) |
Housing Structures by Number of Rooms in Cherry Valley borough
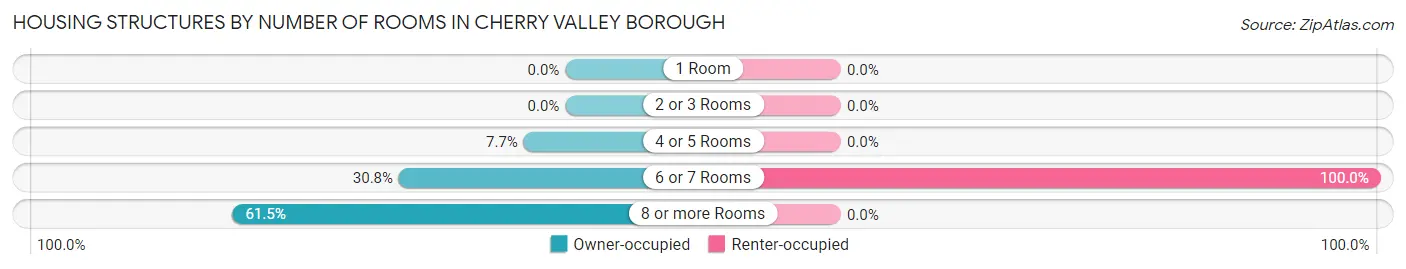
| Number of Rooms | Owner-occupied | Renter-occupied |
| 1 Room | 0 (0.0%) | 0 (0.0%) |
| 2 or 3 Rooms | 0 (0.0%) | 0 (0.0%) |
| 4 or 5 Rooms | 2 (7.7%) | 0 (0.0%) |
| 6 or 7 Rooms | 8 (30.8%) | 11 (100.0%) |
| 8 or more Rooms | 16 (61.5%) | 0 (0.0%) |
| Total | 26 (100.0%) | 11 (100.0%) |
Housing Structure by Heating Type in Cherry Valley borough
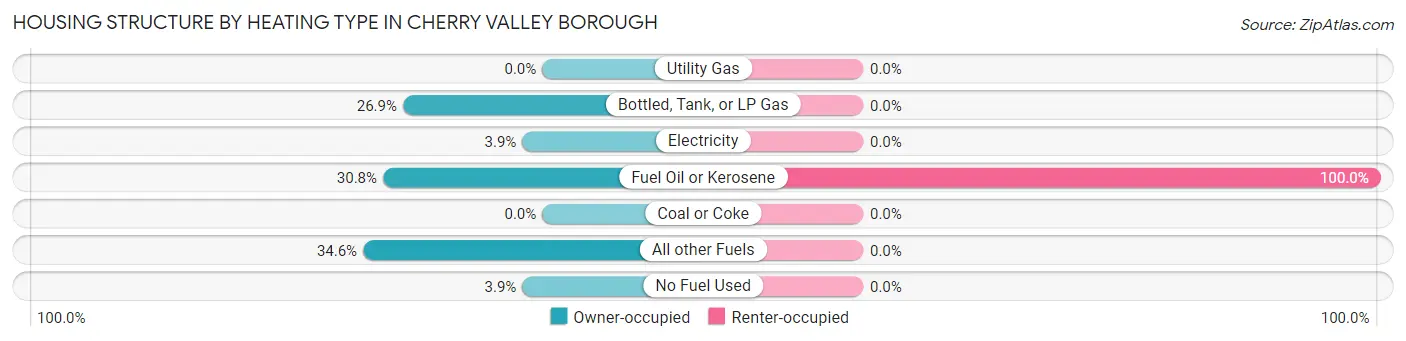
| Heating Type | Owner-occupied | Renter-occupied |
| Utility Gas | 0 (0.0%) | 0 (0.0%) |
| Bottled, Tank, or LP Gas | 7 (26.9%) | 0 (0.0%) |
| Electricity | 1 (3.8%) | 0 (0.0%) |
| Fuel Oil or Kerosene | 8 (30.8%) | 11 (100.0%) |
| Coal or Coke | 0 (0.0%) | 0 (0.0%) |
| All other Fuels | 9 (34.6%) | 0 (0.0%) |
| No Fuel Used | 1 (3.8%) | 0 (0.0%) |
| Total | 26 (100.0%) | 11 (100.0%) |
Household Vehicle Usage in Cherry Valley borough
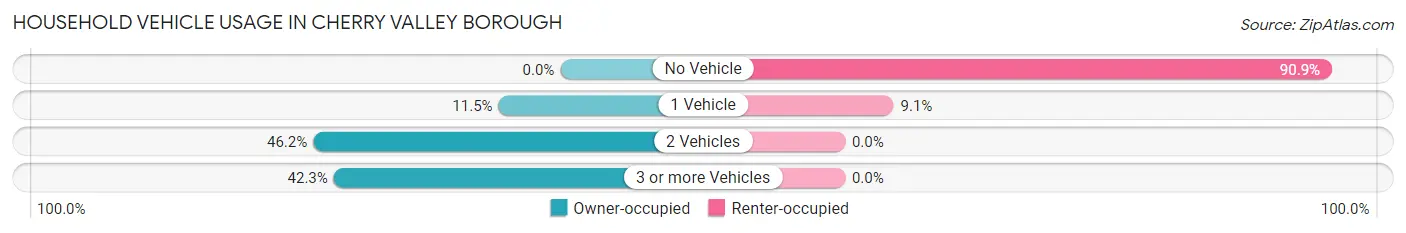
| Vehicles per Household | Owner-occupied | Renter-occupied |
| No Vehicle | 0 (0.0%) | 10 (90.9%) |
| 1 Vehicle | 3 (11.5%) | 1 (9.1%) |
| 2 Vehicles | 12 (46.2%) | 0 (0.0%) |
| 3 or more Vehicles | 11 (42.3%) | 0 (0.0%) |
| Total | 26 (100.0%) | 11 (100.0%) |
Real Estate & Mortgages in Cherry Valley borough
Real Estate and Mortgage Overview in Cherry Valley borough
| Characteristic | Without Mortgage | With Mortgage |
| Housing Units | 17 | 9 |
| Median Property Value | $215,000 | $325,000 |
| Median Household Income | $29,688 | $1 |
| Monthly Housing Costs | $384 | $1 |
| Real Estate Taxes | $2,688 | $0 |
Property Value by Mortgage Status in Cherry Valley borough
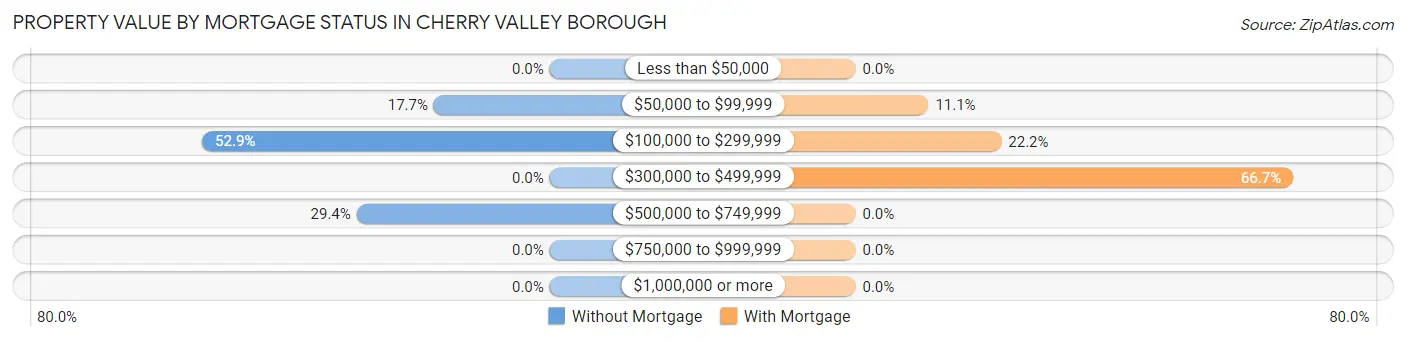
| Property Value | Without Mortgage | With Mortgage |
| Less than $50,000 | 0 (0.0%) | 0 (0.0%) |
| $50,000 to $99,999 | 3 (17.6%) | 1 (11.1%) |
| $100,000 to $299,999 | 9 (52.9%) | 2 (22.2%) |
| $300,000 to $499,999 | 0 (0.0%) | 6 (66.7%) |
| $500,000 to $749,999 | 5 (29.4%) | 0 (0.0%) |
| $750,000 to $999,999 | 0 (0.0%) | 0 (0.0%) |
| $1,000,000 or more | 0 (0.0%) | 0 (0.0%) |
| Total | 17 (100.0%) | 9 (100.0%) |
Household Income by Mortgage Status in Cherry Valley borough
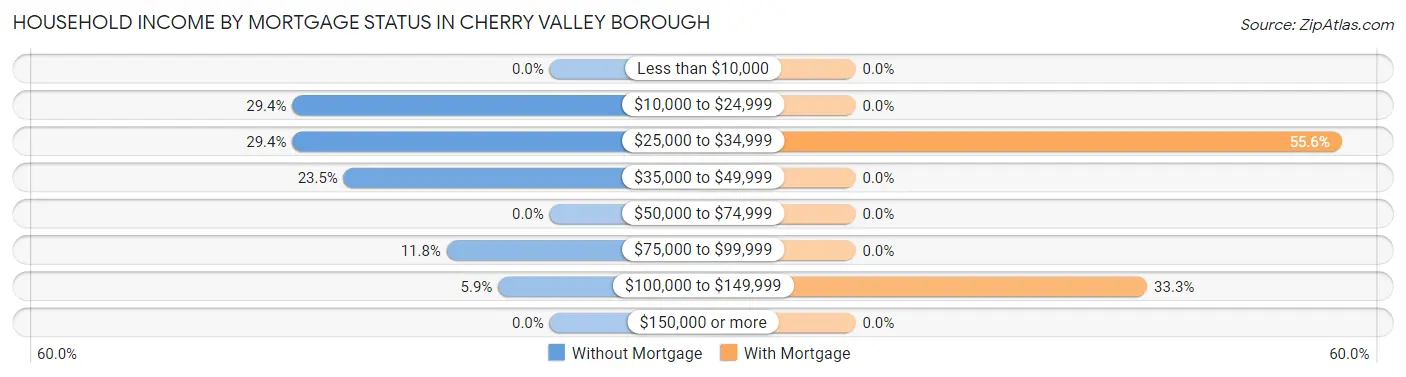
| Household Income | Without Mortgage | With Mortgage |
| Less than $10,000 | 0 (0.0%) | 0 (0.0%) |
| $10,000 to $24,999 | 5 (29.4%) | 0 (0.0%) |
| $25,000 to $34,999 | 5 (29.4%) | 5 (55.6%) |
| $35,000 to $49,999 | 4 (23.5%) | 0 (0.0%) |
| $50,000 to $74,999 | 0 (0.0%) | 0 (0.0%) |
| $75,000 to $99,999 | 2 (11.8%) | 0 (0.0%) |
| $100,000 to $149,999 | 1 (5.9%) | 3 (33.3%) |
| $150,000 or more | 0 (0.0%) | 0 (0.0%) |
| Total | 17 (100.0%) | 9 (100.0%) |
Property Value to Household Income Ratio in Cherry Valley borough
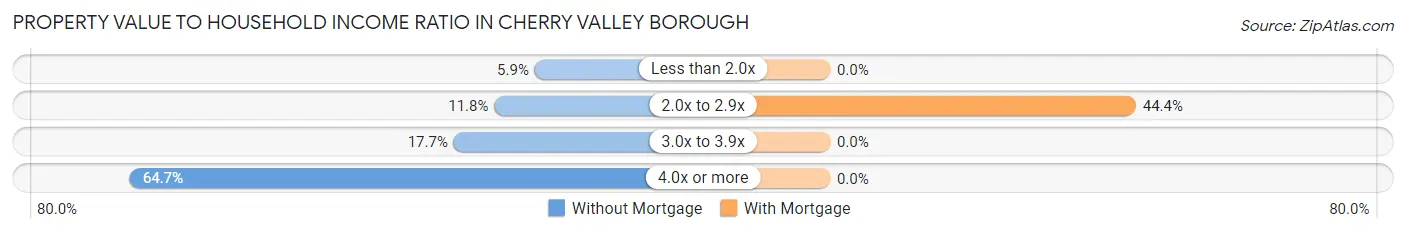
| Value-to-Income Ratio | Without Mortgage | With Mortgage |
| Less than 2.0x | 1 (5.9%) | 0 (0.0%) |
| 2.0x to 2.9x | 2 (11.8%) | 4 (44.4%) |
| 3.0x to 3.9x | 3 (17.6%) | 0 (0.0%) |
| 4.0x or more | 11 (64.7%) | 0 (0.0%) |
| Total | 17 (100.0%) | 9 (100.0%) |
Real Estate Taxes by Mortgage Status in Cherry Valley borough
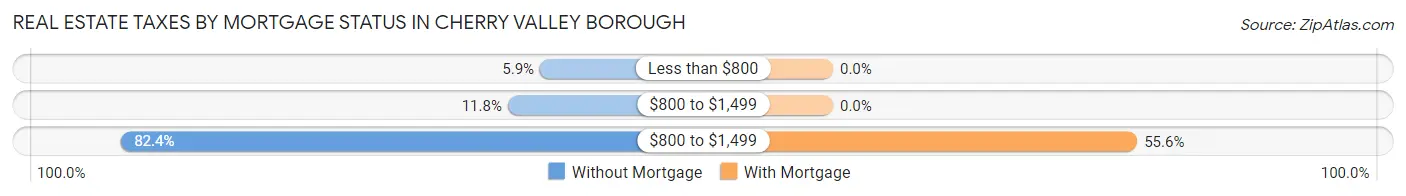
| Property Taxes | Without Mortgage | With Mortgage |
| Less than $800 | 1 (5.9%) | 0 (0.0%) |
| $800 to $1,499 | 2 (11.8%) | 0 (0.0%) |
| $800 to $1,499 | 14 (82.4%) | 5 (55.6%) |
| Total | 17 (100.0%) | 9 (100.0%) |
Health & Disability in Cherry Valley borough
Health Insurance Coverage by Age in Cherry Valley borough
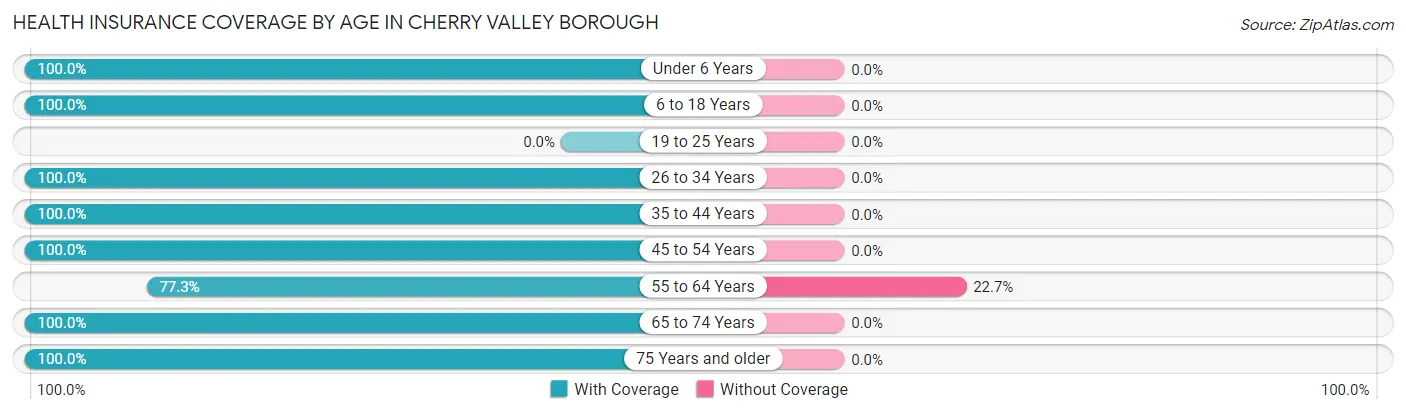
| Age Bracket | With Coverage | Without Coverage |
| Under 6 Years | 2 (100.0%) | 0 (0.0%) |
| 6 to 18 Years | 3 (100.0%) | 0 (0.0%) |
| 19 to 25 Years | 0 (0.0%) | 0 (0.0%) |
| 26 to 34 Years | 5 (100.0%) | 0 (0.0%) |
| 35 to 44 Years | 6 (100.0%) | 0 (0.0%) |
| 45 to 54 Years | 3 (100.0%) | 0 (0.0%) |
| 55 to 64 Years | 17 (77.3%) | 5 (22.7%) |
| 65 to 74 Years | 12 (100.0%) | 0 (0.0%) |
| 75 Years and older | 7 (100.0%) | 0 (0.0%) |
| Total | 55 (91.7%) | 5 (8.3%) |
Health Insurance Coverage by Citizenship Status in Cherry Valley borough
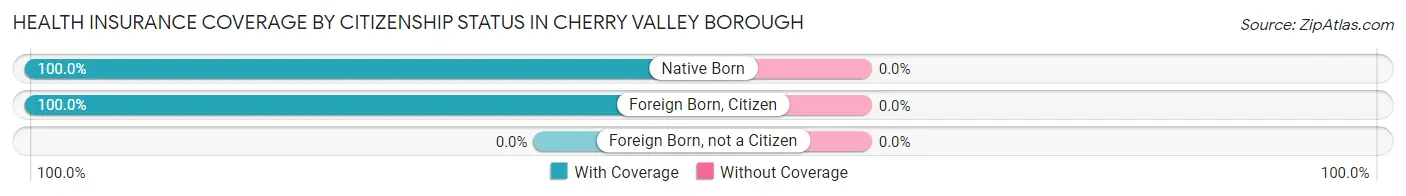
| Citizenship Status | With Coverage | Without Coverage |
| Native Born | 2 (100.0%) | 0 (0.0%) |
| Foreign Born, Citizen | 3 (100.0%) | 0 (0.0%) |
| Foreign Born, not a Citizen | 0 (0.0%) | 0 (0.0%) |
Health Insurance Coverage by Household Income in Cherry Valley borough
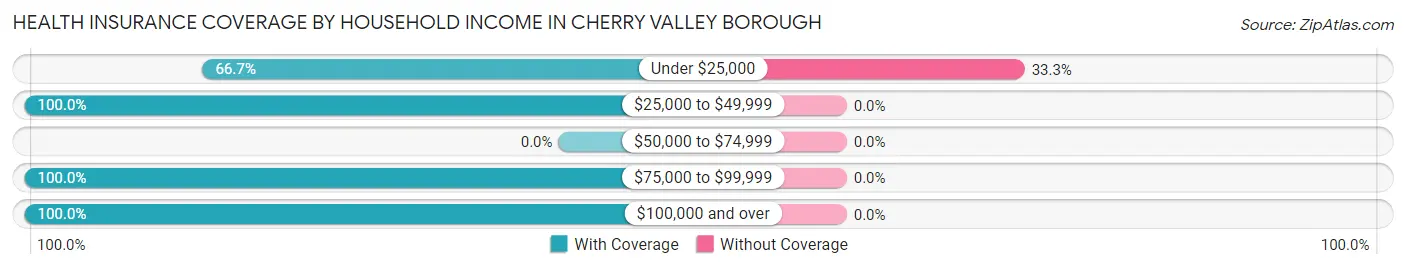
| Household Income | With Coverage | Without Coverage |
| Under $25,000 | 10 (66.7%) | 5 (33.3%) |
| $25,000 to $49,999 | 28 (100.0%) | 0 (0.0%) |
| $50,000 to $74,999 | 0 (0.0%) | 0 (0.0%) |
| $75,000 to $99,999 | 10 (100.0%) | 0 (0.0%) |
| $100,000 and over | 7 (100.0%) | 0 (0.0%) |
Public vs Private Health Insurance Coverage by Age in Cherry Valley borough
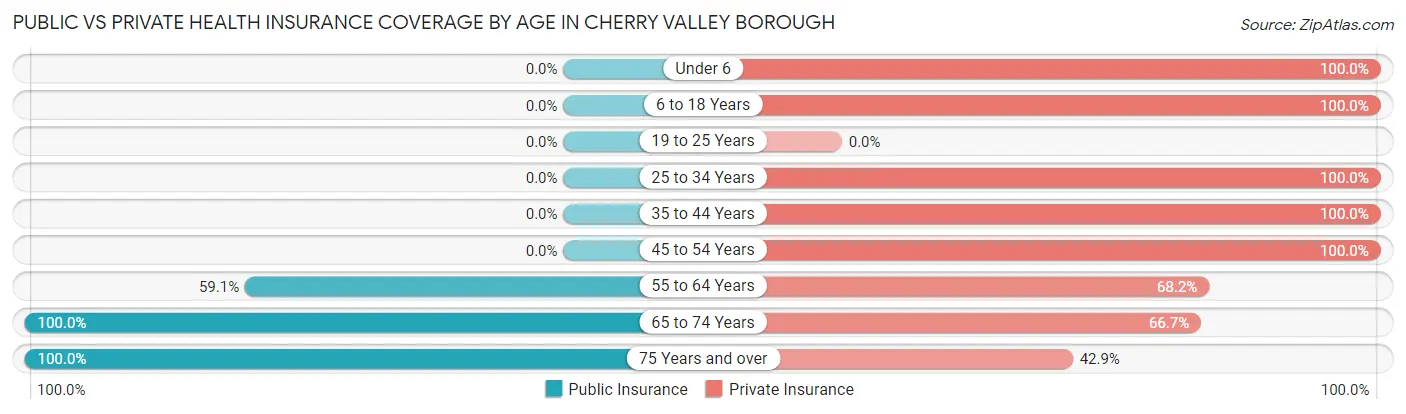
| Age Bracket | Public Insurance | Private Insurance |
| Under 6 | 0 (0.0%) | 2 (100.0%) |
| 6 to 18 Years | 0 (0.0%) | 3 (100.0%) |
| 19 to 25 Years | 0 (0.0%) | 0 (0.0%) |
| 25 to 34 Years | 0 (0.0%) | 5 (100.0%) |
| 35 to 44 Years | 0 (0.0%) | 6 (100.0%) |
| 45 to 54 Years | 0 (0.0%) | 3 (100.0%) |
| 55 to 64 Years | 13 (59.1%) | 15 (68.2%) |
| 65 to 74 Years | 12 (100.0%) | 8 (66.7%) |
| 75 Years and over | 7 (100.0%) | 3 (42.9%) |
| Total | 32 (53.3%) | 45 (75.0%) |
Disability Status by Sex by Age in Cherry Valley borough
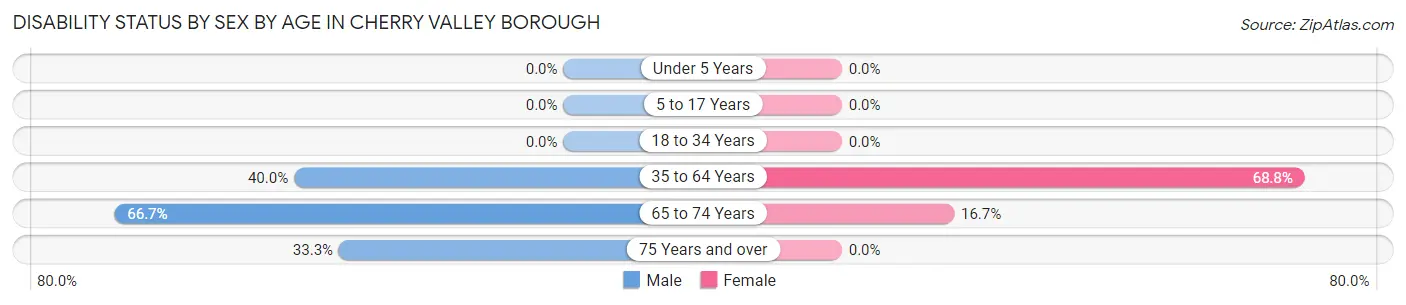
| Age Bracket | Male | Female |
| Under 5 Years | 0 (0.0%) | 0 (0.0%) |
| 5 to 17 Years | 0 (0.0%) | 0 (0.0%) |
| 18 to 34 Years | 0 (0.0%) | 0 (0.0%) |
| 35 to 64 Years | 6 (40.0%) | 11 (68.8%) |
| 65 to 74 Years | 4 (66.7%) | 1 (16.7%) |
| 75 Years and over | 1 (33.3%) | 0 (0.0%) |
Disability Class by Sex by Age in Cherry Valley borough
Disability Class: Hearing Difficulty
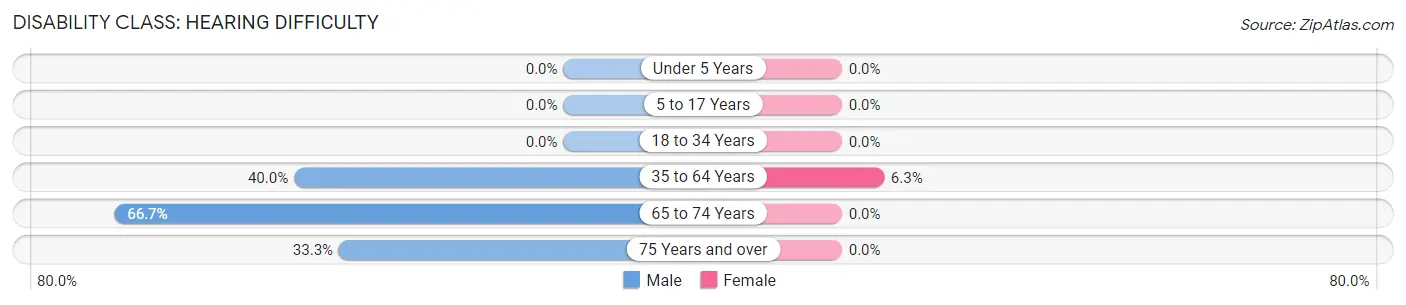
| Age Bracket | Male | Female |
| Under 5 Years | 0 (0.0%) | 0 (0.0%) |
| 5 to 17 Years | 0 (0.0%) | 0 (0.0%) |
| 18 to 34 Years | 0 (0.0%) | 0 (0.0%) |
| 35 to 64 Years | 6 (40.0%) | 1 (6.2%) |
| 65 to 74 Years | 4 (66.7%) | 0 (0.0%) |
| 75 Years and over | 1 (33.3%) | 0 (0.0%) |
Disability Class: Vision Difficulty
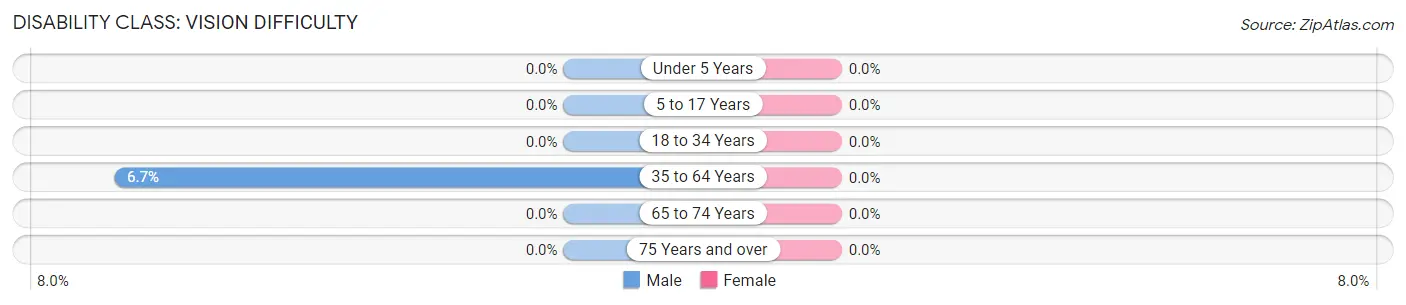
| Age Bracket | Male | Female |
| Under 5 Years | 0 (0.0%) | 0 (0.0%) |
| 5 to 17 Years | 0 (0.0%) | 0 (0.0%) |
| 18 to 34 Years | 0 (0.0%) | 0 (0.0%) |
| 35 to 64 Years | 1 (6.7%) | 0 (0.0%) |
| 65 to 74 Years | 0 (0.0%) | 0 (0.0%) |
| 75 Years and over | 0 (0.0%) | 0 (0.0%) |
Disability Class: Cognitive Difficulty
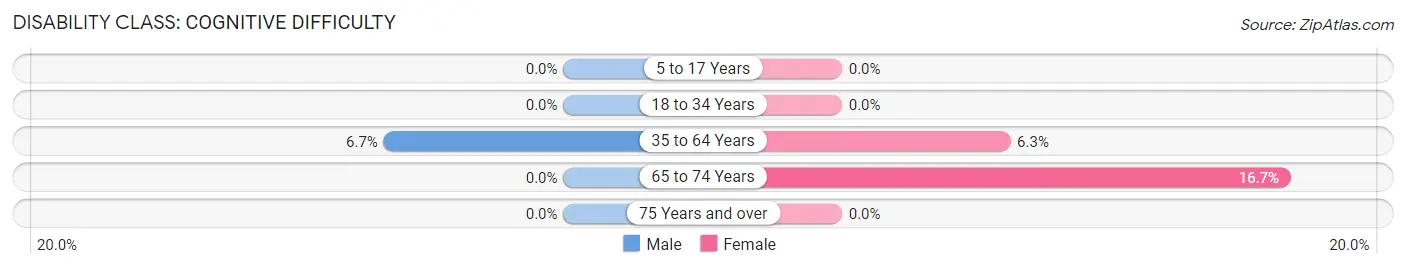
| Age Bracket | Male | Female |
| 5 to 17 Years | 0 (0.0%) | 0 (0.0%) |
| 18 to 34 Years | 0 (0.0%) | 0 (0.0%) |
| 35 to 64 Years | 1 (6.7%) | 1 (6.2%) |
| 65 to 74 Years | 0 (0.0%) | 1 (16.7%) |
| 75 Years and over | 0 (0.0%) | 0 (0.0%) |
Disability Class: Ambulatory Difficulty
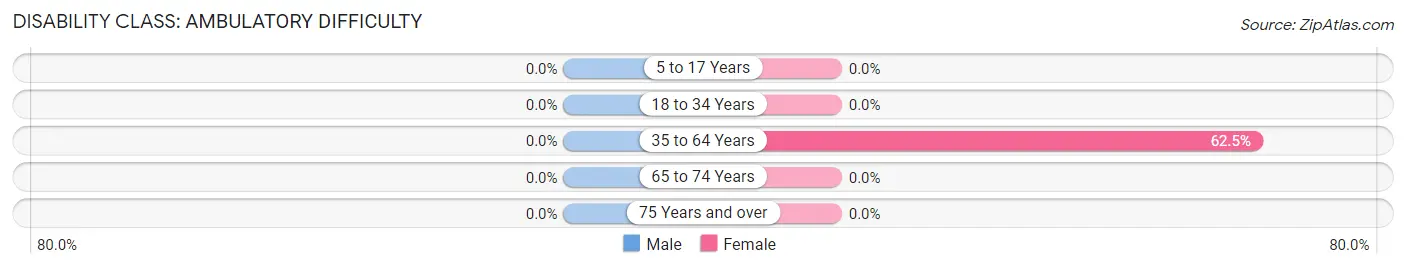
| Age Bracket | Male | Female |
| 5 to 17 Years | 0 (0.0%) | 0 (0.0%) |
| 18 to 34 Years | 0 (0.0%) | 0 (0.0%) |
| 35 to 64 Years | 0 (0.0%) | 10 (62.5%) |
| 65 to 74 Years | 0 (0.0%) | 0 (0.0%) |
| 75 Years and over | 0 (0.0%) | 0 (0.0%) |
Disability Class: Self-Care Difficulty
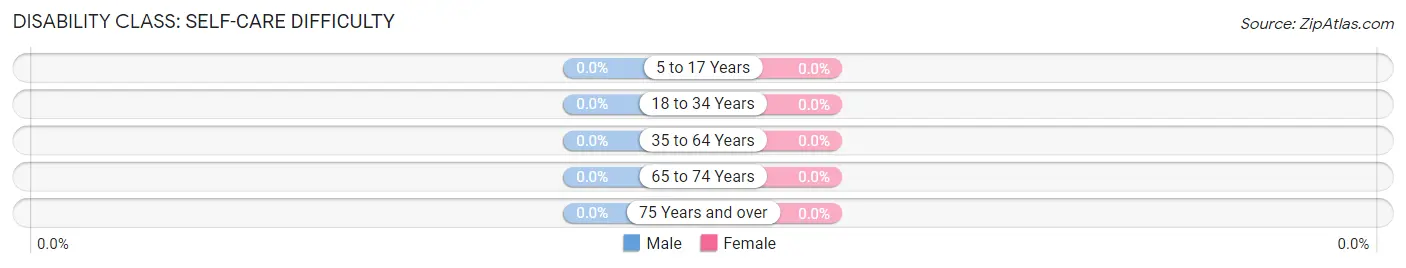
| Age Bracket | Male | Female |
| 5 to 17 Years | 0 (0.0%) | 0 (0.0%) |
| 18 to 34 Years | 0 (0.0%) | 0 (0.0%) |
| 35 to 64 Years | 0 (0.0%) | 0 (0.0%) |
| 65 to 74 Years | 0 (0.0%) | 0 (0.0%) |
| 75 Years and over | 0 (0.0%) | 0 (0.0%) |
Technology Access in Cherry Valley borough
Computing Device Access in Cherry Valley borough
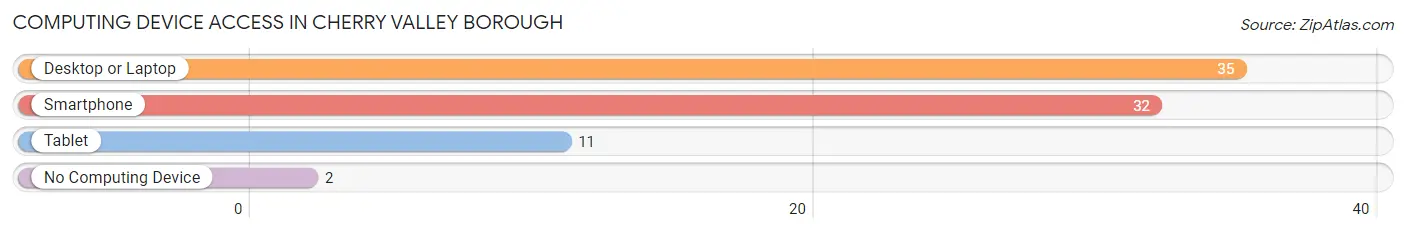
| Device Type | # Households | % Households |
| Desktop or Laptop | 35 | 94.6% |
| Smartphone | 32 | 86.5% |
| Tablet | 11 | 29.7% |
| No Computing Device | 2 | 5.4% |
| Total | 37 | 100.0% |
Internet Access in Cherry Valley borough
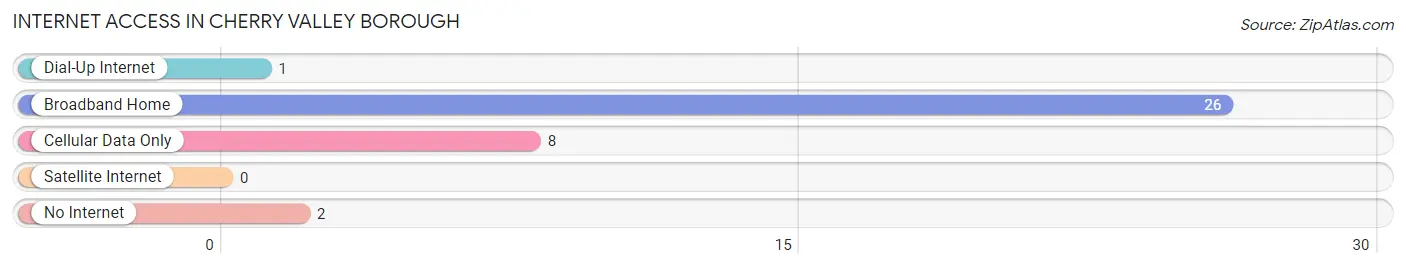
| Internet Type | # Households | % Households |
| Dial-Up Internet | 1 | 2.7% |
| Broadband Home | 26 | 70.3% |
| Cellular Data Only | 8 | 21.6% |
| Satellite Internet | 0 | 0.0% |
| No Internet | 2 | 5.4% |
| Total | 37 | 100.0% |
Cherry Valley borough Summary
Cherry Valley Borough is a small borough located in Bucks County, Pennsylvania. It is situated in the southeastern corner of the county, just north of Philadelphia. The borough is bordered by the townships of Bedminster, Plumstead, and Warrington. The population of Cherry Valley Borough was 1,845 at the 2010 census.
History
The area that is now Cherry Valley Borough was first settled in the late 1700s by German and English immigrants. The first settlers were primarily farmers, and the area was known as “Cherry Valley” due to the abundance of wild cherry trees in the area. The area was officially incorporated as a borough in 1891.
In the early 1900s, the borough began to grow and develop. The first post office was established in 1906, and the first school was built in 1908. The borough also had a number of small businesses, including a general store, a blacksmith shop, and a grist mill.
In the 1950s, the borough began to experience a period of growth and development. The population increased from 1,000 in 1950 to 1,845 in 2010. The borough also saw the construction of new homes, businesses, and public facilities.
Geography
Cherry Valley Borough is located in southeastern Bucks County, Pennsylvania. It is situated in the Delaware Valley, just north of Philadelphia. The borough is bordered by the townships of Bedminster, Plumstead, and Warrington.
The borough has a total area of 1.2 square miles, all of which is land. The terrain is mostly flat, with some rolling hills. The borough is located in the Piedmont region of Pennsylvania, and is part of the Atlantic Coastal Plain.
Economy
The economy of Cherry Valley Borough is largely based on small businesses and services. The borough is home to a number of small businesses, including restaurants, retail stores, and professional services. The borough also has a number of industrial and manufacturing businesses.
The borough is also home to a number of public facilities, including a library, a post office, and a fire station. The borough is served by the Southeastern Pennsylvania Transportation Authority (SEPTA), which provides bus and rail service to the area.
Demographics
As of the 2010 census, the population of Cherry Valley Borough was 1,845. The racial makeup of the borough was 94.3% White, 2.2% African American, 0.3% Native American, 0.7% Asian, 0.1% Pacific Islander, 0.9% from other races, and 1.5% from two or more races. Hispanic or Latino of any race were 2.2% of the population.
The median household income in the borough was $60,938, and the median family income was $68,750. The per capita income was $27,945. About 4.3% of families and 5.3% of the population were below the poverty line, including 6.2% of those under age 18 and 4.2% of those age 65 or over.
Common Questions
What is the Total Population of Cherry Valley borough?
Total Population of Cherry Valley borough is 60.
What is the Total Male Population of Cherry Valley borough?
Total Male Population of Cherry Valley borough is 32.
What is the Total Female Population of Cherry Valley borough?
Total Female Population of Cherry Valley borough is 28.
What is the Ratio of Males per 100 Females in Cherry Valley borough?
There are 114.29 Males per 100 Females in Cherry Valley borough.
What is the Ratio of Females per 100 Males in Cherry Valley borough?
There are 87.50 Females per 100 Males in Cherry Valley borough.
What is the Median Population Age in Cherry Valley borough?
Median Population Age in Cherry Valley borough is 62.0 Years.
What is the Average Family Size in Cherry Valley borough
Average Family Size in Cherry Valley borough is 2.3 People.
What is the Average Household Size in Cherry Valley borough
Average Household Size in Cherry Valley borough is 1.6 People.
What is Per Capita Income in Cherry Valley borough?
Per Capita income in Cherry Valley borough is $30,847.
What is the Median Family Income in Cherry Valley borough?
Median Family Income in Cherry Valley borough is $35,000.
What is the Median Household income in Cherry Valley borough?
Median Household Income in Cherry Valley borough is $41,875.
What is Inequality or Gini Index in Cherry Valley borough?
Inequality or Gini Index in Cherry Valley borough is 0.35.
How Large is the Labor Force in Cherry Valley borough?
There are 24 People in the Labor Forcein in Cherry Valley borough.
What is the Percentage of People in the Labor Force in Cherry Valley borough?
43.6% of People are in the Labor Force in Cherry Valley borough.