Georgetown, OH
Georgetown Map
Georgetown Overview
4,323
TOTAL POPULATION
2,115
MALE POPULATION
2,208
FEMALE POPULATION
95.79
MALES / 100 FEMALES
104.40
FEMALES / 100 MALES
45.1
MEDIAN AGE
3.2
AVG FAMILY SIZE
2.1
AVG HOUSEHOLD SIZE
$27,075
PER CAPITA INCOME
$79,417
AVG FAMILY INCOME
$37,796
AVG HOUSEHOLD INCOME
45.2%
WAGE / INCOME GAP [ % ]
54.8¢/ $1
WAGE / INCOME GAP [ $ ]
0.52
INEQUALITY / GINI INDEX
1,527
LABOR FORCE [ PEOPLE ]
42.3%
PERCENT IN LABOR FORCE
2.6%
UNEMPLOYMENT RATE
Georgetown Zip Codes
Georgetown Area Codes
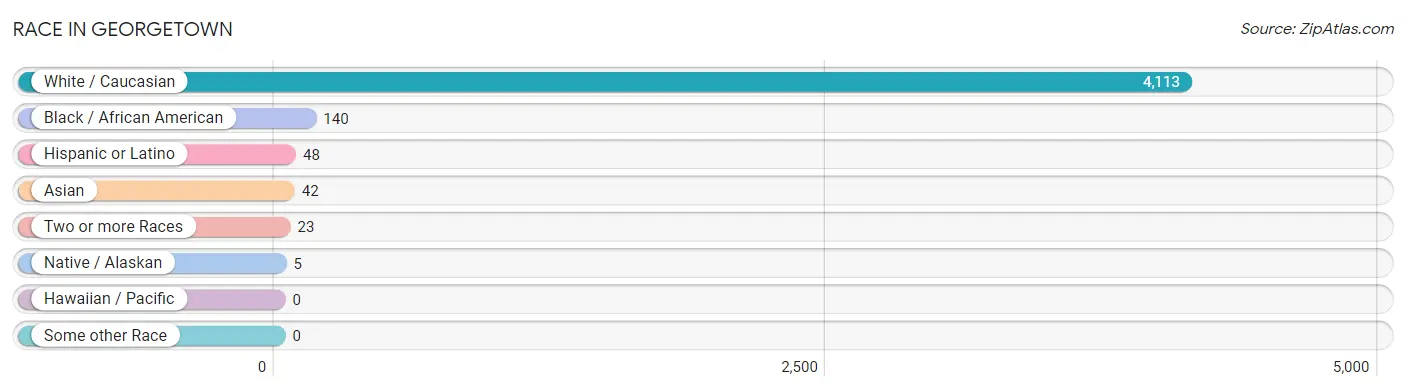
Race in Georgetown
The most populous races in Georgetown are White / Caucasian (4,113 | 95.1%), Black / African American (140 | 3.2%), and Hispanic or Latino (48 | 1.1%).
| Race | # Population | % Population |
| Asian | 42 | 1.0% |
| Black / African American | 140 | 3.2% |
| Hawaiian / Pacific | 0 | 0.0% |
| Hispanic or Latino | 48 | 1.1% |
| Native / Alaskan | 5 | 0.1% |
| White / Caucasian | 4,113 | 95.1% |
| Two or more Races | 23 | 0.5% |
| Some other Race | 0 | 0.0% |
| Total | 4,323 | 100.0% |
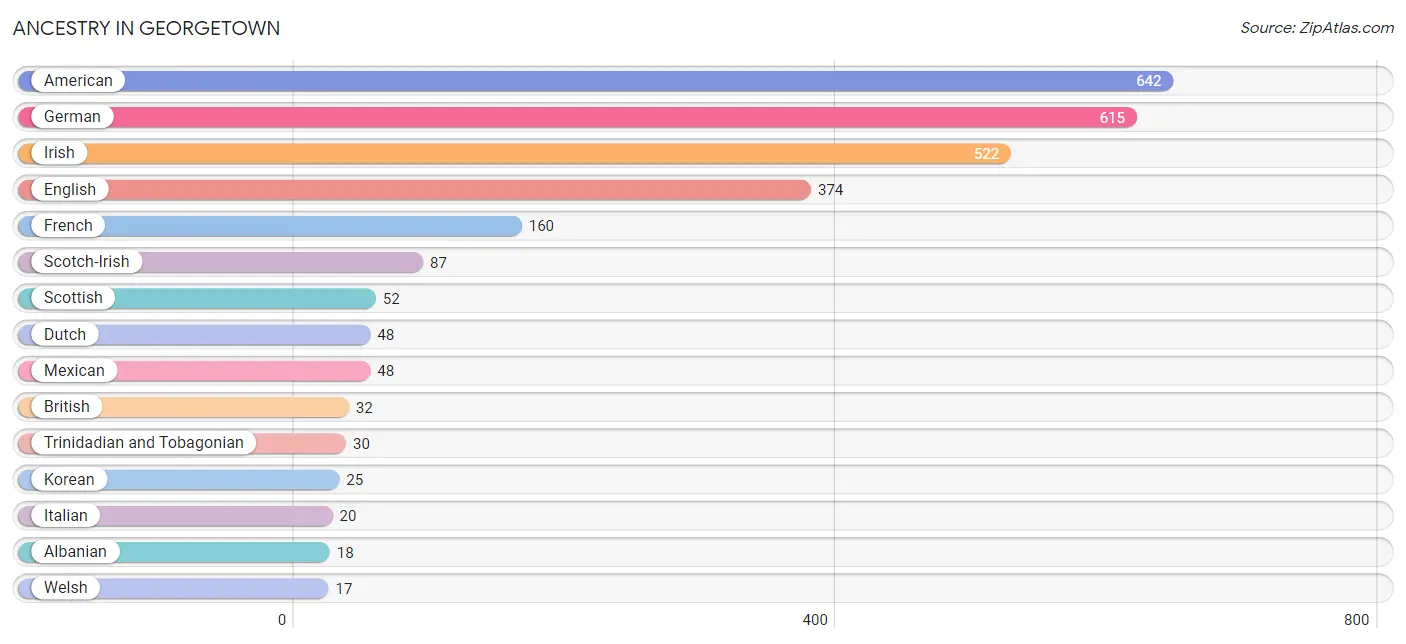
Ancestry in Georgetown
The most populous ancestries reported in Georgetown are American (642 | 14.8%), German (615 | 14.2%), Irish (522 | 12.1%), English (374 | 8.6%), and French (160 | 3.7%), together accounting for 53.5% of all Georgetown residents.
| Ancestry | # Population | % Population |
| Albanian | 18 | 0.4% |
| American | 642 | 14.8% |
| Blackfeet | 3 | 0.1% |
| British | 32 | 0.7% |
| Cherokee | 3 | 0.1% |
| Croatian | 5 | 0.1% |
| Czech | 15 | 0.4% |
| Dutch | 48 | 1.1% |
| English | 374 | 8.6% |
| European | 15 | 0.4% |
| French | 160 | 3.7% |
| German | 615 | 14.2% |
| Indian (Asian) | 3 | 0.1% |
| Irish | 522 | 12.1% |
| Iroquois | 3 | 0.1% |
| Italian | 20 | 0.5% |
| Korean | 25 | 0.6% |
| Mexican | 48 | 1.1% |
| Puget Sound Salish | 5 | 0.1% |
| Scandinavian | 14 | 0.3% |
| Scotch-Irish | 87 | 2.0% |
| Scottish | 52 | 1.2% |
| Sioux | 3 | 0.1% |
| Trinidadian and Tobagonian | 30 | 0.7% |
| Welsh | 17 | 0.4% | View All 25 Rows |
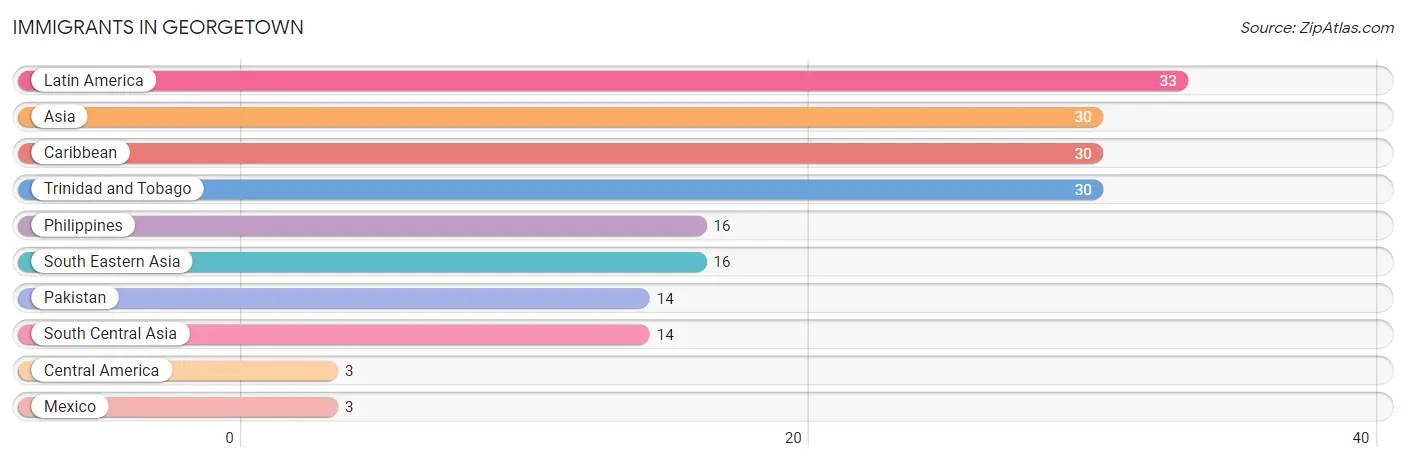
Immigrants in Georgetown
The most numerous immigrant groups reported in Georgetown came from Latin America (33 | 0.8%), Asia (30 | 0.7%), Caribbean (30 | 0.7%), Trinidad and Tobago (30 | 0.7%), and Philippines (16 | 0.4%), together accounting for 3.2% of all Georgetown residents.
| Immigration Origin | # Population | % Population |
| Asia | 30 | 0.7% |
| Caribbean | 30 | 0.7% |
| Central America | 3 | 0.1% |
| Latin America | 33 | 0.8% |
| Mexico | 3 | 0.1% |
| Pakistan | 14 | 0.3% |
| Philippines | 16 | 0.4% |
| South Central Asia | 14 | 0.3% |
| South Eastern Asia | 16 | 0.4% |
| Trinidad and Tobago | 30 | 0.7% | View All 10 Rows |
Sex and Age in Georgetown
Sex and Age in Georgetown
The most populous age groups in Georgetown are 15 to 19 Years (240 | 11.4%) for men and 10 to 14 Years (261 | 11.8%) for women.
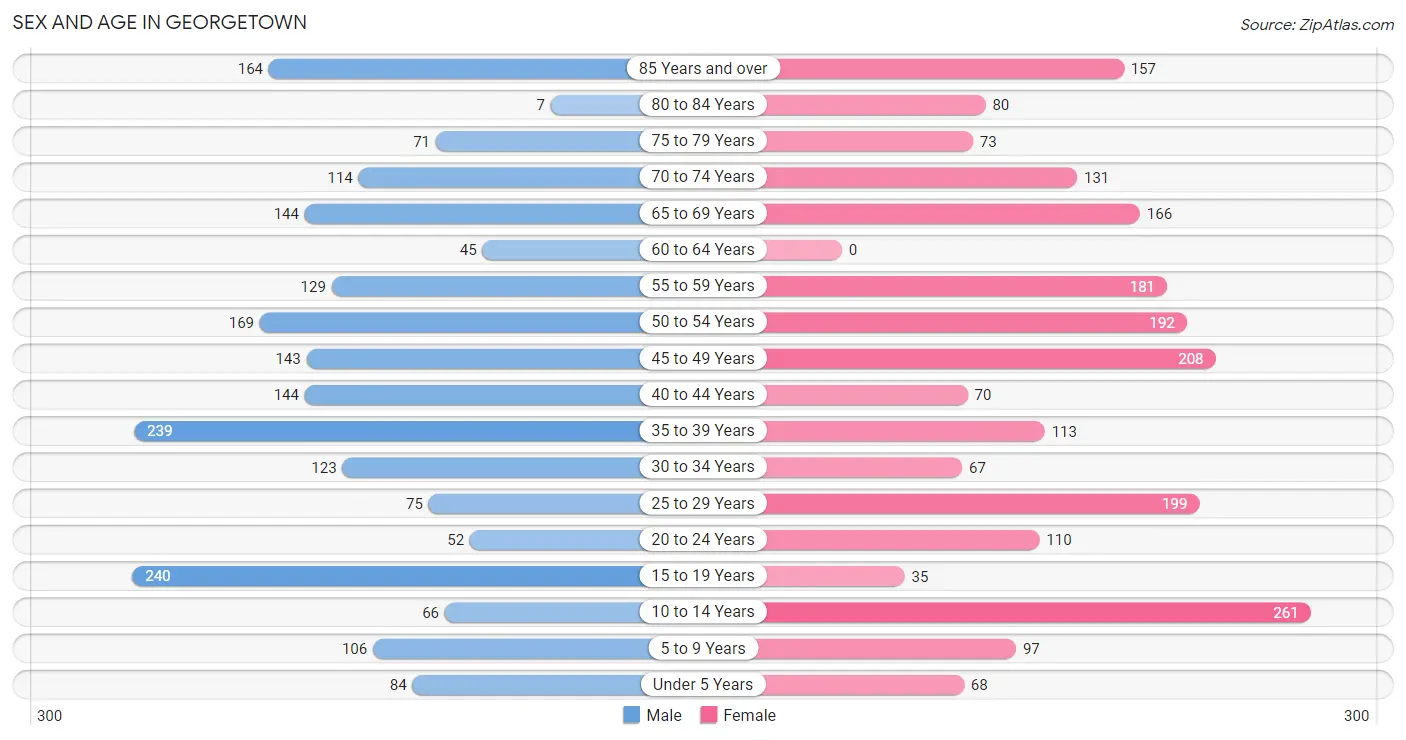
| Age Bracket | Male | Female |
| Under 5 Years | 84 (4.0%) | 68 (3.1%) |
| 5 to 9 Years | 106 (5.0%) | 97 (4.4%) |
| 10 to 14 Years | 66 (3.1%) | 261 (11.8%) |
| 15 to 19 Years | 240 (11.4%) | 35 (1.6%) |
| 20 to 24 Years | 52 (2.5%) | 110 (5.0%) |
| 25 to 29 Years | 75 (3.5%) | 199 (9.0%) |
| 30 to 34 Years | 123 (5.8%) | 67 (3.0%) |
| 35 to 39 Years | 239 (11.3%) | 113 (5.1%) |
| 40 to 44 Years | 144 (6.8%) | 70 (3.2%) |
| 45 to 49 Years | 143 (6.8%) | 208 (9.4%) |
| 50 to 54 Years | 169 (8.0%) | 192 (8.7%) |
| 55 to 59 Years | 129 (6.1%) | 181 (8.2%) |
| 60 to 64 Years | 45 (2.1%) | 0 (0.0%) |
| 65 to 69 Years | 144 (6.8%) | 166 (7.5%) |
| 70 to 74 Years | 114 (5.4%) | 131 (5.9%) |
| 75 to 79 Years | 71 (3.4%) | 73 (3.3%) |
| 80 to 84 Years | 7 (0.3%) | 80 (3.6%) |
| 85 Years and over | 164 (7.7%) | 157 (7.1%) |
| Total | 2,115 (100.0%) | 2,208 (100.0%) |
Families and Households in Georgetown
Median Family Size in Georgetown
The median family size in Georgetown is 3.24 persons per family, with single female/mother families (102 | 11.6%) accounting for the largest median family size of 3.97 persons per family. On the other hand, single male/father families (121 | 13.8%) represent the smallest median family size with 2.18 persons per family.
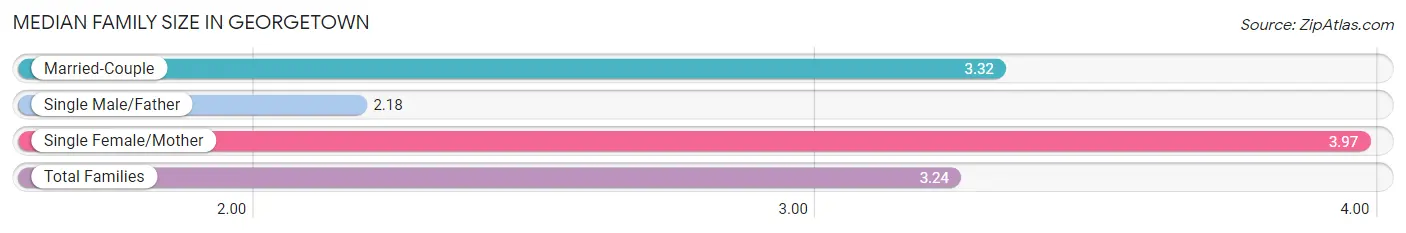
| Family Type | # Families | Family Size |
| Married-Couple | 656 (74.6%) | 3.32 |
| Single Male/Father | 121 (13.8%) | 2.18 |
| Single Female/Mother | 102 (11.6%) | 3.97 |
| Total Families | 879 (100.0%) | 3.24 |
Median Household Size in Georgetown
The median household size in Georgetown is 2.07 persons per household, with single female/mother households (102 | 5.3%) accounting for the largest median household size of 4.21 persons per household. non-family households (1,042 | 54.2%) represent the smallest median household size with 1.02 persons per household.
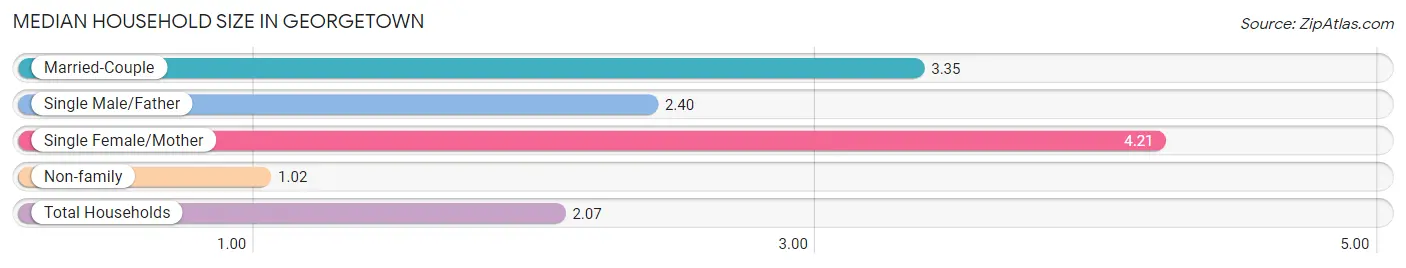
| Household Type | # Households | Household Size |
| Married-Couple | 656 (34.2%) | 3.35 |
| Single Male/Father | 121 (6.3%) | 2.40 |
| Single Female/Mother | 102 (5.3%) | 4.21 |
| Non-family | 1,042 (54.2%) | 1.02 |
| Total Households | 1,921 (100.0%) | 2.07 |
Household Size by Marriage Status in Georgetown
Out of a total of 1,921 households in Georgetown, 879 (45.8%) are family households, while 1,042 (54.2%) are nonfamily households. The most numerous type of family households are 2-person households, comprising 269, and the most common type of nonfamily households are 1-person households, comprising 1,010.
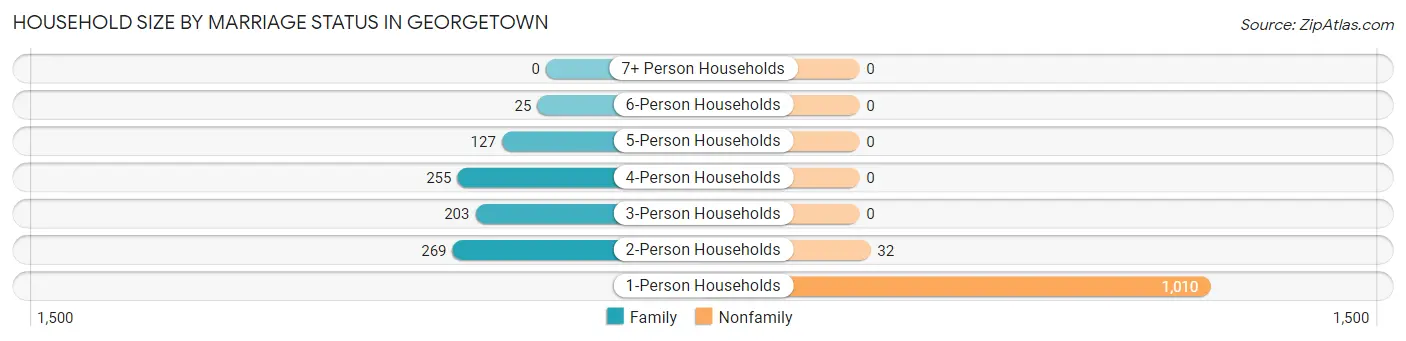
| Household Size | Family Households | Nonfamily Households |
| 1-Person Households | - | 1,010 (52.6%) |
| 2-Person Households | 269 (14.0%) | 32 (1.7%) |
| 3-Person Households | 203 (10.6%) | 0 (0.0%) |
| 4-Person Households | 255 (13.3%) | 0 (0.0%) |
| 5-Person Households | 127 (6.6%) | 0 (0.0%) |
| 6-Person Households | 25 (1.3%) | 0 (0.0%) |
| 7+ Person Households | 0 (0.0%) | 0 (0.0%) |
| Total | 879 (45.8%) | 1,042 (54.2%) |
Female Fertility in Georgetown
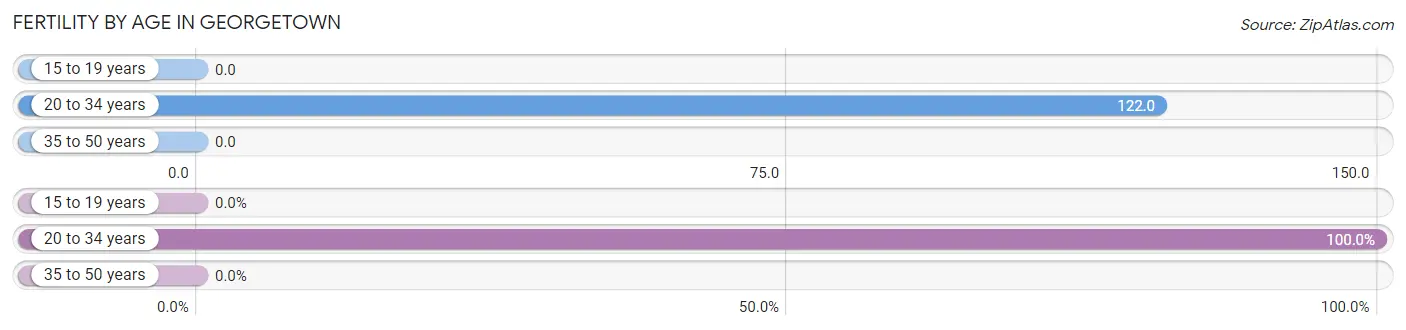
Fertility by Age in Georgetown
Average fertility rate in Georgetown is 51.0 births per 1,000 women. Women in the age bracket of 20 to 34 years have the highest fertility rate with 122.0 births per 1,000 women. Women in the age bracket of 20 to 34 years acount for 100.0% of all women with births.
| Age Bracket | Women with Births | Births / 1,000 Women |
| 15 to 19 years | 0 (0.0%) | 0.0 |
| 20 to 34 years | 46 (100.0%) | 122.0 |
| 35 to 50 years | 0 (0.0%) | 0.0 |
| Total | 46 (100.0%) | 51.0 |
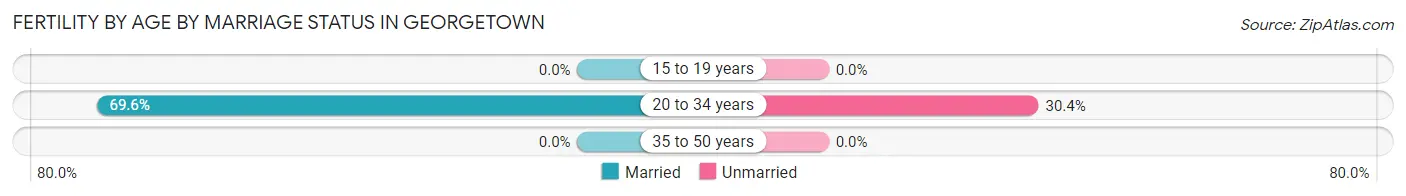
Fertility by Age by Marriage Status in Georgetown
69.6% of women with births (46) in Georgetown are married. The highest percentage of unmarried women with births falls into 20 to 34 years age bracket with 30.4% of them unmarried at the time of birth, while the lowest percentage of unmarried women with births belong to 20 to 34 years age bracket with 30.4% of them unmarried.
| Age Bracket | Married | Unmarried |
| 15 to 19 years | 0 (0.0%) | 0 (0.0%) |
| 20 to 34 years | 32 (69.6%) | 14 (30.4%) |
| 35 to 50 years | 0 (0.0%) | 0 (0.0%) |
| Total | 32 (69.6%) | 14 (30.4%) |
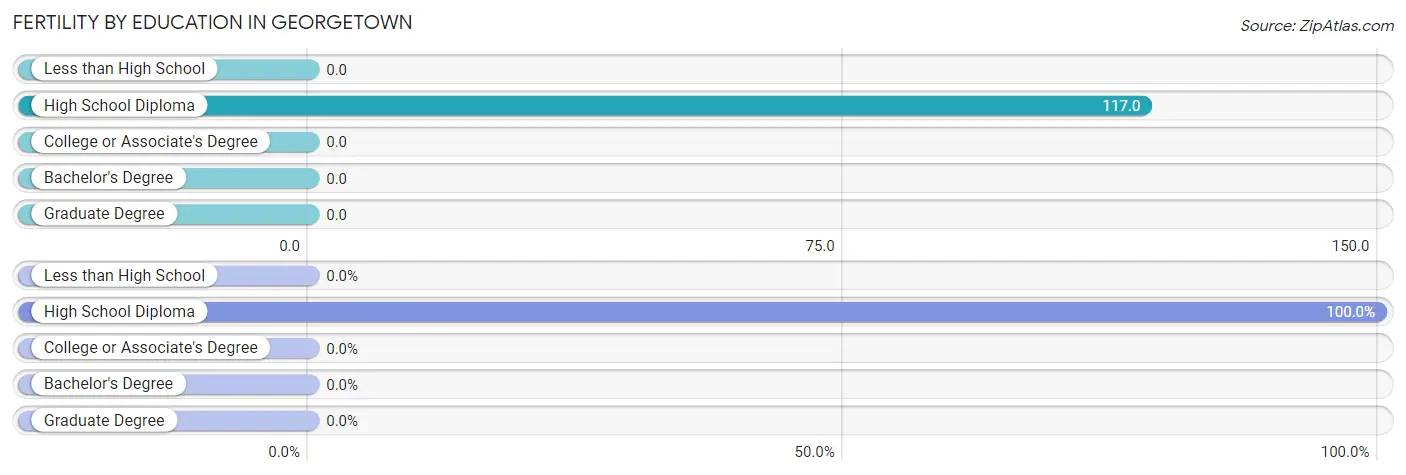
Fertility by Education in Georgetown
| Educational Attainment | Women with Births | Births / 1,000 Women |
| Less than High School | 0 (0.0%) | 0.0 |
| High School Diploma | 46 (100.0%) | 117.0 |
| College or Associate's Degree | 0 (0.0%) | 0.0 |
| Bachelor's Degree | 0 (0.0%) | 0.0 |
| Graduate Degree | 0 (0.0%) | 0.0 |
| Total | 46 (100.0%) | 51.0 |
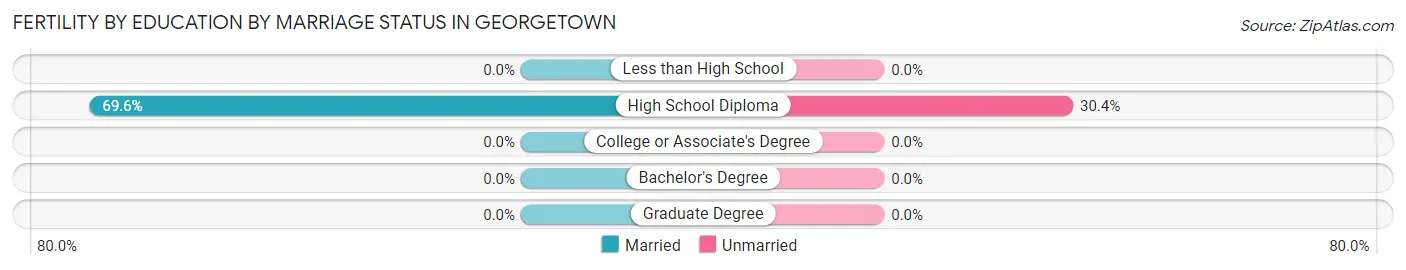
Fertility by Education by Marriage Status in Georgetown
30.4% of women with births in Georgetown are unmarried. Women with the educational attainment of high school diploma are most likely to be married with 69.6% of them married at childbirth, while women with the educational attainment of high school diploma are least likely to be married with 30.4% of them unmarried at childbirth.
| Educational Attainment | Married | Unmarried |
| Less than High School | 0 (0.0%) | 0 (0.0%) |
| High School Diploma | 32 (69.6%) | 14 (30.4%) |
| College or Associate's Degree | 0 (0.0%) | 0 (0.0%) |
| Bachelor's Degree | 0 (0.0%) | 0 (0.0%) |
| Graduate Degree | 0 (0.0%) | 0 (0.0%) |
| Total | 32 (69.6%) | 14 (30.4%) |
Income in Georgetown
Income Overview in Georgetown
Per Capita Income in Georgetown is $27,075, while median incomes of families and households are $79,417 and $37,796 respectively.
| Characteristic | Number | Measure |
| Per Capita Income | 4,323 | $27,075 |
| Median Family Income | 879 | $79,417 |
| Mean Family Income | 879 | $94,084 |
| Median Household Income | 1,921 | $37,796 |
| Mean Household Income | 1,921 | $56,771 |
| Income Deficit | 879 | $0 |
| Wage / Income Gap (%) | 4,323 | 45.23% |
| Wage / Income Gap ($) | 4,323 | 54.77¢ per $1 |
| Gini / Inequality Index | 4,323 | 0.52 |
Earnings by Sex in Georgetown
Average Earnings in Georgetown are $37,444, $57,597 for men and $31,548 for women, a difference of 45.2%.
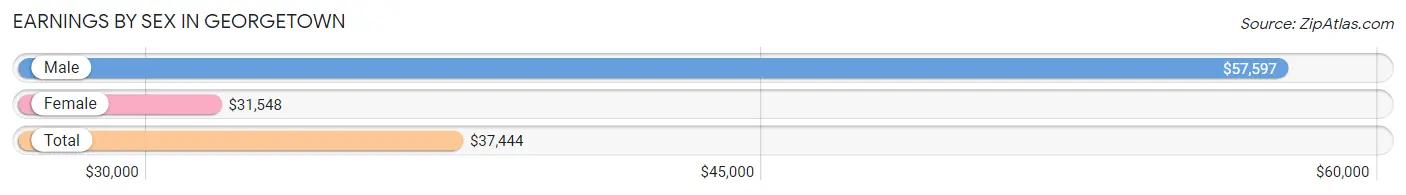
| Sex | Number | Average Earnings |
| Male | 794 (48.4%) | $57,597 |
| Female | 848 (51.6%) | $31,548 |
| Total | 1,642 (100.0%) | $37,444 |
Earnings by Sex by Income Bracket in Georgetown
The most common earnings brackets in Georgetown are $55,000 to $64,999 for men (146 | 18.4%) and $30,000 to $34,999 for women (204 | 24.1%).
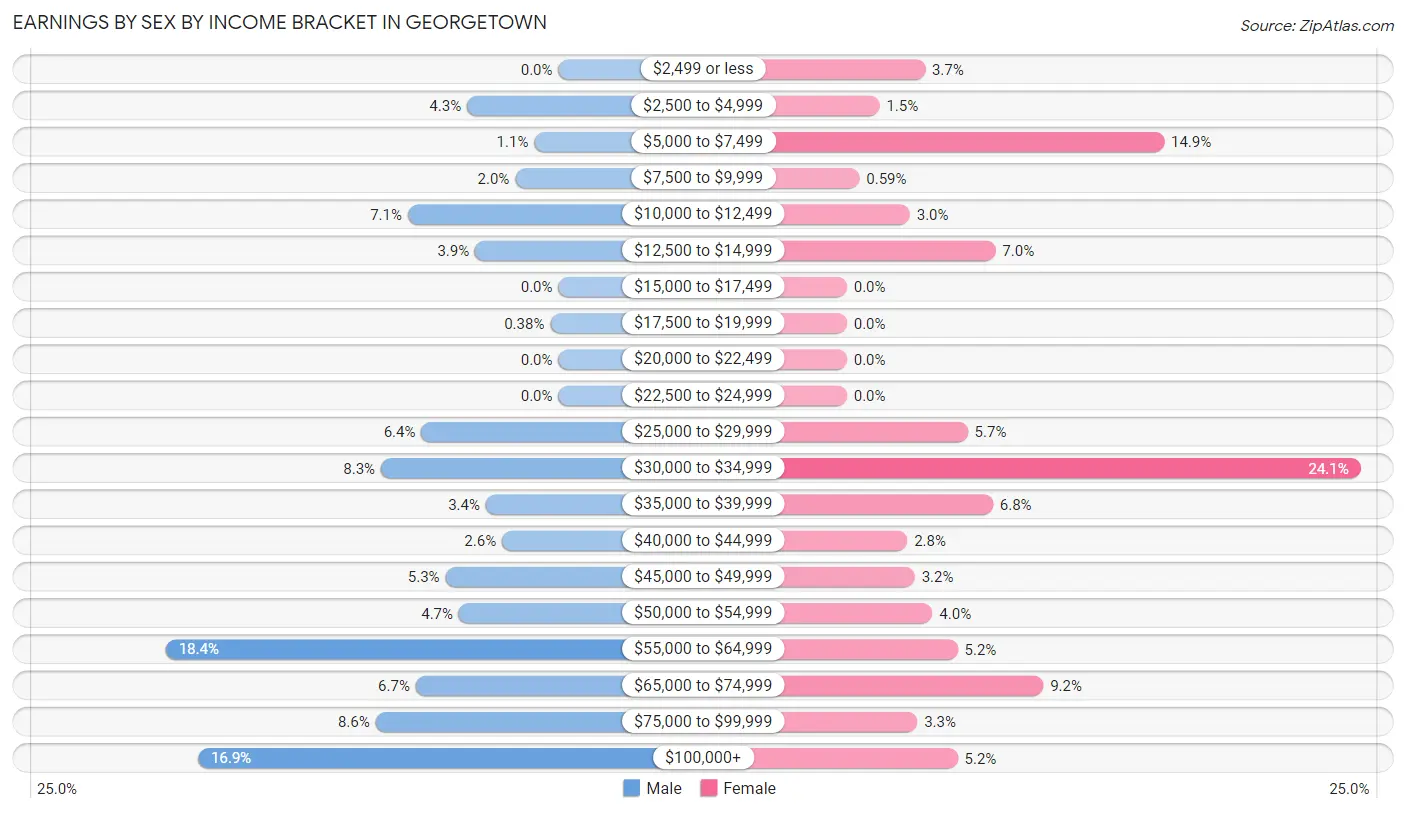
| Income | Male | Female |
| $2,499 or less | 0 (0.0%) | 31 (3.7%) |
| $2,500 to $4,999 | 34 (4.3%) | 13 (1.5%) |
| $5,000 to $7,499 | 9 (1.1%) | 126 (14.9%) |
| $7,500 to $9,999 | 16 (2.0%) | 5 (0.6%) |
| $10,000 to $12,499 | 56 (7.0%) | 25 (2.9%) |
| $12,500 to $14,999 | 31 (3.9%) | 59 (7.0%) |
| $15,000 to $17,499 | 0 (0.0%) | 0 (0.0%) |
| $17,500 to $19,999 | 3 (0.4%) | 0 (0.0%) |
| $20,000 to $22,499 | 0 (0.0%) | 0 (0.0%) |
| $22,500 to $24,999 | 0 (0.0%) | 0 (0.0%) |
| $25,000 to $29,999 | 51 (6.4%) | 48 (5.7%) |
| $30,000 to $34,999 | 66 (8.3%) | 204 (24.1%) |
| $35,000 to $39,999 | 27 (3.4%) | 58 (6.8%) |
| $40,000 to $44,999 | 21 (2.6%) | 24 (2.8%) |
| $45,000 to $49,999 | 42 (5.3%) | 27 (3.2%) |
| $50,000 to $54,999 | 37 (4.7%) | 34 (4.0%) |
| $55,000 to $64,999 | 146 (18.4%) | 44 (5.2%) |
| $65,000 to $74,999 | 53 (6.7%) | 78 (9.2%) |
| $75,000 to $99,999 | 68 (8.6%) | 28 (3.3%) |
| $100,000+ | 134 (16.9%) | 44 (5.2%) |
| Total | 794 (100.0%) | 848 (100.0%) |
Earnings by Sex by Educational Attainment in Georgetown
Average earnings in Georgetown are $58,081 for men and $32,057 for women, a difference of 44.8%. Men with an educational attainment of bachelor's degree enjoy the highest average annual earnings of $74,167, while those with less than high school education earn the least with $30,932. Women with an educational attainment of college or associate's degree earn the most with the average annual earnings of $60,550, while those with high school diploma education have the smallest earnings of $30,880.
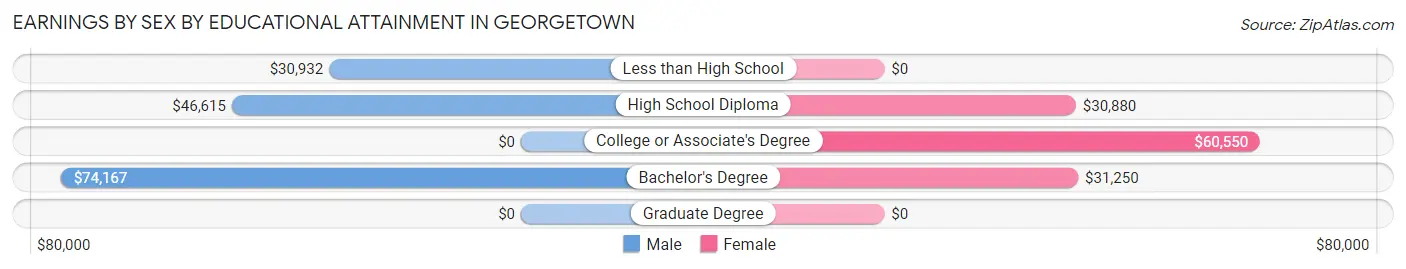
| Educational Attainment | Male Income | Female Income |
| Less than High School | $30,932 | $0 |
| High School Diploma | $46,615 | $30,880 |
| College or Associate's Degree | - | - |
| Bachelor's Degree | $74,167 | $31,250 |
| Graduate Degree | - | - |
| Total | $58,081 | $32,057 |
Family Income in Georgetown
Family Income Brackets in Georgetown
According to the Georgetown family income data, there are 185 families falling into the $100,000 to $149,999 income range, which is the most common income bracket and makes up 21.0% of all families. Conversely, the less than $10,000 income bracket is the least frequent group with only 14 families (1.6%) belonging to this category.
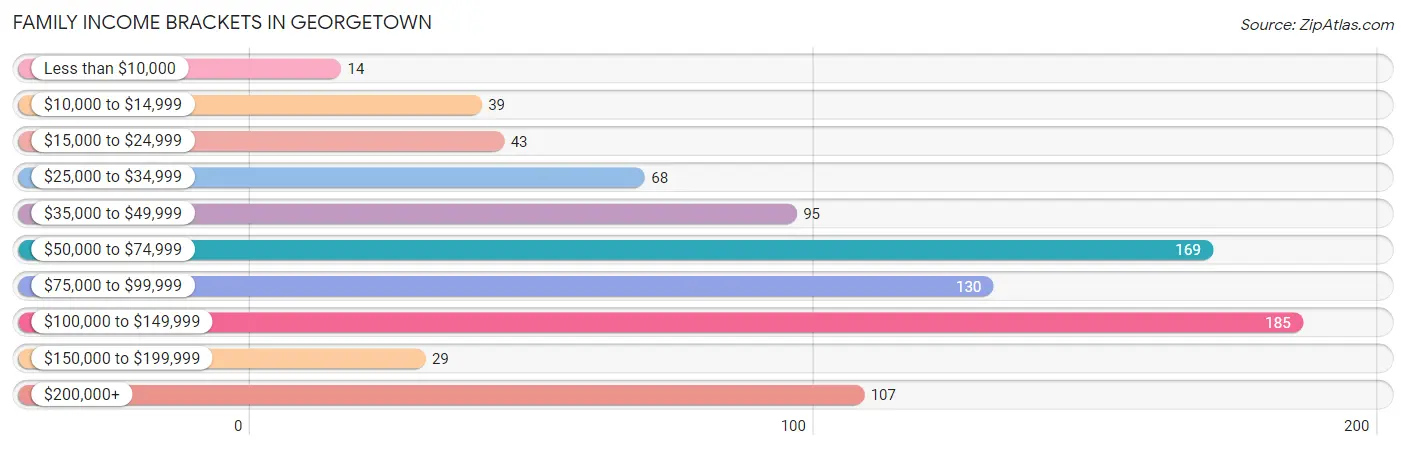
| Income Bracket | # Families | % Families |
| Less than $10,000 | 14 | 1.6% |
| $10,000 to $14,999 | 39 | 4.4% |
| $15,000 to $24,999 | 43 | 4.9% |
| $25,000 to $34,999 | 68 | 7.7% |
| $35,000 to $49,999 | 95 | 10.8% |
| $50,000 to $74,999 | 169 | 19.2% |
| $75,000 to $99,999 | 130 | 14.8% |
| $100,000 to $149,999 | 185 | 21.0% |
| $150,000 to $199,999 | 29 | 3.3% |
| $200,000+ | 107 | 12.2% |
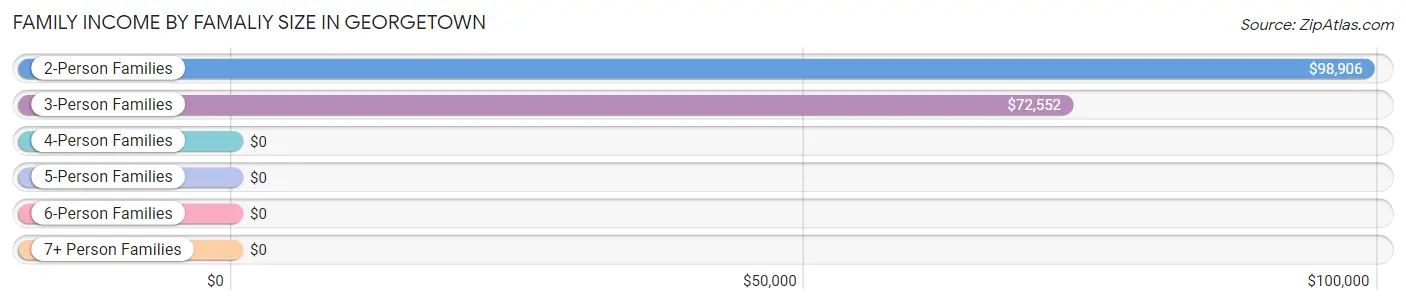
Family Income by Famaliy Size in Georgetown
2-person families (269 | 30.6%) account for the highest median family income in Georgetown with $98,906 per family, while 2-person families (269 | 30.6%) have the highest median income of $49,453 per family member.
| Income Bracket | # Families | Median Income |
| 2-Person Families | 269 (30.6%) | $98,906 |
| 3-Person Families | 265 (30.1%) | $72,552 |
| 4-Person Families | 207 (23.5%) | $0 |
| 5-Person Families | 113 (12.9%) | $0 |
| 6-Person Families | 25 (2.8%) | $0 |
| 7+ Person Families | 0 (0.0%) | $0 |
| Total | 879 (100.0%) | $79,417 |
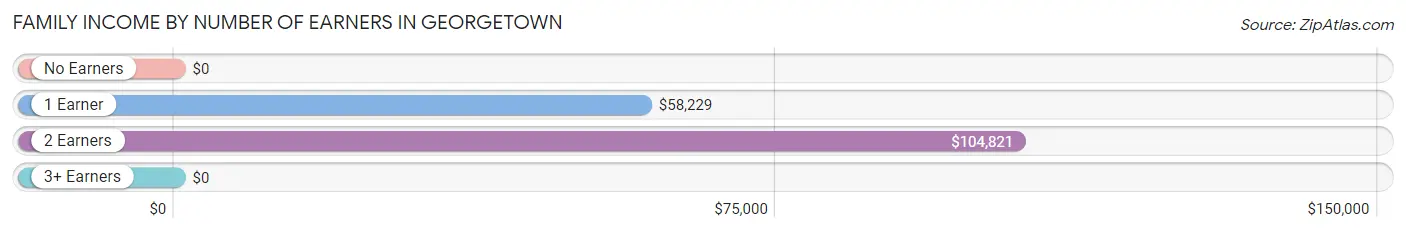
Family Income by Number of Earners in Georgetown
| Number of Earners | # Families | Median Income |
| No Earners | 156 (17.7%) | $0 |
| 1 Earner | 268 (30.5%) | $58,229 |
| 2 Earners | 346 (39.4%) | $104,821 |
| 3+ Earners | 109 (12.4%) | $0 |
| Total | 879 (100.0%) | $79,417 |
Household Income in Georgetown
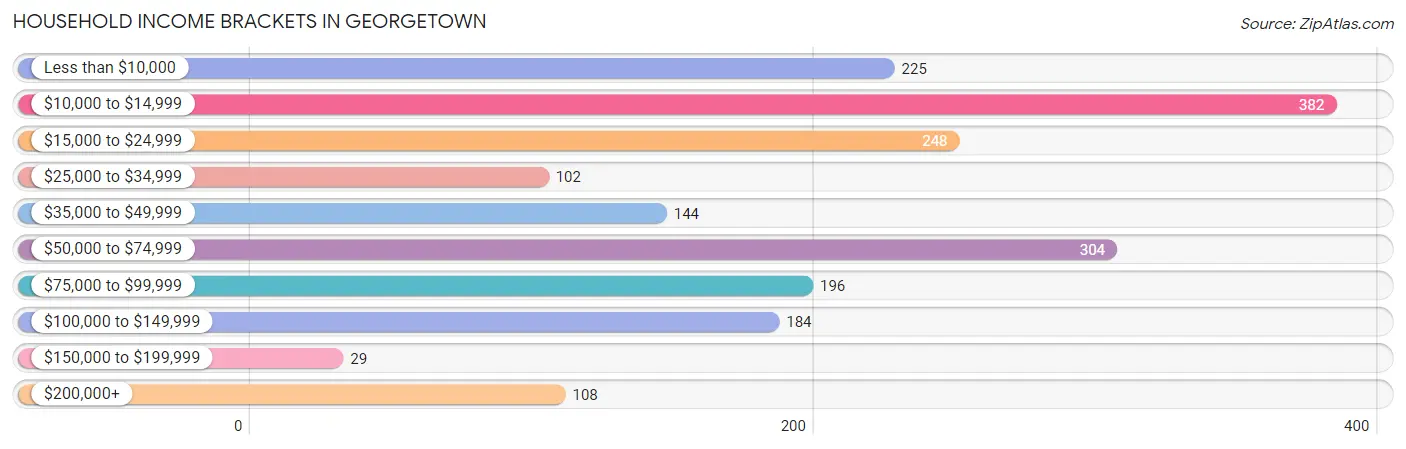
Household Income Brackets in Georgetown
With 382 households falling in the category, the $10,000 to $14,999 income range is the most frequent in Georgetown, accounting for 19.9% of all households. In contrast, only 29 households (1.5%) fall into the $150,000 to $199,999 income bracket, making it the least populous group.
| Income Bracket | # Households | % Households |
| Less than $10,000 | 225 | 11.7% |
| $10,000 to $14,999 | 382 | 19.9% |
| $15,000 to $24,999 | 248 | 12.9% |
| $25,000 to $34,999 | 102 | 5.3% |
| $35,000 to $49,999 | 144 | 7.5% |
| $50,000 to $74,999 | 304 | 15.8% |
| $75,000 to $99,999 | 196 | 10.2% |
| $100,000 to $149,999 | 184 | 9.6% |
| $150,000 to $199,999 | 29 | 1.5% |
| $200,000+ | 108 | 5.6% |
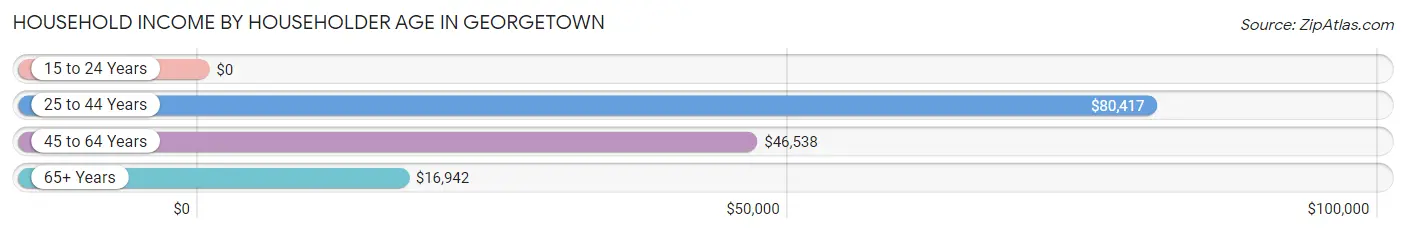
Household Income by Householder Age in Georgetown
The median household income in Georgetown is $37,796, with the highest median household income of $80,417 found in the 25 to 44 years age bracket for the primary householder. A total of 488 households (25.4%) fall into this category. Meanwhile, the 15 to 24 years age bracket for the primary householder has the lowest median household income of $0, with 14 households (0.7%) in this group.
| Income Bracket | # Households | Median Income |
| 15 to 24 Years | 14 (0.7%) | $0 |
| 25 to 44 Years | 488 (25.4%) | $80,417 |
| 45 to 64 Years | 664 (34.6%) | $46,538 |
| 65+ Years | 755 (39.3%) | $16,942 |
| Total | 1,921 (100.0%) | $37,796 |
Poverty in Georgetown
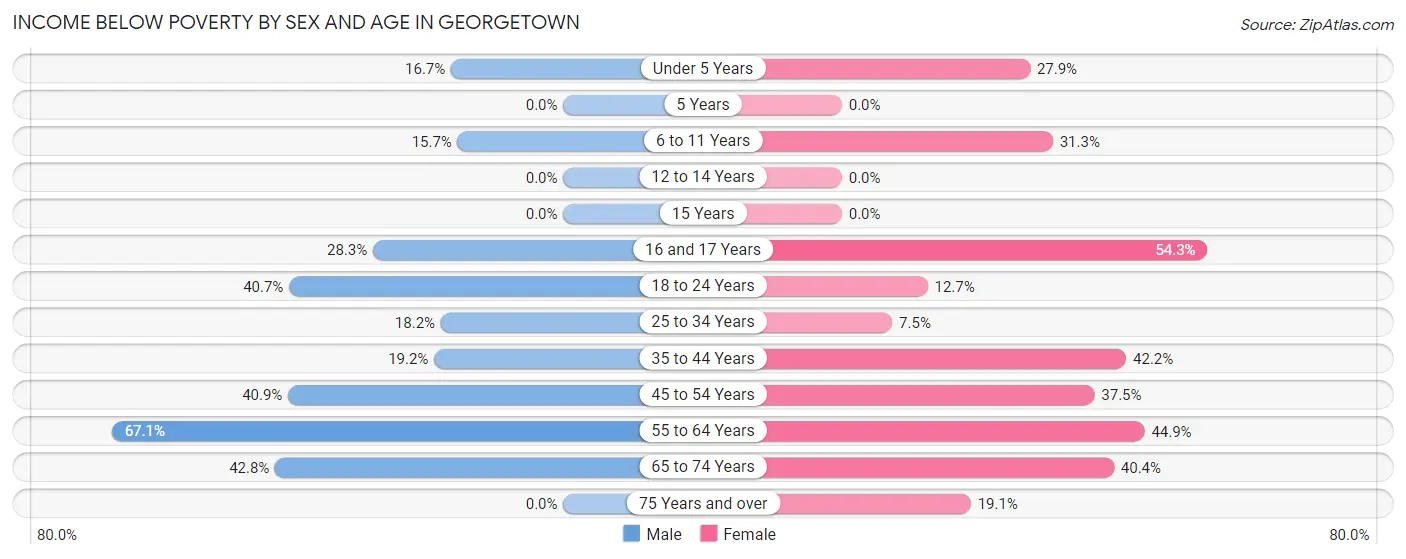
Income Below Poverty by Sex and Age in Georgetown
With 30.3% poverty level for males and 29.4% for females among the residents of Georgetown, 55 to 64 year old males and 16 and 17 year old females are the most vulnerable to poverty, with 114 males (67.1%) and 19 females (54.3%) in their respective age groups living below the poverty level.
| Age Bracket | Male | Female |
| Under 5 Years | 14 (16.7%) | 19 (27.9%) |
| 5 Years | 0 (0.0%) | 0 (0.0%) |
| 6 to 11 Years | 24 (15.7%) | 88 (31.3%) |
| 12 to 14 Years | 0 (0.0%) | 0 (0.0%) |
| 15 Years | 0 (0.0%) | 0 (0.0%) |
| 16 and 17 Years | 39 (28.3%) | 19 (54.3%) |
| 18 to 24 Years | 46 (40.7%) | 14 (12.7%) |
| 25 to 34 Years | 34 (18.2%) | 19 (7.5%) |
| 35 to 44 Years | 70 (19.2%) | 76 (42.2%) |
| 45 to 54 Years | 123 (40.9%) | 147 (37.5%) |
| 55 to 64 Years | 114 (67.1%) | 80 (44.9%) |
| 65 to 74 Years | 89 (42.8%) | 120 (40.4%) |
| 75 Years and over | 0 (0.0%) | 58 (19.1%) |
| Total | 553 (30.3%) | 640 (29.4%) |
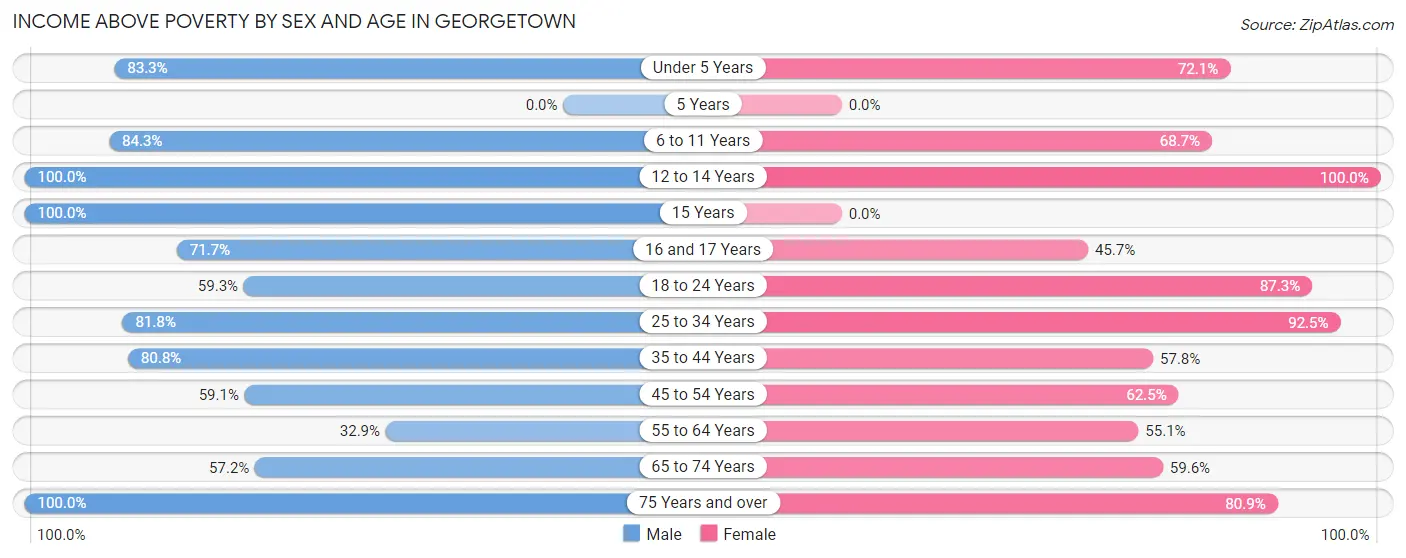
Income Above Poverty by Sex and Age in Georgetown
According to the poverty statistics in Georgetown, males aged 12 to 14 years and females aged 12 to 14 years are the age groups that are most secure financially, with 100.0% of males and 100.0% of females in these age groups living above the poverty line.
| Age Bracket | Male | Female |
| Under 5 Years | 70 (83.3%) | 49 (72.1%) |
| 5 Years | 0 (0.0%) | 0 (0.0%) |
| 6 to 11 Years | 129 (84.3%) | 193 (68.7%) |
| 12 to 14 Years | 19 (100.0%) | 77 (100.0%) |
| 15 Years | 32 (100.0%) | 0 (0.0%) |
| 16 and 17 Years | 99 (71.7%) | 16 (45.7%) |
| 18 to 24 Years | 67 (59.3%) | 96 (87.3%) |
| 25 to 34 Years | 153 (81.8%) | 235 (92.5%) |
| 35 to 44 Years | 295 (80.8%) | 104 (57.8%) |
| 45 to 54 Years | 178 (59.1%) | 245 (62.5%) |
| 55 to 64 Years | 56 (32.9%) | 98 (55.1%) |
| 65 to 74 Years | 119 (57.2%) | 177 (59.6%) |
| 75 Years and over | 56 (100.0%) | 245 (80.9%) |
| Total | 1,273 (69.7%) | 1,535 (70.6%) |
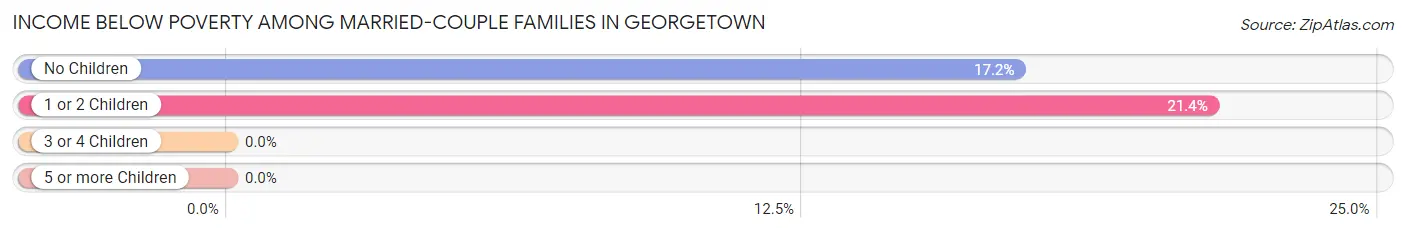
Income Below Poverty Among Married-Couple Families in Georgetown
The poverty statistics for married-couple families in Georgetown show that 18.6% or 122 of the total 656 families live below the poverty line. Families with 1 or 2 children have the highest poverty rate of 21.4%, comprising of 69 families. On the other hand, families with 3 or 4 children have the lowest poverty rate of 0.0%, which includes 0 families.
| Children | Above Poverty | Below Poverty |
| No Children | 256 (82.9%) | 53 (17.2%) |
| 1 or 2 Children | 254 (78.6%) | 69 (21.4%) |
| 3 or 4 Children | 24 (100.0%) | 0 (0.0%) |
| 5 or more Children | 0 (0.0%) | 0 (0.0%) |
| Total | 534 (81.4%) | 122 (18.6%) |
Income Below Poverty Among Single-Parent Households in Georgetown
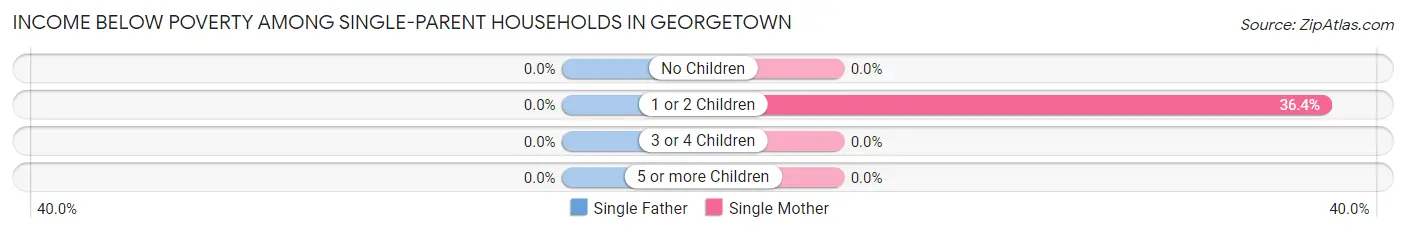
| Children | Single Father | Single Mother |
| No Children | 0 (0.0%) | 0 (0.0%) |
| 1 or 2 Children | 0 (0.0%) | 28 (36.4%) |
| 3 or 4 Children | 0 (0.0%) | 0 (0.0%) |
| 5 or more Children | 0 (0.0%) | 0 (0.0%) |
| Total | 0 (0.0%) | 28 (27.5%) |
Income Below Poverty Among Married-Couple vs Single-Parent Households in Georgetown
The poverty data for Georgetown shows that 122 of the married-couple family households (18.6%) and 28 of the single-parent households (12.6%) are living below the poverty level. Within the married-couple family households, those with 1 or 2 children have the highest poverty rate, with 69 households (21.4%) falling below the poverty line. Among the single-parent households, those with 1 or 2 children have the highest poverty rate, with 28 household (15.9%) living below poverty.
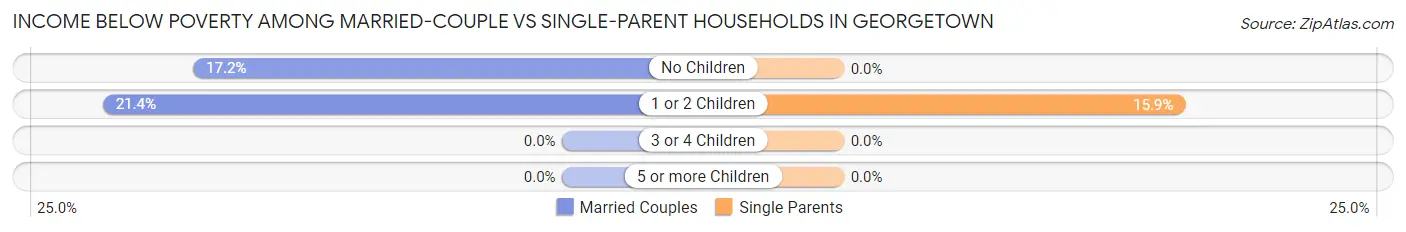
| Children | Married-Couple Families | Single-Parent Households |
| No Children | 53 (17.2%) | 0 (0.0%) |
| 1 or 2 Children | 69 (21.4%) | 28 (15.9%) |
| 3 or 4 Children | 0 (0.0%) | 0 (0.0%) |
| 5 or more Children | 0 (0.0%) | 0 (0.0%) |
| Total | 122 (18.6%) | 28 (12.6%) |
Employment Characteristics in Georgetown
Employment by Class of Employer in Georgetown
Among the 1,403 employed individuals in Georgetown, private company employees (934 | 66.6%), state government employees (145 | 10.3%), and local government employees (128 | 9.1%) make up the most common classes of employment.
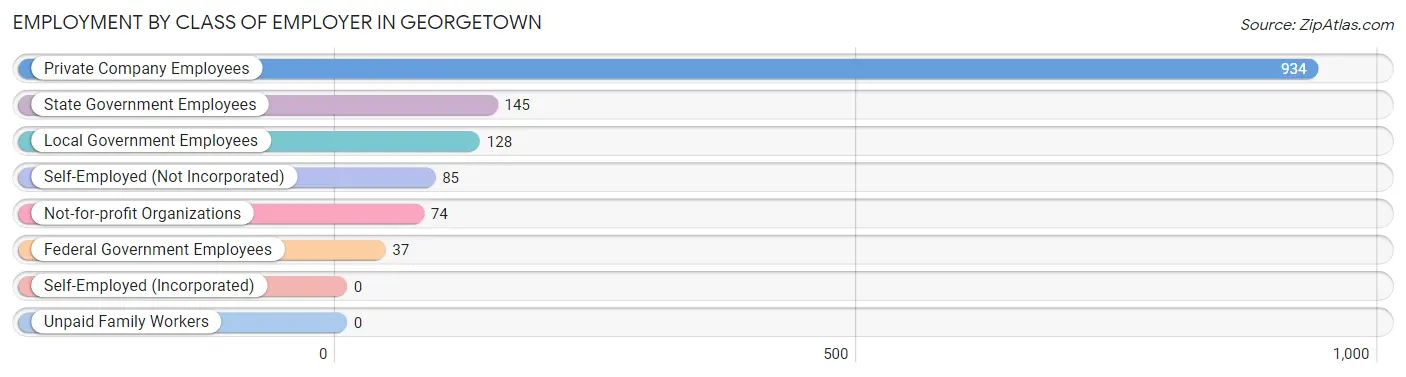
| Employer Class | # Employees | % Employees |
| Private Company Employees | 934 | 66.6% |
| Self-Employed (Incorporated) | 0 | 0.0% |
| Self-Employed (Not Incorporated) | 85 | 6.1% |
| Not-for-profit Organizations | 74 | 5.3% |
| Local Government Employees | 128 | 9.1% |
| State Government Employees | 145 | 10.3% |
| Federal Government Employees | 37 | 2.6% |
| Unpaid Family Workers | 0 | 0.0% |
| Total | 1,403 | 100.0% |
Employment Status by Age in Georgetown
According to the labor force statistics for Georgetown, out of the total population over 16 years of age (3,609), 42.3% or 1,527 individuals are in the labor force, with 2.6% or 40 of them unemployed. The age group with the highest labor force participation rate is 30 to 34 years, with 83.7% or 159 individuals in the labor force. Within the labor force, the 55 to 59 years age range has the highest percentage of unemployed individuals, with 13.8% or 21 of them being unemployed.
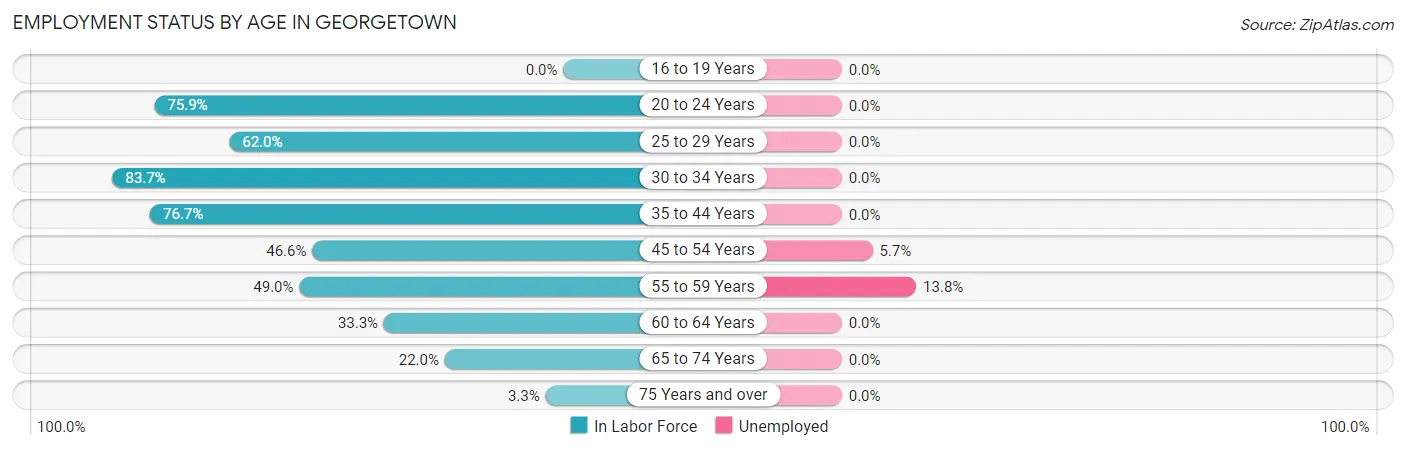
| Age Bracket | In Labor Force | Unemployed |
| 16 to 19 Years | 0 (0.0%) | 0 (0.0%) |
| 20 to 24 Years | 123 (75.9%) | 0 (0.0%) |
| 25 to 29 Years | 170 (62.0%) | 0 (0.0%) |
| 30 to 34 Years | 159 (83.7%) | 0 (0.0%) |
| 35 to 44 Years | 434 (76.7%) | 0 (0.0%) |
| 45 to 54 Years | 332 (46.6%) | 19 (5.7%) |
| 55 to 59 Years | 152 (49.0%) | 21 (13.8%) |
| 60 to 64 Years | 15 (33.3%) | 0 (0.0%) |
| 65 to 74 Years | 122 (22.0%) | 0 (0.0%) |
| 75 Years and over | 18 (3.3%) | 0 (0.0%) |
| Total | 1,527 (42.3%) | 40 (2.6%) |
Employment Status by Educational Attainment in Georgetown
According to labor force statistics for Georgetown, 60.2% of individuals (1,262) out of the total population between 25 and 64 years of age (2,097) are in the labor force, with 3.2% or 40 of them being unemployed. The group with the highest labor force participation rate are those with the educational attainment of bachelor's degree or higher, with 100.0% or 250 individuals in the labor force. Within the labor force, individuals with high school diploma education have the highest percentage of unemployment, with 5.4% or 19 of them being unemployed.
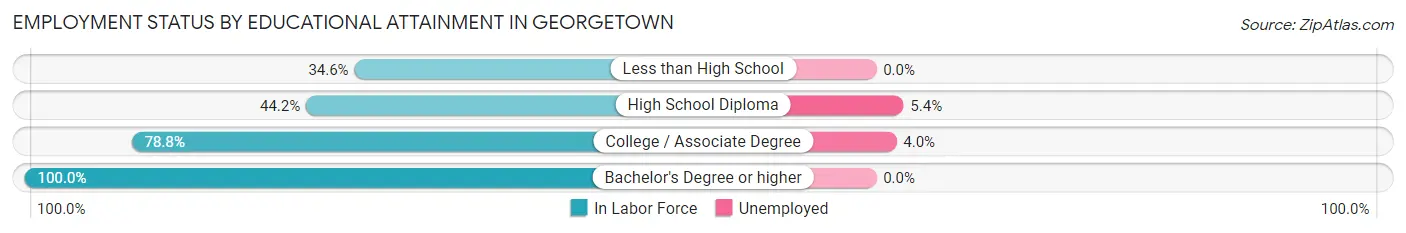
| Educational Attainment | In Labor Force | Unemployed |
| Less than High School | 132 (34.6%) | 0 (0.0%) |
| High School Diploma | 350 (44.2%) | 43 (5.4%) |
| College / Associate Degree | 530 (78.8%) | 27 (4.0%) |
| Bachelor's Degree or higher | 250 (100.0%) | 0 (0.0%) |
| Total | 1,262 (60.2%) | 67 (3.2%) |
Employment Occupations by Sex in Georgetown
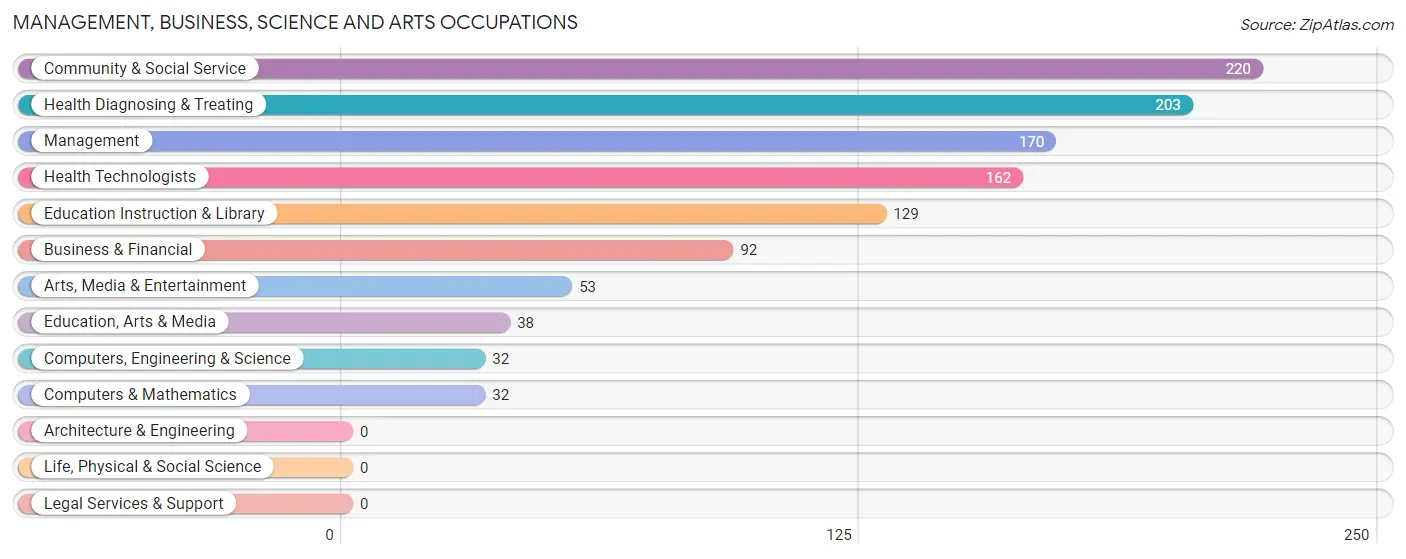
Management, Business, Science and Arts Occupations
The most common Management, Business, Science and Arts occupations in Georgetown are Community & Social Service (220 | 14.8%), Health Diagnosing & Treating (203 | 13.7%), Management (170 | 11.5%), Health Technologists (162 | 10.9%), and Education Instruction & Library (129 | 8.7%).
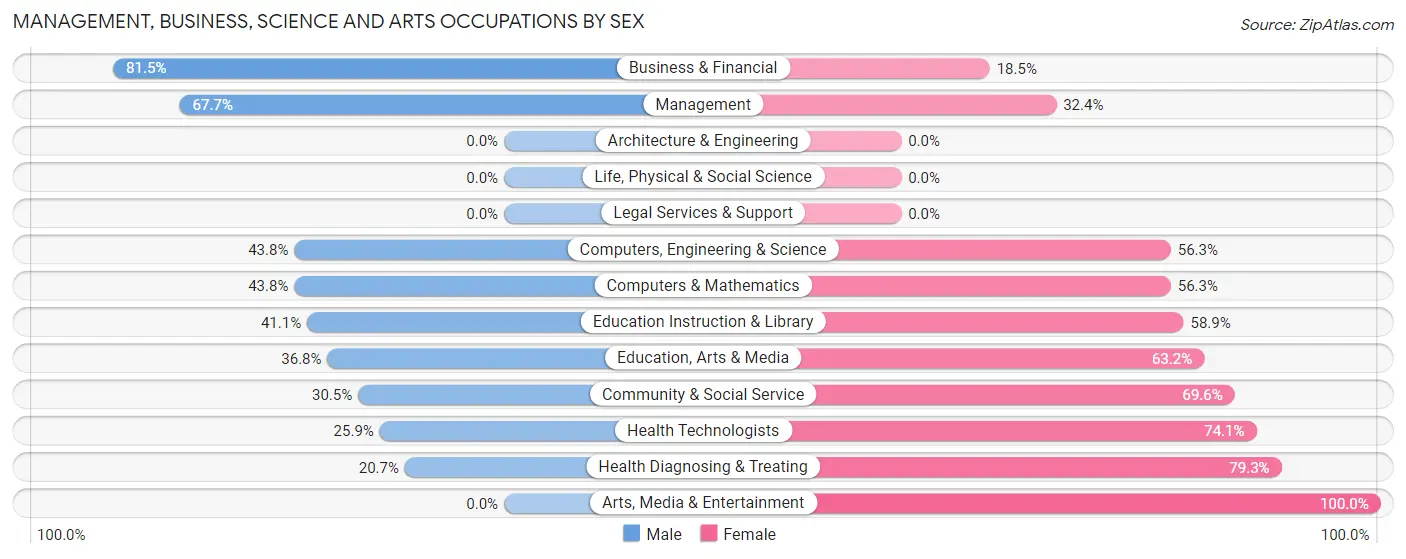
Management, Business, Science and Arts Occupations by Sex
Within the Management, Business, Science and Arts occupations in Georgetown, the most male-oriented occupations are Business & Financial (81.5%), Management (67.6%), and Computers, Engineering & Science (43.8%), while the most female-oriented occupations are Arts, Media & Entertainment (100.0%), Health Diagnosing & Treating (79.3%), and Health Technologists (74.1%).
| Occupation | Male | Female |
| Management | 115 (67.6%) | 55 (32.4%) |
| Business & Financial | 75 (81.5%) | 17 (18.5%) |
| Computers, Engineering & Science | 14 (43.8%) | 18 (56.2%) |
| Computers & Mathematics | 14 (43.8%) | 18 (56.2%) |
| Architecture & Engineering | 0 (0.0%) | 0 (0.0%) |
| Life, Physical & Social Science | 0 (0.0%) | 0 (0.0%) |
| Community & Social Service | 67 (30.4%) | 153 (69.6%) |
| Education, Arts & Media | 14 (36.8%) | 24 (63.2%) |
| Legal Services & Support | 0 (0.0%) | 0 (0.0%) |
| Education Instruction & Library | 53 (41.1%) | 76 (58.9%) |
| Arts, Media & Entertainment | 0 (0.0%) | 53 (100.0%) |
| Health Diagnosing & Treating | 42 (20.7%) | 161 (79.3%) |
| Health Technologists | 42 (25.9%) | 120 (74.1%) |
| Total (Category) | 313 (43.6%) | 404 (56.4%) |
| Total (Overall) | 727 (49.0%) | 758 (51.0%) |
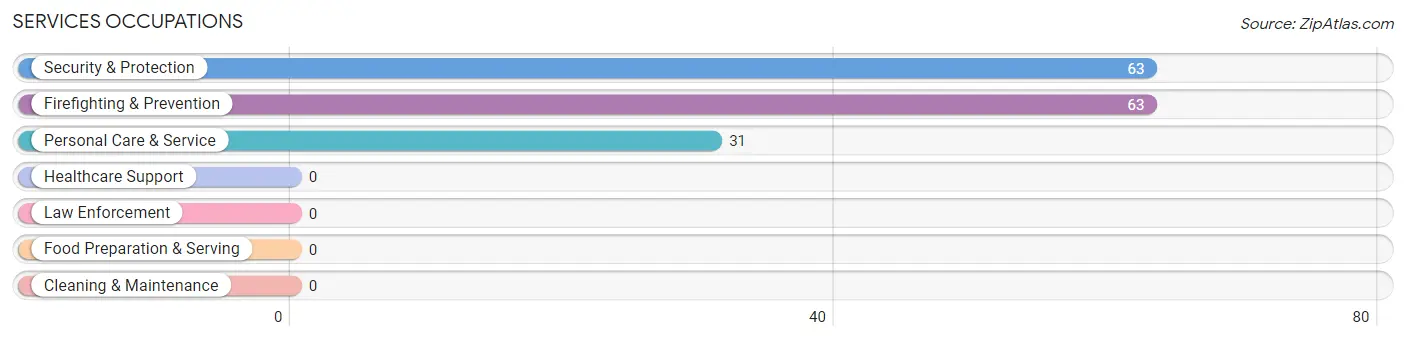
Services Occupations
The most common Services occupations in Georgetown are Security & Protection (63 | 4.2%), Firefighting & Prevention (63 | 4.2%), and Personal Care & Service (31 | 2.1%).
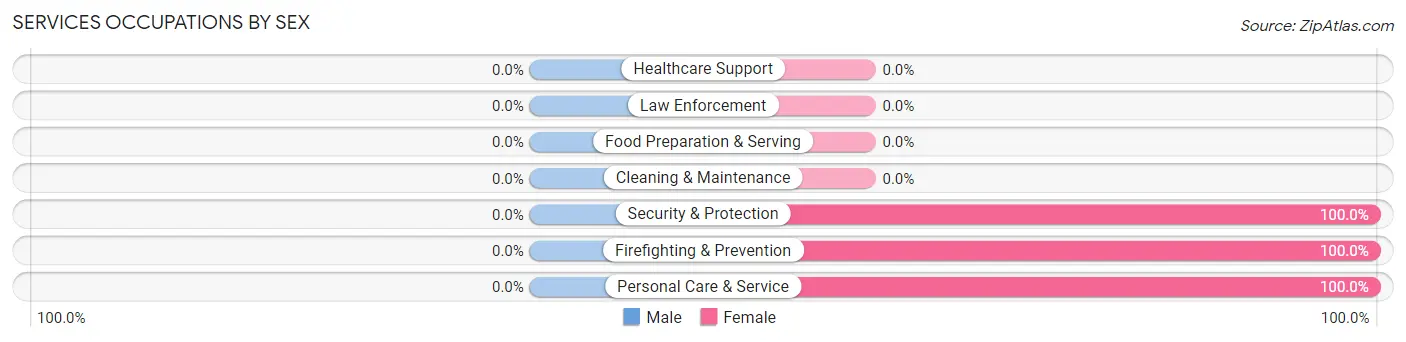
Services Occupations by Sex
| Occupation | Male | Female |
| Healthcare Support | 0 (0.0%) | 0 (0.0%) |
| Security & Protection | 0 (0.0%) | 63 (100.0%) |
| Firefighting & Prevention | 0 (0.0%) | 63 (100.0%) |
| Law Enforcement | 0 (0.0%) | 0 (0.0%) |
| Food Preparation & Serving | 0 (0.0%) | 0 (0.0%) |
| Cleaning & Maintenance | 0 (0.0%) | 0 (0.0%) |
| Personal Care & Service | 0 (0.0%) | 31 (100.0%) |
| Total (Category) | 0 (0.0%) | 94 (100.0%) |
| Total (Overall) | 727 (49.0%) | 758 (51.0%) |
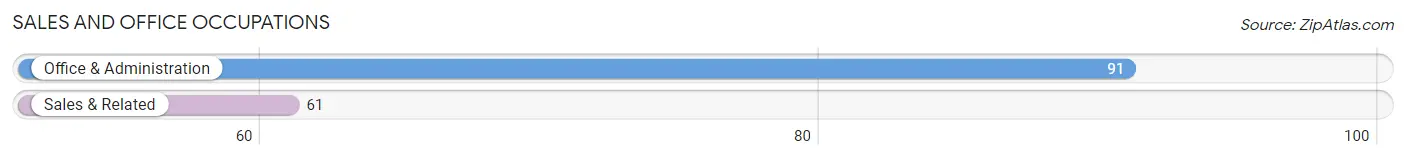
Sales and Office Occupations
The most common Sales and Office occupations in Georgetown are Office & Administration (91 | 6.1%), and Sales & Related (61 | 4.1%).
Sales and Office Occupations by Sex
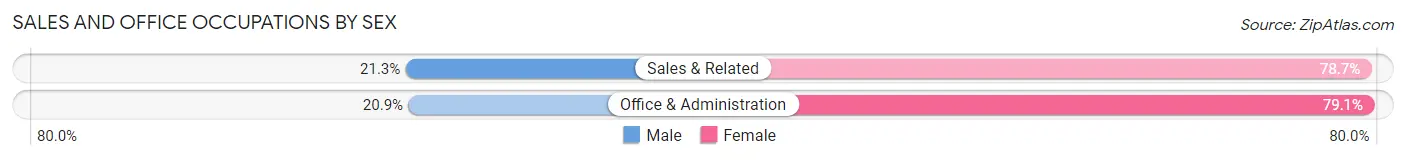
| Occupation | Male | Female |
| Sales & Related | 13 (21.3%) | 48 (78.7%) |
| Office & Administration | 19 (20.9%) | 72 (79.1%) |
| Total (Category) | 32 (21.0%) | 120 (78.9%) |
| Total (Overall) | 727 (49.0%) | 758 (51.0%) |
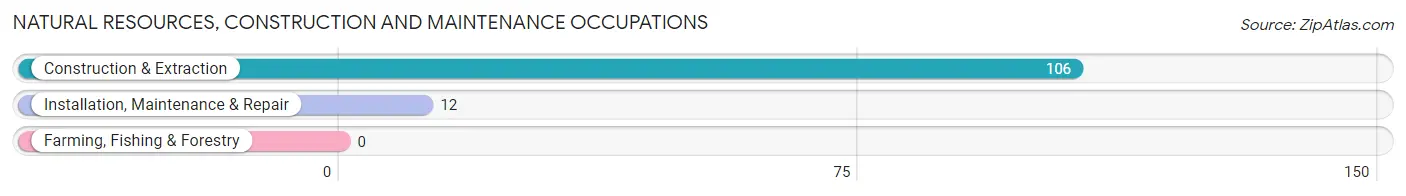
Natural Resources, Construction and Maintenance Occupations
The most common Natural Resources, Construction and Maintenance occupations in Georgetown are Construction & Extraction (106 | 7.1%), and Installation, Maintenance & Repair (12 | 0.8%).
Natural Resources, Construction and Maintenance Occupations by Sex
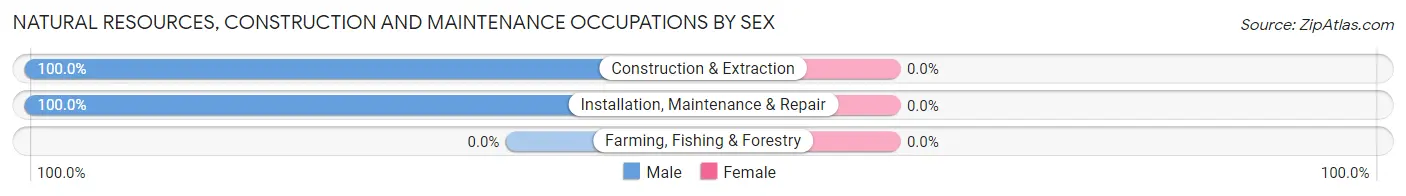
| Occupation | Male | Female |
| Farming, Fishing & Forestry | 0 (0.0%) | 0 (0.0%) |
| Construction & Extraction | 106 (100.0%) | 0 (0.0%) |
| Installation, Maintenance & Repair | 12 (100.0%) | 0 (0.0%) |
| Total (Category) | 118 (100.0%) | 0 (0.0%) |
| Total (Overall) | 727 (49.0%) | 758 (51.0%) |
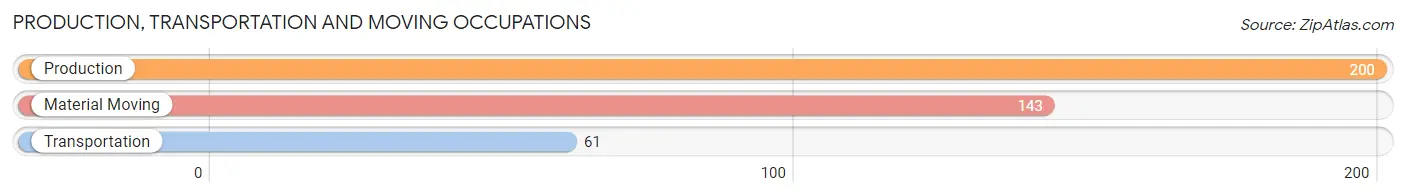
Production, Transportation and Moving Occupations
The most common Production, Transportation and Moving occupations in Georgetown are Production (200 | 13.5%), Material Moving (143 | 9.6%), and Transportation (61 | 4.1%).
Production, Transportation and Moving Occupations by Sex
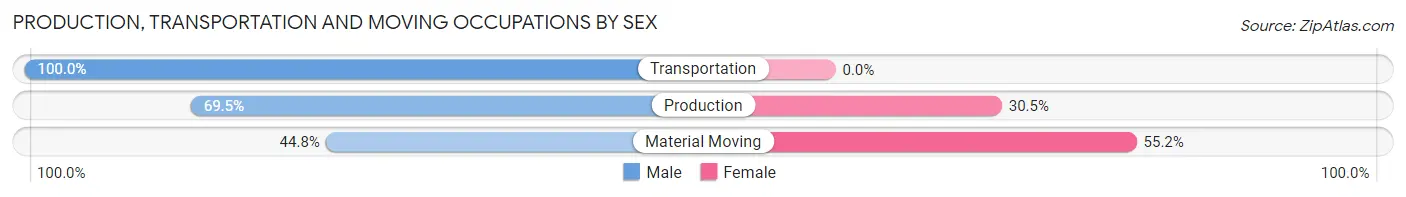
| Occupation | Male | Female |
| Production | 139 (69.5%) | 61 (30.5%) |
| Transportation | 61 (100.0%) | 0 (0.0%) |
| Material Moving | 64 (44.8%) | 79 (55.2%) |
| Total (Category) | 264 (65.3%) | 140 (34.6%) |
| Total (Overall) | 727 (49.0%) | 758 (51.0%) |
Employment Industries by Sex in Georgetown
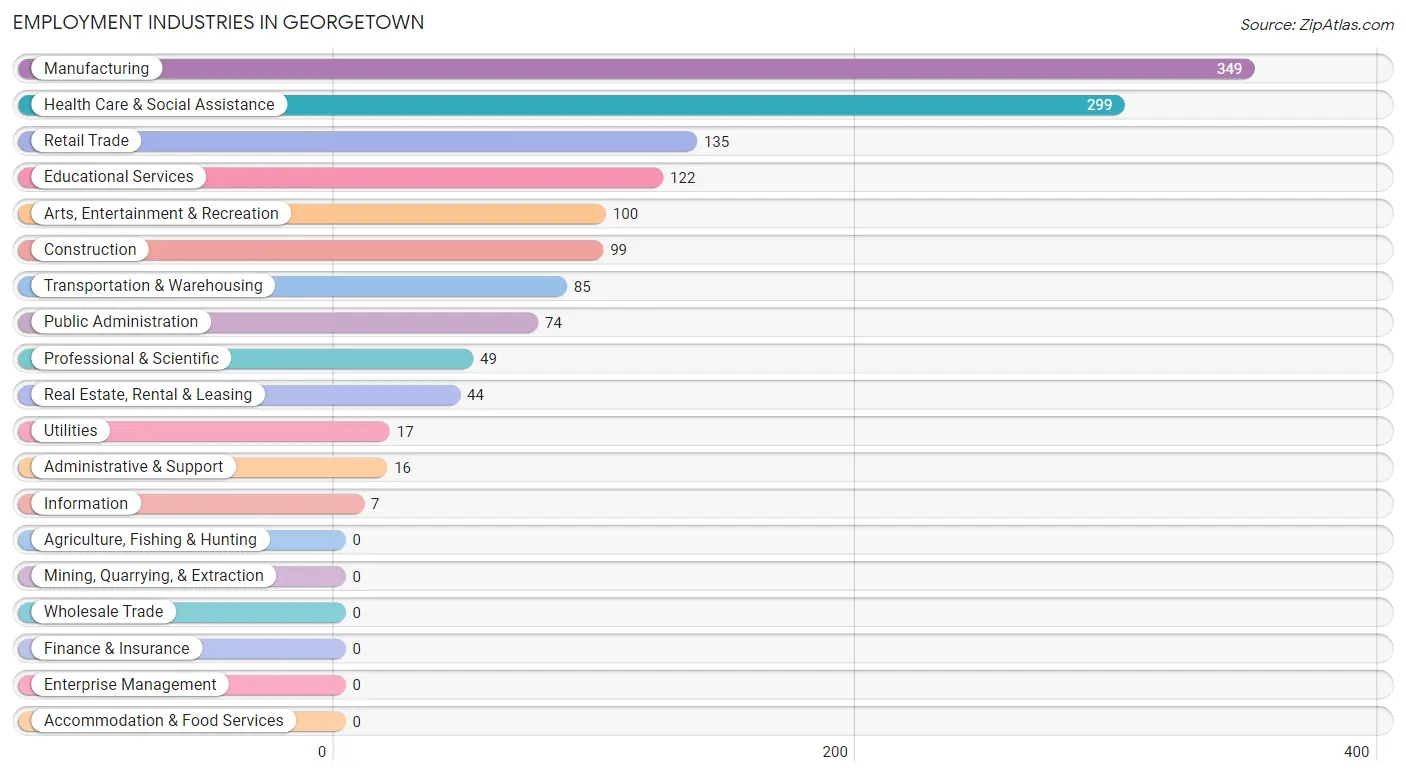
Employment Industries in Georgetown
The major employment industries in Georgetown include Manufacturing (349 | 23.5%), Health Care & Social Assistance (299 | 20.1%), Retail Trade (135 | 9.1%), Educational Services (122 | 8.2%), and Arts, Entertainment & Recreation (100 | 6.7%).
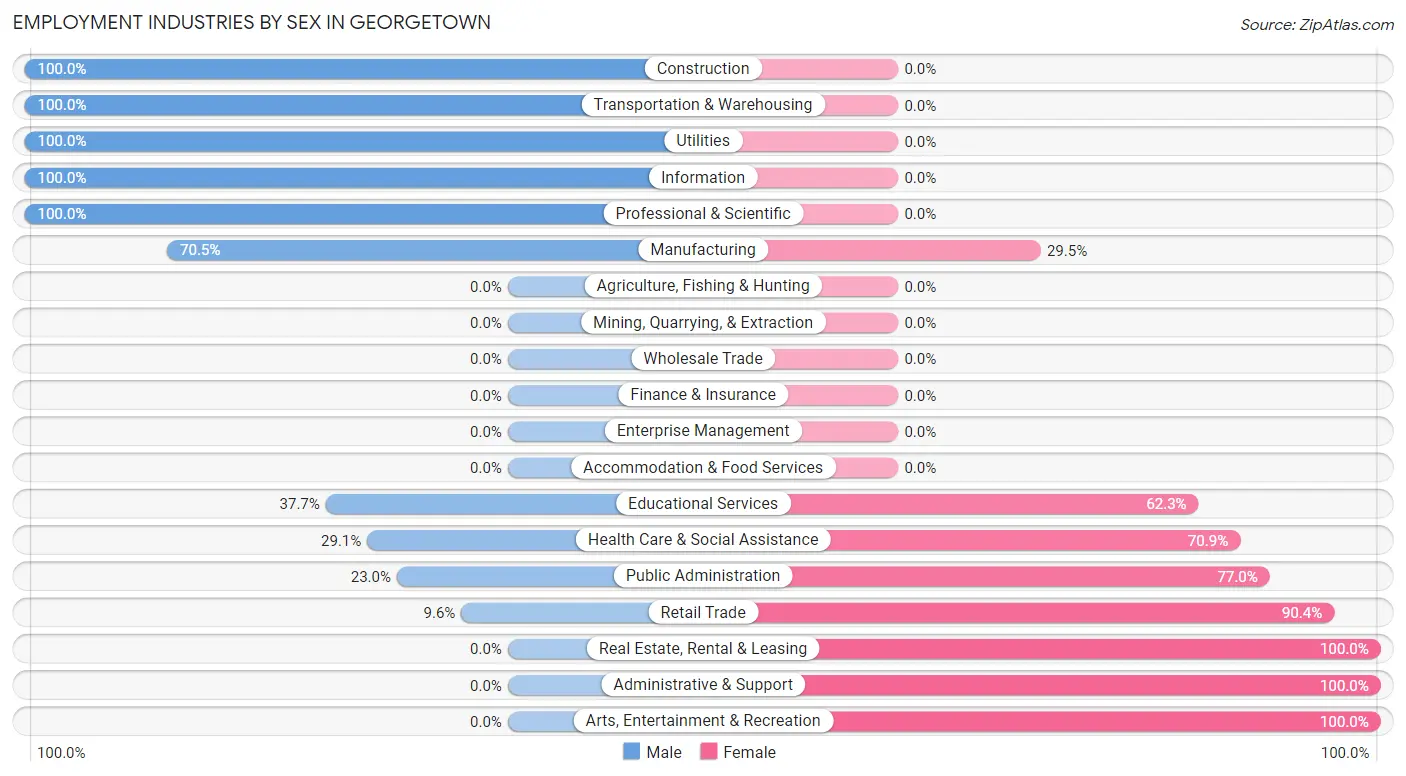
Employment Industries by Sex in Georgetown
The Georgetown industries that see more men than women are Construction (100.0%), Transportation & Warehousing (100.0%), and Utilities (100.0%), whereas the industries that tend to have a higher number of women are Real Estate, Rental & Leasing (100.0%), Administrative & Support (100.0%), and Arts, Entertainment & Recreation (100.0%).
| Industry | Male | Female |
| Agriculture, Fishing & Hunting | 0 (0.0%) | 0 (0.0%) |
| Mining, Quarrying, & Extraction | 0 (0.0%) | 0 (0.0%) |
| Construction | 99 (100.0%) | 0 (0.0%) |
| Manufacturing | 246 (70.5%) | 103 (29.5%) |
| Wholesale Trade | 0 (0.0%) | 0 (0.0%) |
| Retail Trade | 13 (9.6%) | 122 (90.4%) |
| Transportation & Warehousing | 85 (100.0%) | 0 (0.0%) |
| Utilities | 17 (100.0%) | 0 (0.0%) |
| Information | 7 (100.0%) | 0 (0.0%) |
| Finance & Insurance | 0 (0.0%) | 0 (0.0%) |
| Real Estate, Rental & Leasing | 0 (0.0%) | 44 (100.0%) |
| Professional & Scientific | 49 (100.0%) | 0 (0.0%) |
| Enterprise Management | 0 (0.0%) | 0 (0.0%) |
| Administrative & Support | 0 (0.0%) | 16 (100.0%) |
| Educational Services | 46 (37.7%) | 76 (62.3%) |
| Health Care & Social Assistance | 87 (29.1%) | 212 (70.9%) |
| Arts, Entertainment & Recreation | 0 (0.0%) | 100 (100.0%) |
| Accommodation & Food Services | 0 (0.0%) | 0 (0.0%) |
| Public Administration | 17 (23.0%) | 57 (77.0%) |
| Total | 727 (49.0%) | 758 (51.0%) |
Education in Georgetown
School Enrollment in Georgetown
The most common levels of schooling among the 923 students in Georgetown are middle school (263 | 28.5%), elementary school (253 | 27.4%), and high school (197 | 21.3%).
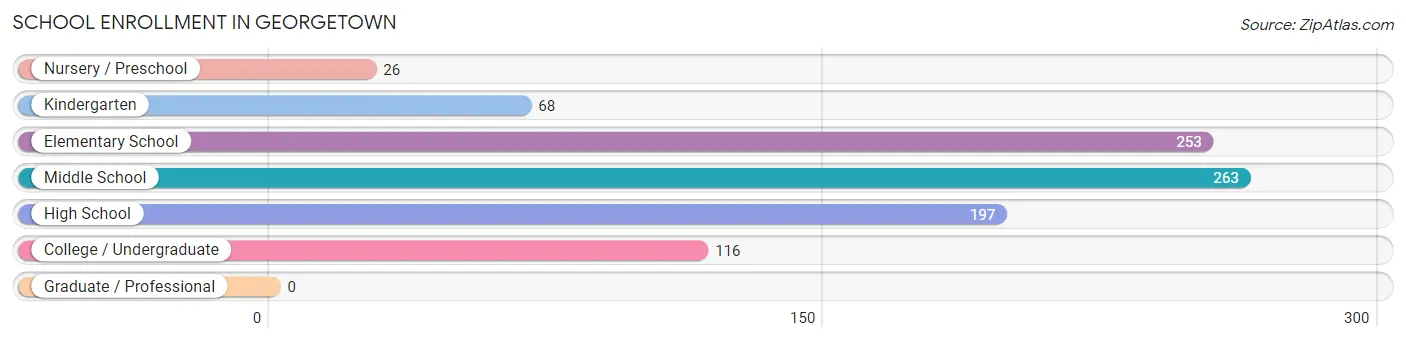
| School Level | # Students | % Students |
| Nursery / Preschool | 26 | 2.8% |
| Kindergarten | 68 | 7.4% |
| Elementary School | 253 | 27.4% |
| Middle School | 263 | 28.5% |
| High School | 197 | 21.3% |
| College / Undergraduate | 116 | 12.6% |
| Graduate / Professional | 0 | 0.0% |
| Total | 923 | 100.0% |
School Enrollment by Age by Funding Source in Georgetown
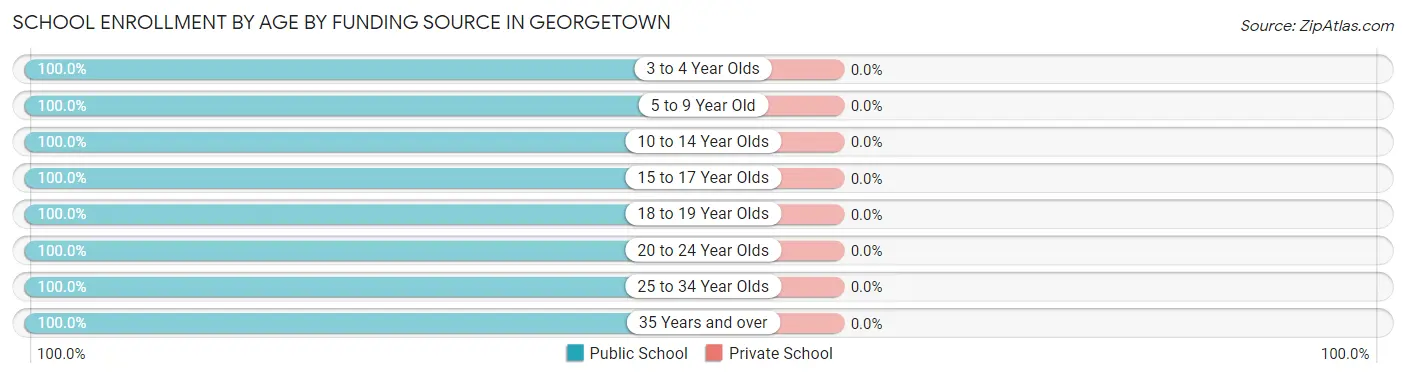
| Age Bracket | Public School | Private School |
| 3 to 4 Year Olds | 26 (100.0%) | 0 (0.0%) |
| 5 to 9 Year Old | 203 (100.0%) | 0 (0.0%) |
| 10 to 14 Year Olds | 327 (100.0%) | 0 (0.0%) |
| 15 to 17 Year Olds | 205 (100.0%) | 0 (0.0%) |
| 18 to 19 Year Olds | 46 (100.0%) | 0 (0.0%) |
| 20 to 24 Year Olds | 19 (100.0%) | 0 (0.0%) |
| 25 to 34 Year Olds | 50 (100.0%) | 0 (0.0%) |
| 35 Years and over | 47 (100.0%) | 0 (0.0%) |
| Total | 923 (100.0%) | 0 (0.0%) |
Educational Attainment by Field of Study in Georgetown
Education (121 | 24.1%), business (120 | 23.9%), arts & humanities (63 | 12.6%), psychology (54 | 10.8%), and computers & mathematics (32 | 6.4%) are the most common fields of study among 501 individuals in Georgetown who have obtained a bachelor's degree or higher.
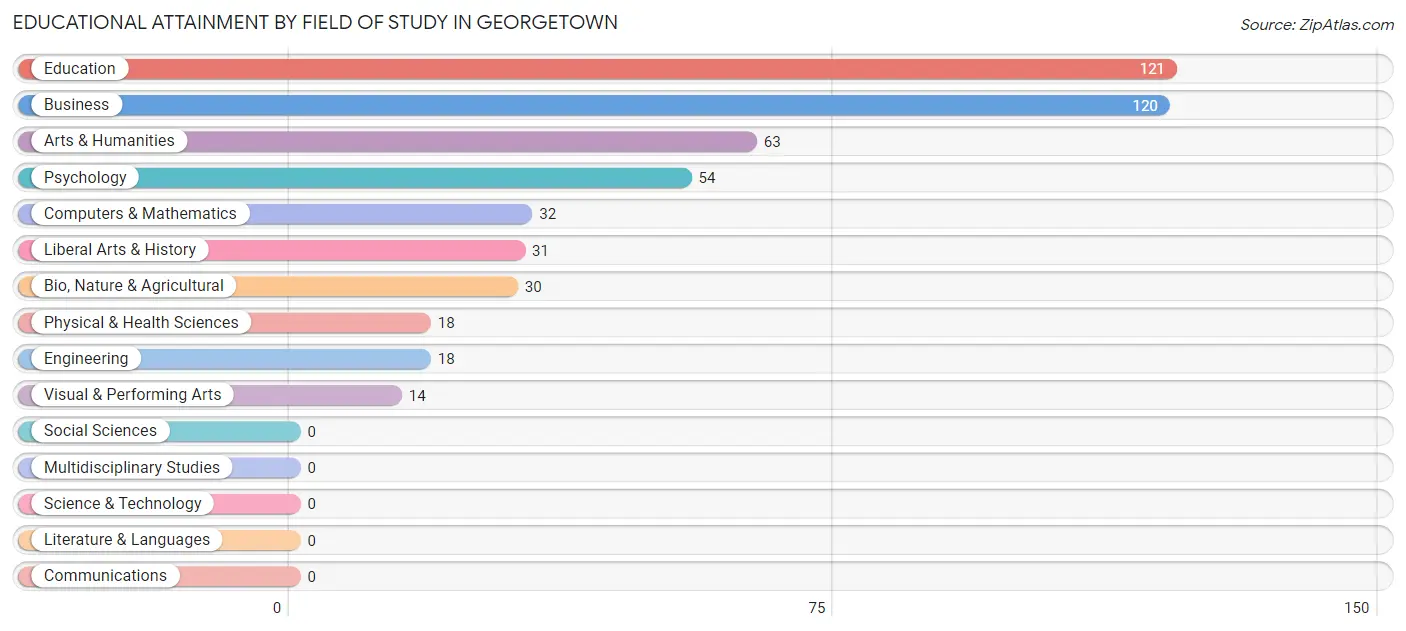
| Field of Study | # Graduates | % Graduates |
| Computers & Mathematics | 32 | 6.4% |
| Bio, Nature & Agricultural | 30 | 6.0% |
| Physical & Health Sciences | 18 | 3.6% |
| Psychology | 54 | 10.8% |
| Social Sciences | 0 | 0.0% |
| Engineering | 18 | 3.6% |
| Multidisciplinary Studies | 0 | 0.0% |
| Science & Technology | 0 | 0.0% |
| Business | 120 | 23.9% |
| Education | 121 | 24.1% |
| Literature & Languages | 0 | 0.0% |
| Liberal Arts & History | 31 | 6.2% |
| Visual & Performing Arts | 14 | 2.8% |
| Communications | 0 | 0.0% |
| Arts & Humanities | 63 | 12.6% |
| Total | 501 | 100.0% |
Transportation & Commute in Georgetown
Vehicle Availability by Sex in Georgetown
The most prevalent vehicle ownership categories in Georgetown are males with 3 vehicles (324, accounting for 46.8%) and females with 3 vehicles (227, making up 45.9%).
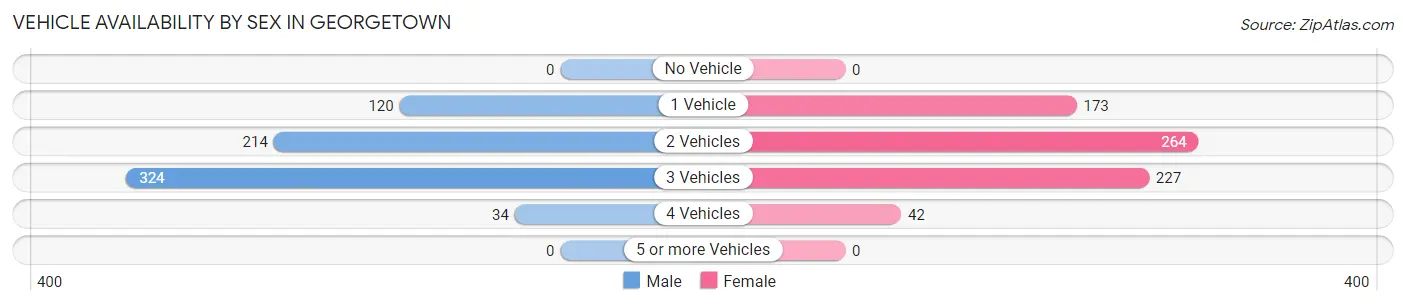
| Vehicles Available | Male | Female |
| No Vehicle | 0 (0.0%) | 0 (0.0%) |
| 1 Vehicle | 120 (17.3%) | 173 (24.5%) |
| 2 Vehicles | 214 (30.9%) | 264 (37.4%) |
| 3 Vehicles | 324 (46.8%) | 227 (32.2%) |
| 4 Vehicles | 34 (4.9%) | 42 (5.9%) |
| 5 or more Vehicles | 0 (0.0%) | 0 (0.0%) |
| Total | 692 (100.0%) | 706 (100.0%) |
Commute Time in Georgetown
The most frequently occuring commute durations in Georgetown are 40 to 44 minutes (250 commuters, 18.7%), 5 to 9 minutes (231 commuters, 17.3%), and 45 to 59 minutes (204 commuters, 15.3%).
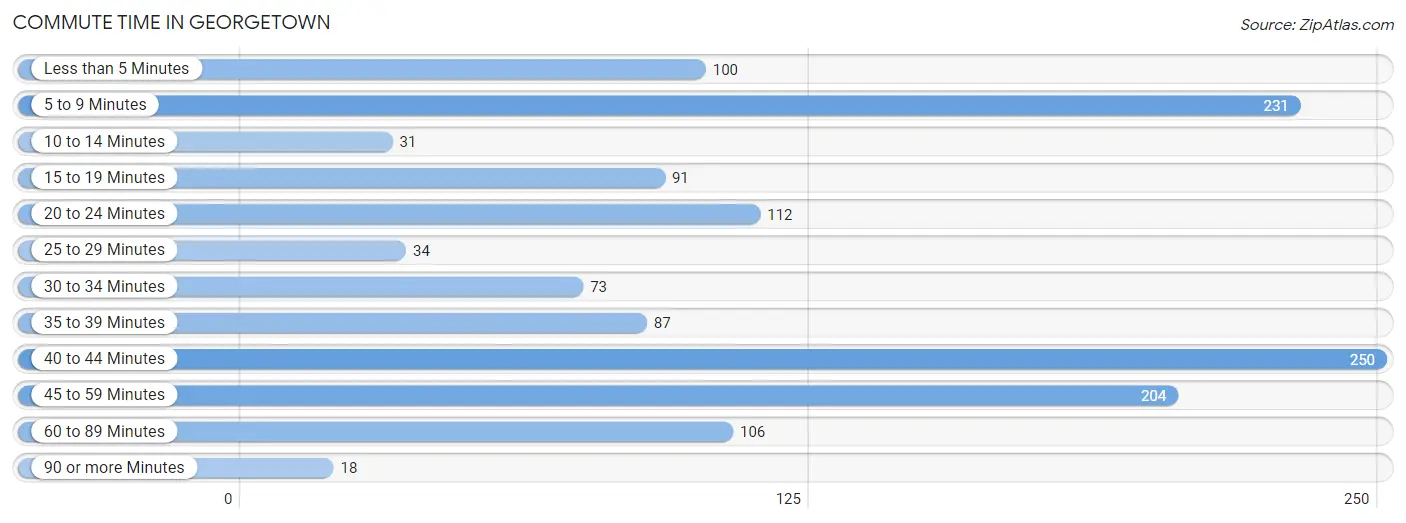
| Commute Time | # Commuters | % Commuters |
| Less than 5 Minutes | 100 | 7.5% |
| 5 to 9 Minutes | 231 | 17.3% |
| 10 to 14 Minutes | 31 | 2.3% |
| 15 to 19 Minutes | 91 | 6.8% |
| 20 to 24 Minutes | 112 | 8.4% |
| 25 to 29 Minutes | 34 | 2.5% |
| 30 to 34 Minutes | 73 | 5.5% |
| 35 to 39 Minutes | 87 | 6.5% |
| 40 to 44 Minutes | 250 | 18.7% |
| 45 to 59 Minutes | 204 | 15.3% |
| 60 to 89 Minutes | 106 | 7.9% |
| 90 or more Minutes | 18 | 1.3% |
Commute Time by Sex in Georgetown
The most common commute times in Georgetown are 45 to 59 minutes (204 commuters, 29.5%) for males and 5 to 9 minutes (145 commuters, 22.5%) for females.
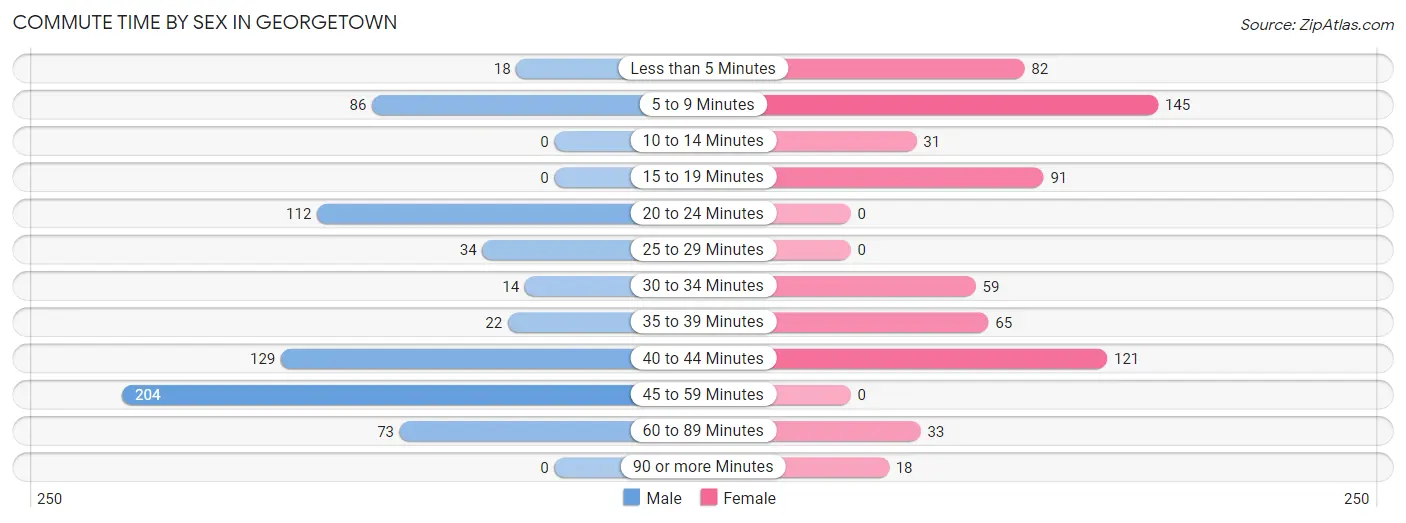
| Commute Time | Male | Female |
| Less than 5 Minutes | 18 (2.6%) | 82 (12.7%) |
| 5 to 9 Minutes | 86 (12.4%) | 145 (22.5%) |
| 10 to 14 Minutes | 0 (0.0%) | 31 (4.8%) |
| 15 to 19 Minutes | 0 (0.0%) | 91 (14.1%) |
| 20 to 24 Minutes | 112 (16.2%) | 0 (0.0%) |
| 25 to 29 Minutes | 34 (4.9%) | 0 (0.0%) |
| 30 to 34 Minutes | 14 (2.0%) | 59 (9.1%) |
| 35 to 39 Minutes | 22 (3.2%) | 65 (10.1%) |
| 40 to 44 Minutes | 129 (18.6%) | 121 (18.8%) |
| 45 to 59 Minutes | 204 (29.5%) | 0 (0.0%) |
| 60 to 89 Minutes | 73 (10.5%) | 33 (5.1%) |
| 90 or more Minutes | 0 (0.0%) | 18 (2.8%) |
Time of Departure to Work by Sex in Georgetown
The most frequent times of departure to work in Georgetown are 7:00 AM to 7:29 AM (187, 27.0%) for males and 7:30 AM to 7:59 AM (128, 19.8%) for females.
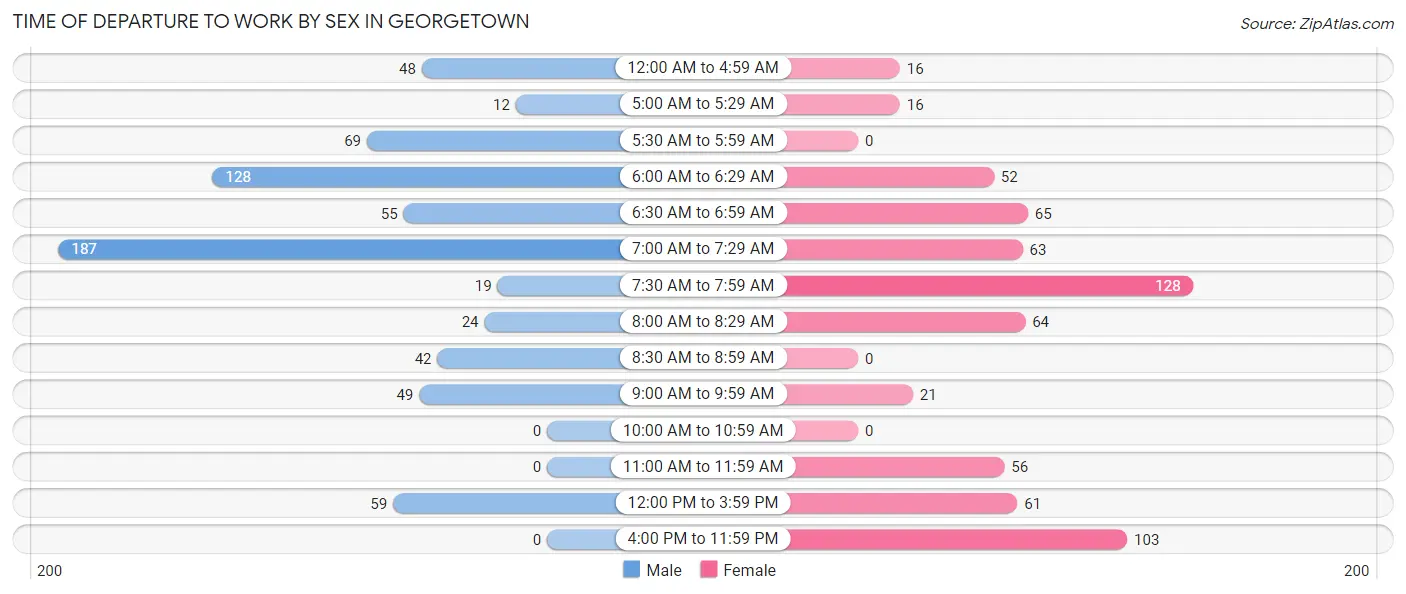
| Time of Departure | Male | Female |
| 12:00 AM to 4:59 AM | 48 (6.9%) | 16 (2.5%) |
| 5:00 AM to 5:29 AM | 12 (1.7%) | 16 (2.5%) |
| 5:30 AM to 5:59 AM | 69 (10.0%) | 0 (0.0%) |
| 6:00 AM to 6:29 AM | 128 (18.5%) | 52 (8.1%) |
| 6:30 AM to 6:59 AM | 55 (8.0%) | 65 (10.1%) |
| 7:00 AM to 7:29 AM | 187 (27.0%) | 63 (9.8%) |
| 7:30 AM to 7:59 AM | 19 (2.8%) | 128 (19.8%) |
| 8:00 AM to 8:29 AM | 24 (3.5%) | 64 (9.9%) |
| 8:30 AM to 8:59 AM | 42 (6.1%) | 0 (0.0%) |
| 9:00 AM to 9:59 AM | 49 (7.1%) | 21 (3.3%) |
| 10:00 AM to 10:59 AM | 0 (0.0%) | 0 (0.0%) |
| 11:00 AM to 11:59 AM | 0 (0.0%) | 56 (8.7%) |
| 12:00 PM to 3:59 PM | 59 (8.5%) | 61 (9.5%) |
| 4:00 PM to 11:59 PM | 0 (0.0%) | 103 (16.0%) |
| Total | 692 (100.0%) | 645 (100.0%) |
Housing Occupancy in Georgetown
Occupancy by Ownership in Georgetown
Of the total 1,921 dwellings in Georgetown, owner-occupied units account for 1,054 (54.9%), while renter-occupied units make up 867 (45.1%).
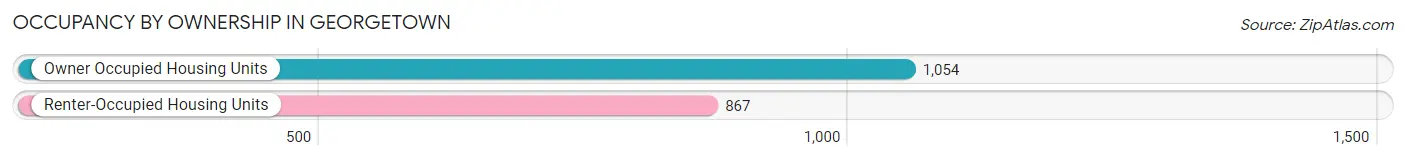
| Occupancy | # Housing Units | % Housing Units |
| Owner Occupied Housing Units | 1,054 | 54.9% |
| Renter-Occupied Housing Units | 867 | 45.1% |
| Total Occupied Housing Units | 1,921 | 100.0% |
Occupancy by Household Size in Georgetown
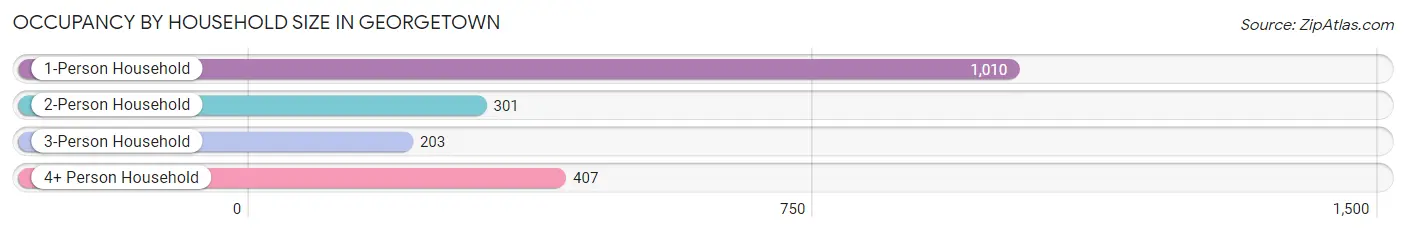
| Household Size | # Housing Units | % Housing Units |
| 1-Person Household | 1,010 | 52.6% |
| 2-Person Household | 301 | 15.7% |
| 3-Person Household | 203 | 10.6% |
| 4+ Person Household | 407 | 21.2% |
| Total Housing Units | 1,921 | 100.0% |
Occupancy by Ownership by Household Size in Georgetown
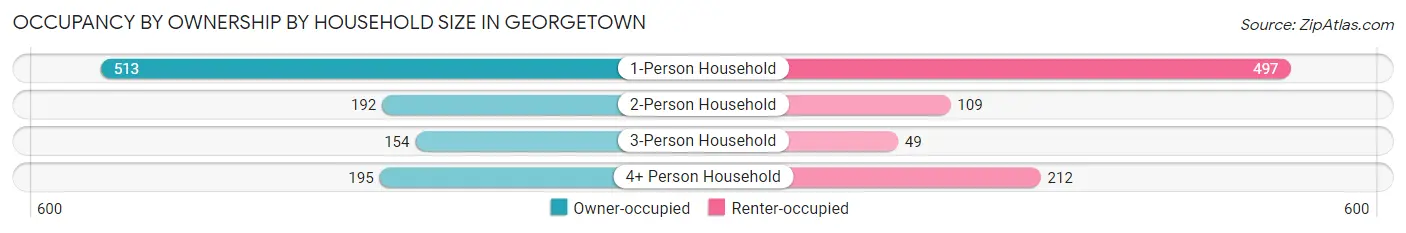
| Household Size | Owner-occupied | Renter-occupied |
| 1-Person Household | 513 (50.8%) | 497 (49.2%) |
| 2-Person Household | 192 (63.8%) | 109 (36.2%) |
| 3-Person Household | 154 (75.9%) | 49 (24.1%) |
| 4+ Person Household | 195 (47.9%) | 212 (52.1%) |
| Total Housing Units | 1,054 (54.9%) | 867 (45.1%) |
Occupancy by Educational Attainment in Georgetown
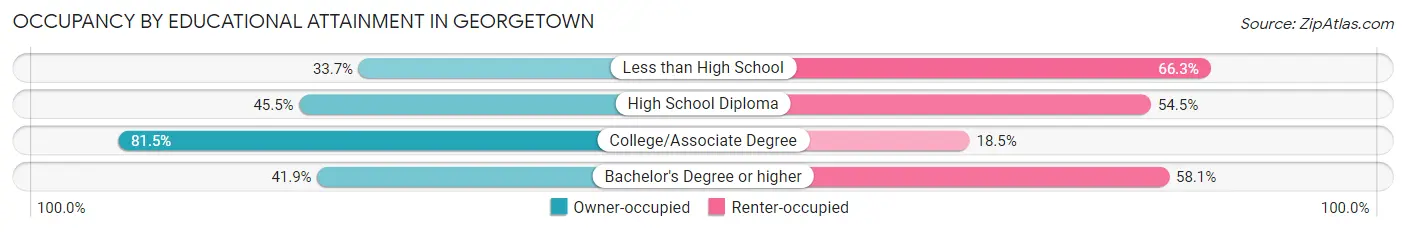
| Household Size | Owner-occupied | Renter-occupied |
| Less than High School | 119 (33.7%) | 234 (66.3%) |
| High School Diploma | 294 (45.5%) | 352 (54.5%) |
| College/Associate Degree | 524 (81.5%) | 119 (18.5%) |
| Bachelor's Degree or higher | 117 (41.9%) | 162 (58.1%) |
Occupancy by Age of Householder in Georgetown
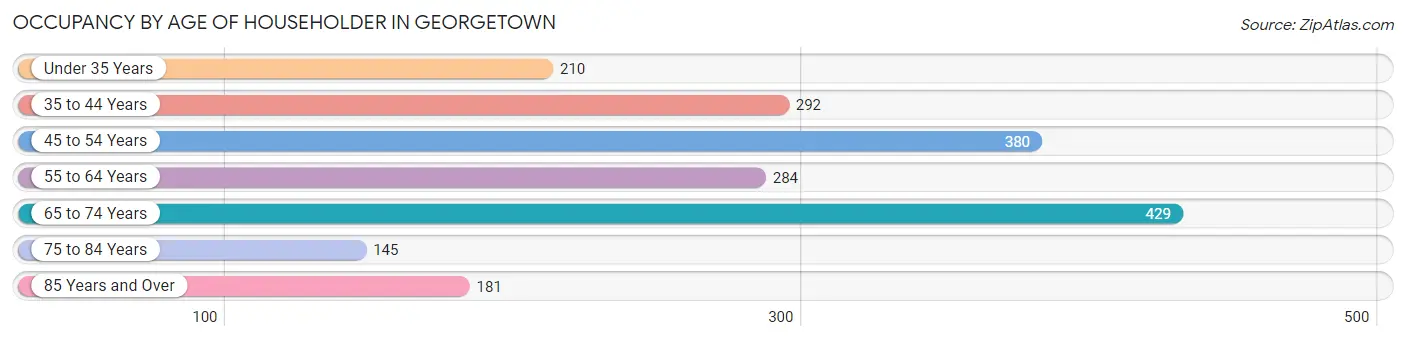
| Age Bracket | # Households | % Households |
| Under 35 Years | 210 | 10.9% |
| 35 to 44 Years | 292 | 15.2% |
| 45 to 54 Years | 380 | 19.8% |
| 55 to 64 Years | 284 | 14.8% |
| 65 to 74 Years | 429 | 22.3% |
| 75 to 84 Years | 145 | 7.5% |
| 85 Years and Over | 181 | 9.4% |
| Total | 1,921 | 100.0% |
Housing Finances in Georgetown
Median Income by Occupancy in Georgetown
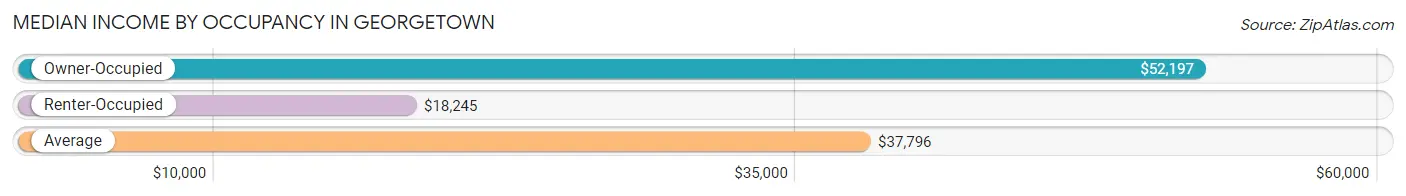
| Occupancy Type | # Households | Median Income |
| Owner-Occupied | 1,054 (54.9%) | $52,197 |
| Renter-Occupied | 867 (45.1%) | $18,245 |
| Average | 1,921 (100.0%) | $37,796 |
Occupancy by Householder Income Bracket in Georgetown
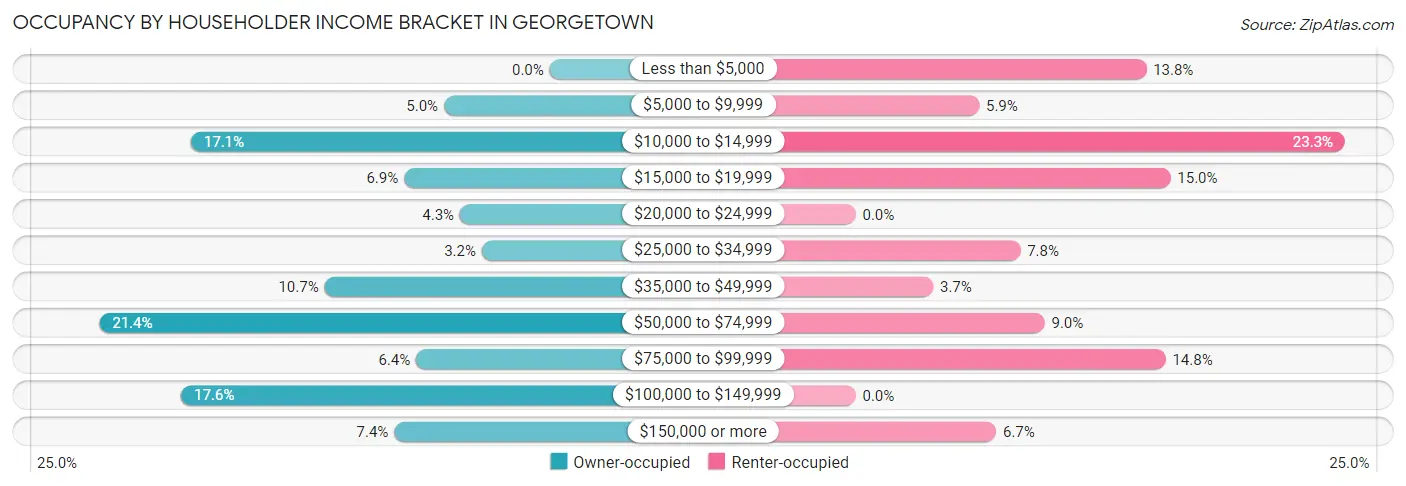
| Income Bracket | Owner-occupied | Renter-occupied |
| Less than $5,000 | 0 (0.0%) | 120 (13.8%) |
| $5,000 to $9,999 | 53 (5.0%) | 51 (5.9%) |
| $10,000 to $14,999 | 180 (17.1%) | 202 (23.3%) |
| $15,000 to $19,999 | 73 (6.9%) | 130 (15.0%) |
| $20,000 to $24,999 | 45 (4.3%) | 0 (0.0%) |
| $25,000 to $34,999 | 34 (3.2%) | 68 (7.8%) |
| $35,000 to $49,999 | 113 (10.7%) | 32 (3.7%) |
| $50,000 to $74,999 | 226 (21.4%) | 78 (9.0%) |
| $75,000 to $99,999 | 67 (6.4%) | 128 (14.8%) |
| $100,000 to $149,999 | 185 (17.5%) | 0 (0.0%) |
| $150,000 or more | 78 (7.4%) | 58 (6.7%) |
| Total | 1,054 (100.0%) | 867 (100.0%) |
Monthly Housing Cost Tiers in Georgetown
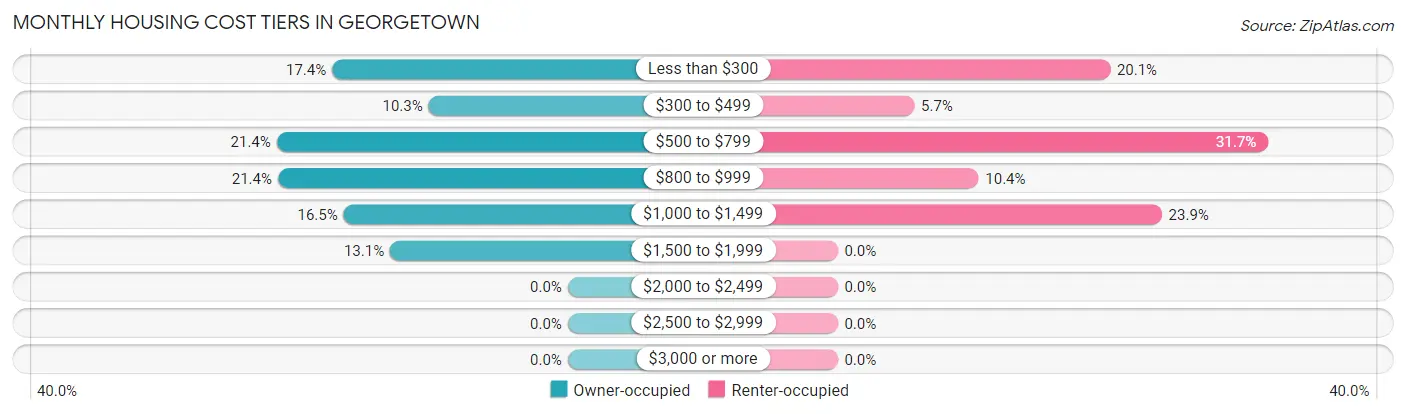
| Monthly Cost | Owner-occupied | Renter-occupied |
| Less than $300 | 183 (17.4%) | 174 (20.1%) |
| $300 to $499 | 108 (10.2%) | 49 (5.7%) |
| $500 to $799 | 226 (21.4%) | 275 (31.7%) |
| $800 to $999 | 225 (21.3%) | 90 (10.4%) |
| $1,000 to $1,499 | 174 (16.5%) | 207 (23.9%) |
| $1,500 to $1,999 | 138 (13.1%) | 0 (0.0%) |
| $2,000 to $2,499 | 0 (0.0%) | 0 (0.0%) |
| $2,500 to $2,999 | 0 (0.0%) | 0 (0.0%) |
| $3,000 or more | 0 (0.0%) | 0 (0.0%) |
| Total | 1,054 (100.0%) | 867 (100.0%) |
Physical Housing Characteristics in Georgetown
Housing Structures in Georgetown
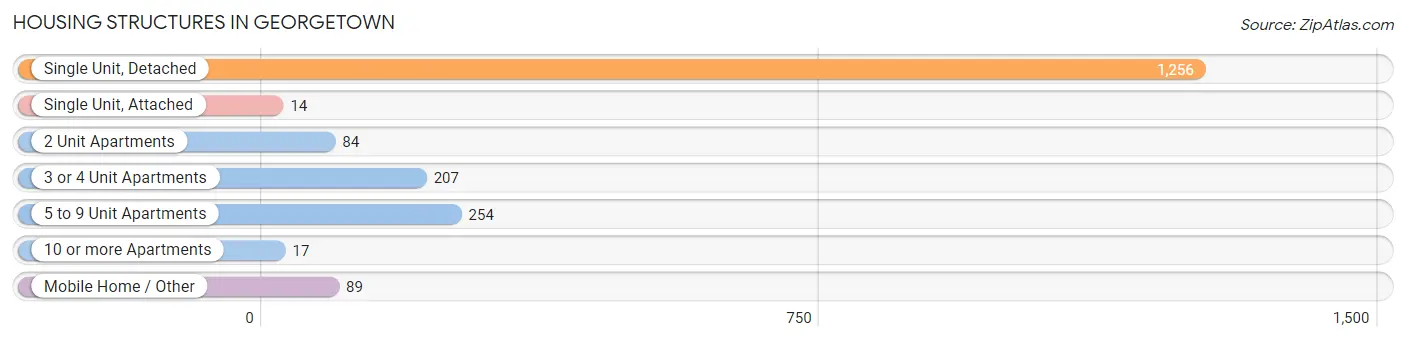
| Structure Type | # Housing Units | % Housing Units |
| Single Unit, Detached | 1,256 | 65.4% |
| Single Unit, Attached | 14 | 0.7% |
| 2 Unit Apartments | 84 | 4.4% |
| 3 or 4 Unit Apartments | 207 | 10.8% |
| 5 to 9 Unit Apartments | 254 | 13.2% |
| 10 or more Apartments | 17 | 0.9% |
| Mobile Home / Other | 89 | 4.6% |
| Total | 1,921 | 100.0% |
Housing Structures by Occupancy in Georgetown
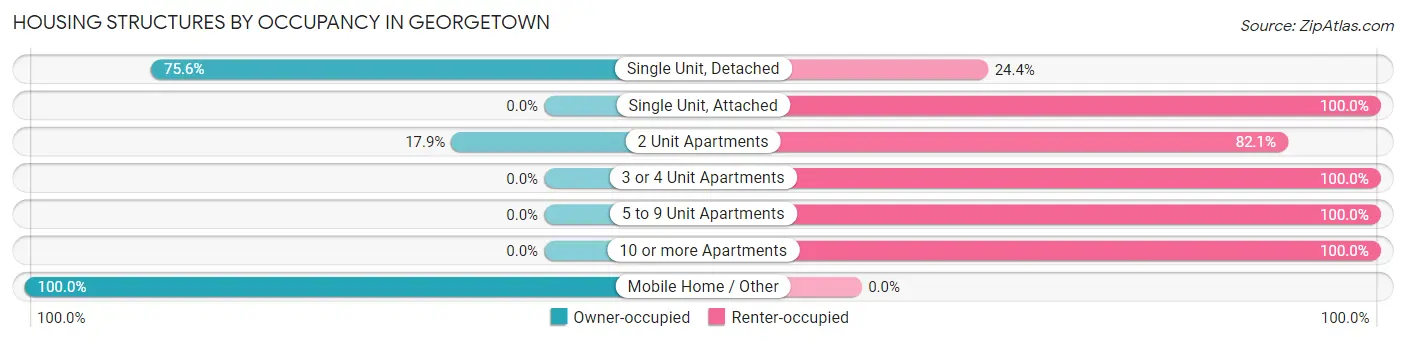
| Structure Type | Owner-occupied | Renter-occupied |
| Single Unit, Detached | 950 (75.6%) | 306 (24.4%) |
| Single Unit, Attached | 0 (0.0%) | 14 (100.0%) |
| 2 Unit Apartments | 15 (17.9%) | 69 (82.1%) |
| 3 or 4 Unit Apartments | 0 (0.0%) | 207 (100.0%) |
| 5 to 9 Unit Apartments | 0 (0.0%) | 254 (100.0%) |
| 10 or more Apartments | 0 (0.0%) | 17 (100.0%) |
| Mobile Home / Other | 89 (100.0%) | 0 (0.0%) |
| Total | 1,054 (54.9%) | 867 (45.1%) |
Housing Structures by Number of Rooms in Georgetown
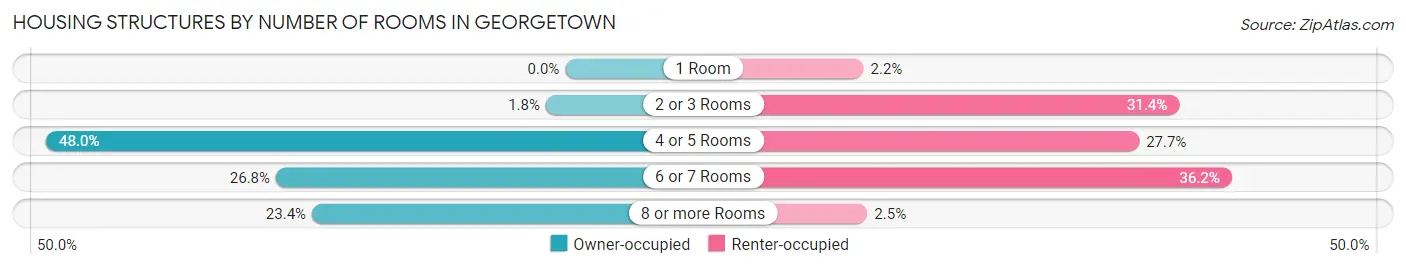
| Number of Rooms | Owner-occupied | Renter-occupied |
| 1 Room | 0 (0.0%) | 19 (2.2%) |
| 2 or 3 Rooms | 19 (1.8%) | 272 (31.4%) |
| 4 or 5 Rooms | 506 (48.0%) | 240 (27.7%) |
| 6 or 7 Rooms | 282 (26.8%) | 314 (36.2%) |
| 8 or more Rooms | 247 (23.4%) | 22 (2.5%) |
| Total | 1,054 (100.0%) | 867 (100.0%) |
Housing Structure by Heating Type in Georgetown
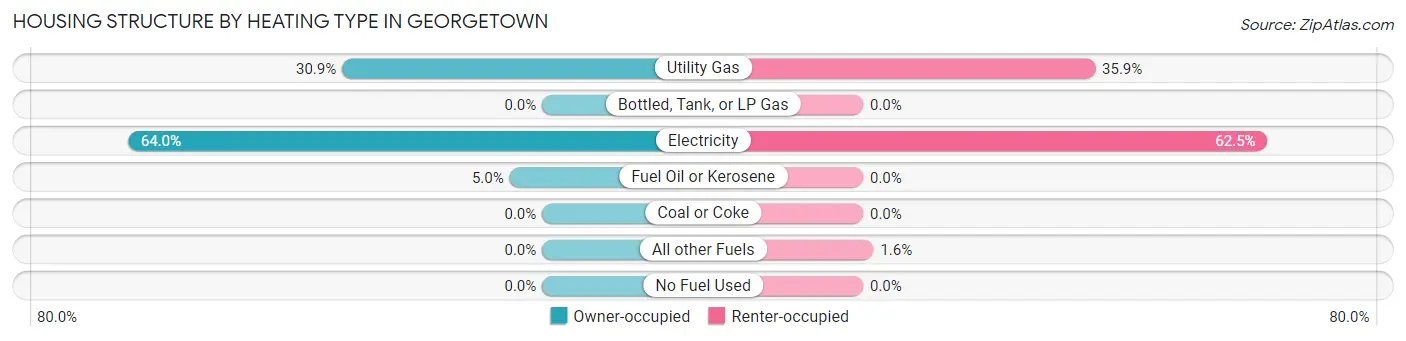
| Heating Type | Owner-occupied | Renter-occupied |
| Utility Gas | 326 (30.9%) | 311 (35.9%) |
| Bottled, Tank, or LP Gas | 0 (0.0%) | 0 (0.0%) |
| Electricity | 675 (64.0%) | 542 (62.5%) |
| Fuel Oil or Kerosene | 53 (5.0%) | 0 (0.0%) |
| Coal or Coke | 0 (0.0%) | 0 (0.0%) |
| All other Fuels | 0 (0.0%) | 14 (1.6%) |
| No Fuel Used | 0 (0.0%) | 0 (0.0%) |
| Total | 1,054 (100.0%) | 867 (100.0%) |
Household Vehicle Usage in Georgetown
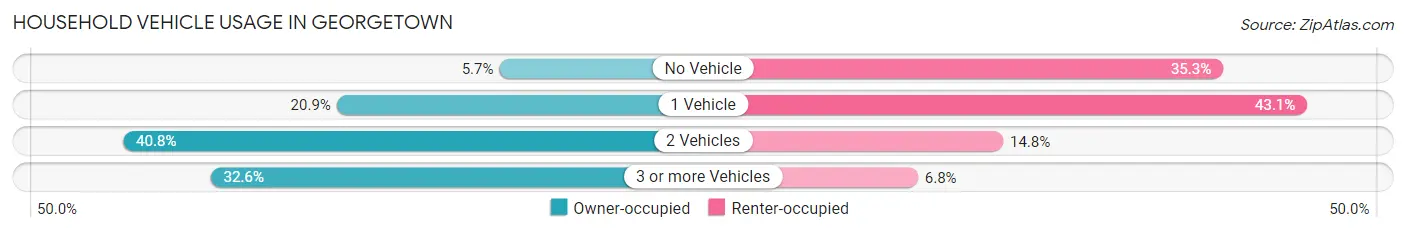
| Vehicles per Household | Owner-occupied | Renter-occupied |
| No Vehicle | 60 (5.7%) | 306 (35.3%) |
| 1 Vehicle | 220 (20.9%) | 374 (43.1%) |
| 2 Vehicles | 430 (40.8%) | 128 (14.8%) |
| 3 or more Vehicles | 344 (32.6%) | 59 (6.8%) |
| Total | 1,054 (100.0%) | 867 (100.0%) |
Real Estate & Mortgages in Georgetown
Real Estate and Mortgage Overview in Georgetown
| Characteristic | Without Mortgage | With Mortgage |
| Housing Units | 489 | 565 |
| Median Property Value | $59,500 | $143,500 |
| Median Household Income | $15,737 | $64 |
| Monthly Housing Costs | $391 | $0 |
| Real Estate Taxes | $580 | $66 |
Property Value by Mortgage Status in Georgetown
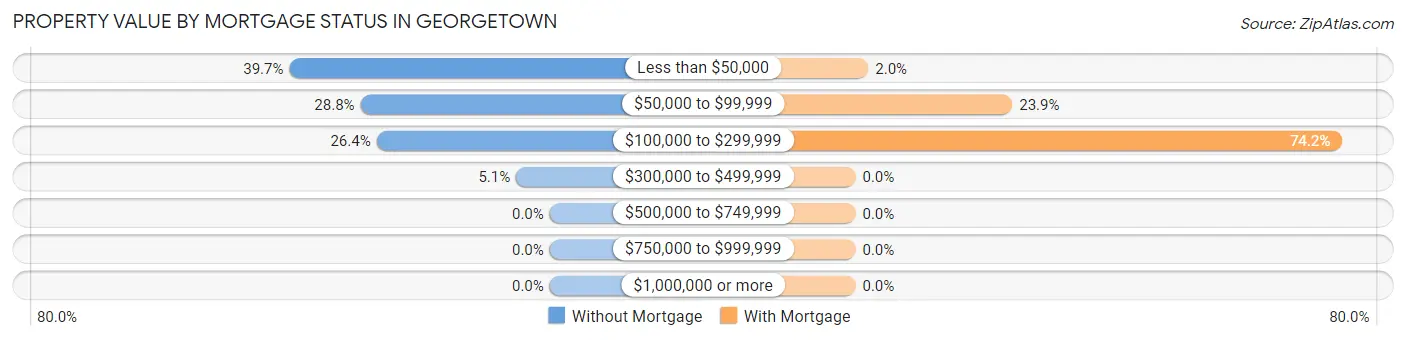
| Property Value | Without Mortgage | With Mortgage |
| Less than $50,000 | 194 (39.7%) | 11 (1.9%) |
| $50,000 to $99,999 | 141 (28.8%) | 135 (23.9%) |
| $100,000 to $299,999 | 129 (26.4%) | 419 (74.2%) |
| $300,000 to $499,999 | 25 (5.1%) | 0 (0.0%) |
| $500,000 to $749,999 | 0 (0.0%) | 0 (0.0%) |
| $750,000 to $999,999 | 0 (0.0%) | 0 (0.0%) |
| $1,000,000 or more | 0 (0.0%) | 0 (0.0%) |
| Total | 489 (100.0%) | 565 (100.0%) |
Household Income by Mortgage Status in Georgetown
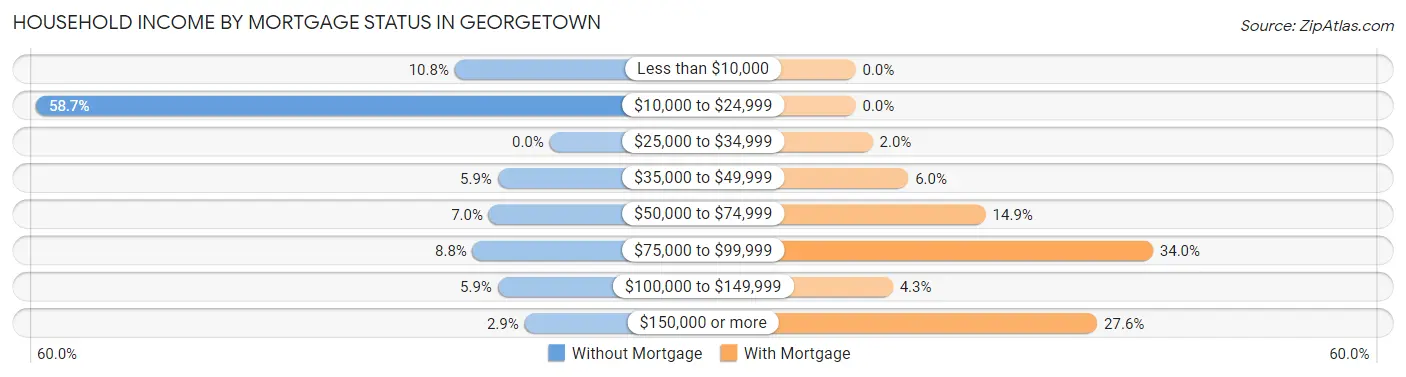
| Household Income | Without Mortgage | With Mortgage |
| Less than $10,000 | 53 (10.8%) | 0 (0.0%) |
| $10,000 to $24,999 | 287 (58.7%) | 0 (0.0%) |
| $25,000 to $34,999 | 0 (0.0%) | 11 (1.9%) |
| $35,000 to $49,999 | 29 (5.9%) | 34 (6.0%) |
| $50,000 to $74,999 | 34 (7.0%) | 84 (14.9%) |
| $75,000 to $99,999 | 43 (8.8%) | 192 (34.0%) |
| $100,000 to $149,999 | 29 (5.9%) | 24 (4.3%) |
| $150,000 or more | 14 (2.9%) | 156 (27.6%) |
| Total | 489 (100.0%) | 565 (100.0%) |
Property Value to Household Income Ratio in Georgetown
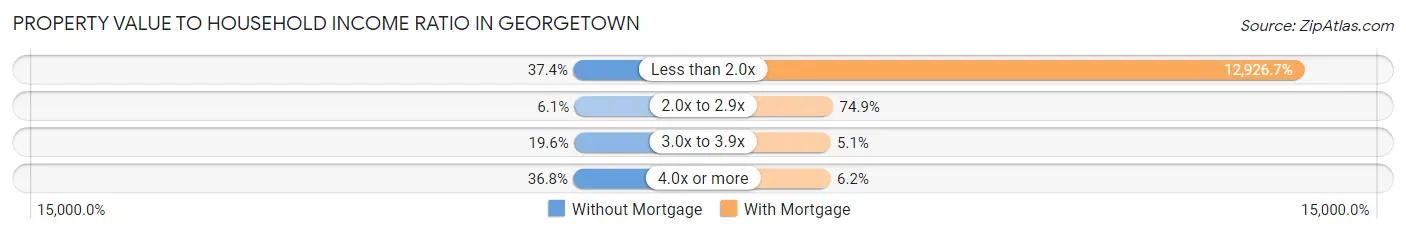
| Value-to-Income Ratio | Without Mortgage | With Mortgage |
| Less than 2.0x | 183 (37.4%) | 73,036 (12,926.7%) |
| 2.0x to 2.9x | 30 (6.1%) | 423 (74.9%) |
| 3.0x to 3.9x | 96 (19.6%) | 29 (5.1%) |
| 4.0x or more | 180 (36.8%) | 35 (6.2%) |
| Total | 489 (100.0%) | 565 (100.0%) |
Real Estate Taxes by Mortgage Status in Georgetown
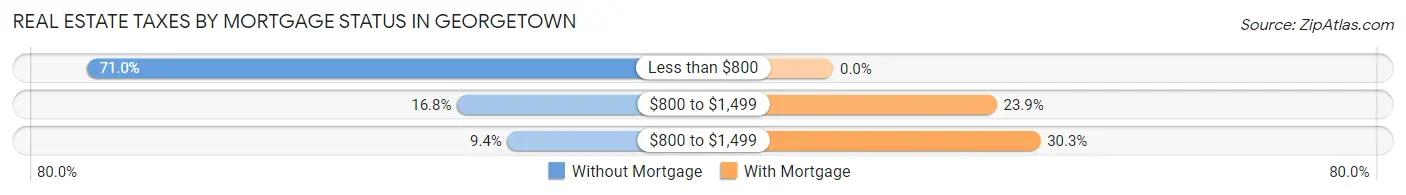
| Property Taxes | Without Mortgage | With Mortgage |
| Less than $800 | 347 (71.0%) | 0 (0.0%) |
| $800 to $1,499 | 82 (16.8%) | 135 (23.9%) |
| $800 to $1,499 | 46 (9.4%) | 171 (30.3%) |
| Total | 489 (100.0%) | 565 (100.0%) |
Health & Disability in Georgetown
Health Insurance Coverage by Age in Georgetown
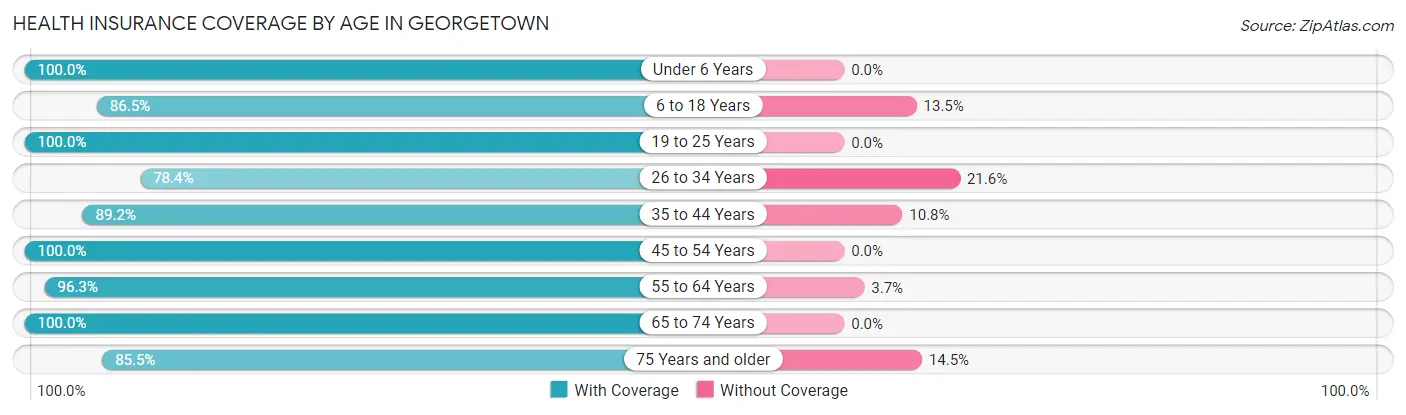
| Age Bracket | With Coverage | Without Coverage |
| Under 6 Years | 152 (100.0%) | 0 (0.0%) |
| 6 to 18 Years | 654 (86.5%) | 102 (13.5%) |
| 19 to 25 Years | 235 (100.0%) | 0 (0.0%) |
| 26 to 34 Years | 320 (78.4%) | 88 (21.6%) |
| 35 to 44 Years | 486 (89.2%) | 59 (10.8%) |
| 45 to 54 Years | 693 (100.0%) | 0 (0.0%) |
| 55 to 64 Years | 335 (96.3%) | 13 (3.7%) |
| 65 to 74 Years | 505 (100.0%) | 0 (0.0%) |
| 75 Years and older | 307 (85.5%) | 52 (14.5%) |
| Total | 3,687 (92.1%) | 314 (7.9%) |
Health Insurance Coverage by Citizenship Status in Georgetown
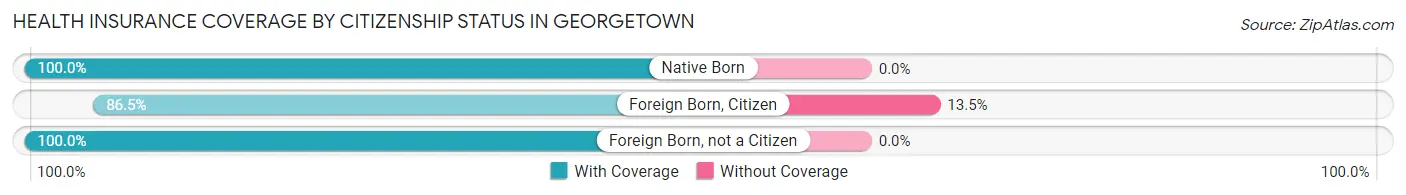
| Citizenship Status | With Coverage | Without Coverage |
| Native Born | 152 (100.0%) | 0 (0.0%) |
| Foreign Born, Citizen | 654 (86.5%) | 102 (13.5%) |
| Foreign Born, not a Citizen | 235 (100.0%) | 0 (0.0%) |
Health Insurance Coverage by Household Income in Georgetown
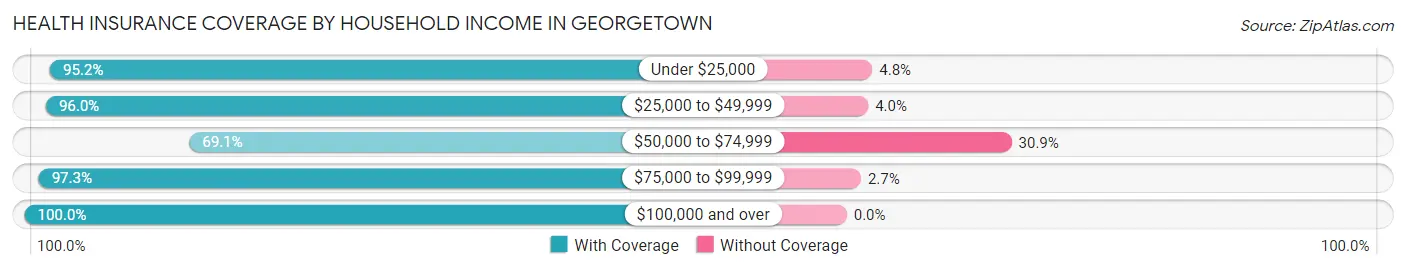
| Household Income | With Coverage | Without Coverage |
| Under $25,000 | 1,036 (95.2%) | 52 (4.8%) |
| $25,000 to $49,999 | 647 (96.0%) | 27 (4.0%) |
| $50,000 to $74,999 | 497 (69.1%) | 222 (30.9%) |
| $75,000 to $99,999 | 475 (97.3%) | 13 (2.7%) |
| $100,000 and over | 1,016 (100.0%) | 0 (0.0%) |
Public vs Private Health Insurance Coverage by Age in Georgetown
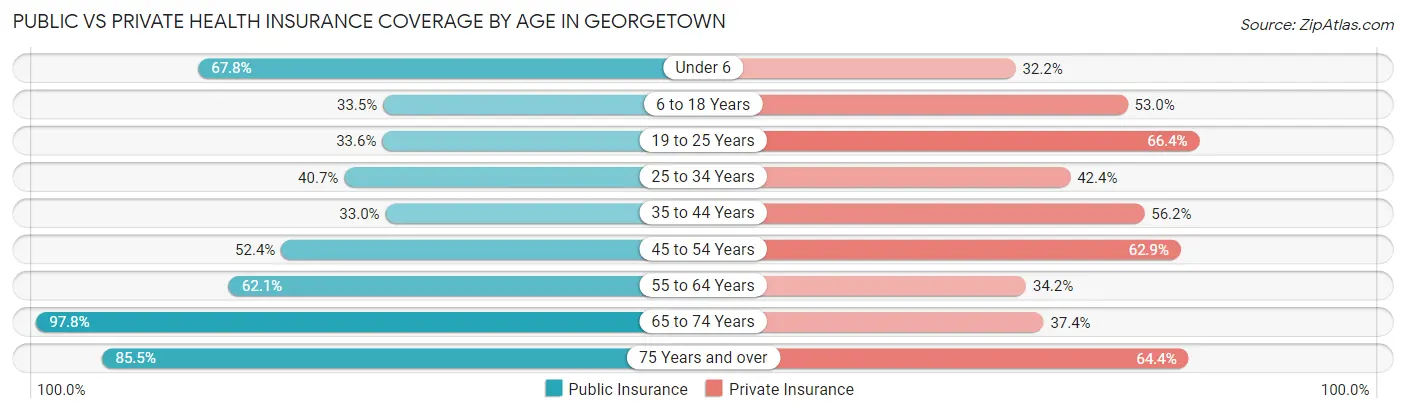
| Age Bracket | Public Insurance | Private Insurance |
| Under 6 | 103 (67.8%) | 49 (32.2%) |
| 6 to 18 Years | 253 (33.5%) | 401 (53.0%) |
| 19 to 25 Years | 79 (33.6%) | 156 (66.4%) |
| 25 to 34 Years | 166 (40.7%) | 173 (42.4%) |
| 35 to 44 Years | 180 (33.0%) | 306 (56.1%) |
| 45 to 54 Years | 363 (52.4%) | 436 (62.9%) |
| 55 to 64 Years | 216 (62.1%) | 119 (34.2%) |
| 65 to 74 Years | 494 (97.8%) | 189 (37.4%) |
| 75 Years and over | 307 (85.5%) | 231 (64.3%) |
| Total | 2,161 (54.0%) | 2,060 (51.5%) |
Disability Status by Sex by Age in Georgetown
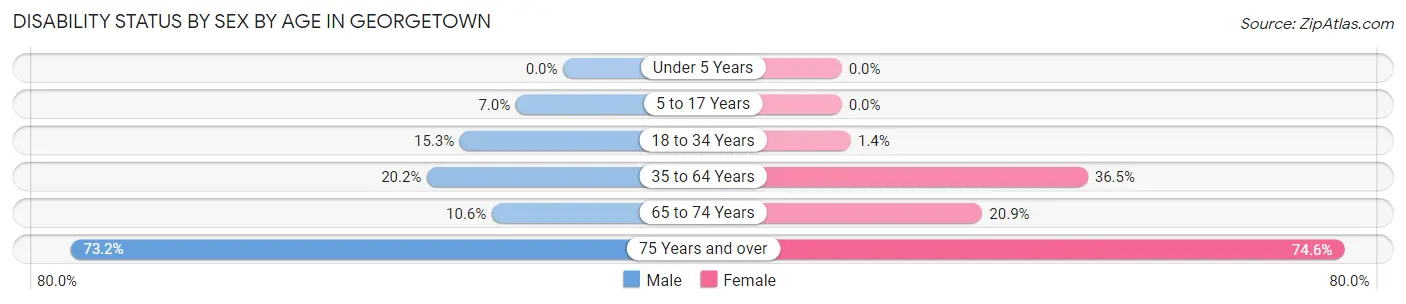
| Age Bracket | Male | Female |
| Under 5 Years | 0 (0.0%) | 0 (0.0%) |
| 5 to 17 Years | 24 (7.0%) | 0 (0.0%) |
| 18 to 34 Years | 46 (15.3%) | 5 (1.4%) |
| 35 to 64 Years | 169 (20.2%) | 274 (36.5%) |
| 65 to 74 Years | 22 (10.6%) | 62 (20.9%) |
| 75 Years and over | 41 (73.2%) | 226 (74.6%) |
Disability Class by Sex by Age in Georgetown
Disability Class: Hearing Difficulty
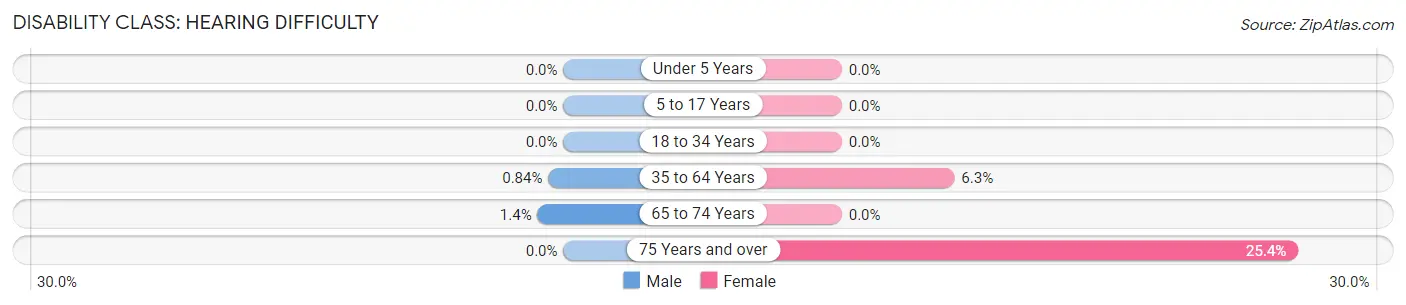
| Age Bracket | Male | Female |
| Under 5 Years | 0 (0.0%) | 0 (0.0%) |
| 5 to 17 Years | 0 (0.0%) | 0 (0.0%) |
| 18 to 34 Years | 0 (0.0%) | 0 (0.0%) |
| 35 to 64 Years | 7 (0.8%) | 47 (6.3%) |
| 65 to 74 Years | 3 (1.4%) | 0 (0.0%) |
| 75 Years and over | 0 (0.0%) | 77 (25.4%) |
Disability Class: Vision Difficulty
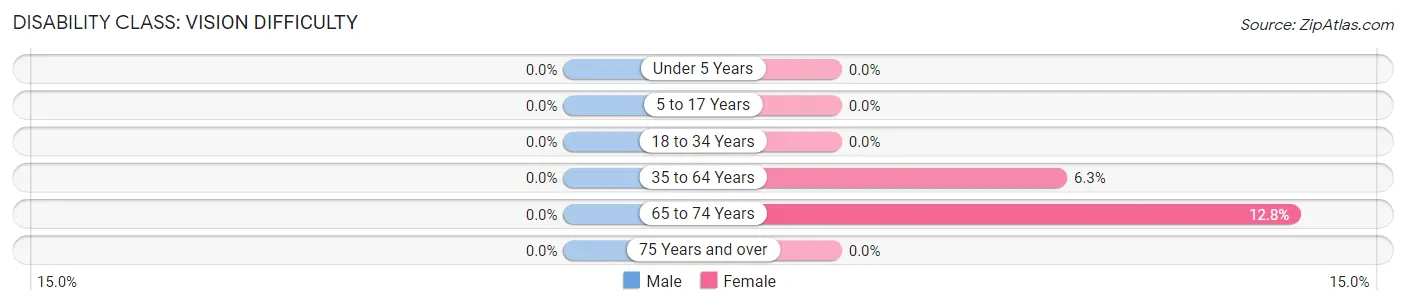
| Age Bracket | Male | Female |
| Under 5 Years | 0 (0.0%) | 0 (0.0%) |
| 5 to 17 Years | 0 (0.0%) | 0 (0.0%) |
| 18 to 34 Years | 0 (0.0%) | 0 (0.0%) |
| 35 to 64 Years | 0 (0.0%) | 47 (6.3%) |
| 65 to 74 Years | 0 (0.0%) | 38 (12.8%) |
| 75 Years and over | 0 (0.0%) | 0 (0.0%) |
Disability Class: Cognitive Difficulty
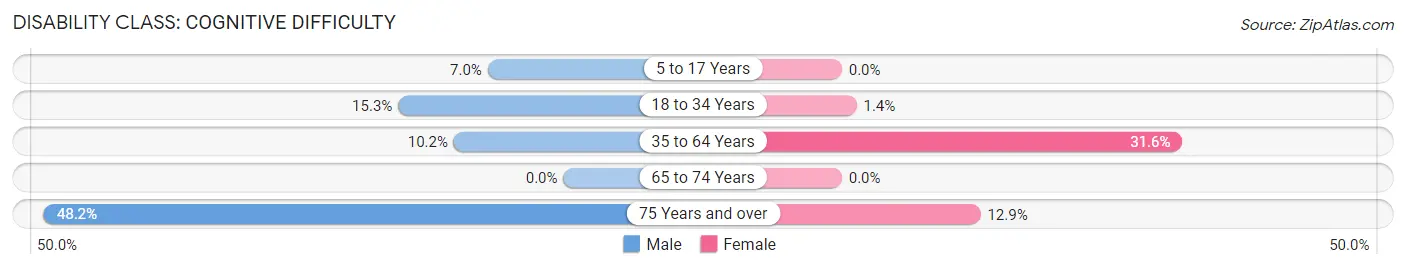
| Age Bracket | Male | Female |
| 5 to 17 Years | 24 (7.0%) | 0 (0.0%) |
| 18 to 34 Years | 46 (15.3%) | 5 (1.4%) |
| 35 to 64 Years | 85 (10.2%) | 237 (31.6%) |
| 65 to 74 Years | 0 (0.0%) | 0 (0.0%) |
| 75 Years and over | 27 (48.2%) | 39 (12.9%) |
Disability Class: Ambulatory Difficulty
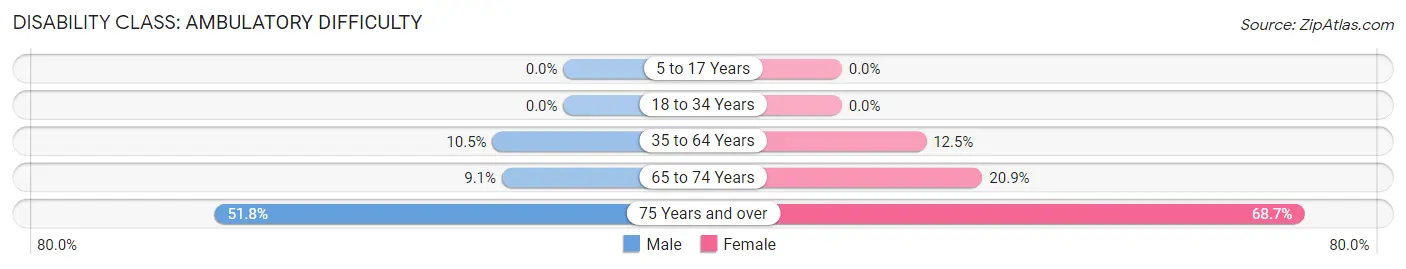
| Age Bracket | Male | Female |
| 5 to 17 Years | 0 (0.0%) | 0 (0.0%) |
| 18 to 34 Years | 0 (0.0%) | 0 (0.0%) |
| 35 to 64 Years | 88 (10.5%) | 94 (12.5%) |
| 65 to 74 Years | 19 (9.1%) | 62 (20.9%) |
| 75 Years and over | 29 (51.8%) | 208 (68.6%) |
Disability Class: Self-Care Difficulty
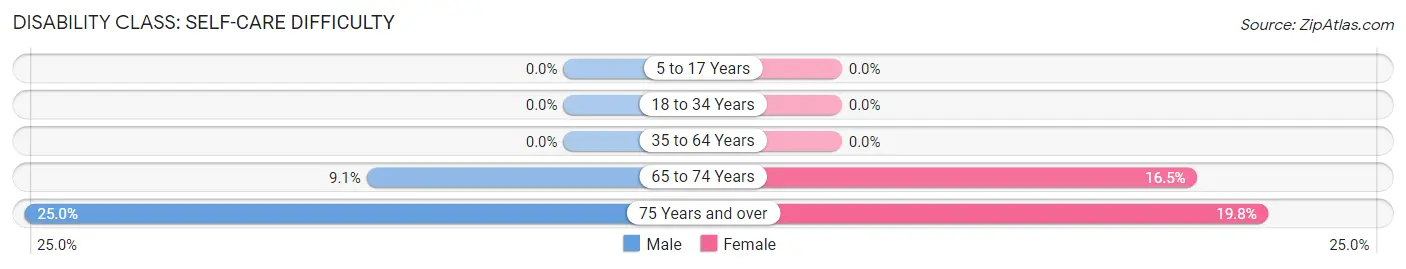
| Age Bracket | Male | Female |
| 5 to 17 Years | 0 (0.0%) | 0 (0.0%) |
| 18 to 34 Years | 0 (0.0%) | 0 (0.0%) |
| 35 to 64 Years | 0 (0.0%) | 0 (0.0%) |
| 65 to 74 Years | 19 (9.1%) | 49 (16.5%) |
| 75 Years and over | 14 (25.0%) | 60 (19.8%) |
Technology Access in Georgetown
Computing Device Access in Georgetown
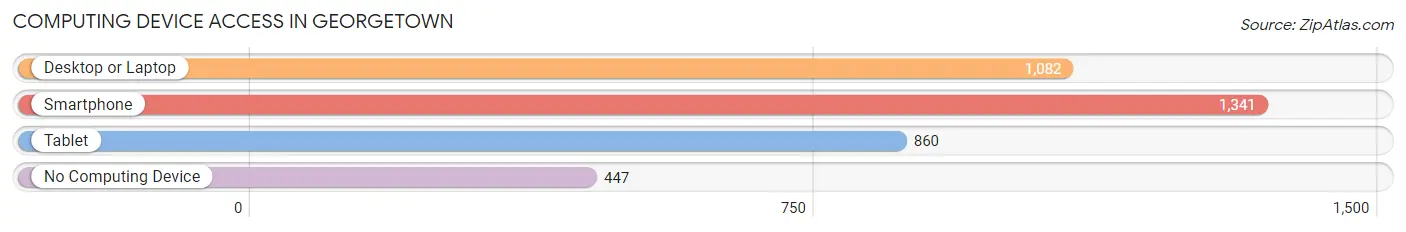
| Device Type | # Households | % Households |
| Desktop or Laptop | 1,082 | 56.3% |
| Smartphone | 1,341 | 69.8% |
| Tablet | 860 | 44.8% |
| No Computing Device | 447 | 23.3% |
| Total | 1,921 | 100.0% |
Internet Access in Georgetown
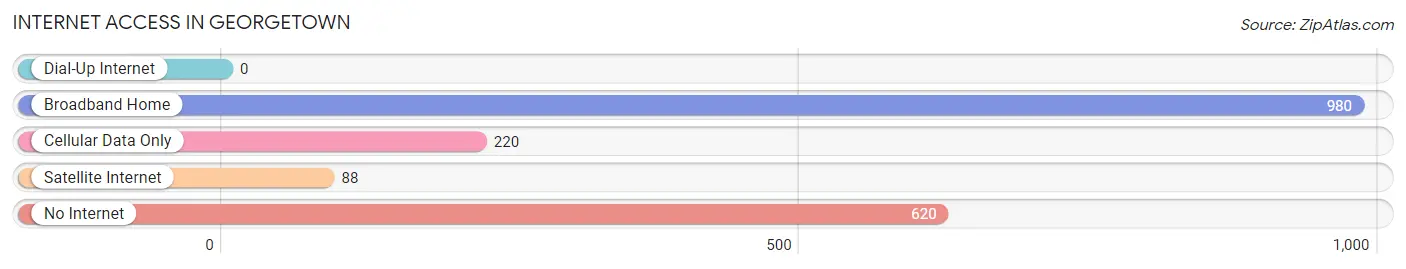
| Internet Type | # Households | % Households |
| Dial-Up Internet | 0 | 0.0% |
| Broadband Home | 980 | 51.0% |
| Cellular Data Only | 220 | 11.5% |
| Satellite Internet | 88 | 4.6% |
| No Internet | 620 | 32.3% |
| Total | 1,921 | 100.0% |
Georgetown Summary
Georgetown, Ohio is a small city located in Brown County, Ohio. It is situated on the banks of the Little Miami River, approximately 30 miles east of Cincinnati. The city has a population of approximately 4,000 people and is the county seat of Brown County.
Geography
Georgetown is located in the southwestern corner of Ohio, in the Appalachian Plateau region. The city is situated on the banks of the Little Miami River, which flows through the city and is a major tributary of the Ohio River. The city is surrounded by rolling hills and wooded areas, and is located in the foothills of the Appalachian Mountains. The city is located at an elevation of 890 feet above sea level.
Climate
Georgetown has a humid continental climate, with hot summers and cold winters. The average annual temperature is 54 degrees Fahrenheit, with an average high of 79 degrees in the summer and an average low of 28 degrees in the winter. The city receives an average of 40 inches of precipitation per year, with the majority of it falling in the spring and summer months.
Demographics
As of the 2010 census, Georgetown had a population of 4,000 people. The racial makeup of the city was 97.2% White, 0.7% African American, 0.3% Native American, 0.3% Asian, 0.2% from other races, and 1.5% from two or more races. Hispanic or Latino of any race were 0.7% of the population.
Economy
Georgetown’s economy is largely based on agriculture and manufacturing. The city is home to several large manufacturing companies, including the Brown County Manufacturing Company, which produces a variety of products, including furniture, cabinets, and other wood products. The city is also home to several small businesses, including restaurants, retail stores, and service providers.
History
Georgetown was founded in 1819 by a group of settlers from Kentucky. The city was named after George Washington, who had recently died. The city was incorporated in 1845 and was designated as the county seat of Brown County.
In the late 19th century, Georgetown was a major center for the production of tobacco. The city was also home to several large manufacturing companies, including the Brown County Manufacturing Company, which produced a variety of products, including furniture, cabinets, and other wood products.
In the early 20th century, Georgetown was a major center for the production of coal. The city was also home to several large manufacturing companies, including the Brown County Manufacturing Company, which produced a variety of products, including furniture, cabinets, and other wood products.
In the late 20th century, Georgetown experienced a period of economic decline, as many of the city’s manufacturing companies closed or moved away. However, the city has since experienced a resurgence, with several new businesses opening in the city.
Today, Georgetown is a small city with a population of approximately 4,000 people. The city is home to several small businesses, including restaurants, retail stores, and service providers. The city is also home to several large manufacturing companies, including the Brown County Manufacturing Company, which produces a variety of products, including furniture, cabinets, and other wood products.
Common Questions
What is the Total Population of Georgetown?
Total Population of Georgetown is 4,323.
What is the Total Male Population of Georgetown?
Total Male Population of Georgetown is 2,115.
What is the Total Female Population of Georgetown?
Total Female Population of Georgetown is 2,208.
What is the Ratio of Males per 100 Females in Georgetown?
There are 95.79 Males per 100 Females in Georgetown.
What is the Ratio of Females per 100 Males in Georgetown?
There are 104.40 Females per 100 Males in Georgetown.
What is the Median Population Age in Georgetown?
Median Population Age in Georgetown is 45.1 Years.
What is the Average Family Size in Georgetown
Average Family Size in Georgetown is 3.2 People.
What is the Average Household Size in Georgetown
Average Household Size in Georgetown is 2.1 People.
What is Per Capita Income in Georgetown?
Per Capita income in Georgetown is $27,075.
What is the Median Family Income in Georgetown?
Median Family Income in Georgetown is $79,417.
What is the Median Household income in Georgetown?
Median Household Income in Georgetown is $37,796.
What is Income or Wage Gap in Georgetown?
Income or Wage Gap in Georgetown is 45.2%.
Women in Georgetown earn 54.8 cents for every dollar earned by a man.
What is Inequality or Gini Index in Georgetown?
Inequality or Gini Index in Georgetown is 0.52.
How Large is the Labor Force in Georgetown?
There are 1,527 People in the Labor Forcein in Georgetown.
What is the Percentage of People in the Labor Force in Georgetown?
42.3% of People are in the Labor Force in Georgetown.
What is the Unemployment Rate in Georgetown?
Unemployment Rate in Georgetown is 2.6%.