Branchville borough, NJ
Branchville borough Overview
708
TOTAL POPULATION
411
MALE POPULATION
297
FEMALE POPULATION
138.38
MALES / 100 FEMALES
72.26
FEMALES / 100 MALES
50.5
MEDIAN AGE
2.7
AVG FAMILY SIZE
2.3
AVG HOUSEHOLD SIZE
$43,019
PER CAPITA INCOME
$125,500
AVG FAMILY INCOME
$118,125
AVG HOUSEHOLD INCOME
4.4%
WAGE / INCOME GAP [ % ]
95.6¢/ $1
WAGE / INCOME GAP [ $ ]
0.29
INEQUALITY / GINI INDEX
454
LABOR FORCE [ PEOPLE ]
68.7%
PERCENT IN LABOR FORCE
0.7%
UNEMPLOYMENT RATE
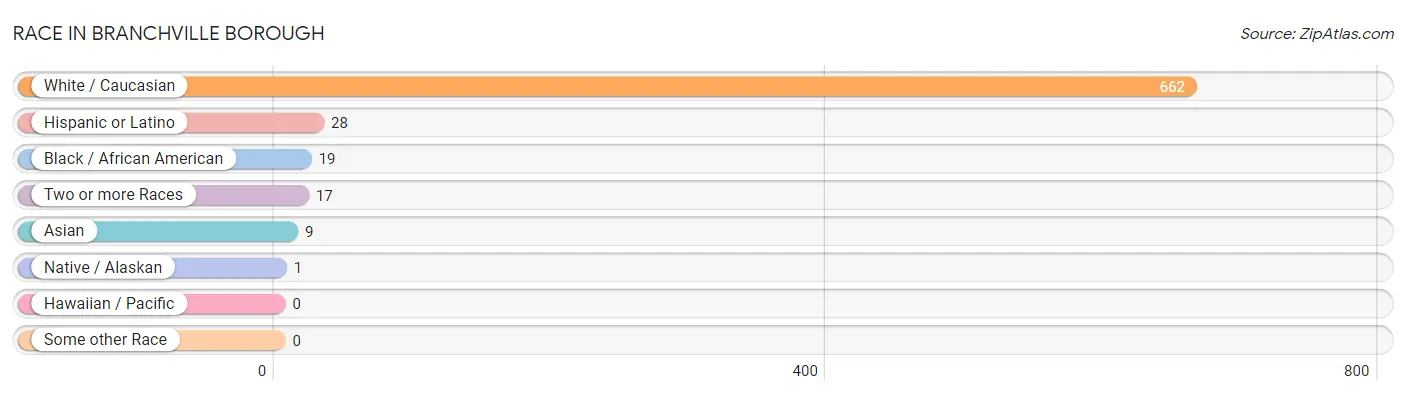
Race in Branchville borough
The most populous races in Branchville borough are White / Caucasian (662 | 93.5%), Hispanic or Latino (28 | 4.0%), and Black / African American (19 | 2.7%).
| Race | # Population | % Population |
| Asian | 9 | 1.3% |
| Black / African American | 19 | 2.7% |
| Hawaiian / Pacific | 0 | 0.0% |
| Hispanic or Latino | 28 | 4.0% |
| Native / Alaskan | 1 | 0.1% |
| White / Caucasian | 662 | 93.5% |
| Two or more Races | 17 | 2.4% |
| Some other Race | 0 | 0.0% |
| Total | 708 | 100.0% |
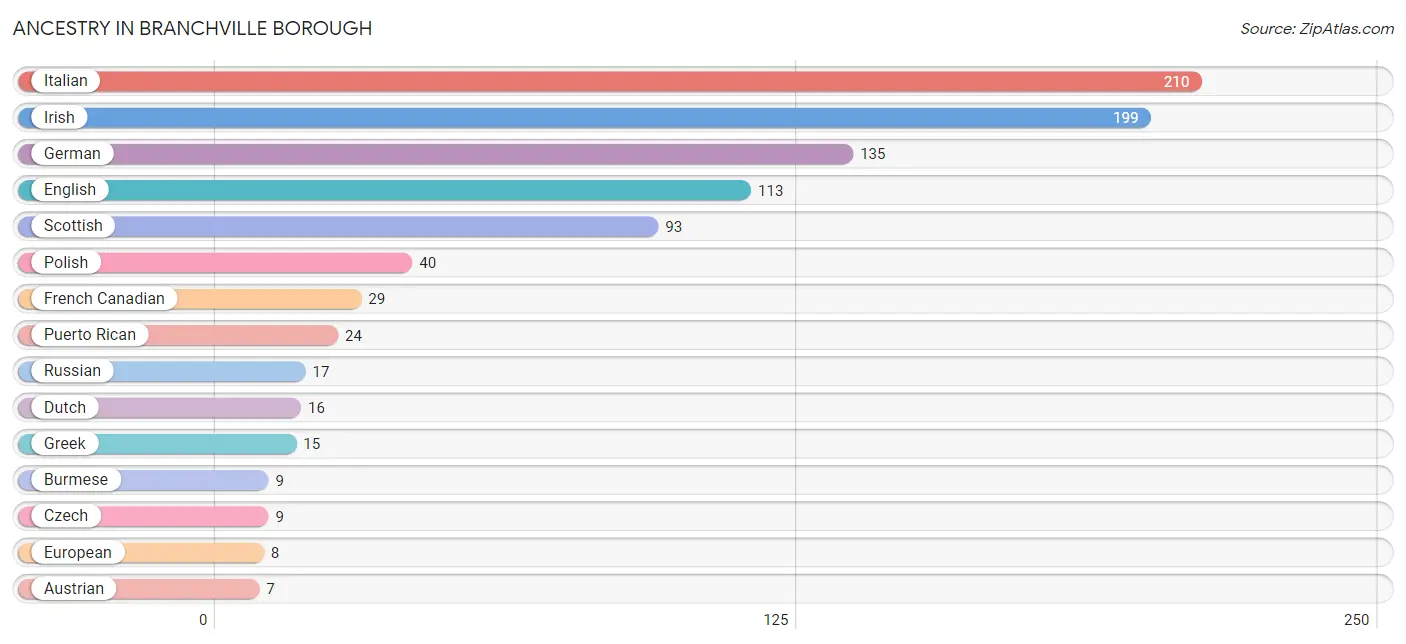
Ancestry in Branchville borough
The most populous ancestries reported in Branchville borough are Italian (210 | 29.7%), Irish (199 | 28.1%), German (135 | 19.1%), English (113 | 16.0%), and Scottish (93 | 13.1%), together accounting for 105.9% of all Branchville borough residents.
| Ancestry | # Population | % Population |
| American | 4 | 0.6% |
| Austrian | 7 | 1.0% |
| Burmese | 9 | 1.3% |
| Cherokee | 1 | 0.1% |
| Cuban | 4 | 0.6% |
| Czech | 9 | 1.3% |
| Delaware | 2 | 0.3% |
| Dutch | 16 | 2.3% |
| English | 113 | 16.0% |
| European | 8 | 1.1% |
| French Canadian | 29 | 4.1% |
| German | 135 | 19.1% |
| Greek | 15 | 2.1% |
| Hungarian | 7 | 1.0% |
| Irish | 199 | 28.1% |
| Iroquois | 1 | 0.1% |
| Italian | 210 | 29.7% |
| Nigerian | 7 | 1.0% |
| Pennsylvania German | 3 | 0.4% |
| Polish | 40 | 5.7% |
| Puerto Rican | 24 | 3.4% |
| Russian | 17 | 2.4% |
| Scotch-Irish | 6 | 0.9% |
| Scottish | 93 | 13.1% |
| Subsaharan African | 7 | 1.0% |
| Swedish | 3 | 0.4% |
| Swiss | 3 | 0.4% |
| Ukrainian | 6 | 0.9% |
| Welsh | 4 | 0.6% | View All 29 Rows |
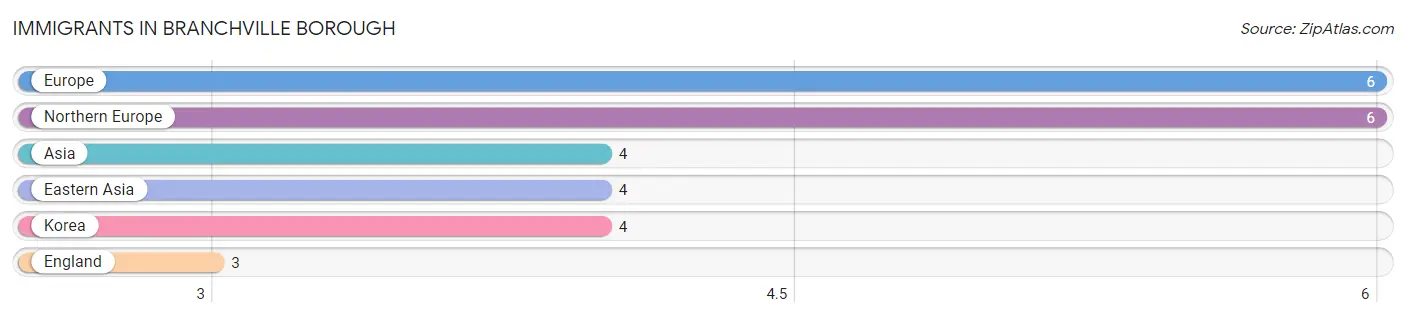
Immigrants in Branchville borough
The most numerous immigrant groups reported in Branchville borough came from Europe (6 | 0.9%), Northern Europe (6 | 0.9%), Asia (4 | 0.6%), Eastern Asia (4 | 0.6%), and Korea (4 | 0.6%), together accounting for 3.4% of all Branchville borough residents.
| Immigration Origin | # Population | % Population |
| Asia | 4 | 0.6% |
| Eastern Asia | 4 | 0.6% |
| England | 3 | 0.4% |
| Europe | 6 | 0.9% |
| Korea | 4 | 0.6% |
| Northern Europe | 6 | 0.9% | View All 6 Rows |
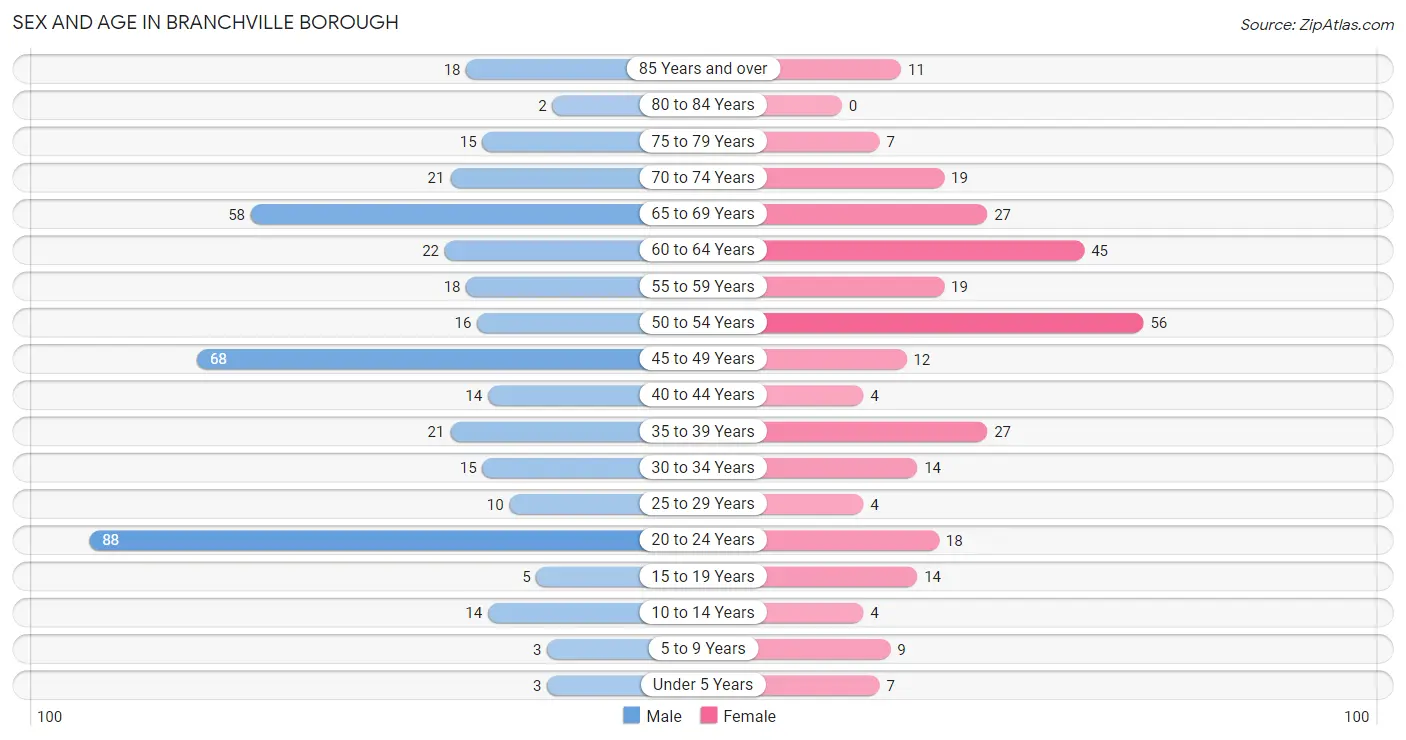
Sex and Age in Branchville borough
Sex and Age in Branchville borough
The most populous age groups in Branchville borough are 20 to 24 Years (88 | 21.4%) for men and 50 to 54 Years (56 | 18.9%) for women.
| Age Bracket | Male | Female |
| Under 5 Years | 3 (0.7%) | 7 (2.4%) |
| 5 to 9 Years | 3 (0.7%) | 9 (3.0%) |
| 10 to 14 Years | 14 (3.4%) | 4 (1.3%) |
| 15 to 19 Years | 5 (1.2%) | 14 (4.7%) |
| 20 to 24 Years | 88 (21.4%) | 18 (6.1%) |
| 25 to 29 Years | 10 (2.4%) | 4 (1.3%) |
| 30 to 34 Years | 15 (3.6%) | 14 (4.7%) |
| 35 to 39 Years | 21 (5.1%) | 27 (9.1%) |
| 40 to 44 Years | 14 (3.4%) | 4 (1.3%) |
| 45 to 49 Years | 68 (16.6%) | 12 (4.0%) |
| 50 to 54 Years | 16 (3.9%) | 56 (18.9%) |
| 55 to 59 Years | 18 (4.4%) | 19 (6.4%) |
| 60 to 64 Years | 22 (5.3%) | 45 (15.1%) |
| 65 to 69 Years | 58 (14.1%) | 27 (9.1%) |
| 70 to 74 Years | 21 (5.1%) | 19 (6.4%) |
| 75 to 79 Years | 15 (3.6%) | 7 (2.4%) |
| 80 to 84 Years | 2 (0.5%) | 0 (0.0%) |
| 85 Years and over | 18 (4.4%) | 11 (3.7%) |
| Total | 411 (100.0%) | 297 (100.0%) |
Families and Households in Branchville borough
Median Family Size in Branchville borough
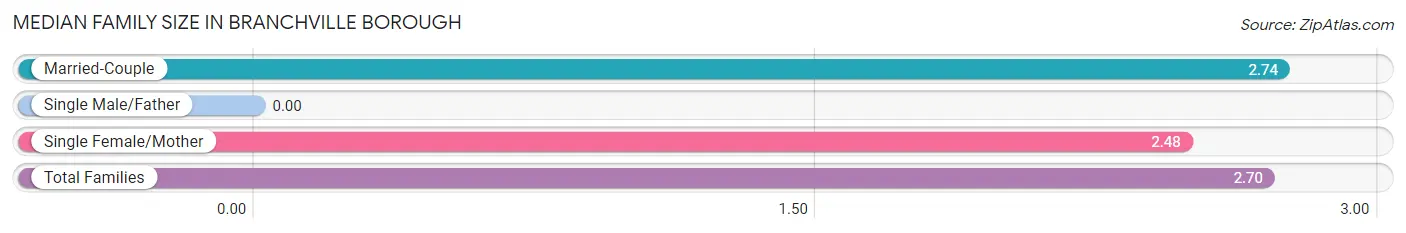
| Family Type | # Families | Family Size |
| Married-Couple | 183 (85.5%) | 2.74 |
| Single Male/Father | 0 (0.0%) | - |
| Single Female/Mother | 31 (14.5%) | 2.48 |
| Total Families | 214 (100.0%) | 2.70 |
Median Household Size in Branchville borough
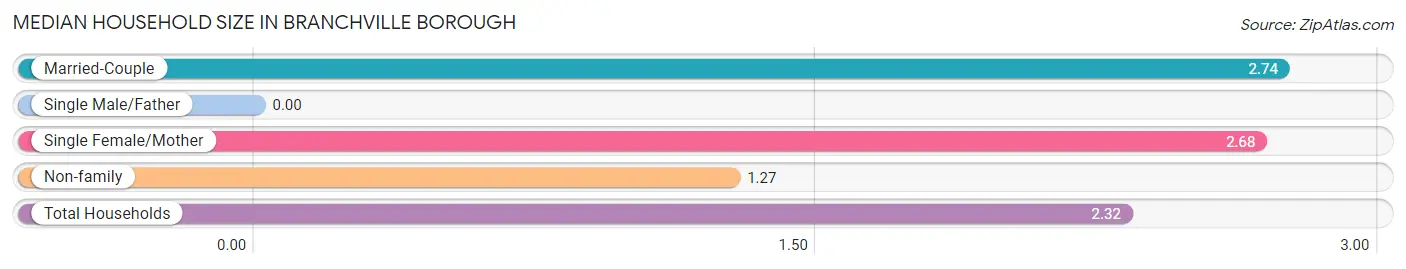
| Household Type | # Households | Household Size |
| Married-Couple | 183 (61.6%) | 2.74 |
| Single Male/Father | 0 (0.0%) | - |
| Single Female/Mother | 31 (10.4%) | 2.68 |
| Non-family | 83 (28.0%) | 1.27 |
| Total Households | 297 (100.0%) | 2.32 |
Household Size by Marriage Status in Branchville borough
Out of a total of 297 households in Branchville borough, 214 (72.1%) are family households, while 83 (28.0%) are nonfamily households. The most numerous type of family households are 2-person households, comprising 117, and the most common type of nonfamily households are 1-person households, comprising 64.
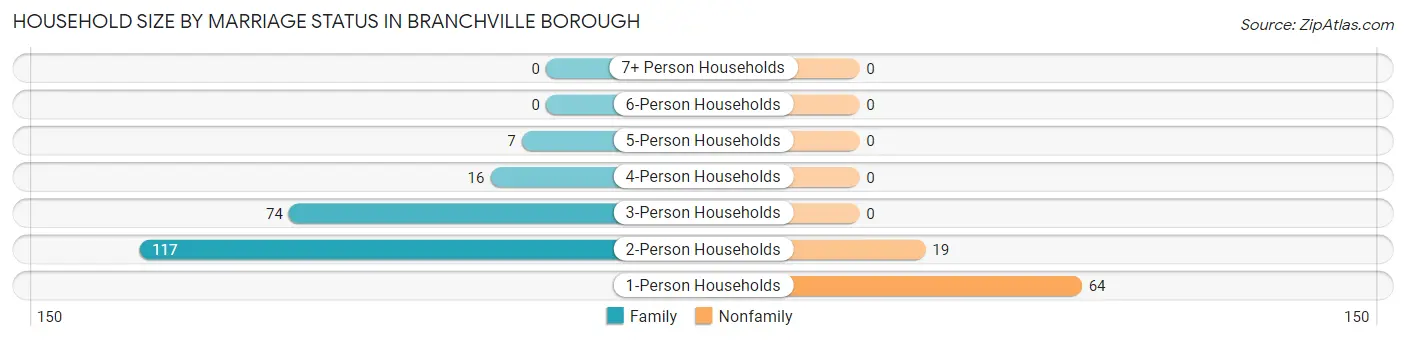
| Household Size | Family Households | Nonfamily Households |
| 1-Person Households | - | 64 (21.5%) |
| 2-Person Households | 117 (39.4%) | 19 (6.4%) |
| 3-Person Households | 74 (24.9%) | 0 (0.0%) |
| 4-Person Households | 16 (5.4%) | 0 (0.0%) |
| 5-Person Households | 7 (2.4%) | 0 (0.0%) |
| 6-Person Households | 0 (0.0%) | 0 (0.0%) |
| 7+ Person Households | 0 (0.0%) | 0 (0.0%) |
| Total | 214 (72.1%) | 83 (28.0%) |
Female Fertility in Branchville borough
Fertility by Age in Branchville borough
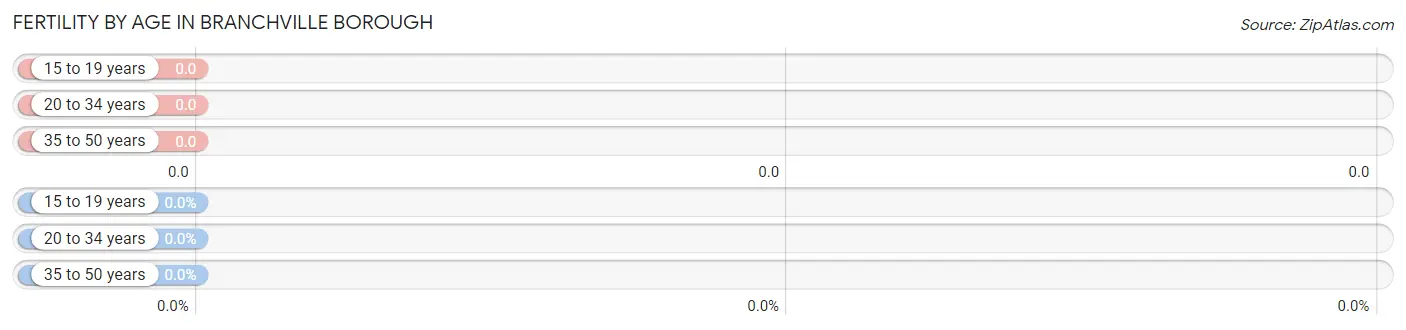
| Age Bracket | Women with Births | Births / 1,000 Women |
| 15 to 19 years | 0 (0.0%) | 0.0 |
| 20 to 34 years | 0 (0.0%) | 0.0 |
| 35 to 50 years | 0 (0.0%) | 0.0 |
| Total | 0 (0.0%) | 0.0 |
Fertility by Age by Marriage Status in Branchville borough
| Age Bracket | Married | Unmarried |
| 15 to 19 years | 0 (0.0%) | 0 (0.0%) |
| 20 to 34 years | 0 (0.0%) | 0 (0.0%) |
| 35 to 50 years | 0 (0.0%) | 0 (0.0%) |
| Total | 0 (0.0%) | 0 (0.0%) |
Fertility by Education in Branchville borough
| Educational Attainment | Women with Births | Births / 1,000 Women |
| Less than High School | 0 (0.0%) | 0.0 |
| High School Diploma | 0 (0.0%) | 0.0 |
| College or Associate's Degree | 0 (0.0%) | 0.0 |
| Bachelor's Degree | 0 (0.0%) | 0.0 |
| Graduate Degree | 0 (0.0%) | 0.0 |
| Total | 0 (0.0%) | 0.0 |
Fertility by Education by Marriage Status in Branchville borough
| Educational Attainment | Married | Unmarried |
| Less than High School | 0 (0.0%) | 0 (0.0%) |
| High School Diploma | 0 (0.0%) | 0 (0.0%) |
| College or Associate's Degree | 0 (0.0%) | 0 (0.0%) |
| Bachelor's Degree | 0 (0.0%) | 0 (0.0%) |
| Graduate Degree | 0 (0.0%) | 0 (0.0%) |
| Total | 0 (0.0%) | 0 (0.0%) |
Income in Branchville borough
Income Overview in Branchville borough
Per Capita Income in Branchville borough is $43,019, while median incomes of families and households are $125,500 and $118,125 respectively.
| Characteristic | Number | Measure |
| Per Capita Income | 708 | $43,019 |
| Median Family Income | 214 | $125,500 |
| Mean Family Income | 214 | $109,938 |
| Median Household Income | 297 | $118,125 |
| Mean Household Income | 297 | $97,806 |
| Income Deficit | 214 | $0 |
| Wage / Income Gap (%) | 708 | 4.36% |
| Wage / Income Gap ($) | 708 | 95.64¢ per $1 |
| Gini / Inequality Index | 708 | 0.29 |
Earnings by Sex in Branchville borough
Average Earnings in Branchville borough are $48,025, $47,925 for men and $50,109 for women, a difference of 4.4%.
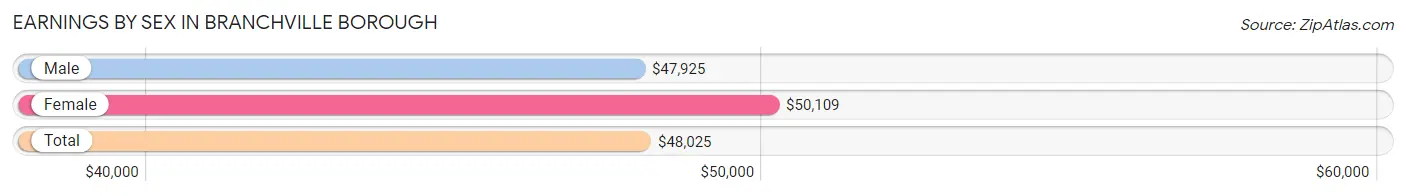
| Sex | Number | Average Earnings |
| Male | 279 (57.8%) | $47,925 |
| Female | 204 (42.2%) | $50,109 |
| Total | 483 (100.0%) | $48,025 |
Earnings by Sex by Income Bracket in Branchville borough
The most common earnings brackets in Branchville borough are $25,000 to $29,999 for men (85 | 30.5%) and $50,000 to $54,999 for women (46 | 22.6%).
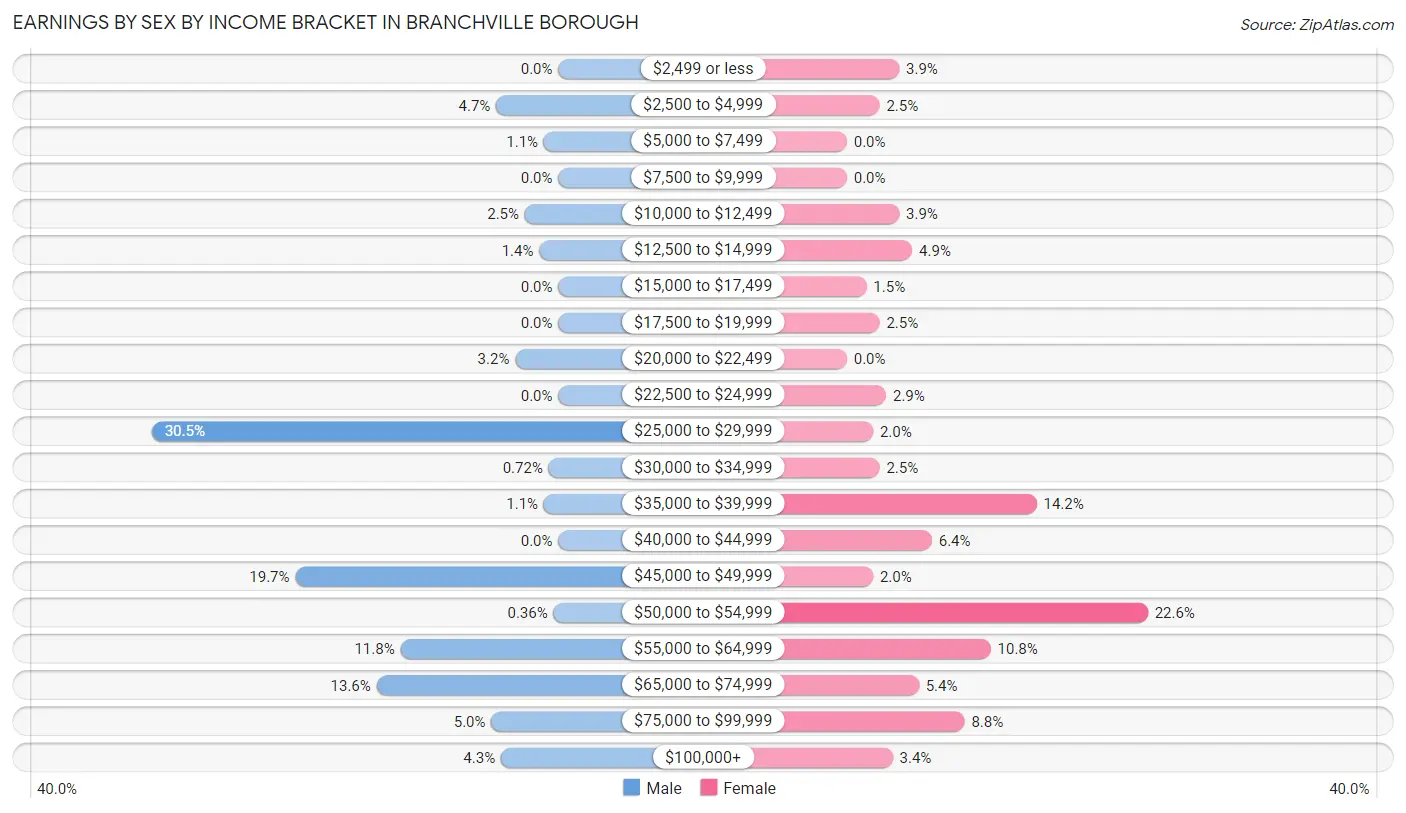
| Income | Male | Female |
| $2,499 or less | 0 (0.0%) | 8 (3.9%) |
| $2,500 to $4,999 | 13 (4.7%) | 5 (2.5%) |
| $5,000 to $7,499 | 3 (1.1%) | 0 (0.0%) |
| $7,500 to $9,999 | 0 (0.0%) | 0 (0.0%) |
| $10,000 to $12,499 | 7 (2.5%) | 8 (3.9%) |
| $12,500 to $14,999 | 4 (1.4%) | 10 (4.9%) |
| $15,000 to $17,499 | 0 (0.0%) | 3 (1.5%) |
| $17,500 to $19,999 | 0 (0.0%) | 5 (2.5%) |
| $20,000 to $22,499 | 9 (3.2%) | 0 (0.0%) |
| $22,500 to $24,999 | 0 (0.0%) | 6 (2.9%) |
| $25,000 to $29,999 | 85 (30.5%) | 4 (2.0%) |
| $30,000 to $34,999 | 2 (0.7%) | 5 (2.5%) |
| $35,000 to $39,999 | 3 (1.1%) | 29 (14.2%) |
| $40,000 to $44,999 | 0 (0.0%) | 13 (6.4%) |
| $45,000 to $49,999 | 55 (19.7%) | 4 (2.0%) |
| $50,000 to $54,999 | 1 (0.4%) | 46 (22.6%) |
| $55,000 to $64,999 | 33 (11.8%) | 22 (10.8%) |
| $65,000 to $74,999 | 38 (13.6%) | 11 (5.4%) |
| $75,000 to $99,999 | 14 (5.0%) | 18 (8.8%) |
| $100,000+ | 12 (4.3%) | 7 (3.4%) |
| Total | 279 (100.0%) | 204 (100.0%) |
Earnings by Sex by Educational Attainment in Branchville borough
Average earnings in Branchville borough are $49,925 for men and $50,435 for women, a difference of 1.0%. Men with an educational attainment of college or associate's degree enjoy the highest average annual earnings of $67,917, while those with high school diploma education earn the least with $48,500. Women with an educational attainment of graduate degree earn the most with the average annual earnings of $89,000, while those with bachelor's degree education have the smallest earnings of $38,529.
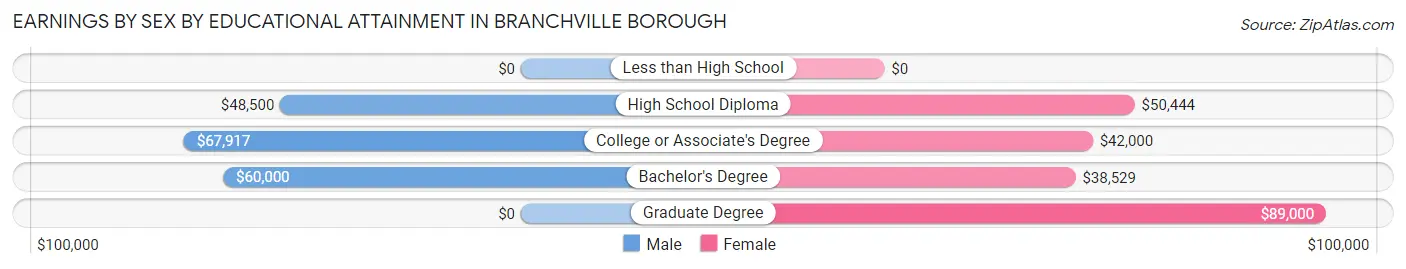
| Educational Attainment | Male Income | Female Income |
| Less than High School | - | - |
| High School Diploma | $48,500 | $50,444 |
| College or Associate's Degree | $67,917 | $42,000 |
| Bachelor's Degree | $60,000 | $38,529 |
| Graduate Degree | - | - |
| Total | $49,925 | $50,435 |
Family Income in Branchville borough
Family Income Brackets in Branchville borough
According to the Branchville borough family income data, there are 125 families falling into the $100,000 to $149,999 income range, which is the most common income bracket and makes up 58.4% of all families.
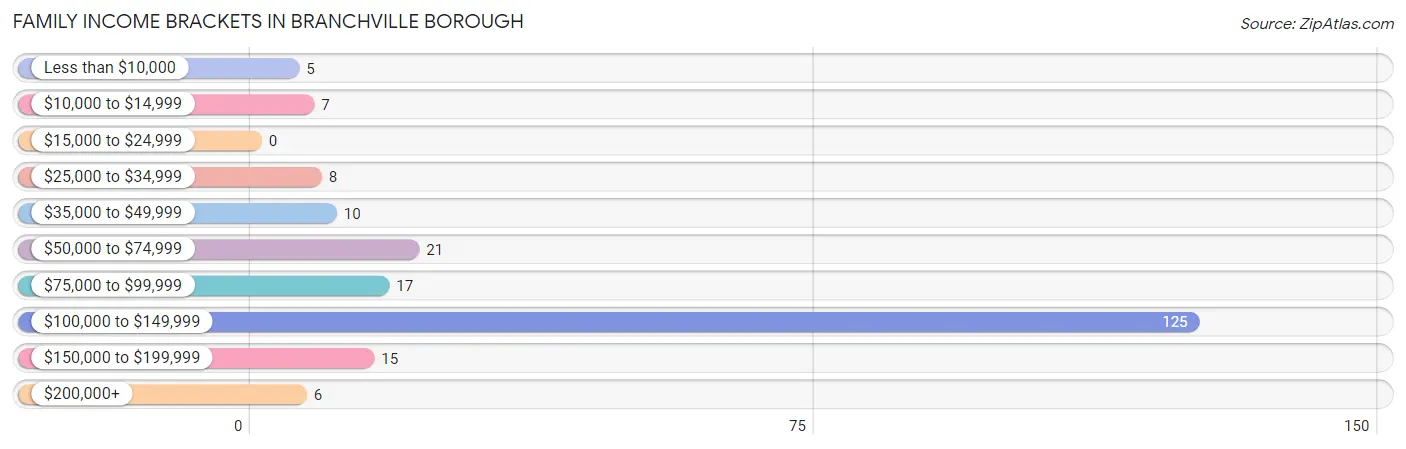
| Income Bracket | # Families | % Families |
| Less than $10,000 | 5 | 2.3% |
| $10,000 to $14,999 | 7 | 3.3% |
| $15,000 to $24,999 | 0 | 0.0% |
| $25,000 to $34,999 | 8 | 3.7% |
| $35,000 to $49,999 | 10 | 4.7% |
| $50,000 to $74,999 | 21 | 9.8% |
| $75,000 to $99,999 | 17 | 7.9% |
| $100,000 to $149,999 | 125 | 58.4% |
| $150,000 to $199,999 | 15 | 7.0% |
| $200,000+ | 6 | 2.8% |
Family Income by Famaliy Size in Branchville borough
4-person families (12 | 5.6%) account for the highest median family income in Branchville borough with $173,750 per family, while 2-person families (117 | 54.7%) have the highest median income of $59,688 per family member.
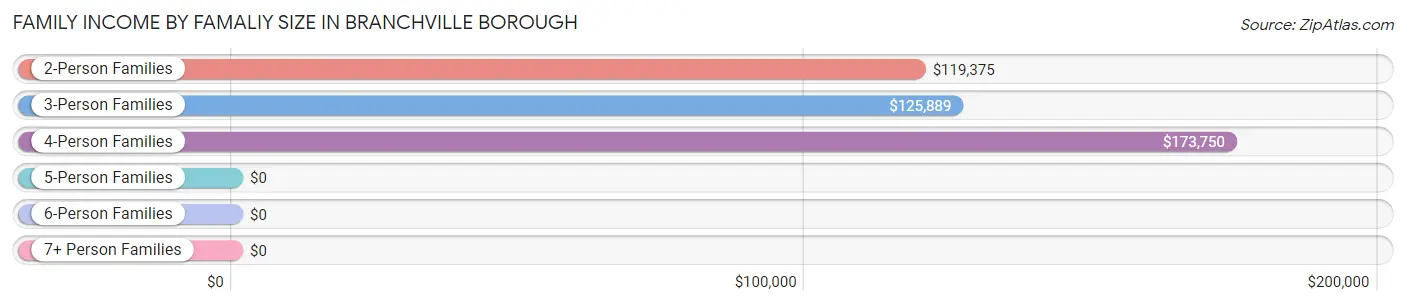
| Income Bracket | # Families | Median Income |
| 2-Person Families | 117 (54.7%) | $119,375 |
| 3-Person Families | 78 (36.4%) | $125,889 |
| 4-Person Families | 12 (5.6%) | $173,750 |
| 5-Person Families | 7 (3.3%) | $0 |
| 6-Person Families | 0 (0.0%) | $0 |
| 7+ Person Families | 0 (0.0%) | $0 |
| Total | 214 (100.0%) | $125,500 |
Family Income by Number of Earners in Branchville borough
The median family income in Branchville borough is $125,500, with families comprising 2 earners (62) having the highest median family income of $133,977, while families with no earners (39) have the lowest median family income of $77,813, accounting for 29.0% and 18.2% of families, respectively.
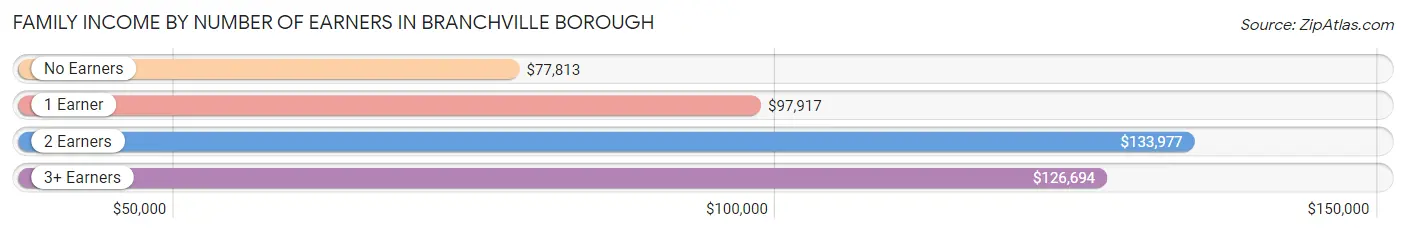
| Number of Earners | # Families | Median Income |
| No Earners | 39 (18.2%) | $77,813 |
| 1 Earner | 52 (24.3%) | $97,917 |
| 2 Earners | 62 (29.0%) | $133,977 |
| 3+ Earners | 61 (28.5%) | $126,694 |
| Total | 214 (100.0%) | $125,500 |
Household Income in Branchville borough
Household Income Brackets in Branchville borough
With 133 households falling in the category, the $100,000 to $149,999 income range is the most frequent in Branchville borough, accounting for 44.8% of all households. In contrast, only 3 households (1.0%) fall into the $15,000 to $24,999 income bracket, making it the least populous group.
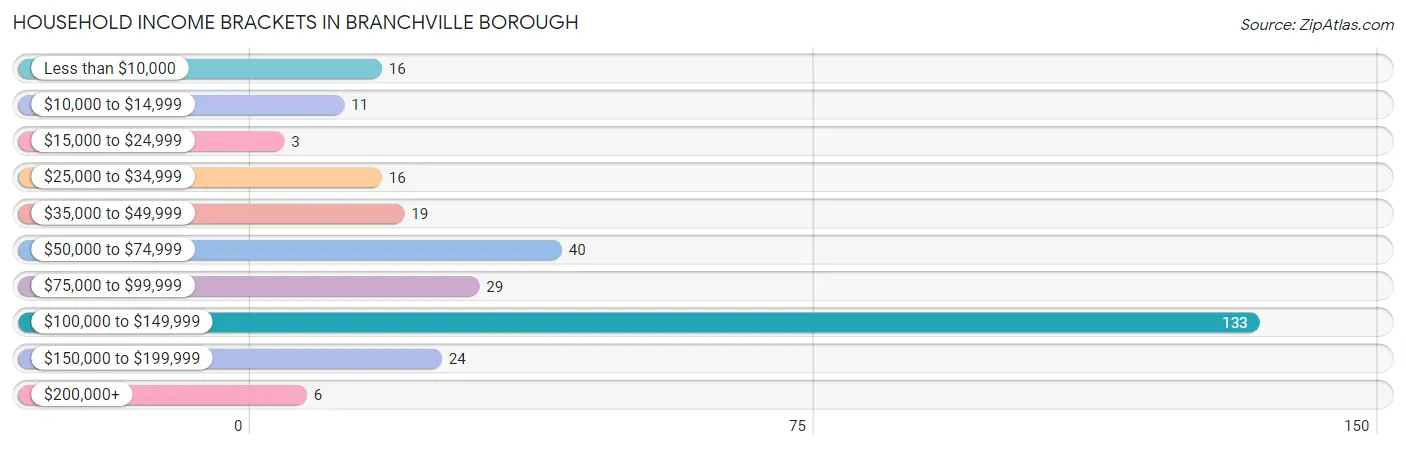
| Income Bracket | # Households | % Households |
| Less than $10,000 | 16 | 5.4% |
| $10,000 to $14,999 | 11 | 3.7% |
| $15,000 to $24,999 | 3 | 1.0% |
| $25,000 to $34,999 | 16 | 5.4% |
| $35,000 to $49,999 | 19 | 6.4% |
| $50,000 to $74,999 | 40 | 13.5% |
| $75,000 to $99,999 | 29 | 9.8% |
| $100,000 to $149,999 | 133 | 44.8% |
| $150,000 to $199,999 | 24 | 8.1% |
| $200,000+ | 6 | 2.0% |
Household Income by Householder Age in Branchville borough
The median household income in Branchville borough is $118,125, with the highest median household income of $125,278 found in the 45 to 64 years age bracket for the primary householder. A total of 140 households (47.1%) fall into this category.
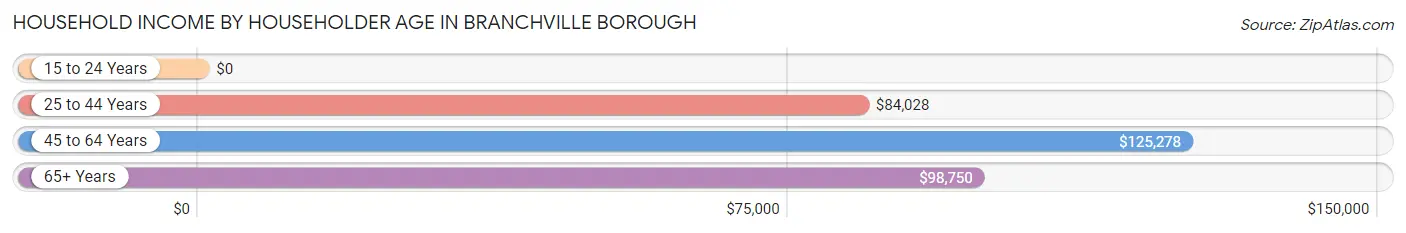
| Income Bracket | # Households | Median Income |
| 15 to 24 Years | 0 (0.0%) | $0 |
| 25 to 44 Years | 55 (18.5%) | $84,028 |
| 45 to 64 Years | 140 (47.1%) | $125,278 |
| 65+ Years | 102 (34.3%) | $98,750 |
| Total | 297 (100.0%) | $118,125 |
Poverty in Branchville borough
Income Below Poverty by Sex and Age in Branchville borough
With 8.5% poverty level for males and 5.4% for females among the residents of Branchville borough, 15 year old males and 65 to 74 year old females are the most vulnerable to poverty, with 2 males (100.0%) and 10 females (21.7%) in their respective age groups living below the poverty level.
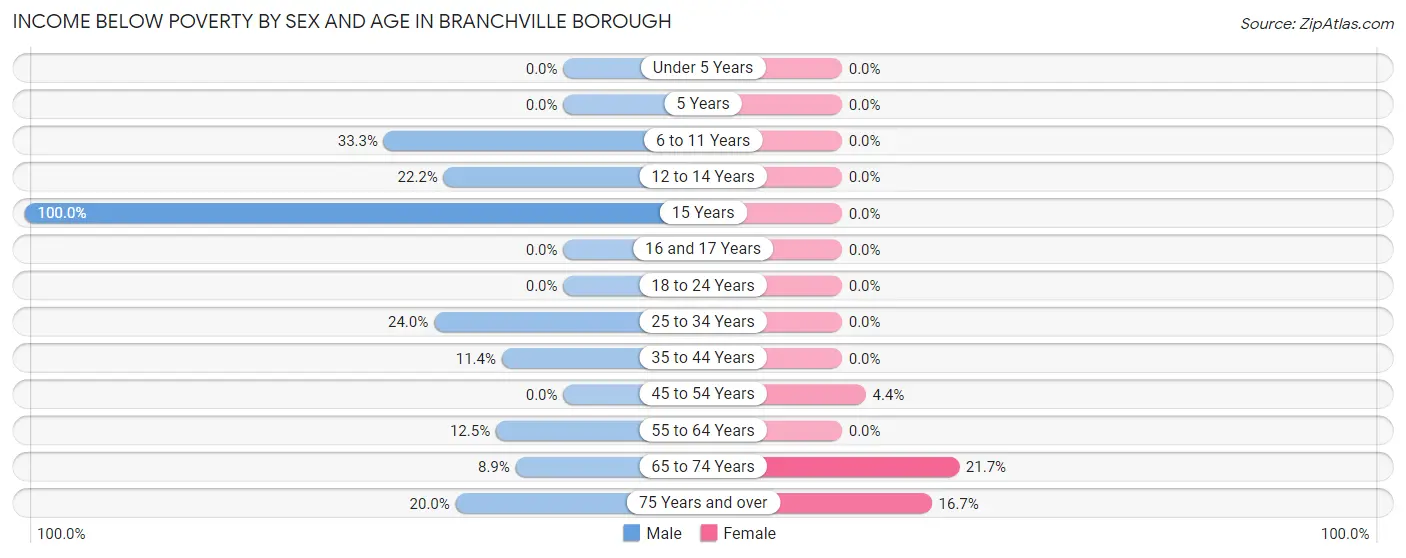
| Age Bracket | Male | Female |
| Under 5 Years | 0 (0.0%) | 0 (0.0%) |
| 5 Years | 0 (0.0%) | 0 (0.0%) |
| 6 to 11 Years | 2 (33.3%) | 0 (0.0%) |
| 12 to 14 Years | 2 (22.2%) | 0 (0.0%) |
| 15 Years | 2 (100.0%) | 0 (0.0%) |
| 16 and 17 Years | 0 (0.0%) | 0 (0.0%) |
| 18 to 24 Years | 0 (0.0%) | 0 (0.0%) |
| 25 to 34 Years | 6 (24.0%) | 0 (0.0%) |
| 35 to 44 Years | 4 (11.4%) | 0 (0.0%) |
| 45 to 54 Years | 0 (0.0%) | 3 (4.4%) |
| 55 to 64 Years | 5 (12.5%) | 0 (0.0%) |
| 65 to 74 Years | 7 (8.9%) | 10 (21.7%) |
| 75 Years and over | 7 (20.0%) | 3 (16.7%) |
| Total | 35 (8.5%) | 16 (5.4%) |
Income Above Poverty by Sex and Age in Branchville borough
According to the poverty statistics in Branchville borough, males aged under 5 years and females aged under 5 years are the age groups that are most secure financially, with 100.0% of males and 100.0% of females in these age groups living above the poverty line.
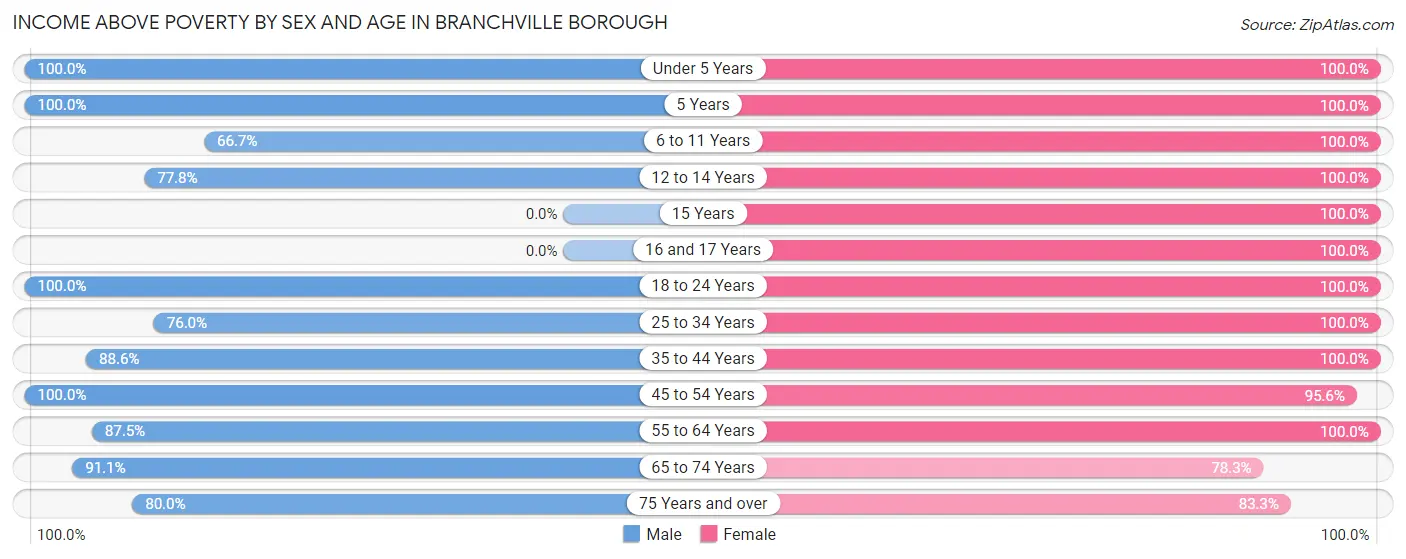
| Age Bracket | Male | Female |
| Under 5 Years | 3 (100.0%) | 7 (100.0%) |
| 5 Years | 2 (100.0%) | 6 (100.0%) |
| 6 to 11 Years | 4 (66.7%) | 5 (100.0%) |
| 12 to 14 Years | 7 (77.8%) | 2 (100.0%) |
| 15 Years | 0 (0.0%) | 5 (100.0%) |
| 16 and 17 Years | 0 (0.0%) | 6 (100.0%) |
| 18 to 24 Years | 91 (100.0%) | 21 (100.0%) |
| 25 to 34 Years | 19 (76.0%) | 18 (100.0%) |
| 35 to 44 Years | 31 (88.6%) | 31 (100.0%) |
| 45 to 54 Years | 84 (100.0%) | 65 (95.6%) |
| 55 to 64 Years | 35 (87.5%) | 64 (100.0%) |
| 65 to 74 Years | 72 (91.1%) | 36 (78.3%) |
| 75 Years and over | 28 (80.0%) | 15 (83.3%) |
| Total | 376 (91.5%) | 281 (94.6%) |
Income Below Poverty Among Married-Couple Families in Branchville borough
The poverty statistics for married-couple families in Branchville borough show that 3.8% or 7 of the total 183 families live below the poverty line. Families with no children have the highest poverty rate of 4.4%, comprising of 7 families. On the other hand, families with 1 or 2 children have the lowest poverty rate of 0.0%, which includes 0 families.
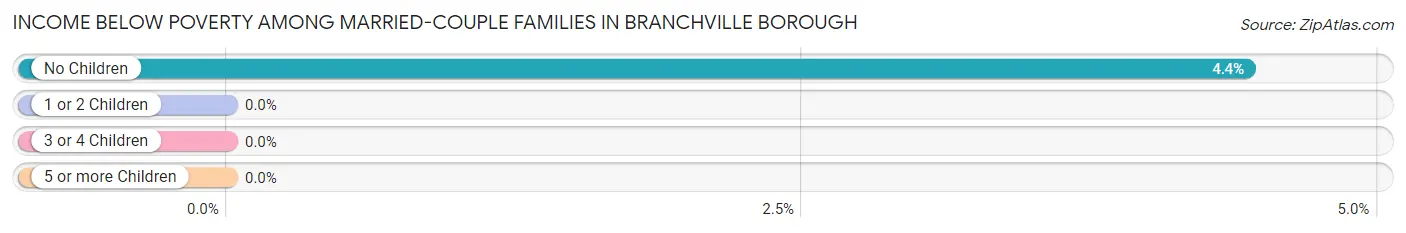
| Children | Above Poverty | Below Poverty |
| No Children | 151 (95.6%) | 7 (4.4%) |
| 1 or 2 Children | 24 (100.0%) | 0 (0.0%) |
| 3 or 4 Children | 1 (100.0%) | 0 (0.0%) |
| 5 or more Children | 0 (0.0%) | 0 (0.0%) |
| Total | 176 (96.2%) | 7 (3.8%) |
Income Below Poverty Among Single-Parent Households in Branchville borough
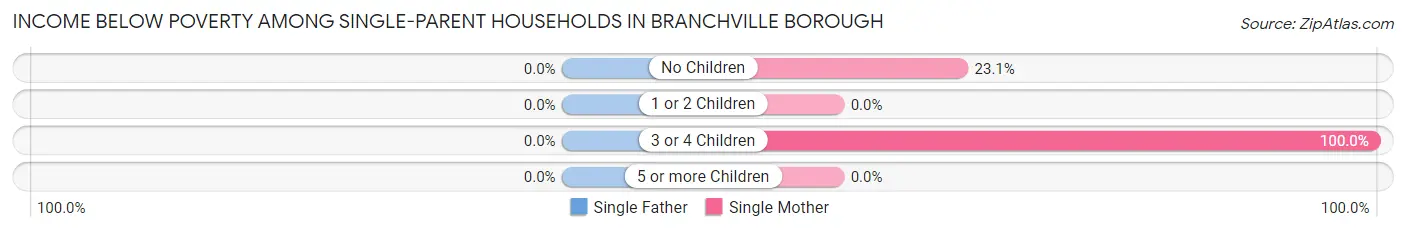
| Children | Single Father | Single Mother |
| No Children | 0 (0.0%) | 3 (23.1%) |
| 1 or 2 Children | 0 (0.0%) | 0 (0.0%) |
| 3 or 4 Children | 0 (0.0%) | 2 (100.0%) |
| 5 or more Children | 0 (0.0%) | 0 (0.0%) |
| Total | 0 (0.0%) | 5 (16.1%) |
Income Below Poverty Among Married-Couple vs Single-Parent Households in Branchville borough
The poverty data for Branchville borough shows that 7 of the married-couple family households (3.8%) and 5 of the single-parent households (16.1%) are living below the poverty level. Within the married-couple family households, those with no children have the highest poverty rate, with 7 households (4.4%) falling below the poverty line. Among the single-parent households, those with 3 or 4 children have the highest poverty rate, with 2 household (100.0%) living below poverty.
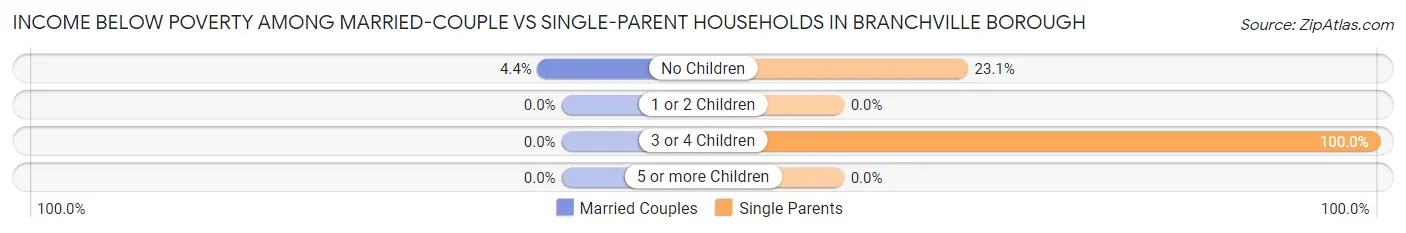
| Children | Married-Couple Families | Single-Parent Households |
| No Children | 7 (4.4%) | 3 (23.1%) |
| 1 or 2 Children | 0 (0.0%) | 0 (0.0%) |
| 3 or 4 Children | 0 (0.0%) | 2 (100.0%) |
| 5 or more Children | 0 (0.0%) | 0 (0.0%) |
| Total | 7 (3.8%) | 5 (16.1%) |
Employment Characteristics in Branchville borough
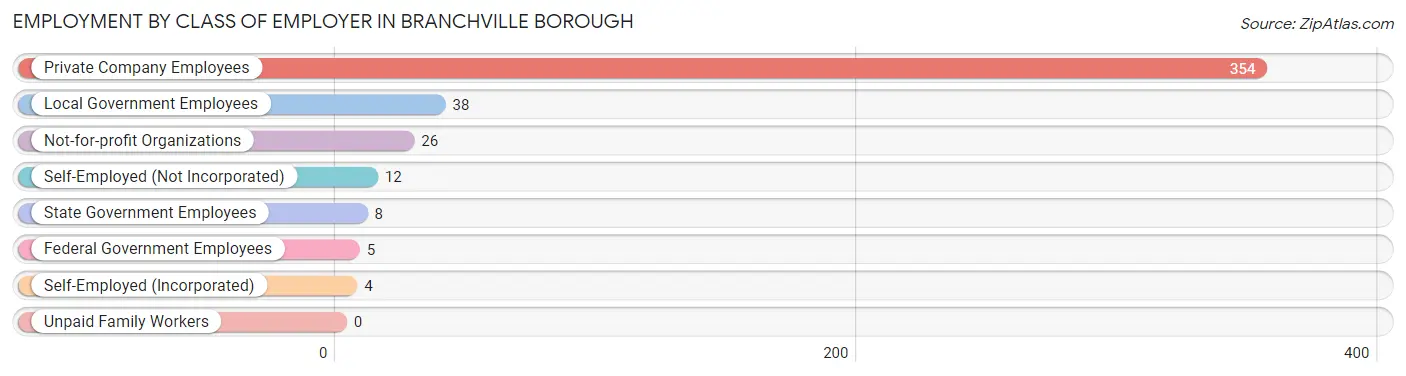
Employment by Class of Employer in Branchville borough
Among the 447 employed individuals in Branchville borough, private company employees (354 | 79.2%), local government employees (38 | 8.5%), and not-for-profit organizations (26 | 5.8%) make up the most common classes of employment.
| Employer Class | # Employees | % Employees |
| Private Company Employees | 354 | 79.2% |
| Self-Employed (Incorporated) | 4 | 0.9% |
| Self-Employed (Not Incorporated) | 12 | 2.7% |
| Not-for-profit Organizations | 26 | 5.8% |
| Local Government Employees | 38 | 8.5% |
| State Government Employees | 8 | 1.8% |
| Federal Government Employees | 5 | 1.1% |
| Unpaid Family Workers | 0 | 0.0% |
| Total | 447 | 100.0% |
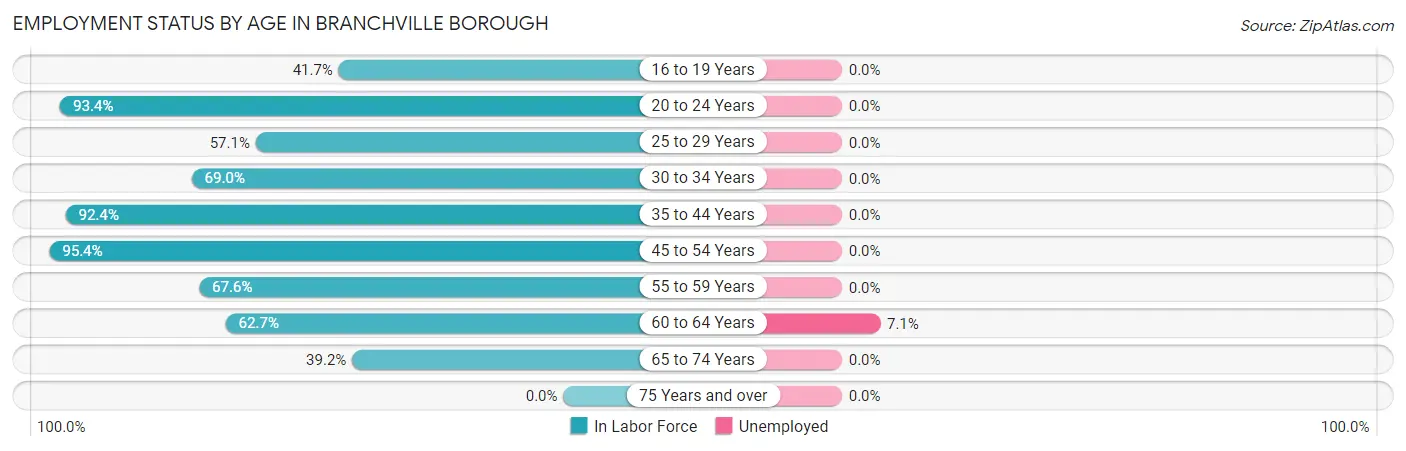
Employment Status by Age in Branchville borough
According to the labor force statistics for Branchville borough, out of the total population over 16 years of age (661), 68.7% or 454 individuals are in the labor force, with 0.7% or 3 of them unemployed. The age group with the highest labor force participation rate is 45 to 54 years, with 95.4% or 145 individuals in the labor force. Within the labor force, the 60 to 64 years age range has the highest percentage of unemployed individuals, with 7.1% or 3 of them being unemployed.
| Age Bracket | In Labor Force | Unemployed |
| 16 to 19 Years | 5 (41.7%) | 0 (0.0%) |
| 20 to 24 Years | 99 (93.4%) | 0 (0.0%) |
| 25 to 29 Years | 8 (57.1%) | 0 (0.0%) |
| 30 to 34 Years | 20 (69.0%) | 0 (0.0%) |
| 35 to 44 Years | 61 (92.4%) | 0 (0.0%) |
| 45 to 54 Years | 145 (95.4%) | 0 (0.0%) |
| 55 to 59 Years | 25 (67.6%) | 0 (0.0%) |
| 60 to 64 Years | 42 (62.7%) | 3 (7.1%) |
| 65 to 74 Years | 49 (39.2%) | 0 (0.0%) |
| 75 Years and over | 0 (0.0%) | 0 (0.0%) |
| Total | 454 (68.7%) | 3 (0.7%) |
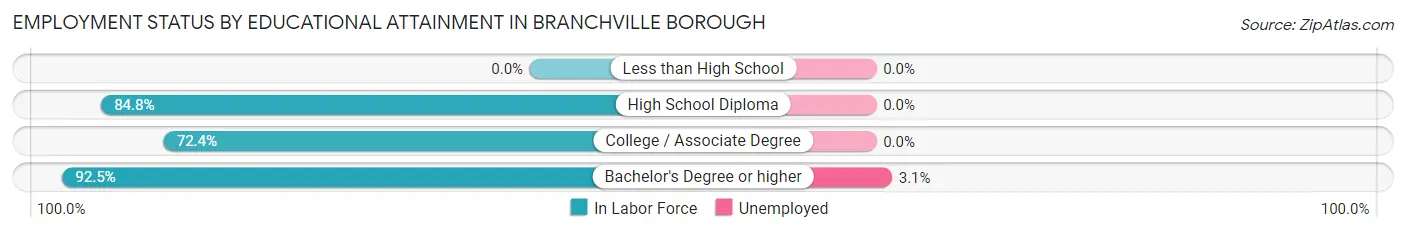
Employment Status by Educational Attainment in Branchville borough
According to labor force statistics for Branchville borough, 82.5% of individuals (301) out of the total population between 25 and 64 years of age (365) are in the labor force, with 1.0% or 3 of them being unemployed. The group with the highest labor force participation rate are those with the educational attainment of bachelor's degree or higher, with 92.5% or 98 individuals in the labor force. Within the labor force, individuals with bachelor's degree or higher education have the highest percentage of unemployment, with 3.1% or 3 of them being unemployed.
| Educational Attainment | In Labor Force | Unemployed |
| Less than High School | 0 (0.0%) | 0 (0.0%) |
| High School Diploma | 140 (84.8%) | 0 (0.0%) |
| College / Associate Degree | 63 (72.4%) | 0 (0.0%) |
| Bachelor's Degree or higher | 98 (92.5%) | 3 (3.1%) |
| Total | 301 (82.5%) | 4 (1.0%) |
Employment Occupations by Sex in Branchville borough
Management, Business, Science and Arts Occupations
The most common Management, Business, Science and Arts occupations in Branchville borough are Health Diagnosing & Treating (42 | 9.3%), Community & Social Service (41 | 9.1%), Management (24 | 5.3%), Education Instruction & Library (21 | 4.7%), and Business & Financial (15 | 3.3%).
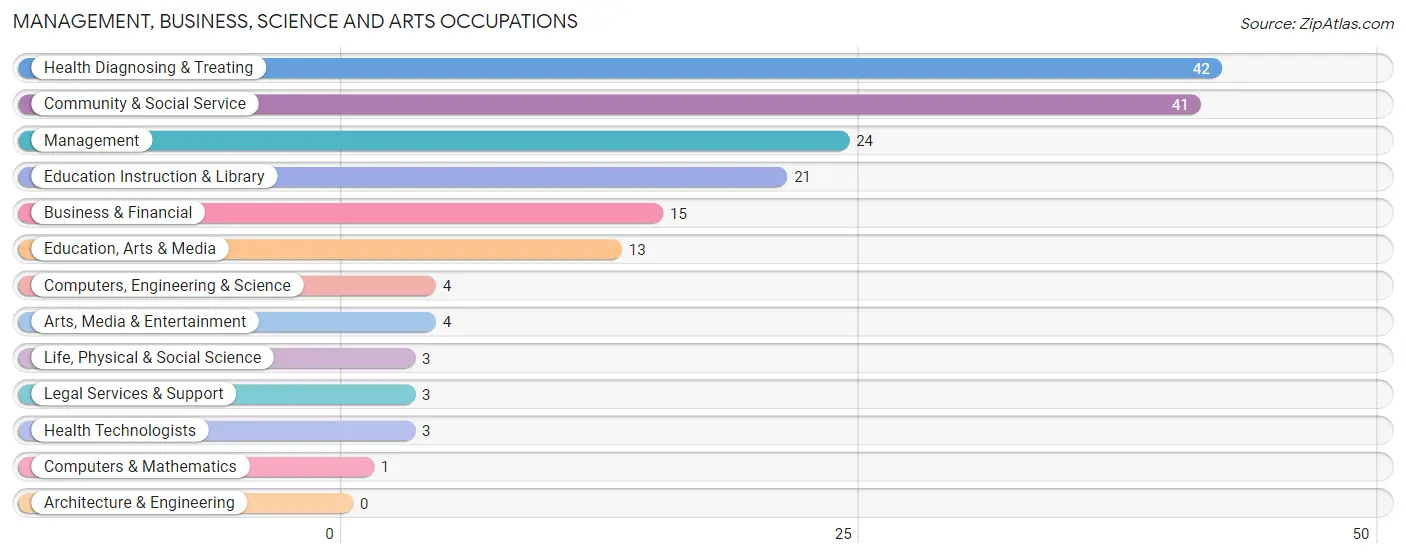
Management, Business, Science and Arts Occupations by Sex
Within the Management, Business, Science and Arts occupations in Branchville borough, the most male-oriented occupations are Computers, Engineering & Science (100.0%), Computers & Mathematics (100.0%), and Life, Physical & Social Science (100.0%), while the most female-oriented occupations are Business & Financial (100.0%), Legal Services & Support (100.0%), and Education Instruction & Library (100.0%).
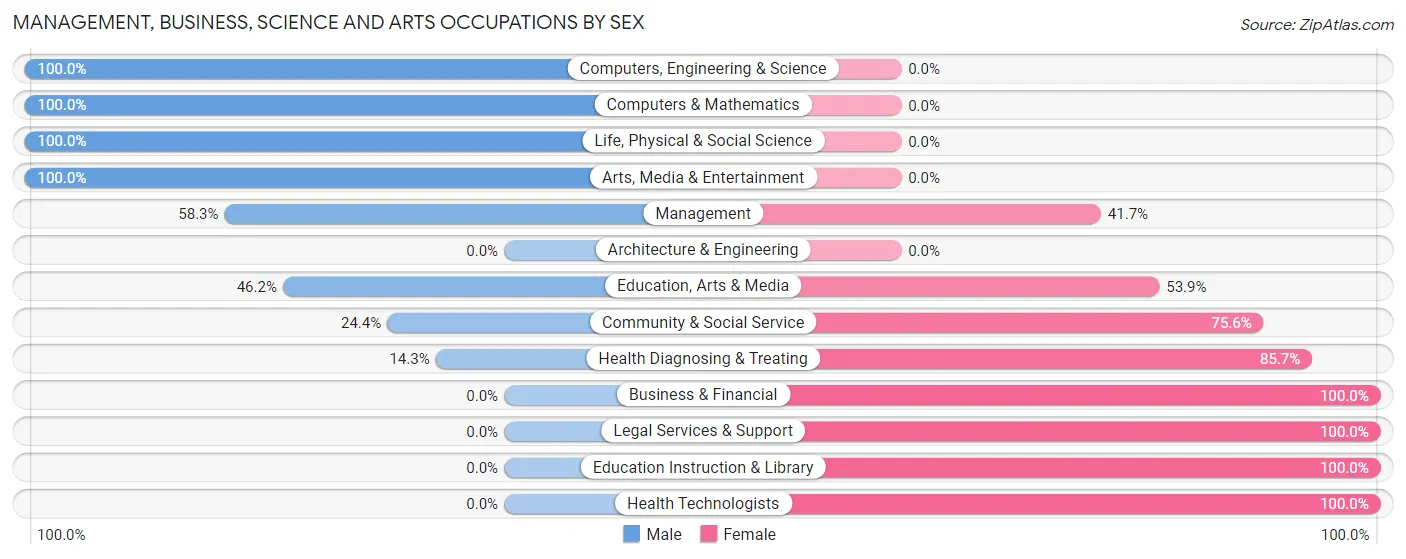
| Occupation | Male | Female |
| Management | 14 (58.3%) | 10 (41.7%) |
| Business & Financial | 0 (0.0%) | 15 (100.0%) |
| Computers, Engineering & Science | 4 (100.0%) | 0 (0.0%) |
| Computers & Mathematics | 1 (100.0%) | 0 (0.0%) |
| Architecture & Engineering | 0 (0.0%) | 0 (0.0%) |
| Life, Physical & Social Science | 3 (100.0%) | 0 (0.0%) |
| Community & Social Service | 10 (24.4%) | 31 (75.6%) |
| Education, Arts & Media | 6 (46.2%) | 7 (53.8%) |
| Legal Services & Support | 0 (0.0%) | 3 (100.0%) |
| Education Instruction & Library | 0 (0.0%) | 21 (100.0%) |
| Arts, Media & Entertainment | 4 (100.0%) | 0 (0.0%) |
| Health Diagnosing & Treating | 6 (14.3%) | 36 (85.7%) |
| Health Technologists | 0 (0.0%) | 3 (100.0%) |
| Total (Category) | 34 (27.0%) | 92 (73.0%) |
| Total (Overall) | 268 (59.4%) | 183 (40.6%) |
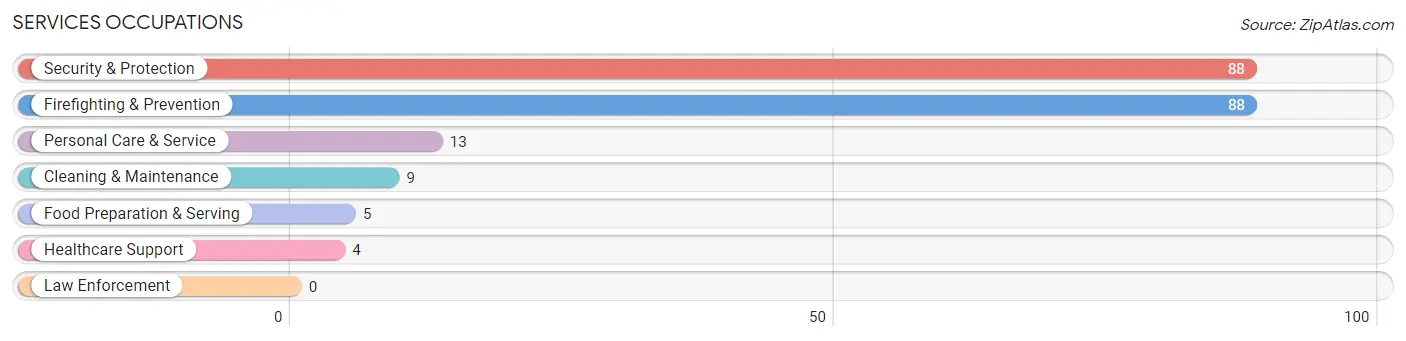
Services Occupations
The most common Services occupations in Branchville borough are Security & Protection (88 | 19.5%), Firefighting & Prevention (88 | 19.5%), Personal Care & Service (13 | 2.9%), Cleaning & Maintenance (9 | 2.0%), and Food Preparation & Serving (5 | 1.1%).
Services Occupations by Sex
Within the Services occupations in Branchville borough, the most male-oriented occupations are Security & Protection (100.0%), Firefighting & Prevention (100.0%), and Cleaning & Maintenance (100.0%), while the most female-oriented occupations are Healthcare Support (100.0%), Food Preparation & Serving (100.0%), and Personal Care & Service (46.2%).
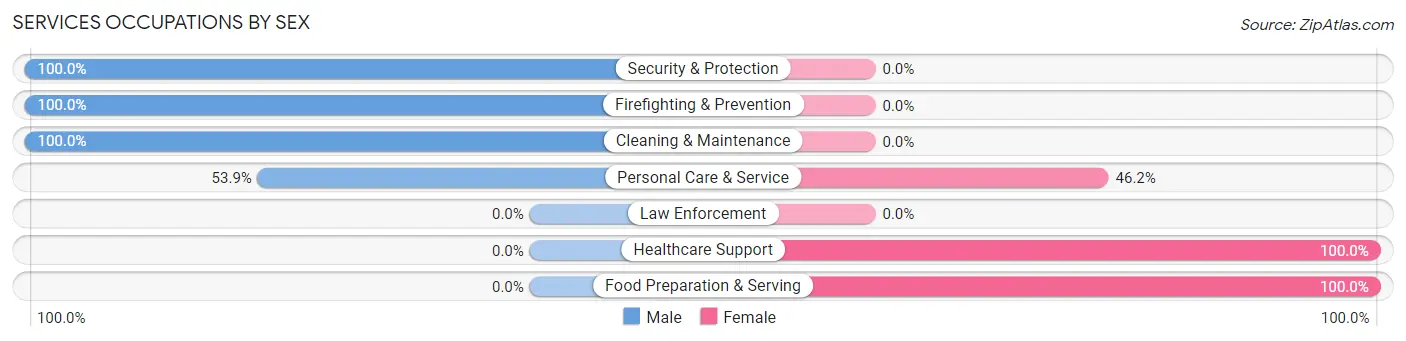
| Occupation | Male | Female |
| Healthcare Support | 0 (0.0%) | 4 (100.0%) |
| Security & Protection | 88 (100.0%) | 0 (0.0%) |
| Firefighting & Prevention | 88 (100.0%) | 0 (0.0%) |
| Law Enforcement | 0 (0.0%) | 0 (0.0%) |
| Food Preparation & Serving | 0 (0.0%) | 5 (100.0%) |
| Cleaning & Maintenance | 9 (100.0%) | 0 (0.0%) |
| Personal Care & Service | 7 (53.8%) | 6 (46.2%) |
| Total (Category) | 104 (87.4%) | 15 (12.6%) |
| Total (Overall) | 268 (59.4%) | 183 (40.6%) |
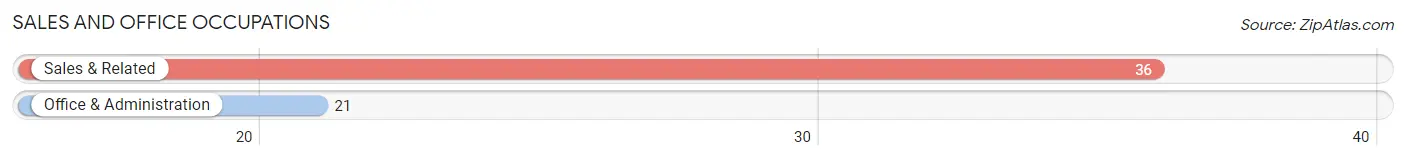
Sales and Office Occupations
The most common Sales and Office occupations in Branchville borough are Sales & Related (36 | 8.0%), and Office & Administration (21 | 4.7%).
Sales and Office Occupations by Sex

| Occupation | Male | Female |
| Sales & Related | 32 (88.9%) | 4 (11.1%) |
| Office & Administration | 8 (38.1%) | 13 (61.9%) |
| Total (Category) | 40 (70.2%) | 17 (29.8%) |
| Total (Overall) | 268 (59.4%) | 183 (40.6%) |
Natural Resources, Construction and Maintenance Occupations
The most common Natural Resources, Construction and Maintenance occupations in Branchville borough are Installation, Maintenance & Repair (56 | 12.4%), and Construction & Extraction (10 | 2.2%).
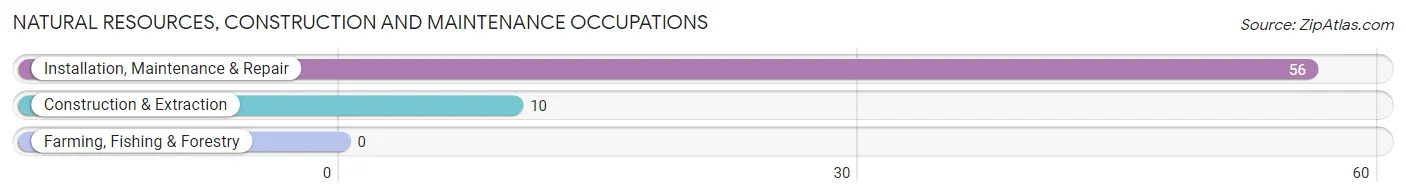
Natural Resources, Construction and Maintenance Occupations by Sex

| Occupation | Male | Female |
| Farming, Fishing & Forestry | 0 (0.0%) | 0 (0.0%) |
| Construction & Extraction | 10 (100.0%) | 0 (0.0%) |
| Installation, Maintenance & Repair | 56 (100.0%) | 0 (0.0%) |
| Total (Category) | 66 (100.0%) | 0 (0.0%) |
| Total (Overall) | 268 (59.4%) | 183 (40.6%) |
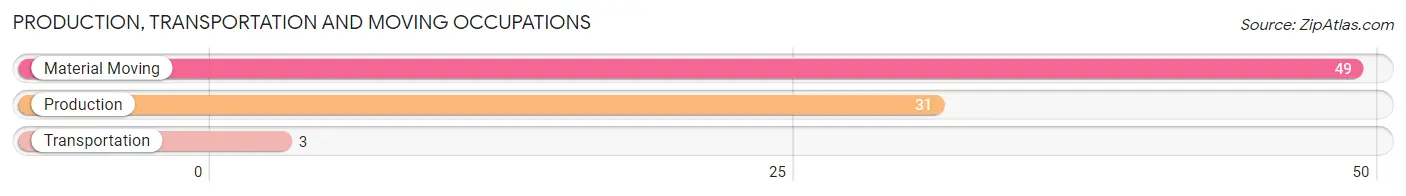
Production, Transportation and Moving Occupations
The most common Production, Transportation and Moving occupations in Branchville borough are Material Moving (49 | 10.9%), Production (31 | 6.9%), and Transportation (3 | 0.7%).
Production, Transportation and Moving Occupations by Sex
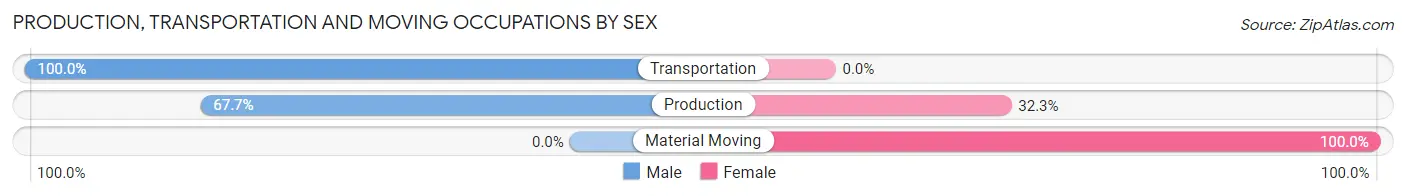
| Occupation | Male | Female |
| Production | 21 (67.7%) | 10 (32.3%) |
| Transportation | 3 (100.0%) | 0 (0.0%) |
| Material Moving | 0 (0.0%) | 49 (100.0%) |
| Total (Category) | 24 (28.9%) | 59 (71.1%) |
| Total (Overall) | 268 (59.4%) | 183 (40.6%) |
Employment Industries by Sex in Branchville borough
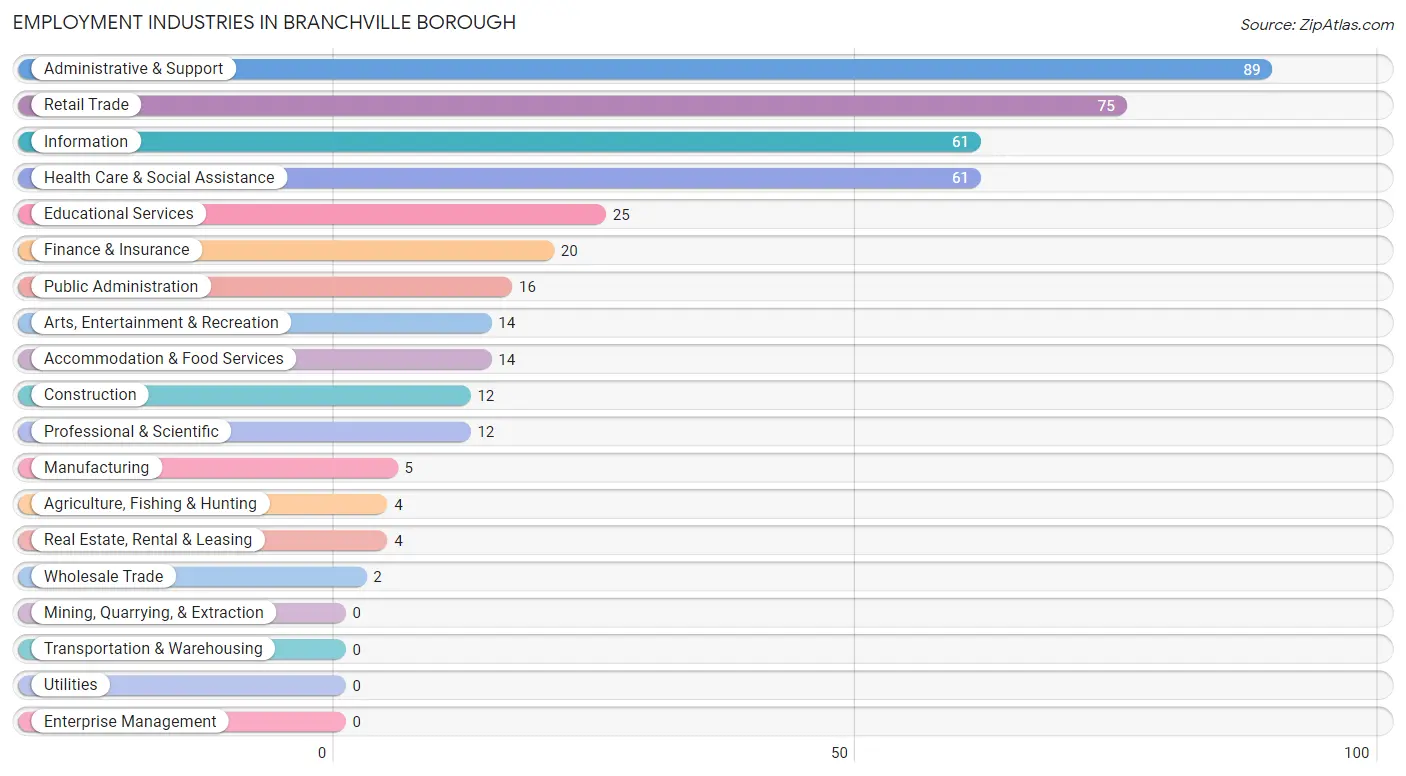
Employment Industries in Branchville borough
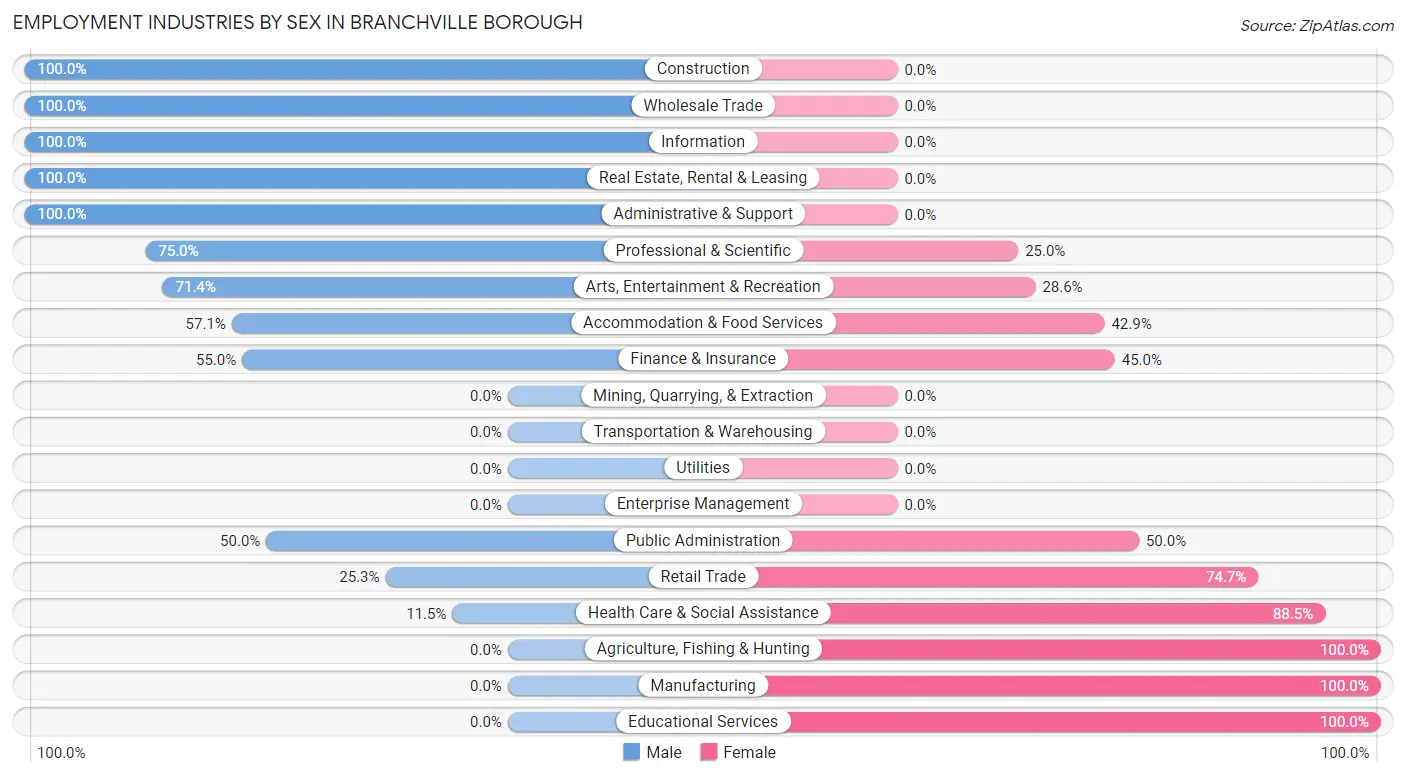
The major employment industries in Branchville borough include Administrative & Support (89 | 19.7%), Retail Trade (75 | 16.6%), Information (61 | 13.5%), Health Care & Social Assistance (61 | 13.5%), and Educational Services (25 | 5.5%).
Employment Industries by Sex in Branchville borough
The Branchville borough industries that see more men than women are Construction (100.0%), Wholesale Trade (100.0%), and Information (100.0%), whereas the industries that tend to have a higher number of women are Agriculture, Fishing & Hunting (100.0%), Manufacturing (100.0%), and Educational Services (100.0%).
| Industry | Male | Female |
| Agriculture, Fishing & Hunting | 0 (0.0%) | 4 (100.0%) |
| Mining, Quarrying, & Extraction | 0 (0.0%) | 0 (0.0%) |
| Construction | 12 (100.0%) | 0 (0.0%) |
| Manufacturing | 0 (0.0%) | 5 (100.0%) |
| Wholesale Trade | 2 (100.0%) | 0 (0.0%) |
| Retail Trade | 19 (25.3%) | 56 (74.7%) |
| Transportation & Warehousing | 0 (0.0%) | 0 (0.0%) |
| Utilities | 0 (0.0%) | 0 (0.0%) |
| Information | 61 (100.0%) | 0 (0.0%) |
| Finance & Insurance | 11 (55.0%) | 9 (45.0%) |
| Real Estate, Rental & Leasing | 4 (100.0%) | 0 (0.0%) |
| Professional & Scientific | 9 (75.0%) | 3 (25.0%) |
| Enterprise Management | 0 (0.0%) | 0 (0.0%) |
| Administrative & Support | 89 (100.0%) | 0 (0.0%) |
| Educational Services | 0 (0.0%) | 25 (100.0%) |
| Health Care & Social Assistance | 7 (11.5%) | 54 (88.5%) |
| Arts, Entertainment & Recreation | 10 (71.4%) | 4 (28.6%) |
| Accommodation & Food Services | 8 (57.1%) | 6 (42.9%) |
| Public Administration | 8 (50.0%) | 8 (50.0%) |
| Total | 268 (59.4%) | 183 (40.6%) |
Education in Branchville borough
School Enrollment in Branchville borough
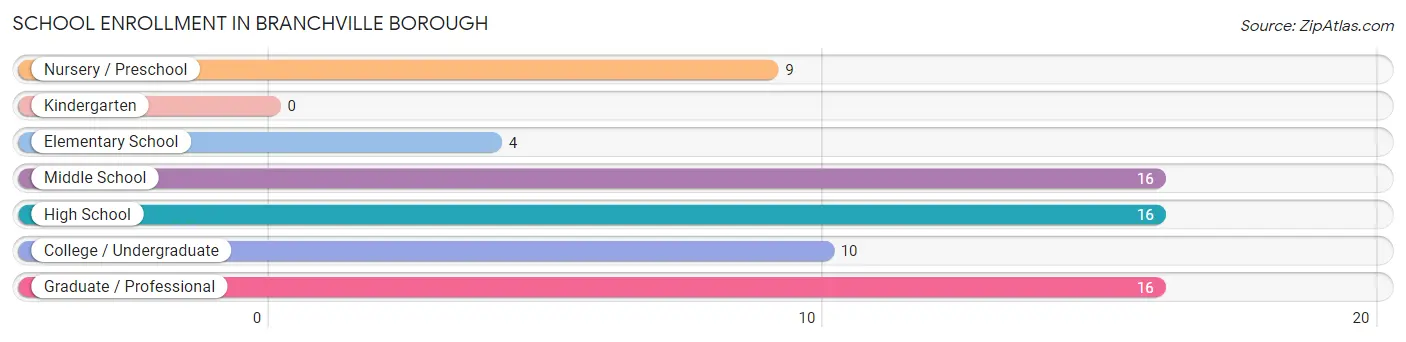
The most common levels of schooling among the 71 students in Branchville borough are middle school (16 | 22.5%), high school (16 | 22.5%), and graduate / professional (16 | 22.5%).
| School Level | # Students | % Students |
| Nursery / Preschool | 9 | 12.7% |
| Kindergarten | 0 | 0.0% |
| Elementary School | 4 | 5.6% |
| Middle School | 16 | 22.5% |
| High School | 16 | 22.5% |
| College / Undergraduate | 10 | 14.1% |
| Graduate / Professional | 16 | 22.5% |
| Total | 71 | 100.0% |
School Enrollment by Age by Funding Source in Branchville borough
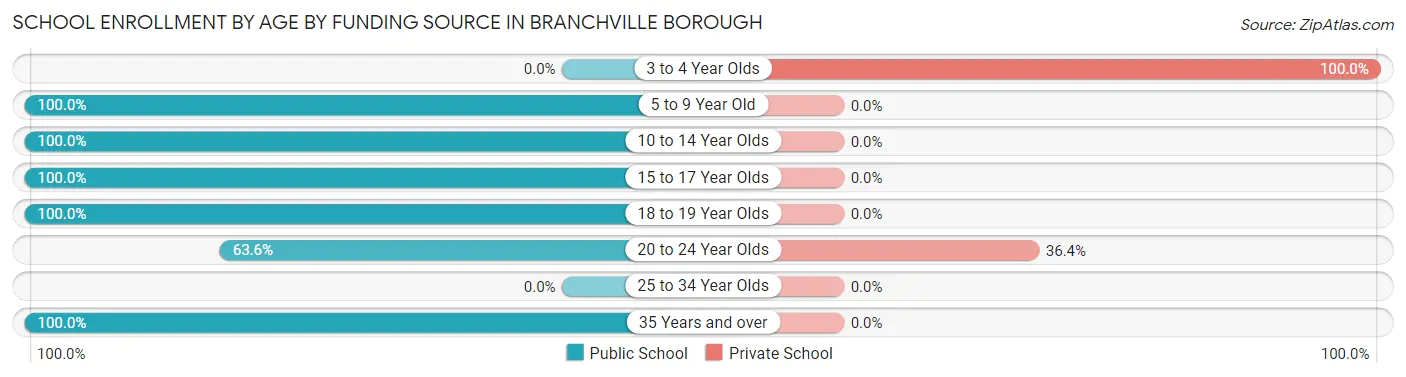
Out of a total of 71 students who are enrolled in schools in Branchville borough, 11 (15.5%) attend a private institution, while the remaining 60 (84.5%) are enrolled in public schools. The age group of 3 to 4 year olds has the highest likelihood of being enrolled in private schools, with 7 (100.0% in the age bracket) enrolled. Conversely, the age group of 5 to 9 year old has the lowest likelihood of being enrolled in a private school, with 6 (100.0% in the age bracket) attending a public institution.
| Age Bracket | Public School | Private School |
| 3 to 4 Year Olds | 0 (0.0%) | 7 (100.0%) |
| 5 to 9 Year Old | 6 (100.0%) | 0 (0.0%) |
| 10 to 14 Year Olds | 18 (100.0%) | 0 (0.0%) |
| 15 to 17 Year Olds | 11 (100.0%) | 0 (0.0%) |
| 18 to 19 Year Olds | 6 (100.0%) | 0 (0.0%) |
| 20 to 24 Year Olds | 7 (63.6%) | 4 (36.4%) |
| 25 to 34 Year Olds | 0 (0.0%) | 0 (0.0%) |
| 35 Years and over | 12 (100.0%) | 0 (0.0%) |
| Total | 60 (84.5%) | 11 (15.5%) |
Educational Attainment by Field of Study in Branchville borough
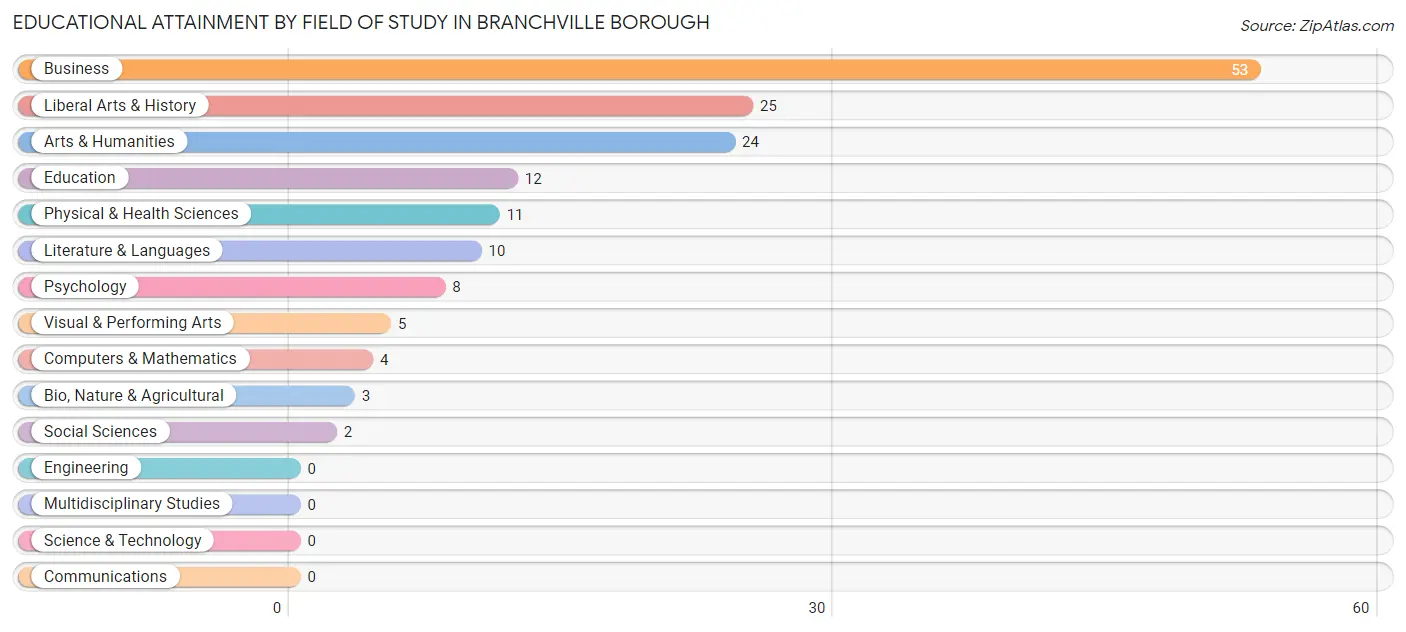
Business (53 | 33.8%), liberal arts & history (25 | 15.9%), arts & humanities (24 | 15.3%), education (12 | 7.6%), and physical & health sciences (11 | 7.0%) are the most common fields of study among 157 individuals in Branchville borough who have obtained a bachelor's degree or higher.
| Field of Study | # Graduates | % Graduates |
| Computers & Mathematics | 4 | 2.5% |
| Bio, Nature & Agricultural | 3 | 1.9% |
| Physical & Health Sciences | 11 | 7.0% |
| Psychology | 8 | 5.1% |
| Social Sciences | 2 | 1.3% |
| Engineering | 0 | 0.0% |
| Multidisciplinary Studies | 0 | 0.0% |
| Science & Technology | 0 | 0.0% |
| Business | 53 | 33.8% |
| Education | 12 | 7.6% |
| Literature & Languages | 10 | 6.4% |
| Liberal Arts & History | 25 | 15.9% |
| Visual & Performing Arts | 5 | 3.2% |
| Communications | 0 | 0.0% |
| Arts & Humanities | 24 | 15.3% |
| Total | 157 | 100.0% |
Transportation & Commute in Branchville borough
Vehicle Availability by Sex in Branchville borough
The most prevalent vehicle ownership categories in Branchville borough are males with 3 vehicles (159, accounting for 59.3%) and females with 3 vehicles (72, making up 88.8%).
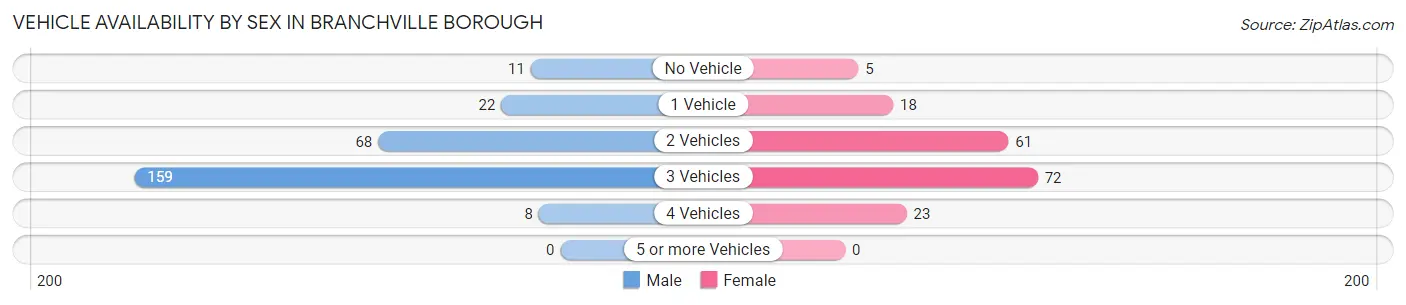
| Vehicles Available | Male | Female |
| No Vehicle | 11 (4.1%) | 5 (2.8%) |
| 1 Vehicle | 22 (8.2%) | 18 (10.1%) |
| 2 Vehicles | 68 (25.4%) | 61 (34.1%) |
| 3 Vehicles | 159 (59.3%) | 72 (40.2%) |
| 4 Vehicles | 8 (3.0%) | 23 (12.9%) |
| 5 or more Vehicles | 0 (0.0%) | 0 (0.0%) |
| Total | 268 (100.0%) | 179 (100.0%) |
Commute Time in Branchville borough
The most frequently occuring commute durations in Branchville borough are 40 to 44 minutes (92 commuters, 24.0%), 20 to 24 minutes (75 commuters, 19.5%), and 10 to 14 minutes (51 commuters, 13.3%).
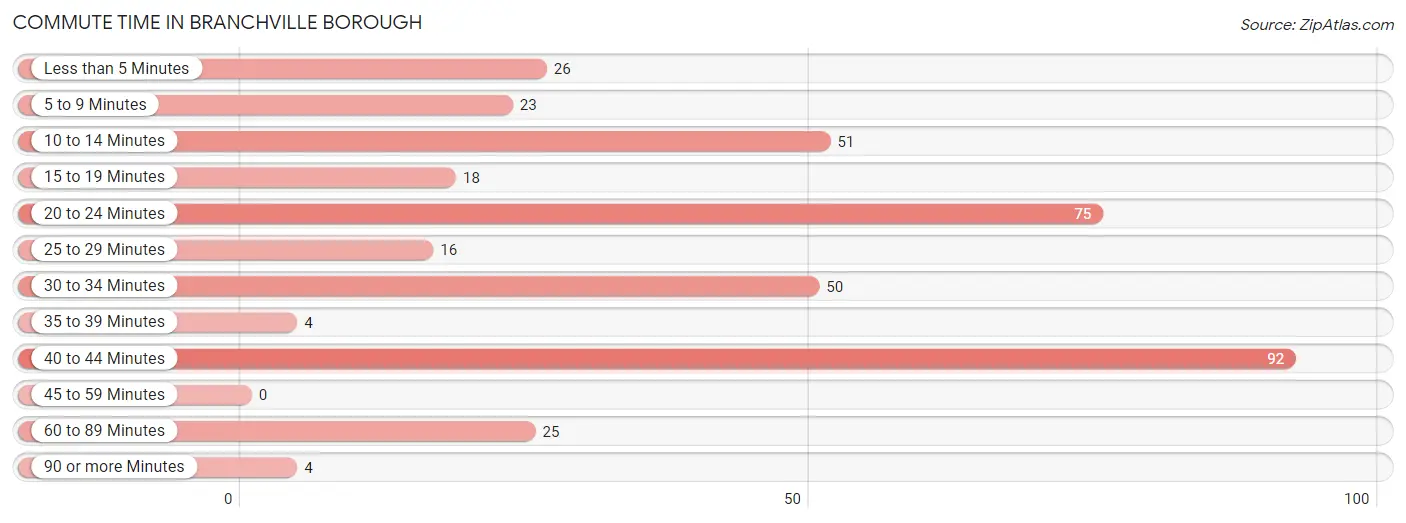
| Commute Time | # Commuters | % Commuters |
| Less than 5 Minutes | 26 | 6.8% |
| 5 to 9 Minutes | 23 | 6.0% |
| 10 to 14 Minutes | 51 | 13.3% |
| 15 to 19 Minutes | 18 | 4.7% |
| 20 to 24 Minutes | 75 | 19.5% |
| 25 to 29 Minutes | 16 | 4.2% |
| 30 to 34 Minutes | 50 | 13.0% |
| 35 to 39 Minutes | 4 | 1.0% |
| 40 to 44 Minutes | 92 | 24.0% |
| 45 to 59 Minutes | 0 | 0.0% |
| 60 to 89 Minutes | 25 | 6.5% |
| 90 or more Minutes | 4 | 1.0% |
Commute Time by Sex in Branchville borough
The most common commute times in Branchville borough are 40 to 44 minutes (92 commuters, 42.2%) for males and 30 to 34 minutes (49 commuters, 29.5%) for females.
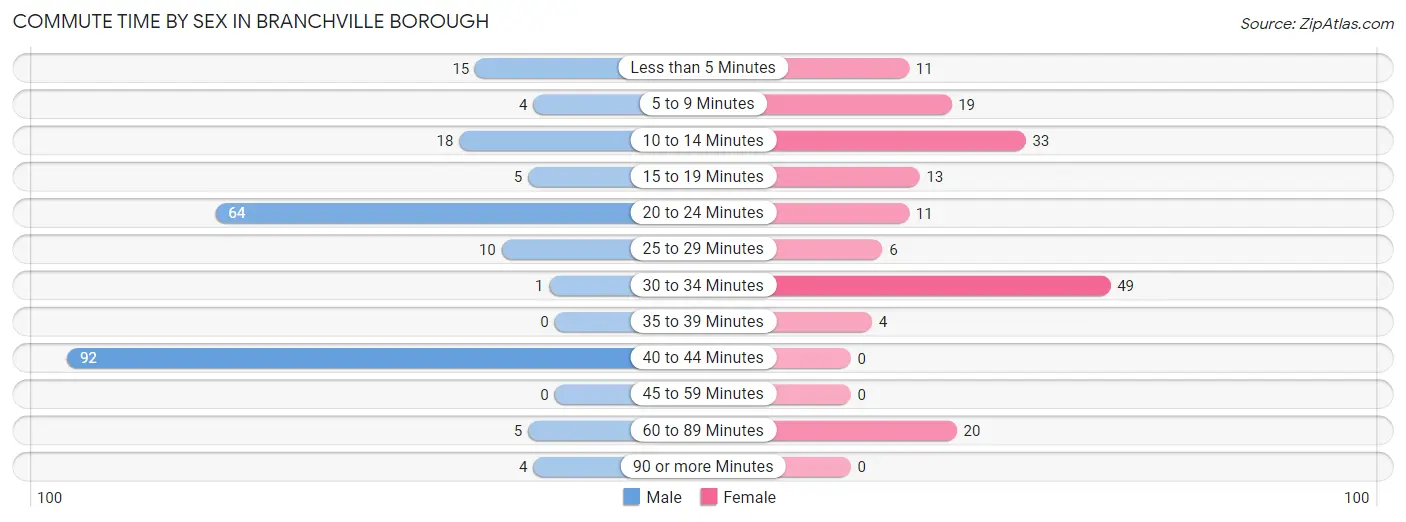
| Commute Time | Male | Female |
| Less than 5 Minutes | 15 (6.9%) | 11 (6.6%) |
| 5 to 9 Minutes | 4 (1.8%) | 19 (11.5%) |
| 10 to 14 Minutes | 18 (8.3%) | 33 (19.9%) |
| 15 to 19 Minutes | 5 (2.3%) | 13 (7.8%) |
| 20 to 24 Minutes | 64 (29.4%) | 11 (6.6%) |
| 25 to 29 Minutes | 10 (4.6%) | 6 (3.6%) |
| 30 to 34 Minutes | 1 (0.5%) | 49 (29.5%) |
| 35 to 39 Minutes | 0 (0.0%) | 4 (2.4%) |
| 40 to 44 Minutes | 92 (42.2%) | 0 (0.0%) |
| 45 to 59 Minutes | 0 (0.0%) | 0 (0.0%) |
| 60 to 89 Minutes | 5 (2.3%) | 20 (12.0%) |
| 90 or more Minutes | 4 (1.8%) | 0 (0.0%) |
Time of Departure to Work by Sex in Branchville borough
The most frequent times of departure to work in Branchville borough are 4:00 PM to 11:59 PM (84, 38.5%) for males and 6:30 AM to 6:59 AM (50, 30.1%) for females.
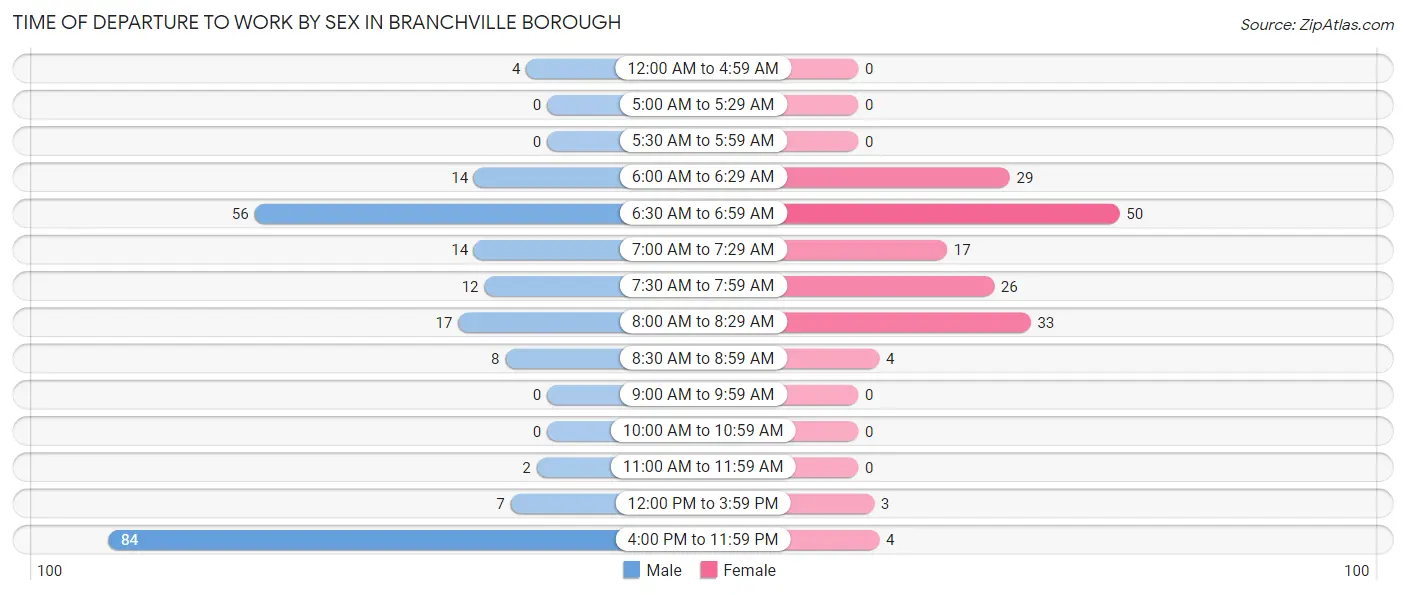
| Time of Departure | Male | Female |
| 12:00 AM to 4:59 AM | 4 (1.8%) | 0 (0.0%) |
| 5:00 AM to 5:29 AM | 0 (0.0%) | 0 (0.0%) |
| 5:30 AM to 5:59 AM | 0 (0.0%) | 0 (0.0%) |
| 6:00 AM to 6:29 AM | 14 (6.4%) | 29 (17.5%) |
| 6:30 AM to 6:59 AM | 56 (25.7%) | 50 (30.1%) |
| 7:00 AM to 7:29 AM | 14 (6.4%) | 17 (10.2%) |
| 7:30 AM to 7:59 AM | 12 (5.5%) | 26 (15.7%) |
| 8:00 AM to 8:29 AM | 17 (7.8%) | 33 (19.9%) |
| 8:30 AM to 8:59 AM | 8 (3.7%) | 4 (2.4%) |
| 9:00 AM to 9:59 AM | 0 (0.0%) | 0 (0.0%) |
| 10:00 AM to 10:59 AM | 0 (0.0%) | 0 (0.0%) |
| 11:00 AM to 11:59 AM | 2 (0.9%) | 0 (0.0%) |
| 12:00 PM to 3:59 PM | 7 (3.2%) | 3 (1.8%) |
| 4:00 PM to 11:59 PM | 84 (38.5%) | 4 (2.4%) |
| Total | 218 (100.0%) | 166 (100.0%) |
Housing Occupancy in Branchville borough
Occupancy by Ownership in Branchville borough
Of the total 297 dwellings in Branchville borough, owner-occupied units account for 205 (69.0%), while renter-occupied units make up 92 (31.0%).
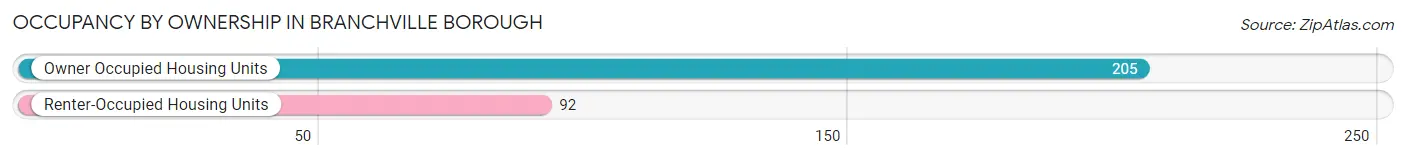
| Occupancy | # Housing Units | % Housing Units |
| Owner Occupied Housing Units | 205 | 69.0% |
| Renter-Occupied Housing Units | 92 | 31.0% |
| Total Occupied Housing Units | 297 | 100.0% |
Occupancy by Household Size in Branchville borough
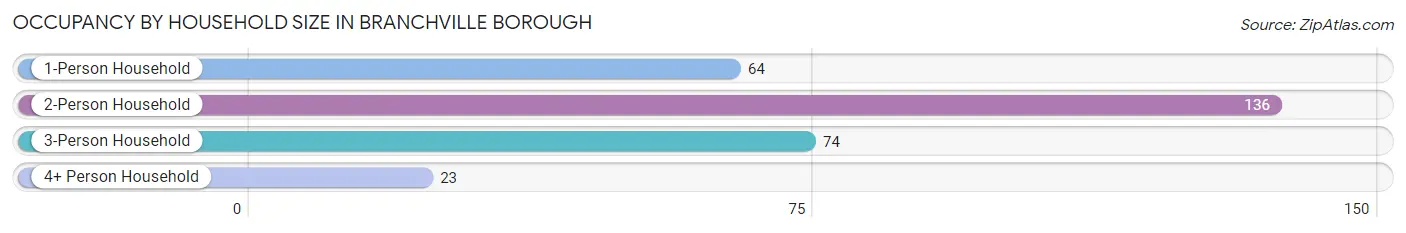
| Household Size | # Housing Units | % Housing Units |
| 1-Person Household | 64 | 21.5% |
| 2-Person Household | 136 | 45.8% |
| 3-Person Household | 74 | 24.9% |
| 4+ Person Household | 23 | 7.7% |
| Total Housing Units | 297 | 100.0% |
Occupancy by Ownership by Household Size in Branchville borough
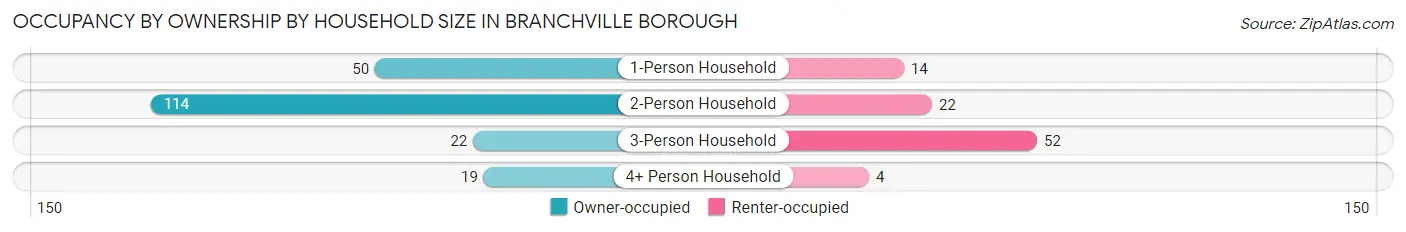
| Household Size | Owner-occupied | Renter-occupied |
| 1-Person Household | 50 (78.1%) | 14 (21.9%) |
| 2-Person Household | 114 (83.8%) | 22 (16.2%) |
| 3-Person Household | 22 (29.7%) | 52 (70.3%) |
| 4+ Person Household | 19 (82.6%) | 4 (17.4%) |
| Total Housing Units | 205 (69.0%) | 92 (31.0%) |
Occupancy by Educational Attainment in Branchville borough
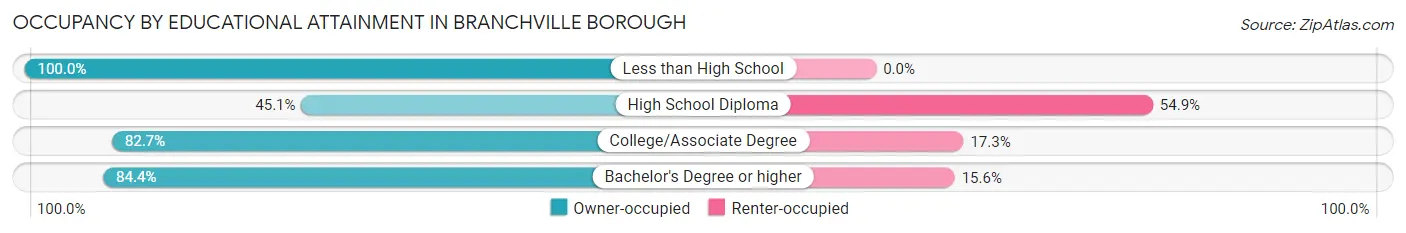
| Household Size | Owner-occupied | Renter-occupied |
| Less than High School | 3 (100.0%) | 0 (0.0%) |
| High School Diploma | 51 (45.1%) | 62 (54.9%) |
| College/Associate Degree | 86 (82.7%) | 18 (17.3%) |
| Bachelor's Degree or higher | 65 (84.4%) | 12 (15.6%) |
Occupancy by Age of Householder in Branchville borough
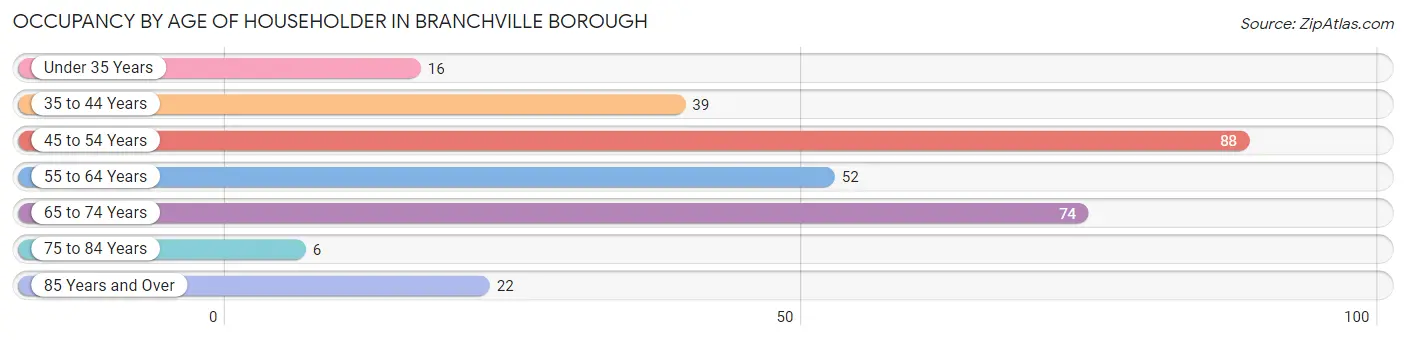
| Age Bracket | # Households | % Households |
| Under 35 Years | 16 | 5.4% |
| 35 to 44 Years | 39 | 13.1% |
| 45 to 54 Years | 88 | 29.6% |
| 55 to 64 Years | 52 | 17.5% |
| 65 to 74 Years | 74 | 24.9% |
| 75 to 84 Years | 6 | 2.0% |
| 85 Years and Over | 22 | 7.4% |
| Total | 297 | 100.0% |
Housing Finances in Branchville borough
Median Income by Occupancy in Branchville borough
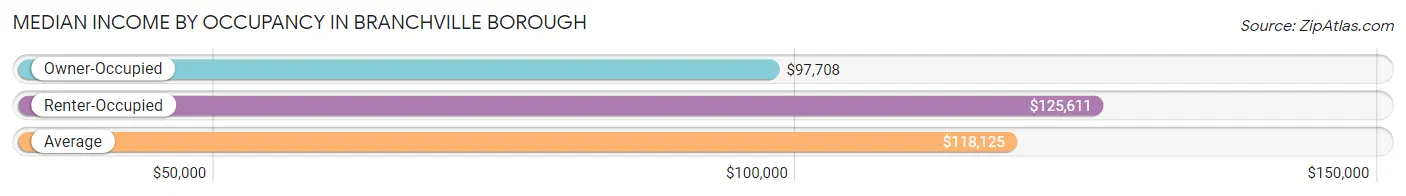
| Occupancy Type | # Households | Median Income |
| Owner-Occupied | 205 (69.0%) | $97,708 |
| Renter-Occupied | 92 (31.0%) | $125,611 |
| Average | 297 (100.0%) | $118,125 |
Occupancy by Householder Income Bracket in Branchville borough
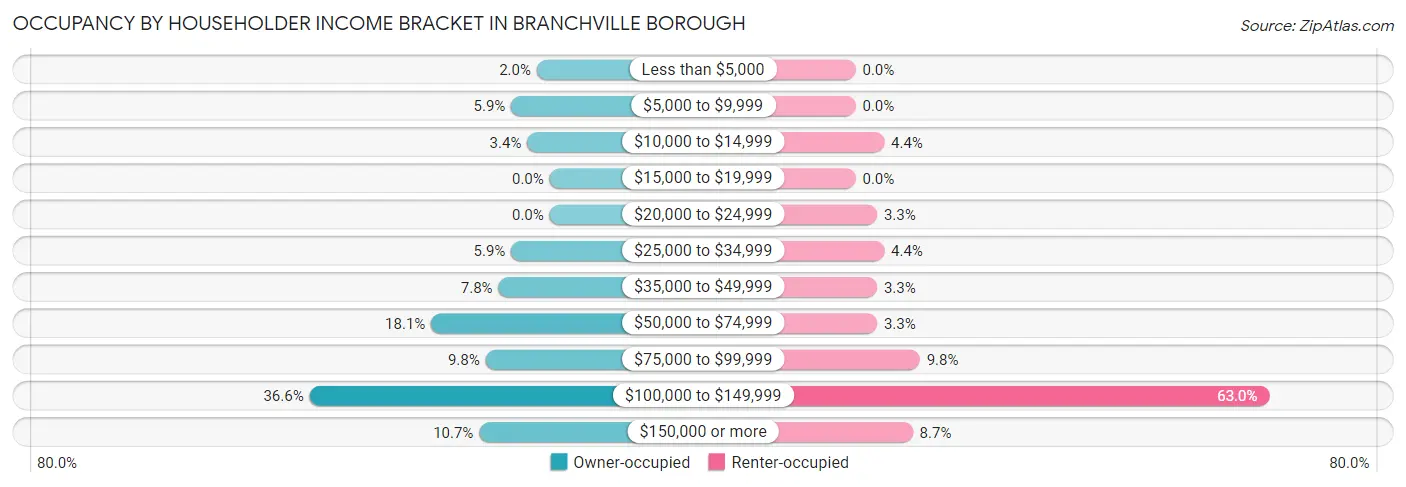
| Income Bracket | Owner-occupied | Renter-occupied |
| Less than $5,000 | 4 (1.9%) | 0 (0.0%) |
| $5,000 to $9,999 | 12 (5.9%) | 0 (0.0%) |
| $10,000 to $14,999 | 7 (3.4%) | 4 (4.3%) |
| $15,000 to $19,999 | 0 (0.0%) | 0 (0.0%) |
| $20,000 to $24,999 | 0 (0.0%) | 3 (3.3%) |
| $25,000 to $34,999 | 12 (5.9%) | 4 (4.3%) |
| $35,000 to $49,999 | 16 (7.8%) | 3 (3.3%) |
| $50,000 to $74,999 | 37 (18.0%) | 3 (3.3%) |
| $75,000 to $99,999 | 20 (9.8%) | 9 (9.8%) |
| $100,000 to $149,999 | 75 (36.6%) | 58 (63.0%) |
| $150,000 or more | 22 (10.7%) | 8 (8.7%) |
| Total | 205 (100.0%) | 92 (100.0%) |
Monthly Housing Cost Tiers in Branchville borough
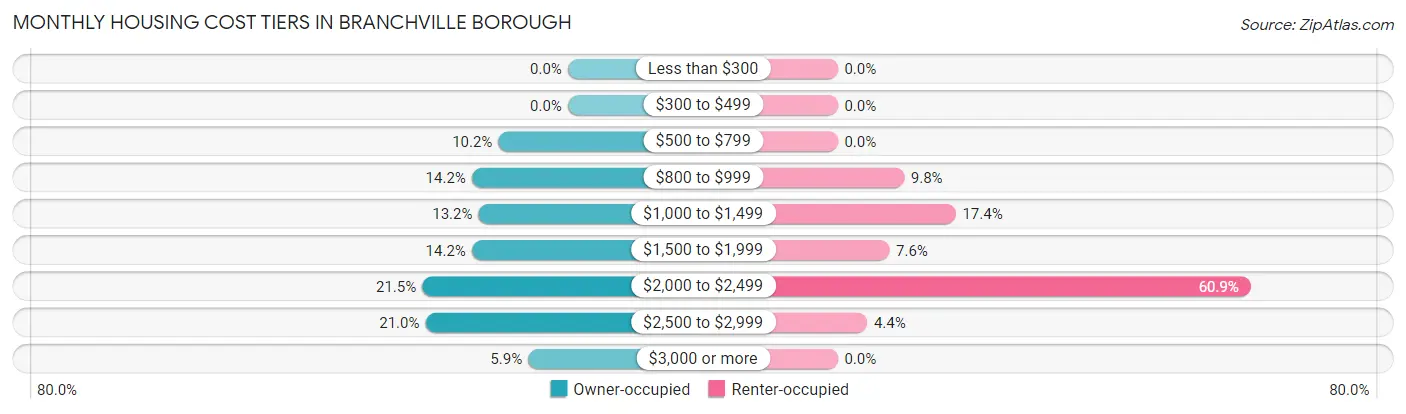
| Monthly Cost | Owner-occupied | Renter-occupied |
| Less than $300 | 0 (0.0%) | 0 (0.0%) |
| $300 to $499 | 0 (0.0%) | 0 (0.0%) |
| $500 to $799 | 21 (10.2%) | 0 (0.0%) |
| $800 to $999 | 29 (14.1%) | 9 (9.8%) |
| $1,000 to $1,499 | 27 (13.2%) | 16 (17.4%) |
| $1,500 to $1,999 | 29 (14.1%) | 7 (7.6%) |
| $2,000 to $2,499 | 44 (21.5%) | 56 (60.9%) |
| $2,500 to $2,999 | 43 (21.0%) | 4 (4.3%) |
| $3,000 or more | 12 (5.9%) | 0 (0.0%) |
| Total | 205 (100.0%) | 92 (100.0%) |
Physical Housing Characteristics in Branchville borough
Housing Structures in Branchville borough
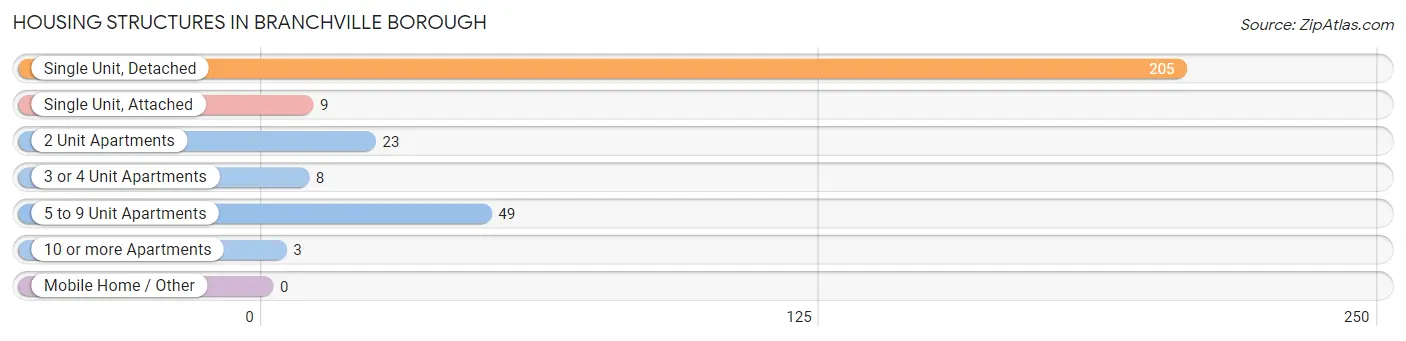
| Structure Type | # Housing Units | % Housing Units |
| Single Unit, Detached | 205 | 69.0% |
| Single Unit, Attached | 9 | 3.0% |
| 2 Unit Apartments | 23 | 7.7% |
| 3 or 4 Unit Apartments | 8 | 2.7% |
| 5 to 9 Unit Apartments | 49 | 16.5% |
| 10 or more Apartments | 3 | 1.0% |
| Mobile Home / Other | 0 | 0.0% |
| Total | 297 | 100.0% |
Housing Structures by Occupancy in Branchville borough
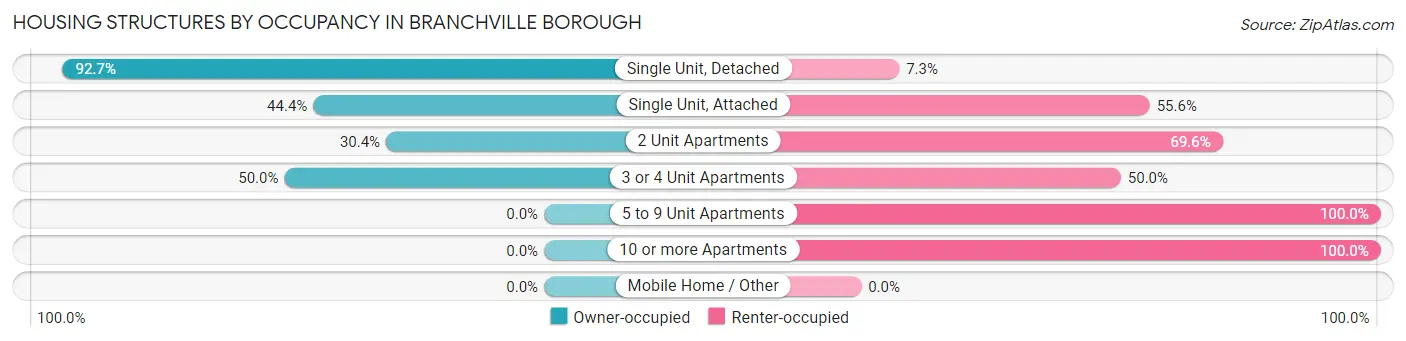
| Structure Type | Owner-occupied | Renter-occupied |
| Single Unit, Detached | 190 (92.7%) | 15 (7.3%) |
| Single Unit, Attached | 4 (44.4%) | 5 (55.6%) |
| 2 Unit Apartments | 7 (30.4%) | 16 (69.6%) |
| 3 or 4 Unit Apartments | 4 (50.0%) | 4 (50.0%) |
| 5 to 9 Unit Apartments | 0 (0.0%) | 49 (100.0%) |
| 10 or more Apartments | 0 (0.0%) | 3 (100.0%) |
| Mobile Home / Other | 0 (0.0%) | 0 (0.0%) |
| Total | 205 (69.0%) | 92 (31.0%) |
Housing Structures by Number of Rooms in Branchville borough
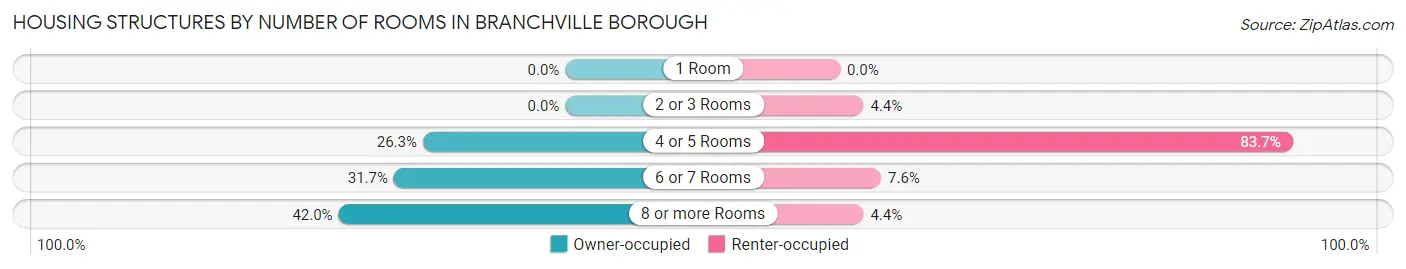
| Number of Rooms | Owner-occupied | Renter-occupied |
| 1 Room | 0 (0.0%) | 0 (0.0%) |
| 2 or 3 Rooms | 0 (0.0%) | 4 (4.3%) |
| 4 or 5 Rooms | 54 (26.3%) | 77 (83.7%) |
| 6 or 7 Rooms | 65 (31.7%) | 7 (7.6%) |
| 8 or more Rooms | 86 (41.9%) | 4 (4.3%) |
| Total | 205 (100.0%) | 92 (100.0%) |
Housing Structure by Heating Type in Branchville borough
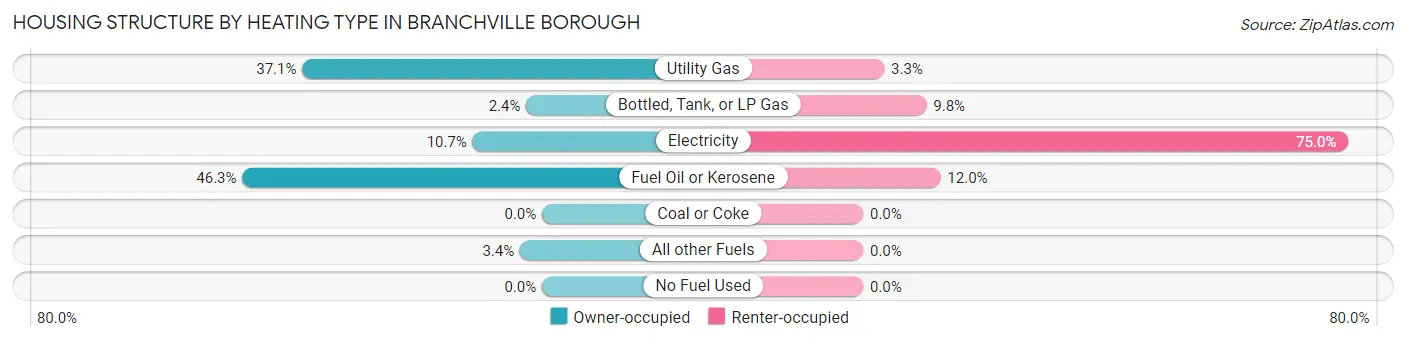
| Heating Type | Owner-occupied | Renter-occupied |
| Utility Gas | 76 (37.1%) | 3 (3.3%) |
| Bottled, Tank, or LP Gas | 5 (2.4%) | 9 (9.8%) |
| Electricity | 22 (10.7%) | 69 (75.0%) |
| Fuel Oil or Kerosene | 95 (46.3%) | 11 (12.0%) |
| Coal or Coke | 0 (0.0%) | 0 (0.0%) |
| All other Fuels | 7 (3.4%) | 0 (0.0%) |
| No Fuel Used | 0 (0.0%) | 0 (0.0%) |
| Total | 205 (100.0%) | 92 (100.0%) |
Household Vehicle Usage in Branchville borough
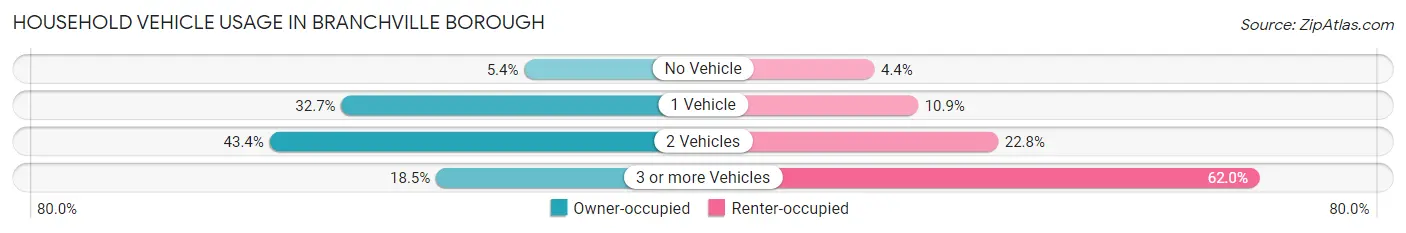
| Vehicles per Household | Owner-occupied | Renter-occupied |
| No Vehicle | 11 (5.4%) | 4 (4.3%) |
| 1 Vehicle | 67 (32.7%) | 10 (10.9%) |
| 2 Vehicles | 89 (43.4%) | 21 (22.8%) |
| 3 or more Vehicles | 38 (18.5%) | 57 (62.0%) |
| Total | 205 (100.0%) | 92 (100.0%) |
Real Estate & Mortgages in Branchville borough
Real Estate and Mortgage Overview in Branchville borough
| Characteristic | Without Mortgage | With Mortgage |
| Housing Units | 77 | 128 |
| Median Property Value | $254,700 | $306,700 |
| Median Household Income | $36,607 | $22 |
| Monthly Housing Costs | $880 | $9 |
| Real Estate Taxes | $5,994 | $0 |
Property Value by Mortgage Status in Branchville borough
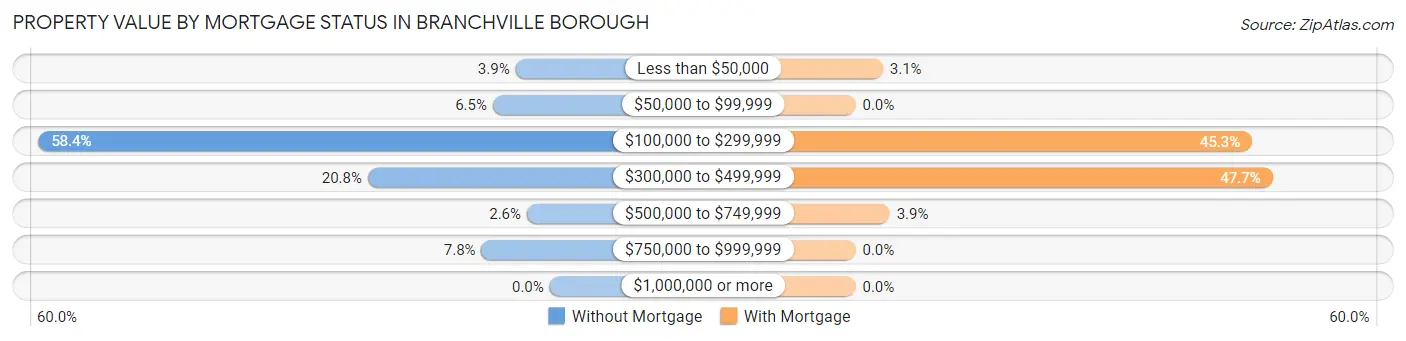
| Property Value | Without Mortgage | With Mortgage |
| Less than $50,000 | 3 (3.9%) | 4 (3.1%) |
| $50,000 to $99,999 | 5 (6.5%) | 0 (0.0%) |
| $100,000 to $299,999 | 45 (58.4%) | 58 (45.3%) |
| $300,000 to $499,999 | 16 (20.8%) | 61 (47.7%) |
| $500,000 to $749,999 | 2 (2.6%) | 5 (3.9%) |
| $750,000 to $999,999 | 6 (7.8%) | 0 (0.0%) |
| $1,000,000 or more | 0 (0.0%) | 0 (0.0%) |
| Total | 77 (100.0%) | 128 (100.0%) |
Household Income by Mortgage Status in Branchville borough
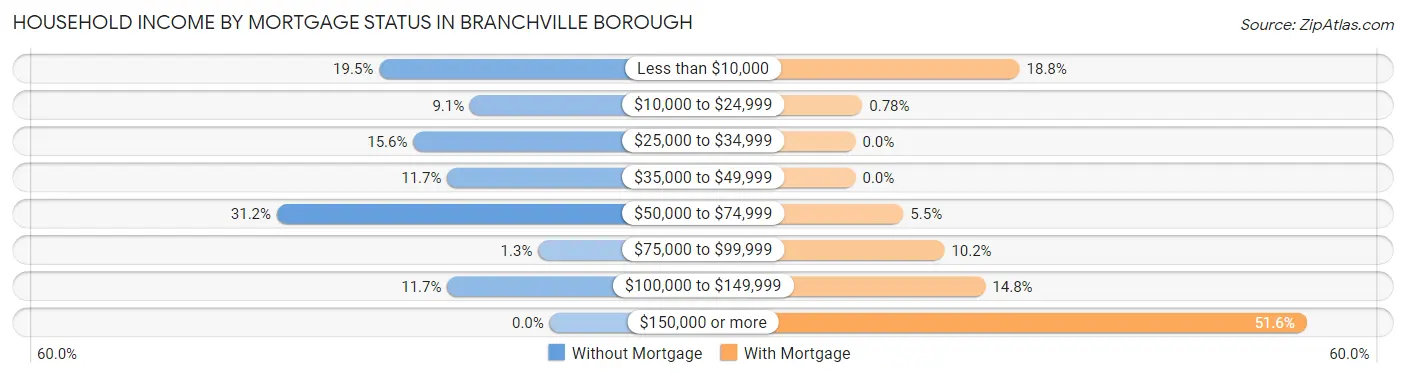
| Household Income | Without Mortgage | With Mortgage |
| Less than $10,000 | 15 (19.5%) | 24 (18.8%) |
| $10,000 to $24,999 | 7 (9.1%) | 1 (0.8%) |
| $25,000 to $34,999 | 12 (15.6%) | 0 (0.0%) |
| $35,000 to $49,999 | 9 (11.7%) | 0 (0.0%) |
| $50,000 to $74,999 | 24 (31.2%) | 7 (5.5%) |
| $75,000 to $99,999 | 1 (1.3%) | 13 (10.2%) |
| $100,000 to $149,999 | 9 (11.7%) | 19 (14.8%) |
| $150,000 or more | 0 (0.0%) | 66 (51.6%) |
| Total | 77 (100.0%) | 128 (100.0%) |
Property Value to Household Income Ratio in Branchville borough
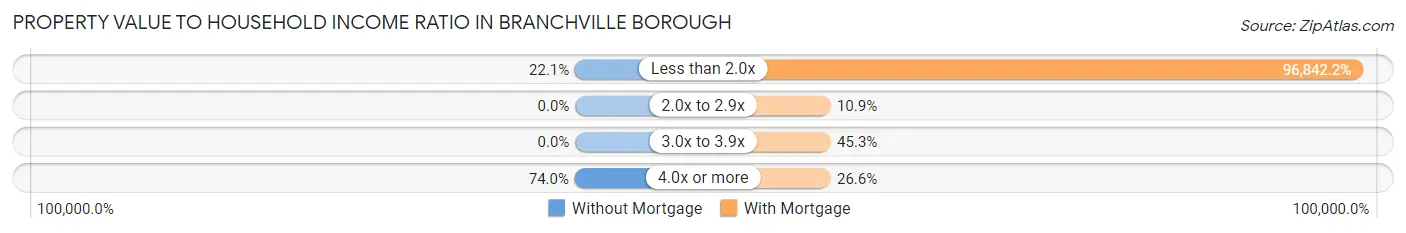
| Value-to-Income Ratio | Without Mortgage | With Mortgage |
| Less than 2.0x | 17 (22.1%) | 123,958 (96,842.2%) |
| 2.0x to 2.9x | 0 (0.0%) | 14 (10.9%) |
| 3.0x to 3.9x | 0 (0.0%) | 58 (45.3%) |
| 4.0x or more | 57 (74.0%) | 34 (26.6%) |
| Total | 77 (100.0%) | 128 (100.0%) |
Real Estate Taxes by Mortgage Status in Branchville borough
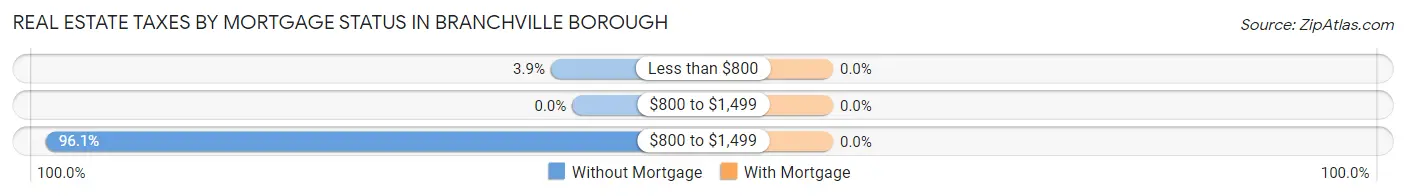
| Property Taxes | Without Mortgage | With Mortgage |
| Less than $800 | 3 (3.9%) | 0 (0.0%) |
| $800 to $1,499 | 0 (0.0%) | 0 (0.0%) |
| $800 to $1,499 | 74 (96.1%) | 0 (0.0%) |
| Total | 77 (100.0%) | 128 (100.0%) |
Health & Disability in Branchville borough
Health Insurance Coverage by Age in Branchville borough
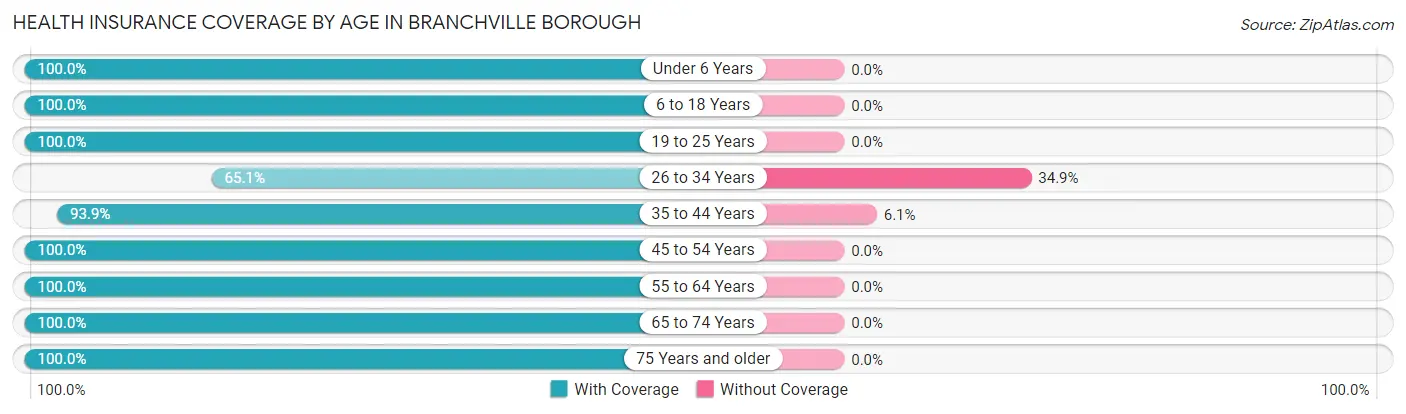
| Age Bracket | With Coverage | Without Coverage |
| Under 6 Years | 18 (100.0%) | 0 (0.0%) |
| 6 to 18 Years | 38 (100.0%) | 0 (0.0%) |
| 19 to 25 Years | 109 (100.0%) | 0 (0.0%) |
| 26 to 34 Years | 28 (65.1%) | 15 (34.9%) |
| 35 to 44 Years | 62 (93.9%) | 4 (6.1%) |
| 45 to 54 Years | 152 (100.0%) | 0 (0.0%) |
| 55 to 64 Years | 104 (100.0%) | 0 (0.0%) |
| 65 to 74 Years | 125 (100.0%) | 0 (0.0%) |
| 75 Years and older | 53 (100.0%) | 0 (0.0%) |
| Total | 689 (97.3%) | 19 (2.7%) |
Health Insurance Coverage by Citizenship Status in Branchville borough
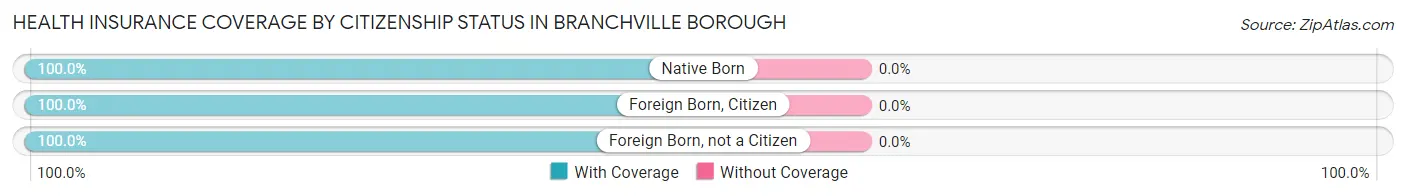
| Citizenship Status | With Coverage | Without Coverage |
| Native Born | 18 (100.0%) | 0 (0.0%) |
| Foreign Born, Citizen | 38 (100.0%) | 0 (0.0%) |
| Foreign Born, not a Citizen | 109 (100.0%) | 0 (0.0%) |
Health Insurance Coverage by Household Income in Branchville borough
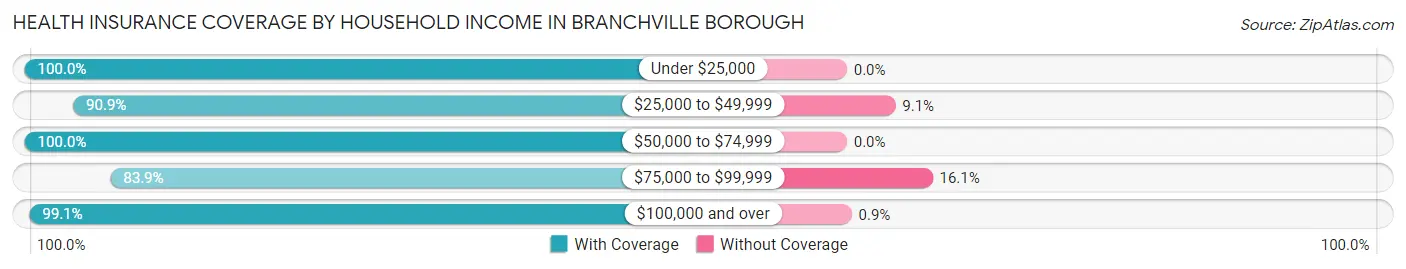
| Household Income | With Coverage | Without Coverage |
| Under $25,000 | 45 (100.0%) | 0 (0.0%) |
| $25,000 to $49,999 | 60 (90.9%) | 6 (9.1%) |
| $50,000 to $74,999 | 78 (100.0%) | 0 (0.0%) |
| $75,000 to $99,999 | 47 (83.9%) | 9 (16.1%) |
| $100,000 and over | 440 (99.1%) | 4 (0.9%) |
Public vs Private Health Insurance Coverage by Age in Branchville borough
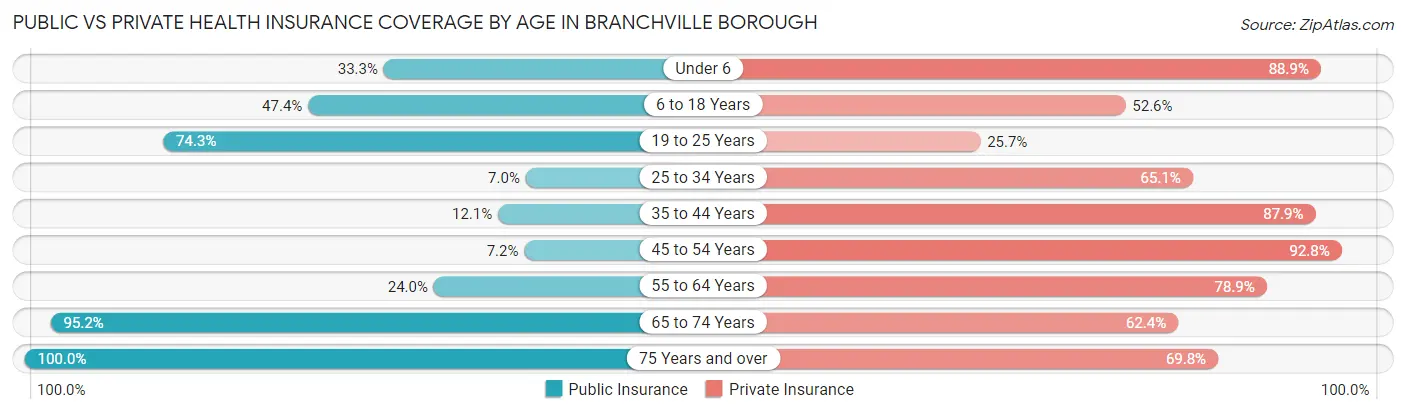
| Age Bracket | Public Insurance | Private Insurance |
| Under 6 | 6 (33.3%) | 16 (88.9%) |
| 6 to 18 Years | 18 (47.4%) | 20 (52.6%) |
| 19 to 25 Years | 81 (74.3%) | 28 (25.7%) |
| 25 to 34 Years | 3 (7.0%) | 28 (65.1%) |
| 35 to 44 Years | 8 (12.1%) | 58 (87.9%) |
| 45 to 54 Years | 11 (7.2%) | 141 (92.8%) |
| 55 to 64 Years | 25 (24.0%) | 82 (78.8%) |
| 65 to 74 Years | 119 (95.2%) | 78 (62.4%) |
| 75 Years and over | 53 (100.0%) | 37 (69.8%) |
| Total | 324 (45.8%) | 488 (68.9%) |
Disability Status by Sex by Age in Branchville borough
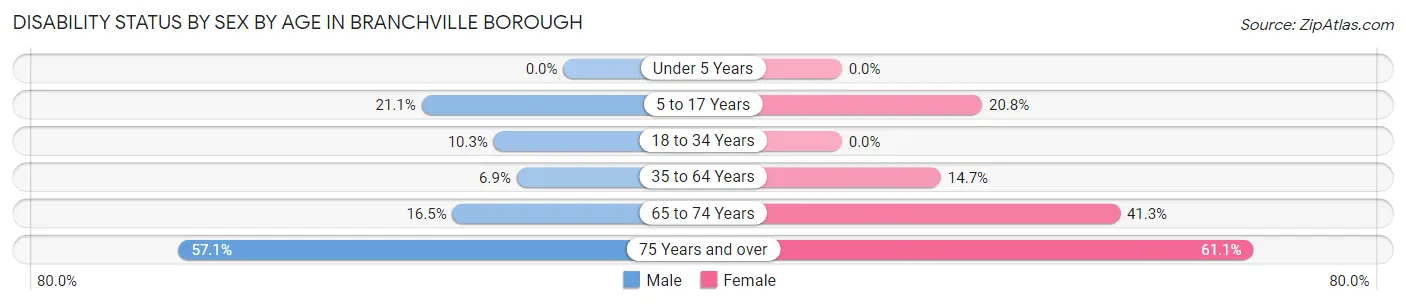
| Age Bracket | Male | Female |
| Under 5 Years | 0 (0.0%) | 0 (0.0%) |
| 5 to 17 Years | 4 (21.0%) | 5 (20.8%) |
| 18 to 34 Years | 12 (10.3%) | 0 (0.0%) |
| 35 to 64 Years | 11 (6.9%) | 24 (14.7%) |
| 65 to 74 Years | 13 (16.5%) | 19 (41.3%) |
| 75 Years and over | 20 (57.1%) | 11 (61.1%) |
Disability Class by Sex by Age in Branchville borough
Disability Class: Hearing Difficulty
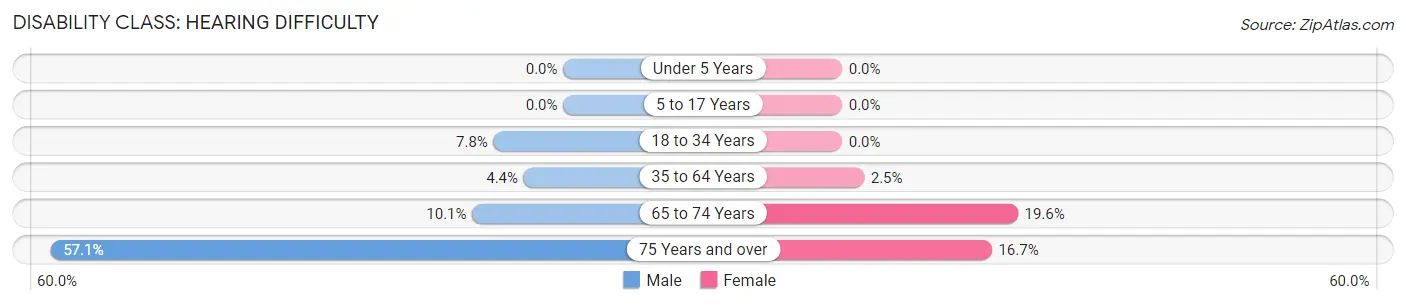
| Age Bracket | Male | Female |
| Under 5 Years | 0 (0.0%) | 0 (0.0%) |
| 5 to 17 Years | 0 (0.0%) | 0 (0.0%) |
| 18 to 34 Years | 9 (7.8%) | 0 (0.0%) |
| 35 to 64 Years | 7 (4.4%) | 4 (2.5%) |
| 65 to 74 Years | 8 (10.1%) | 9 (19.6%) |
| 75 Years and over | 20 (57.1%) | 3 (16.7%) |
Disability Class: Vision Difficulty
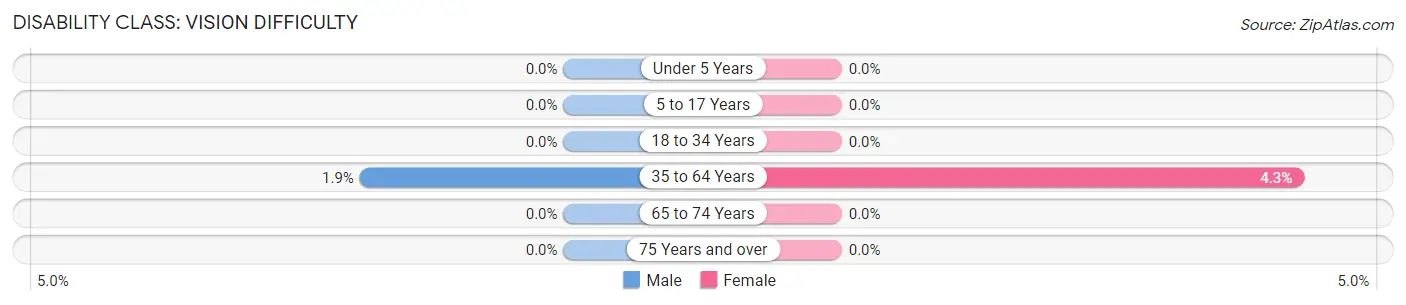
| Age Bracket | Male | Female |
| Under 5 Years | 0 (0.0%) | 0 (0.0%) |
| 5 to 17 Years | 0 (0.0%) | 0 (0.0%) |
| 18 to 34 Years | 0 (0.0%) | 0 (0.0%) |
| 35 to 64 Years | 3 (1.9%) | 7 (4.3%) |
| 65 to 74 Years | 0 (0.0%) | 0 (0.0%) |
| 75 Years and over | 0 (0.0%) | 0 (0.0%) |
Disability Class: Cognitive Difficulty
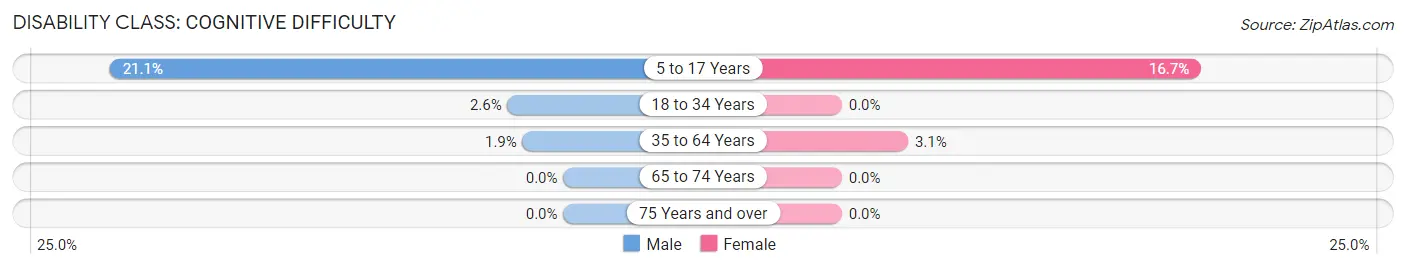
| Age Bracket | Male | Female |
| 5 to 17 Years | 4 (21.0%) | 4 (16.7%) |
| 18 to 34 Years | 3 (2.6%) | 0 (0.0%) |
| 35 to 64 Years | 3 (1.9%) | 5 (3.1%) |
| 65 to 74 Years | 0 (0.0%) | 0 (0.0%) |
| 75 Years and over | 0 (0.0%) | 0 (0.0%) |
Disability Class: Ambulatory Difficulty
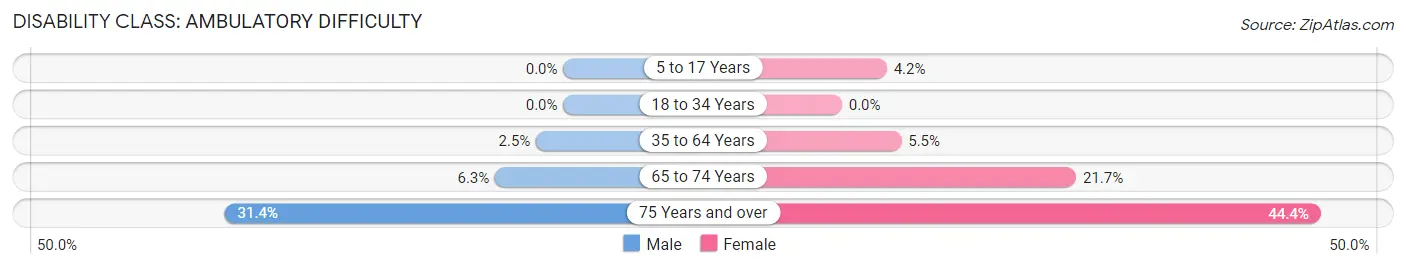
| Age Bracket | Male | Female |
| 5 to 17 Years | 0 (0.0%) | 1 (4.2%) |
| 18 to 34 Years | 0 (0.0%) | 0 (0.0%) |
| 35 to 64 Years | 4 (2.5%) | 9 (5.5%) |
| 65 to 74 Years | 5 (6.3%) | 10 (21.7%) |
| 75 Years and over | 11 (31.4%) | 8 (44.4%) |
Disability Class: Self-Care Difficulty
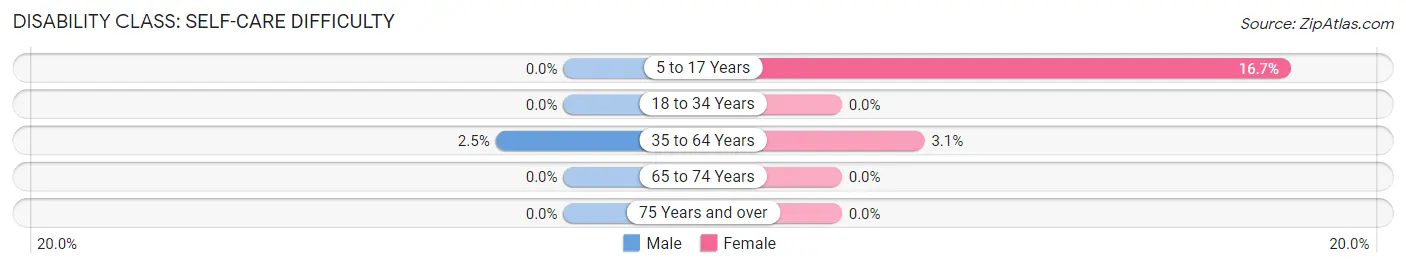
| Age Bracket | Male | Female |
| 5 to 17 Years | 0 (0.0%) | 4 (16.7%) |
| 18 to 34 Years | 0 (0.0%) | 0 (0.0%) |
| 35 to 64 Years | 4 (2.5%) | 5 (3.1%) |
| 65 to 74 Years | 0 (0.0%) | 0 (0.0%) |
| 75 Years and over | 0 (0.0%) | 0 (0.0%) |
Technology Access in Branchville borough
Computing Device Access in Branchville borough
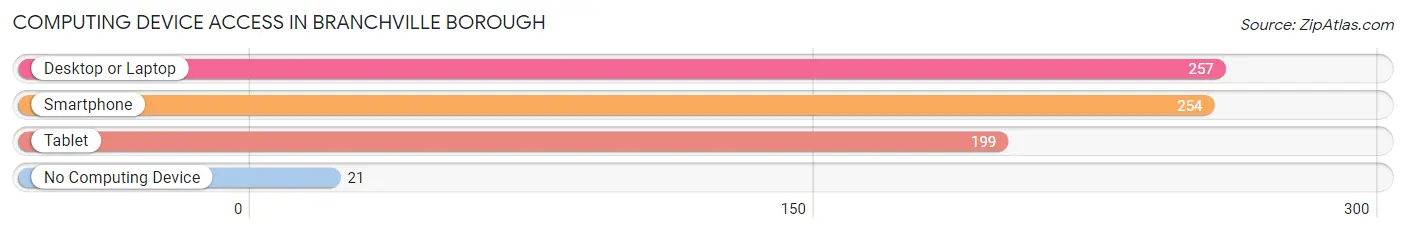
| Device Type | # Households | % Households |
| Desktop or Laptop | 257 | 86.5% |
| Smartphone | 254 | 85.5% |
| Tablet | 199 | 67.0% |
| No Computing Device | 21 | 7.1% |
| Total | 297 | 100.0% |
Internet Access in Branchville borough
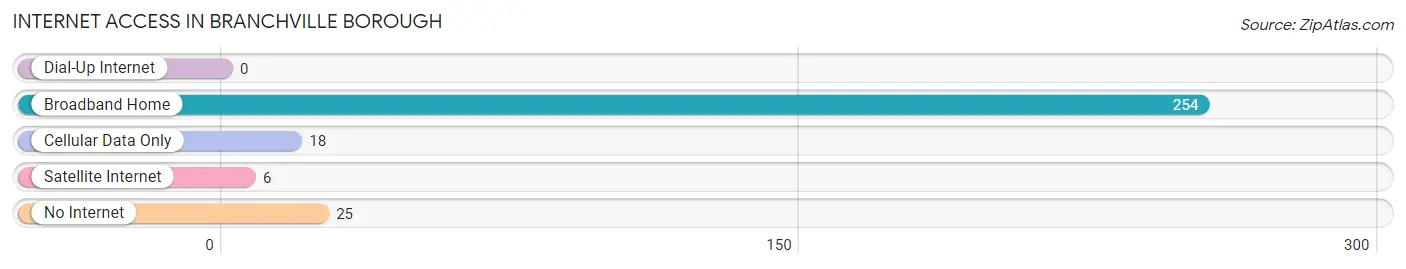
| Internet Type | # Households | % Households |
| Dial-Up Internet | 0 | 0.0% |
| Broadband Home | 254 | 85.5% |
| Cellular Data Only | 18 | 6.1% |
| Satellite Internet | 6 | 2.0% |
| No Internet | 25 | 8.4% |
| Total | 297 | 100.0% |
Branchville borough Summary
Branchville Borough is a small borough located in Sussex County, New Jersey. It is situated in the Kittatinny Valley, which is part of the Great Appalachian Valley. The borough is bordered by the townships of Frankford, Sandyston, and Wantage. The population of Branchville Borough was 1,093 as of the 2010 census.
History
The area that is now Branchville Borough was first settled in the late 1700s by German and Dutch immigrants. The first settler in the area was John Van Campen, who arrived in 1790. The area was originally known as Van Campen’s Corners, and the first post office was established in 1817. The name of the town was changed to Branchville in 1824, after the local branch of the Paulinskill River.
The borough was officially incorporated in 1871. At the time, the main industry in the area was farming. The borough also had several small businesses, including a sawmill, a gristmill, and a tannery. In the late 19th century, the borough began to develop as a resort town, with several hotels and boarding houses being built.
Geography
Branchville Borough is located in the Kittatinny Valley, which is part of the Great Appalachian Valley. The borough is bordered by the townships of Frankford, Sandyston, and Wantage. The Paulinskill River runs through the borough, and there are several small lakes and ponds in the area. The borough is located approximately 50 miles northwest of New York City.
The borough has a total area of 1.2 square miles, all of which is land. The borough is located in a rural area, and the terrain is mostly flat. The climate is humid continental, with cold winters and hot, humid summers.
Economy
The economy of Branchville Borough is largely based on agriculture and tourism. The borough is home to several small farms, which produce a variety of crops, including corn, soybeans, and hay. The borough also has several small businesses, including restaurants, retail stores, and a few bed and breakfasts.
The borough is also a popular tourist destination, due to its proximity to the Delaware Water Gap National Recreation Area. The area is popular for camping, hiking, fishing, and other outdoor activities.
Demographics
As of the 2010 census, the population of Branchville Borough was 1,093. The racial makeup of the borough was 94.3% White, 2.2% African American, 0.7% Asian, 0.7% from other races, and 2.1% from two or more races. Hispanic or Latino of any race were 3.3% of the population.
The median household income in the borough was $50,938, and the median family income was $60,000. The per capita income was $25,938. About 8.3% of the population was below the poverty line.
The population of Branchville Borough is largely made up of families. About 57.3% of households had children under the age of 18 living with them. The median age of the borough was 41.3 years.
Common Questions
What is the Total Population of Branchville borough?
Total Population of Branchville borough is 708.
What is the Total Male Population of Branchville borough?
Total Male Population of Branchville borough is 411.
What is the Total Female Population of Branchville borough?
Total Female Population of Branchville borough is 297.
What is the Ratio of Males per 100 Females in Branchville borough?
There are 138.38 Males per 100 Females in Branchville borough.
What is the Ratio of Females per 100 Males in Branchville borough?
There are 72.26 Females per 100 Males in Branchville borough.
What is the Median Population Age in Branchville borough?
Median Population Age in Branchville borough is 50.5 Years.
What is the Average Family Size in Branchville borough
Average Family Size in Branchville borough is 2.7 People.
What is the Average Household Size in Branchville borough
Average Household Size in Branchville borough is 2.3 People.
What is Per Capita Income in Branchville borough?
Per Capita income in Branchville borough is $43,019.
What is the Median Family Income in Branchville borough?
Median Family Income in Branchville borough is $125,500.
What is the Median Household income in Branchville borough?
Median Household Income in Branchville borough is $118,125.
What is Income or Wage Gap in Branchville borough?
Income or Wage Gap in Branchville borough is 4.4%.
Women in Branchville borough earn 95.6 cents for every dollar earned by a man.
What is Inequality or Gini Index in Branchville borough?
Inequality or Gini Index in Branchville borough is 0.29.
How Large is the Labor Force in Branchville borough?
There are 454 People in the Labor Forcein in Branchville borough.
What is the Percentage of People in the Labor Force in Branchville borough?
68.7% of People are in the Labor Force in Branchville borough.
What is the Unemployment Rate in Branchville borough?
Unemployment Rate in Branchville borough is 0.7%.