Cities with the Most Immigrants from Northern Africa in Wisconsin
RELATED REPORTS & OPTIONS
Northern Africa
Wisconsin
Compare Cities
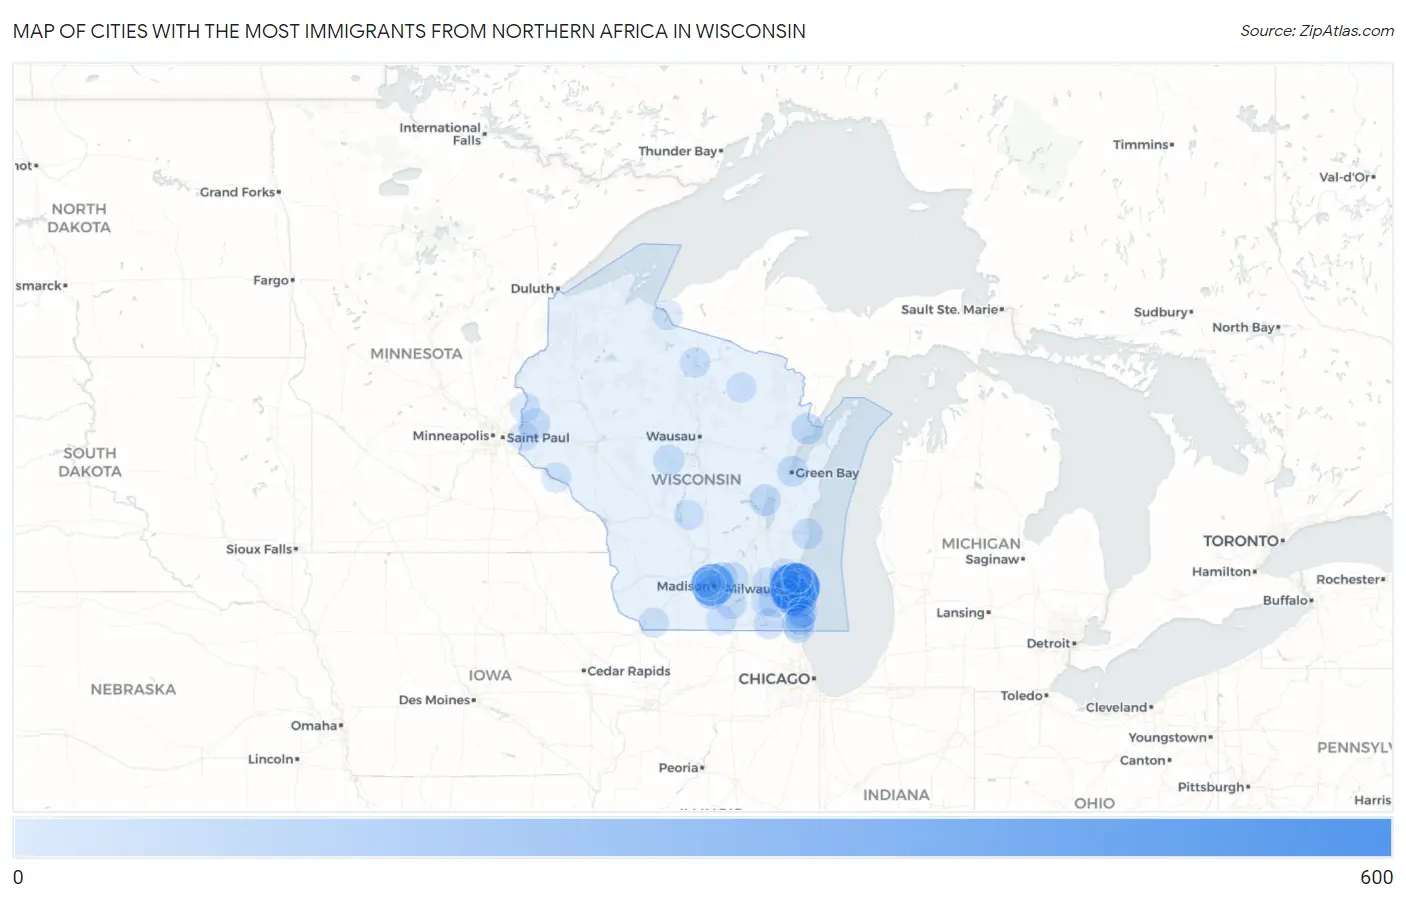
Map of Cities with the Most Immigrants from Northern Africa in Wisconsin
0
600
Cities with the Most Immigrants from Northern Africa in Wisconsin
| City | Northern Africa | vs State | vs National | |
| 1. | Milwaukee | 600 | 2,261(26.54%)#1 | 421,832(0.14%)#92 |
| 2. | Madison | 372 | 2,261(16.45%)#2 | 421,832(0.09%)#168 |
| 3. | Greenfield | 263 | 2,261(11.63%)#3 | 421,832(0.06%)#264 |
| 4. | Oak Creek | 177 | 2,261(7.83%)#4 | 421,832(0.04%)#421 |
| 5. | Fitchburg | 95 | 2,261(4.20%)#5 | 421,832(0.02%)#727 |
| 6. | Franklin | 64 | 2,261(2.83%)#6 | 421,832(0.02%)#962 |
| 7. | Peshtigo | 46 | 2,261(2.03%)#7 | 421,832(0.01%)#1,201 |
| 8. | Neenah | 45 | 2,261(1.99%)#8 | 421,832(0.01%)#1,208 |
| 9. | St Francis | 39 | 2,261(1.72%)#9 | 421,832(0.01%)#1,324 |
| 10. | Shorewood | 36 | 2,261(1.59%)#10 | 421,832(0.01%)#1,384 |
| 11. | Kenosha | 33 | 2,261(1.46%)#11 | 421,832(0.01%)#1,444 |
| 12. | Marshall | 31 | 2,261(1.37%)#12 | 421,832(0.01%)#1,506 |
| 13. | Green Bay | 30 | 2,261(1.33%)#13 | 421,832(0.01%)#1,510 |
| 14. | Sun Prairie | 26 | 2,261(1.15%)#14 | 421,832(0.01%)#1,623 |
| 15. | Marshfield | 26 | 2,261(1.15%)#15 | 421,832(0.01%)#1,629 |
| 16. | Sheboygan | 24 | 2,261(1.06%)#16 | 421,832(0.01%)#1,682 |
| 17. | Wauwatosa | 22 | 2,261(0.97%)#17 | 421,832(0.01%)#1,747 |
| 18. | New Richmond | 20 | 2,261(0.88%)#18 | 421,832(0.00%)#1,822 |
| 19. | Pleasant Prairie | 19 | 2,261(0.84%)#19 | 421,832(0.00%)#1,856 |
| 20. | Mount Pleasant | 17 | 2,261(0.75%)#20 | 421,832(0.00%)#1,931 |
| 21. | Germantown | 17 | 2,261(0.75%)#21 | 421,832(0.00%)#1,942 |
| 22. | Lake Geneva | 16 | 2,261(0.71%)#22 | 421,832(0.00%)#2,016 |
| 23. | Edgerton | 15 | 2,261(0.66%)#23 | 421,832(0.00%)#2,080 |
| 24. | Racine | 14 | 2,261(0.62%)#24 | 421,832(0.00%)#2,102 |
| 25. | Minocqua | 13 | 2,261(0.57%)#25 | 421,832(0.00%)#2,205 |
| 26. | Somers | 12 | 2,261(0.53%)#26 | 421,832(0.00%)#2,243 |
| 27. | Mukwonago | 11 | 2,261(0.49%)#27 | 421,832(0.00%)#2,291 |
| 28. | Middleton | 9 | 2,261(0.40%)#28 | 421,832(0.00%)#2,408 |
| 29. | Okauchee Lake | 7 | 2,261(0.31%)#29 | 421,832(0.00%)#2,566 |
| 30. | New Berlin | 6 | 2,261(0.27%)#30 | 421,832(0.00%)#2,592 |
| 31. | Shorewood Hills | 5 | 2,261(0.22%)#31 | 421,832(0.00%)#2,701 |
| 32. | Eagle | 5 | 2,261(0.22%)#32 | 421,832(0.00%)#2,702 |
| 33. | Lannon | 5 | 2,261(0.22%)#33 | 421,832(0.00%)#2,713 |
| 34. | Bayside | 4 | 2,261(0.18%)#34 | 421,832(0.00%)#2,749 |
| 35. | River Hills | 4 | 2,261(0.18%)#35 | 421,832(0.00%)#2,773 |
| 36. | Crandon | 4 | 2,261(0.18%)#36 | 421,832(0.00%)#2,774 |
| 37. | Cuba City | 3 | 2,261(0.13%)#37 | 421,832(0.00%)#2,805 |
| 38. | Orfordville | 3 | 2,261(0.13%)#38 | 421,832(0.00%)#2,811 |
| 39. | Friendship | 2 | 2,261(0.09%)#39 | 421,832(0.00%)#2,876 |
| 40. | Hudson | 1 | 2,261(0.04%)#40 | 421,832(0.00%)#2,896 |
| 41. | Osceola | 1 | 2,261(0.04%)#41 | 421,832(0.00%)#2,908 |
| 42. | Hurley | 1 | 2,261(0.04%)#42 | 421,832(0.00%)#2,912 |
| 43. | Pepin | 1 | 2,261(0.04%)#43 | 421,832(0.00%)#2,917 |
Common Questions
What are the Top 10 Cities with the Most Immigrants from Northern Africa in Wisconsin?
Top 10 Cities with the Most Immigrants from Northern Africa in Wisconsin are:
#1
600
#2
372
#3
263
#4
177
#5
95
#6
64
#7
46
#8
45
#9
39
#10
36
What city has the Most Immigrants from Northern Africa in Wisconsin?
Milwaukee has the Most Immigrants from Northern Africa in Wisconsin with 600.
What is the Total Immigrants from Northern Africa in the State of Wisconsin?
Total Immigrants from Northern Africa in Wisconsin is 2,261.
What is the Total Immigrants from Northern Africa in the United States?
Total Immigrants from Northern Africa in the United States is 421,832.