Garysburg, NC
Garysburg Map
Garysburg Overview
620
TOTAL POPULATION
252
MALE POPULATION
368
FEMALE POPULATION
68.48
MALES / 100 FEMALES
146.03
FEMALES / 100 MALES
54.6
MEDIAN AGE
2.6
AVG FAMILY SIZE
1.8
AVG HOUSEHOLD SIZE
$36,800
PER CAPITA INCOME
$36,579
AVG FAMILY INCOME
$38,510
AVG HOUSEHOLD INCOME
80.8%
WAGE / INCOME GAP [ % ]
19.2¢/ $1
WAGE / INCOME GAP [ $ ]
$10,689
FAMILY INCOME DEFICIT
0.52
INEQUALITY / GINI INDEX
261
LABOR FORCE [ PEOPLE ]
49.1%
PERCENT IN LABOR FORCE
8.4%
UNEMPLOYMENT RATE
Garysburg Zip Codes
Garysburg Area Codes
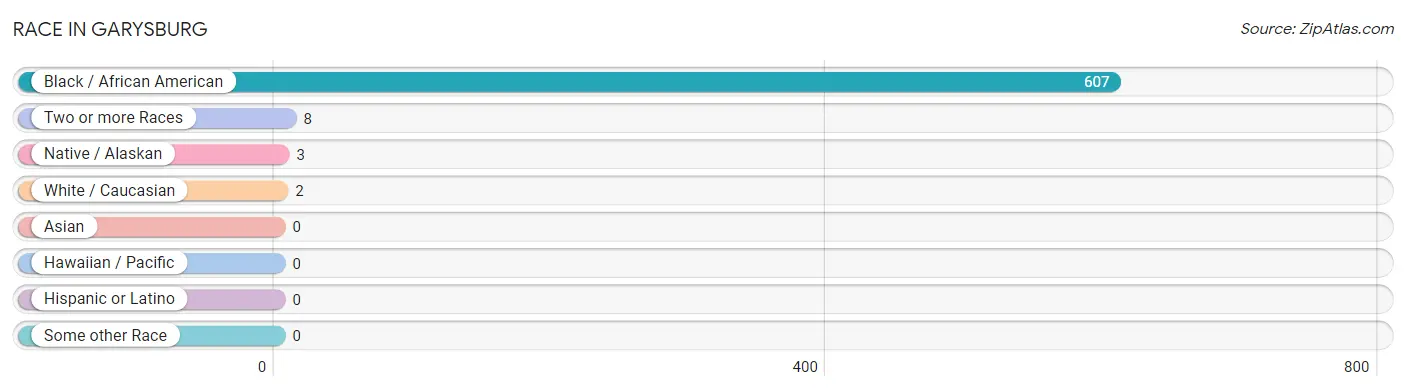
Race in Garysburg
The most populous races in Garysburg are Black / African American (607 | 97.9%), Two or more Races (8 | 1.3%), and Native / Alaskan (3 | 0.5%).
| Race | # Population | % Population |
| Asian | 0 | 0.0% |
| Black / African American | 607 | 97.9% |
| Hawaiian / Pacific | 0 | 0.0% |
| Hispanic or Latino | 0 | 0.0% |
| Native / Alaskan | 3 | 0.5% |
| White / Caucasian | 2 | 0.3% |
| Two or more Races | 8 | 1.3% |
| Some other Race | 0 | 0.0% |
| Total | 620 | 100.0% |
Ancestry in Garysburg
The most populous ancestries reported in Garysburg are , and American (75 | 12.1%), together accounting for 12.1% of all Garysburg residents.

| Ancestry | # Population | % Population |
| American | 75 | 12.1% | View All 1 Rows |
Immigrants in Garysburg

| Immigration Origin | # Population | % Population | View All 0 Rows |
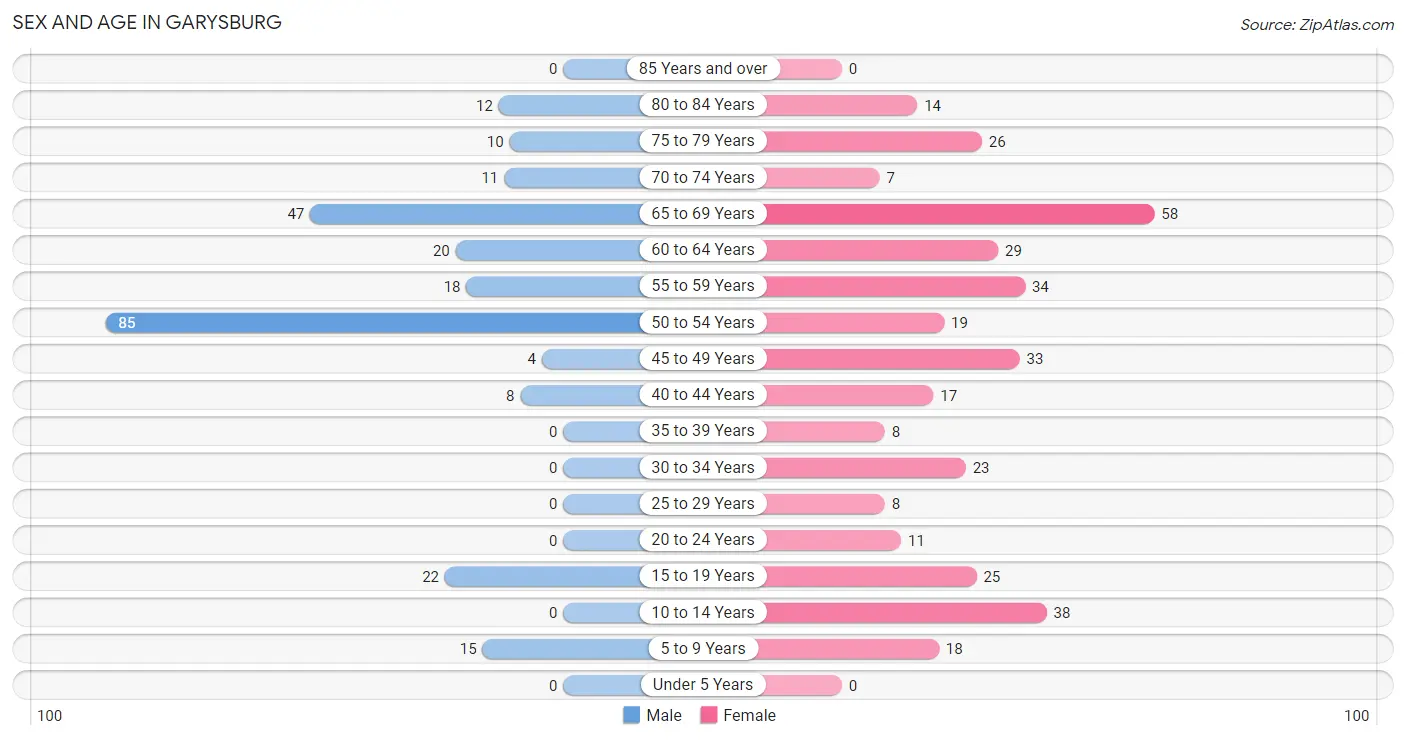
Sex and Age in Garysburg
Sex and Age in Garysburg
The most populous age groups in Garysburg are 50 to 54 Years (85 | 33.7%) for men and 65 to 69 Years (58 | 15.8%) for women.
| Age Bracket | Male | Female |
| Under 5 Years | 0 (0.0%) | 0 (0.0%) |
| 5 to 9 Years | 15 (5.9%) | 18 (4.9%) |
| 10 to 14 Years | 0 (0.0%) | 38 (10.3%) |
| 15 to 19 Years | 22 (8.7%) | 25 (6.8%) |
| 20 to 24 Years | 0 (0.0%) | 11 (3.0%) |
| 25 to 29 Years | 0 (0.0%) | 8 (2.2%) |
| 30 to 34 Years | 0 (0.0%) | 23 (6.2%) |
| 35 to 39 Years | 0 (0.0%) | 8 (2.2%) |
| 40 to 44 Years | 8 (3.2%) | 17 (4.6%) |
| 45 to 49 Years | 4 (1.6%) | 33 (9.0%) |
| 50 to 54 Years | 85 (33.7%) | 19 (5.2%) |
| 55 to 59 Years | 18 (7.1%) | 34 (9.2%) |
| 60 to 64 Years | 20 (7.9%) | 29 (7.9%) |
| 65 to 69 Years | 47 (18.6%) | 58 (15.8%) |
| 70 to 74 Years | 11 (4.4%) | 7 (1.9%) |
| 75 to 79 Years | 10 (4.0%) | 26 (7.1%) |
| 80 to 84 Years | 12 (4.8%) | 14 (3.8%) |
| 85 Years and over | 0 (0.0%) | 0 (0.0%) |
| Total | 252 (100.0%) | 368 (100.0%) |
Families and Households in Garysburg
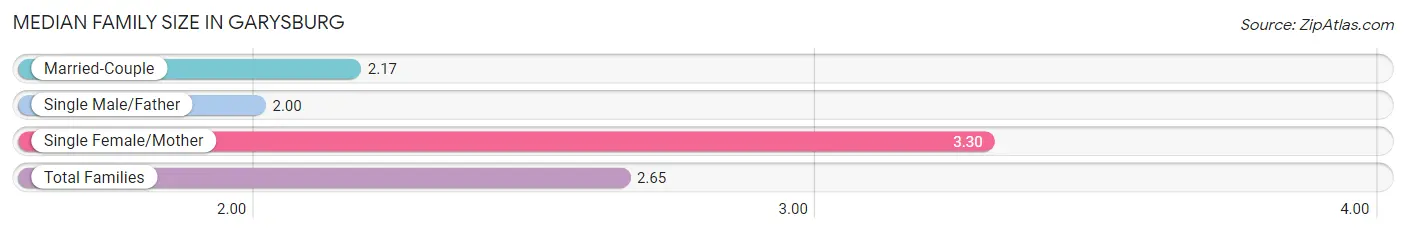
Median Family Size in Garysburg
The median family size in Garysburg is 2.65 persons per family, with single female/mother families (69 | 42.6%) accounting for the largest median family size of 3.3 persons per family. On the other hand, single male/father families (7 | 4.3%) represent the smallest median family size with 2.00 persons per family.
| Family Type | # Families | Family Size |
| Married-Couple | 86 (53.1%) | 2.17 |
| Single Male/Father | 7 (4.3%) | 2.00 |
| Single Female/Mother | 69 (42.6%) | 3.30 |
| Total Families | 162 (100.0%) | 2.65 |
Median Household Size in Garysburg
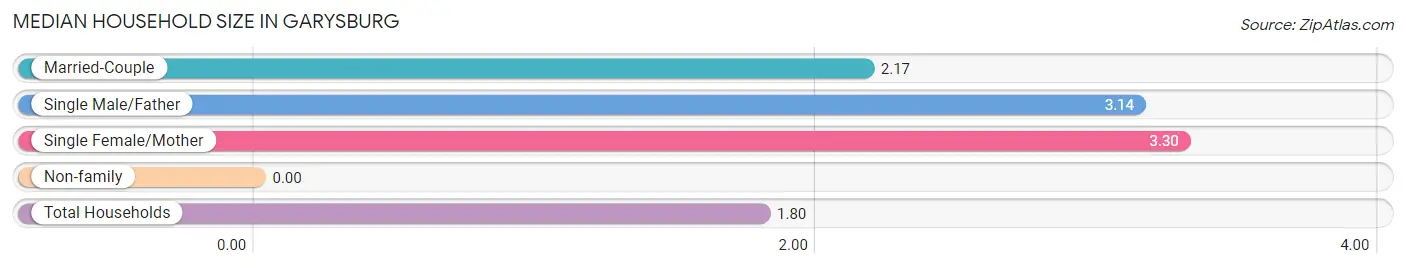
| Household Type | # Households | Household Size |
| Married-Couple | 86 (24.9%) | 2.17 |
| Single Male/Father | 7 (2.0%) | 3.14 |
| Single Female/Mother | 69 (20.0%) | 3.30 |
| Non-family | 183 (53.0%) | - |
| Total Households | 345 (100.0%) | 1.80 |
Household Size by Marriage Status in Garysburg
Out of a total of 345 households in Garysburg, 162 (47.0%) are family households, while 183 (53.0%) are nonfamily households. The most numerous type of family households are 2-person households, comprising 74, and the most common type of nonfamily households are 1-person households, comprising 183.
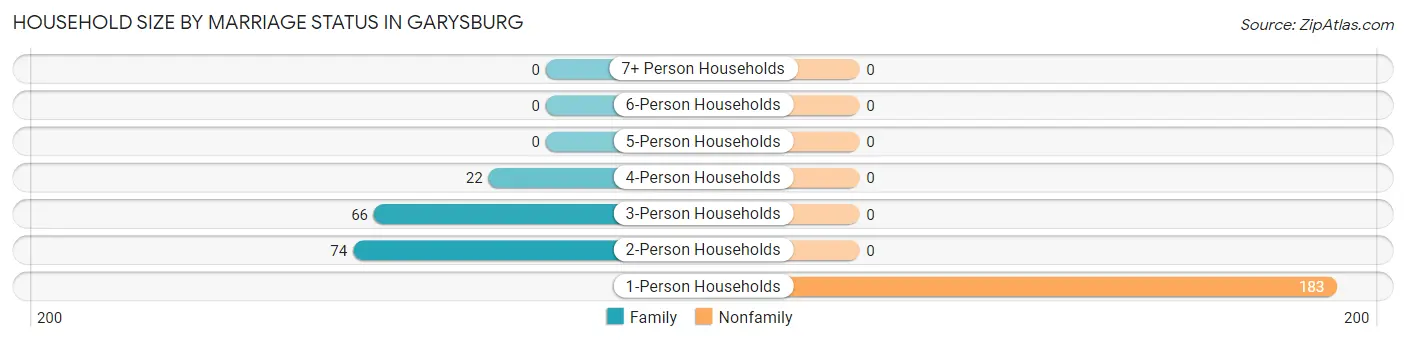
| Household Size | Family Households | Nonfamily Households |
| 1-Person Households | - | 183 (53.0%) |
| 2-Person Households | 74 (21.4%) | 0 (0.0%) |
| 3-Person Households | 66 (19.1%) | 0 (0.0%) |
| 4-Person Households | 22 (6.4%) | 0 (0.0%) |
| 5-Person Households | 0 (0.0%) | 0 (0.0%) |
| 6-Person Households | 0 (0.0%) | 0 (0.0%) |
| 7+ Person Households | 0 (0.0%) | 0 (0.0%) |
| Total | 162 (47.0%) | 183 (53.0%) |
Female Fertility in Garysburg
Fertility by Age in Garysburg

| Age Bracket | Women with Births | Births / 1,000 Women |
| 15 to 19 years | 0 (0.0%) | 0.0 |
| 20 to 34 years | 0 (0.0%) | 0.0 |
| 35 to 50 years | 0 (0.0%) | 0.0 |
| Total | 0 (0.0%) | 0.0 |
Fertility by Age by Marriage Status in Garysburg
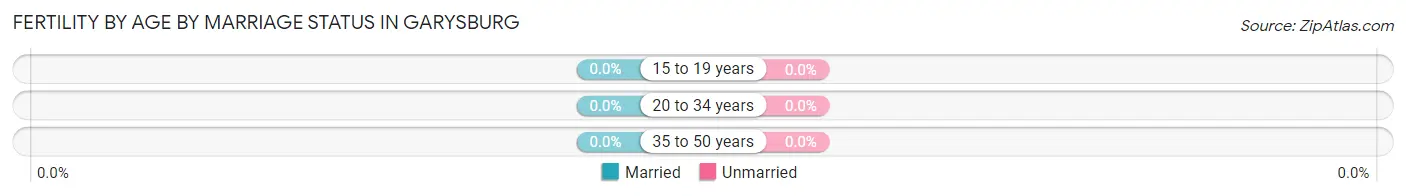
| Age Bracket | Married | Unmarried |
| 15 to 19 years | 0 (0.0%) | 0 (0.0%) |
| 20 to 34 years | 0 (0.0%) | 0 (0.0%) |
| 35 to 50 years | 0 (0.0%) | 0 (0.0%) |
| Total | 0 (0.0%) | 0 (0.0%) |
Fertility by Education in Garysburg
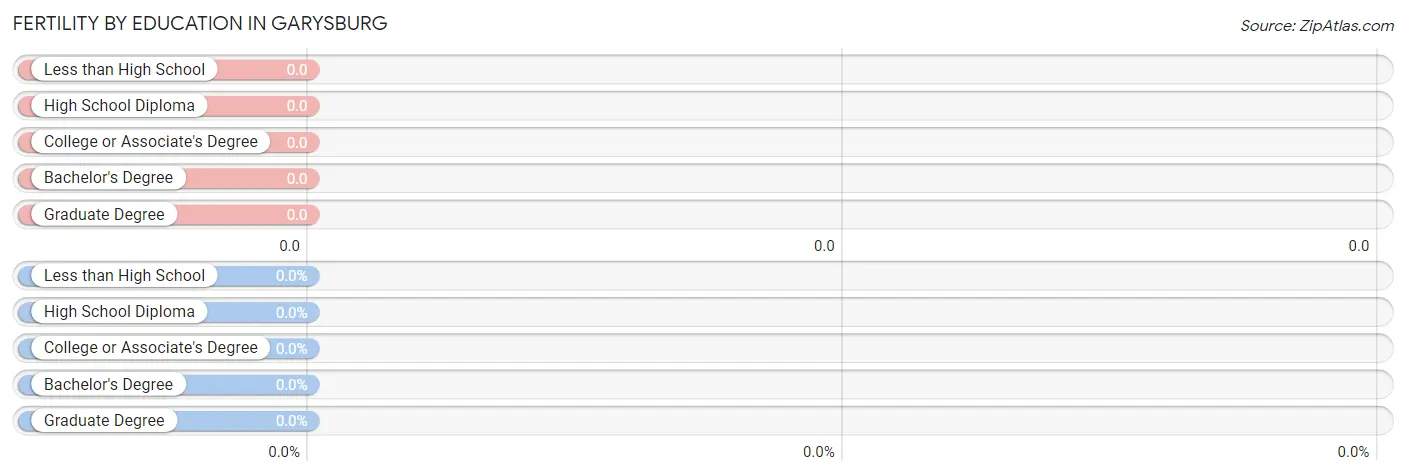
| Educational Attainment | Women with Births | Births / 1,000 Women |
| Less than High School | 0 (0.0%) | 0.0 |
| High School Diploma | 0 (0.0%) | 0.0 |
| College or Associate's Degree | 0 (0.0%) | 0.0 |
| Bachelor's Degree | 0 (0.0%) | 0.0 |
| Graduate Degree | 0 (0.0%) | 0.0 |
| Total | 0 (0.0%) | 0.0 |
Fertility by Education by Marriage Status in Garysburg
| Educational Attainment | Married | Unmarried |
| Less than High School | 0 (0.0%) | 0 (0.0%) |
| High School Diploma | 0 (0.0%) | 0 (0.0%) |
| College or Associate's Degree | 0 (0.0%) | 0 (0.0%) |
| Bachelor's Degree | 0 (0.0%) | 0 (0.0%) |
| Graduate Degree | 0 (0.0%) | 0 (0.0%) |
| Total | 0 (0.0%) | 0 (0.0%) |
Income in Garysburg
Income Overview in Garysburg
Per Capita Income in Garysburg is $36,800, while median incomes of families and households are $36,579 and $38,510 respectively.
| Characteristic | Number | Measure |
| Per Capita Income | 620 | $36,800 |
| Median Family Income | 162 | $36,579 |
| Mean Family Income | 162 | $71,707 |
| Median Household Income | 345 | $38,510 |
| Mean Household Income | 345 | $67,273 |
| Income Deficit | 162 | $10,689 |
| Wage / Income Gap (%) | 620 | 80.81% |
| Wage / Income Gap ($) | 620 | 19.19¢ per $1 |
| Gini / Inequality Index | 620 | 0.52 |
Earnings by Sex in Garysburg
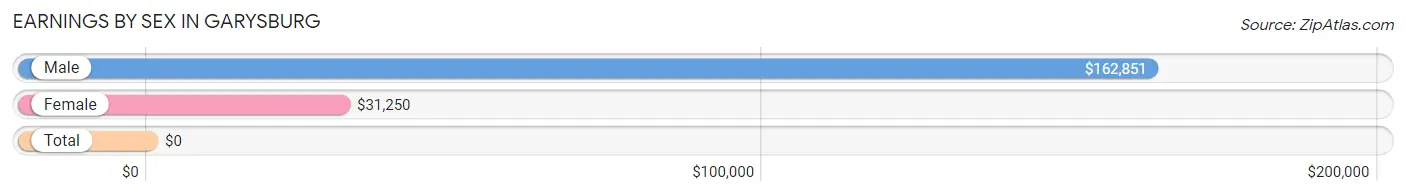
| Sex | Number | Average Earnings |
| Male | 98 (37.6%) | $162,851 |
| Female | 163 (62.5%) | $31,250 |
| Total | 261 (100.0%) | $0 |
Earnings by Sex by Income Bracket in Garysburg
The most common earnings brackets in Garysburg are $100,000+ for men (57 | 58.2%) and $7,500 to $9,999 for women (26 | 16.0%).
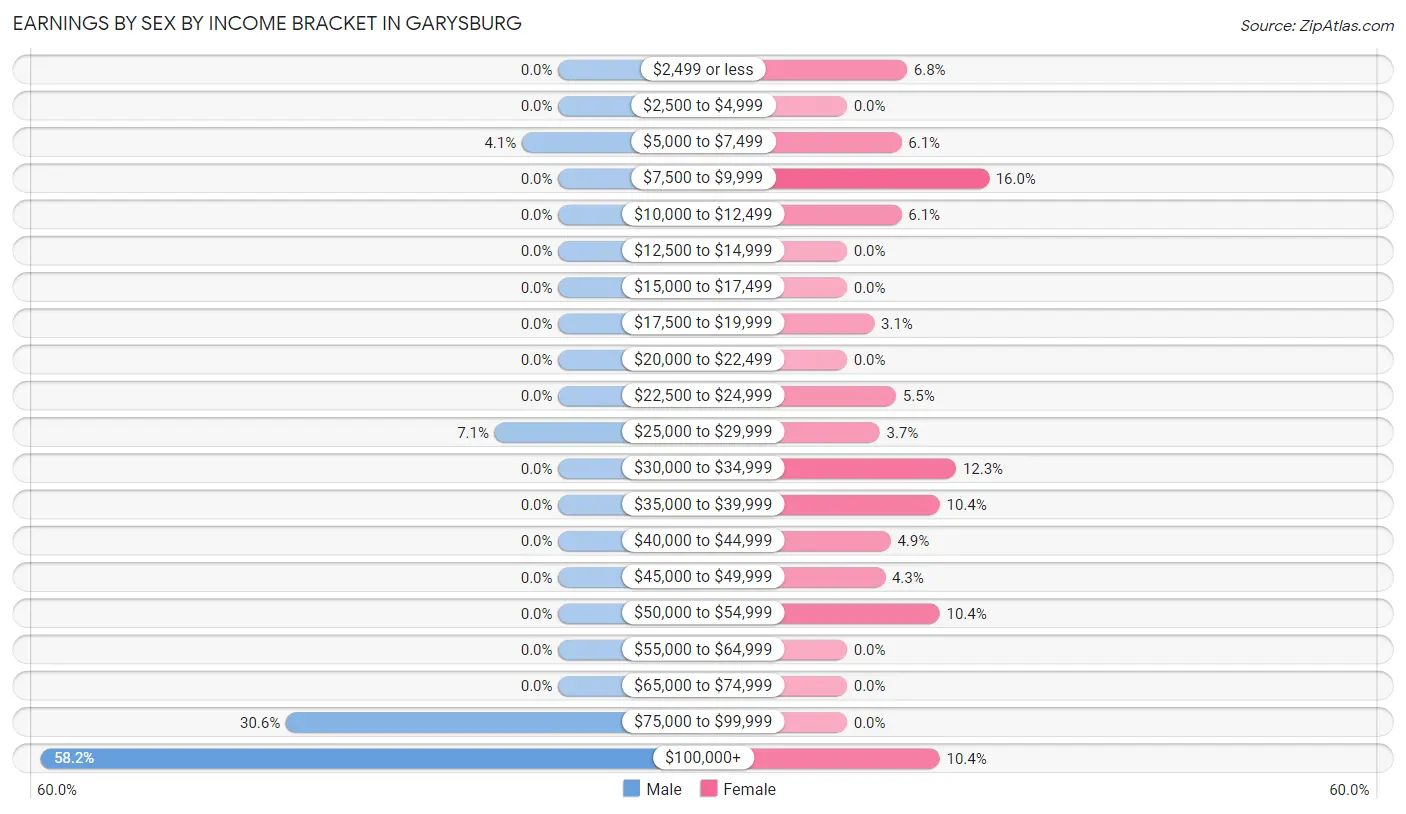
| Income | Male | Female |
| $2,499 or less | 0 (0.0%) | 11 (6.8%) |
| $2,500 to $4,999 | 0 (0.0%) | 0 (0.0%) |
| $5,000 to $7,499 | 4 (4.1%) | 10 (6.1%) |
| $7,500 to $9,999 | 0 (0.0%) | 26 (16.0%) |
| $10,000 to $12,499 | 0 (0.0%) | 10 (6.1%) |
| $12,500 to $14,999 | 0 (0.0%) | 0 (0.0%) |
| $15,000 to $17,499 | 0 (0.0%) | 0 (0.0%) |
| $17,500 to $19,999 | 0 (0.0%) | 5 (3.1%) |
| $20,000 to $22,499 | 0 (0.0%) | 0 (0.0%) |
| $22,500 to $24,999 | 0 (0.0%) | 9 (5.5%) |
| $25,000 to $29,999 | 7 (7.1%) | 6 (3.7%) |
| $30,000 to $34,999 | 0 (0.0%) | 20 (12.3%) |
| $35,000 to $39,999 | 0 (0.0%) | 17 (10.4%) |
| $40,000 to $44,999 | 0 (0.0%) | 8 (4.9%) |
| $45,000 to $49,999 | 0 (0.0%) | 7 (4.3%) |
| $50,000 to $54,999 | 0 (0.0%) | 17 (10.4%) |
| $55,000 to $64,999 | 0 (0.0%) | 0 (0.0%) |
| $65,000 to $74,999 | 0 (0.0%) | 0 (0.0%) |
| $75,000 to $99,999 | 30 (30.6%) | 0 (0.0%) |
| $100,000+ | 57 (58.2%) | 17 (10.4%) |
| Total | 98 (100.0%) | 163 (100.0%) |
Earnings by Sex by Educational Attainment in Garysburg
Average earnings in Garysburg are $162,851 for men and $31,250 for women, a difference of 80.8%. Men with an educational attainment of college or associate's degree enjoy the highest average annual earnings of $90,375, while those with college or associate's degree education earn the least with $90,375. Women with an educational attainment of college or associate's degree earn the most with the average annual earnings of $33,523, while those with high school diploma education have the smallest earnings of $23,194.
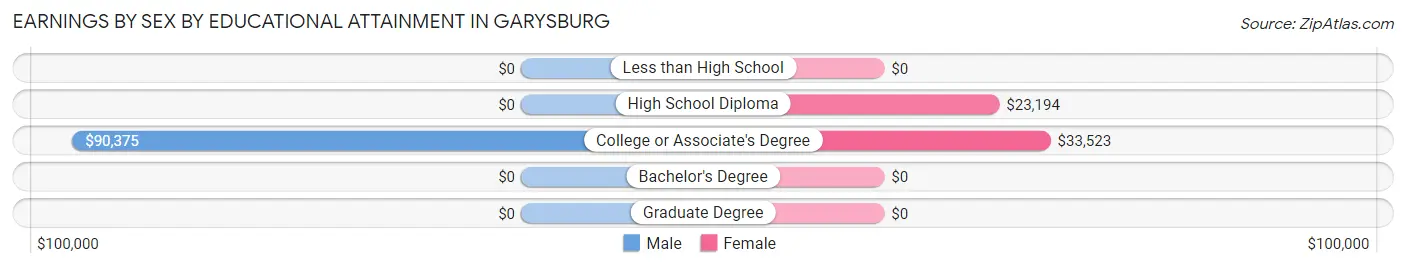
| Educational Attainment | Male Income | Female Income |
| Less than High School | - | - |
| High School Diploma | - | - |
| College or Associate's Degree | $90,375 | $33,523 |
| Bachelor's Degree | - | - |
| Graduate Degree | - | - |
| Total | $162,851 | $31,250 |
Family Income in Garysburg
Family Income Brackets in Garysburg
According to the Garysburg family income data, there are 34 families falling into the $50,000 to $74,999 income range, which is the most common income bracket and makes up 21.0% of all families.
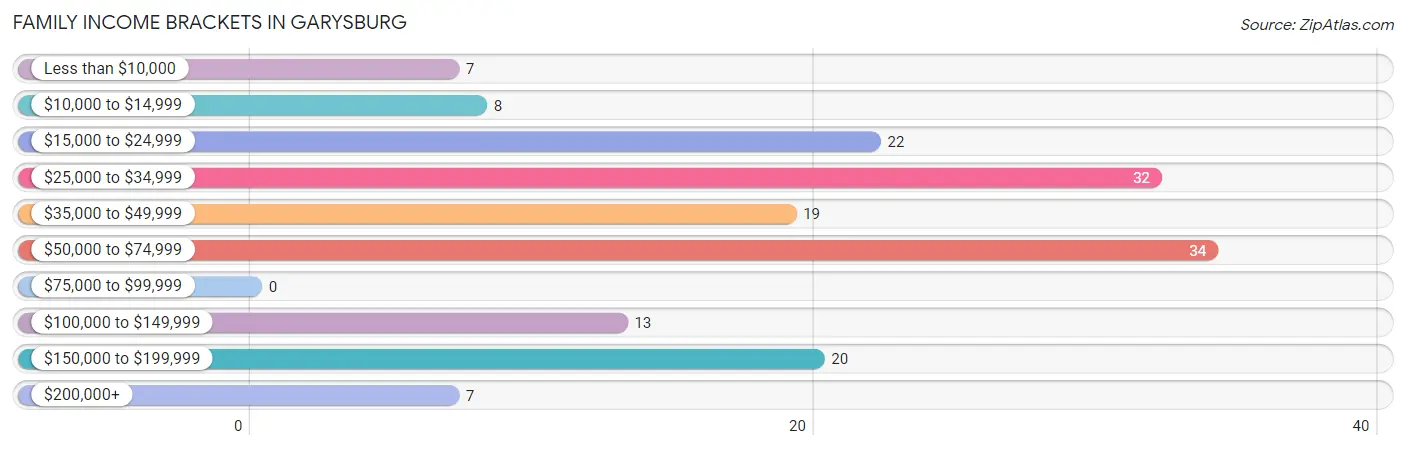
| Income Bracket | # Families | % Families |
| Less than $10,000 | 7 | 4.3% |
| $10,000 to $14,999 | 8 | 4.9% |
| $15,000 to $24,999 | 22 | 13.6% |
| $25,000 to $34,999 | 32 | 19.8% |
| $35,000 to $49,999 | 19 | 11.7% |
| $50,000 to $74,999 | 34 | 21.0% |
| $75,000 to $99,999 | 0 | 0.0% |
| $100,000 to $149,999 | 13 | 8.0% |
| $150,000 to $199,999 | 20 | 12.3% |
| $200,000+ | 7 | 4.3% |
Family Income by Famaliy Size in Garysburg
2-person families (81 | 50.0%) account for the highest median family income in Garysburg with $54,485 per family, while 2-person families (81 | 50.0%) have the highest median income of $27,242 per family member.
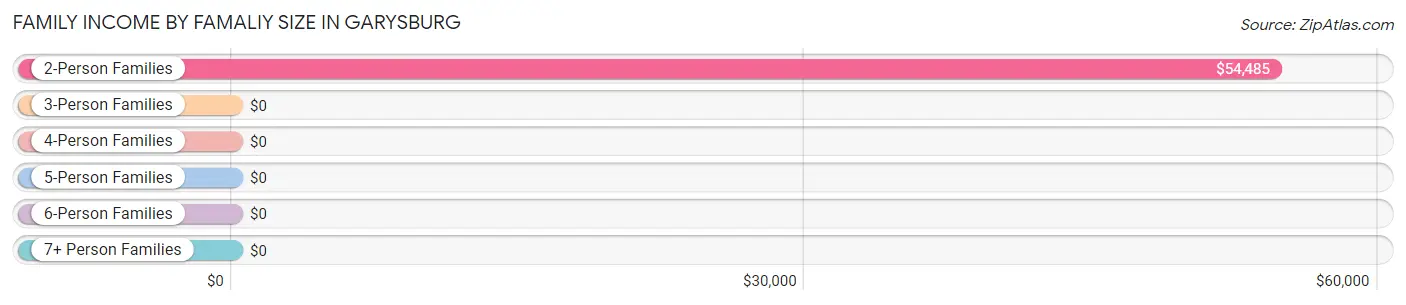
| Income Bracket | # Families | Median Income |
| 2-Person Families | 81 (50.0%) | $54,485 |
| 3-Person Families | 59 (36.4%) | $0 |
| 4-Person Families | 22 (13.6%) | $0 |
| 5-Person Families | 0 (0.0%) | $0 |
| 6-Person Families | 0 (0.0%) | $0 |
| 7+ Person Families | 0 (0.0%) | $0 |
| Total | 162 (100.0%) | $36,579 |
Family Income by Number of Earners in Garysburg
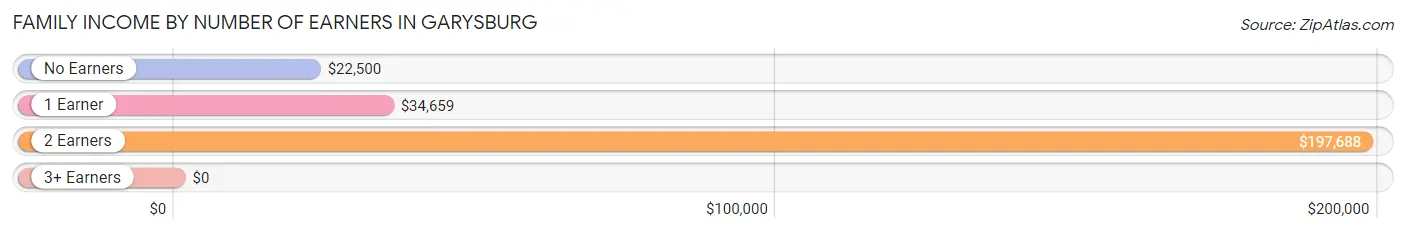
| Number of Earners | # Families | Median Income |
| No Earners | 44 (27.2%) | $22,500 |
| 1 Earner | 67 (41.4%) | $34,659 |
| 2 Earners | 51 (31.5%) | $197,688 |
| 3+ Earners | 0 (0.0%) | $0 |
| Total | 162 (100.0%) | $36,579 |
Household Income in Garysburg
Household Income Brackets in Garysburg
With 70 households falling in the category, the $150,000 to $199,999 income range is the most frequent in Garysburg, accounting for 20.3% of all households. In contrast, only 7 households (2.0%) fall into the $75,000 to $99,999 income bracket, making it the least populous group.
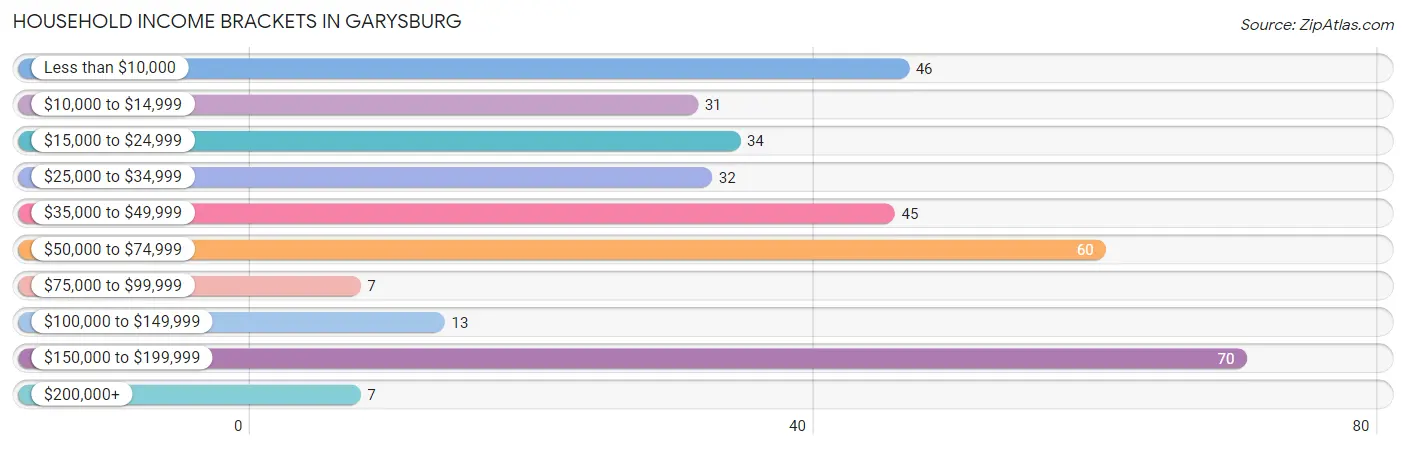
| Income Bracket | # Households | % Households |
| Less than $10,000 | 46 | 13.3% |
| $10,000 to $14,999 | 31 | 9.0% |
| $15,000 to $24,999 | 34 | 9.9% |
| $25,000 to $34,999 | 32 | 9.3% |
| $35,000 to $49,999 | 45 | 13.0% |
| $50,000 to $74,999 | 60 | 17.4% |
| $75,000 to $99,999 | 7 | 2.0% |
| $100,000 to $149,999 | 13 | 3.8% |
| $150,000 to $199,999 | 70 | 20.3% |
| $200,000+ | 7 | 2.0% |
Household Income by Householder Age in Garysburg
| Income Bracket | # Households | Median Income |
| 15 to 24 Years | 0 (0.0%) | $0 |
| 25 to 44 Years | 32 (9.3%) | $0 |
| 45 to 64 Years | 183 (53.0%) | $0 |
| 65+ Years | 130 (37.7%) | $0 |
| Total | 345 (100.0%) | $38,510 |
Poverty in Garysburg
Income Below Poverty by Sex and Age in Garysburg
With 24.2% poverty level for males and 32.3% for females among the residents of Garysburg, 18 to 24 year old males and 16 and 17 year old females are the most vulnerable to poverty, with 11 males (100.0%) and 8 females (100.0%) in their respective age groups living below the poverty level.
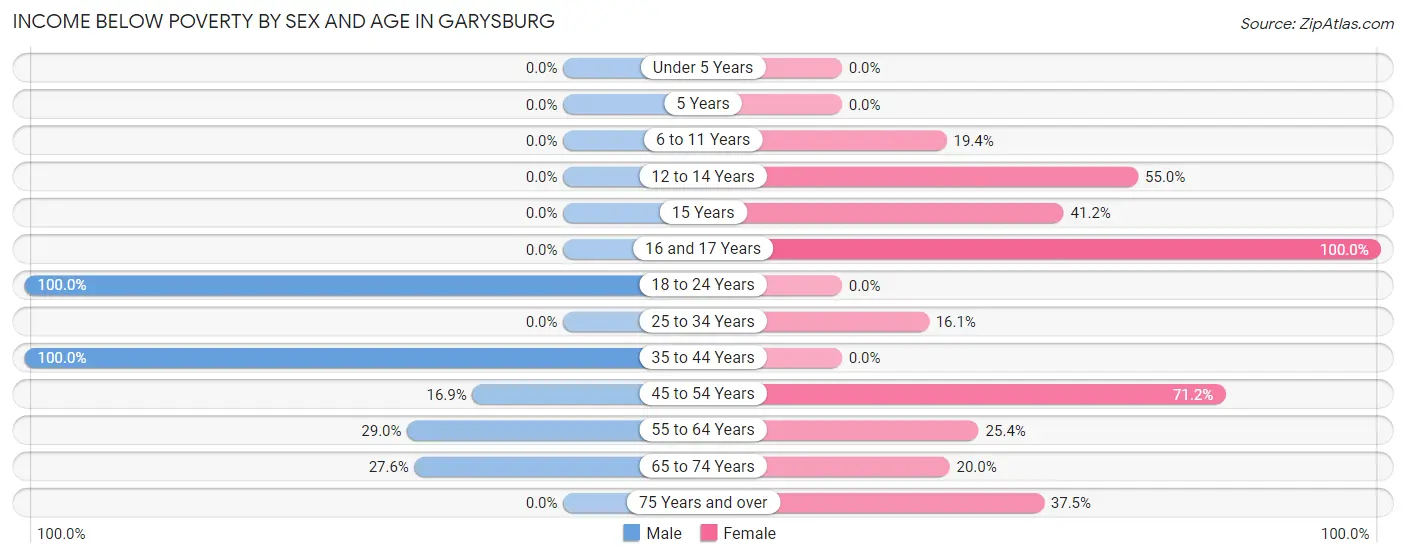
| Age Bracket | Male | Female |
| Under 5 Years | 0 (0.0%) | 0 (0.0%) |
| 5 Years | 0 (0.0%) | 0 (0.0%) |
| 6 to 11 Years | 0 (0.0%) | 7 (19.4%) |
| 12 to 14 Years | 0 (0.0%) | 11 (55.0%) |
| 15 Years | 0 (0.0%) | 7 (41.2%) |
| 16 and 17 Years | 0 (0.0%) | 8 (100.0%) |
| 18 to 24 Years | 11 (100.0%) | 0 (0.0%) |
| 25 to 34 Years | 0 (0.0%) | 5 (16.1%) |
| 35 to 44 Years | 8 (100.0%) | 0 (0.0%) |
| 45 to 54 Years | 15 (16.9%) | 37 (71.2%) |
| 55 to 64 Years | 11 (28.9%) | 16 (25.4%) |
| 65 to 74 Years | 16 (27.6%) | 13 (20.0%) |
| 75 Years and over | 0 (0.0%) | 15 (37.5%) |
| Total | 61 (24.2%) | 119 (32.3%) |
Income Above Poverty by Sex and Age in Garysburg
According to the poverty statistics in Garysburg, males aged 6 to 11 years and females aged 18 to 24 years are the age groups that are most secure financially, with 100.0% of males and 100.0% of females in these age groups living above the poverty line.
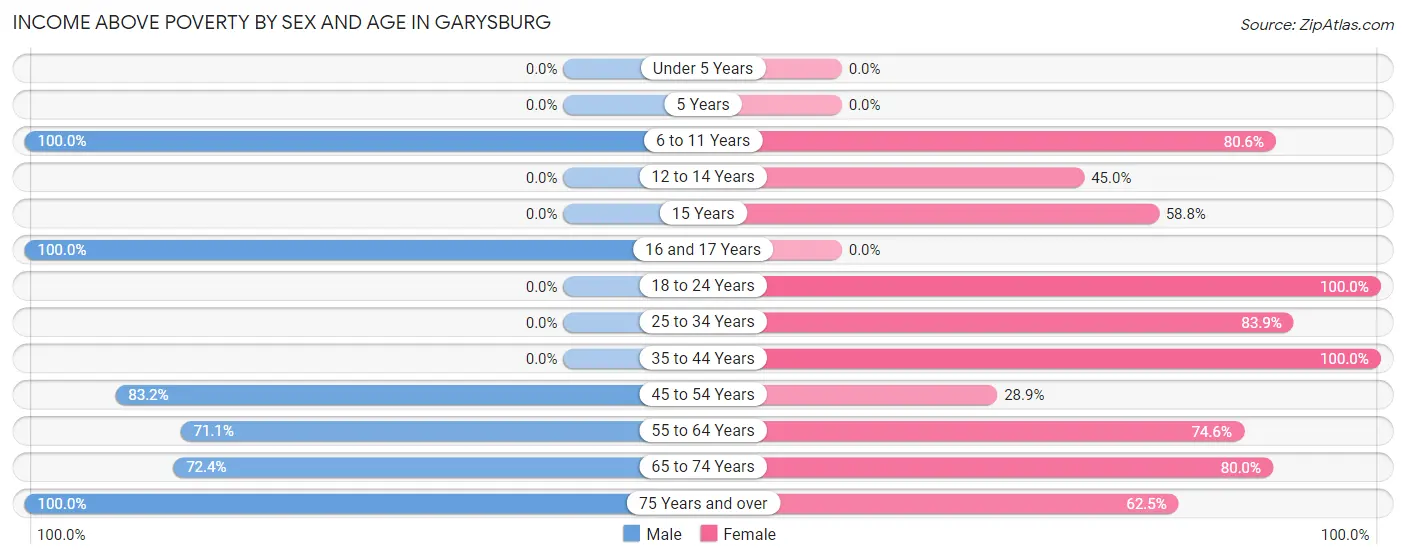
| Age Bracket | Male | Female |
| Under 5 Years | 0 (0.0%) | 0 (0.0%) |
| 5 Years | 0 (0.0%) | 0 (0.0%) |
| 6 to 11 Years | 15 (100.0%) | 29 (80.6%) |
| 12 to 14 Years | 0 (0.0%) | 9 (45.0%) |
| 15 Years | 0 (0.0%) | 10 (58.8%) |
| 16 and 17 Years | 11 (100.0%) | 0 (0.0%) |
| 18 to 24 Years | 0 (0.0%) | 11 (100.0%) |
| 25 to 34 Years | 0 (0.0%) | 26 (83.9%) |
| 35 to 44 Years | 0 (0.0%) | 25 (100.0%) |
| 45 to 54 Years | 74 (83.2%) | 15 (28.8%) |
| 55 to 64 Years | 27 (71.1%) | 47 (74.6%) |
| 65 to 74 Years | 42 (72.4%) | 52 (80.0%) |
| 75 Years and over | 22 (100.0%) | 25 (62.5%) |
| Total | 191 (75.8%) | 249 (67.7%) |
Income Below Poverty Among Married-Couple Families in Garysburg
| Children | Above Poverty | Below Poverty |
| No Children | 57 (100.0%) | 0 (0.0%) |
| 1 or 2 Children | 29 (100.0%) | 0 (0.0%) |
| 3 or 4 Children | 0 (0.0%) | 0 (0.0%) |
| 5 or more Children | 0 (0.0%) | 0 (0.0%) |
| Total | 86 (100.0%) | 0 (0.0%) |
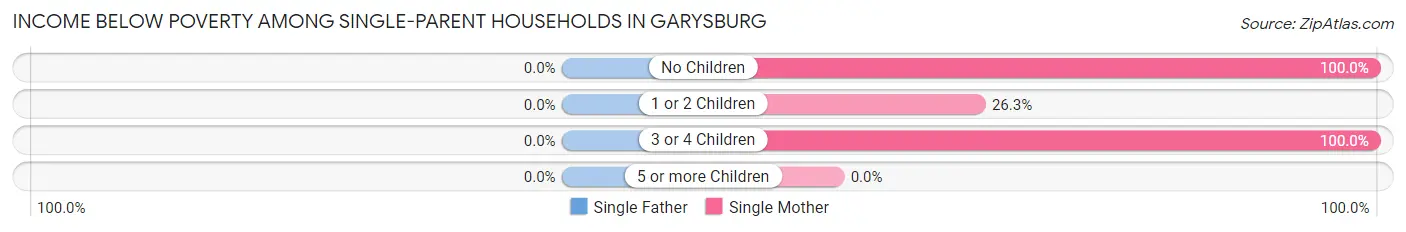
Income Below Poverty Among Single-Parent Households in Garysburg
| Children | Single Father | Single Mother |
| No Children | 0 (0.0%) | 7 (100.0%) |
| 1 or 2 Children | 0 (0.0%) | 15 (26.3%) |
| 3 or 4 Children | 0 (0.0%) | 5 (100.0%) |
| 5 or more Children | 0 (0.0%) | 0 (0.0%) |
| Total | 0 (0.0%) | 27 (39.1%) |
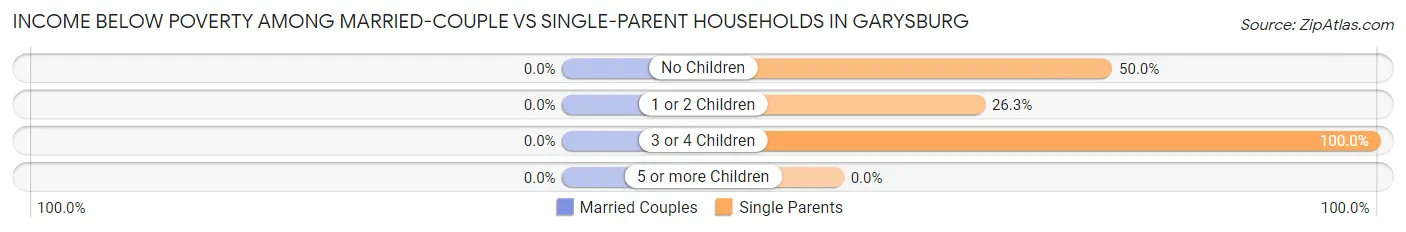
Income Below Poverty Among Married-Couple vs Single-Parent Households in Garysburg
| Children | Married-Couple Families | Single-Parent Households |
| No Children | 0 (0.0%) | 7 (50.0%) |
| 1 or 2 Children | 0 (0.0%) | 15 (26.3%) |
| 3 or 4 Children | 0 (0.0%) | 5 (100.0%) |
| 5 or more Children | 0 (0.0%) | 0 (0.0%) |
| Total | 0 (0.0%) | 27 (35.5%) |
Employment Characteristics in Garysburg
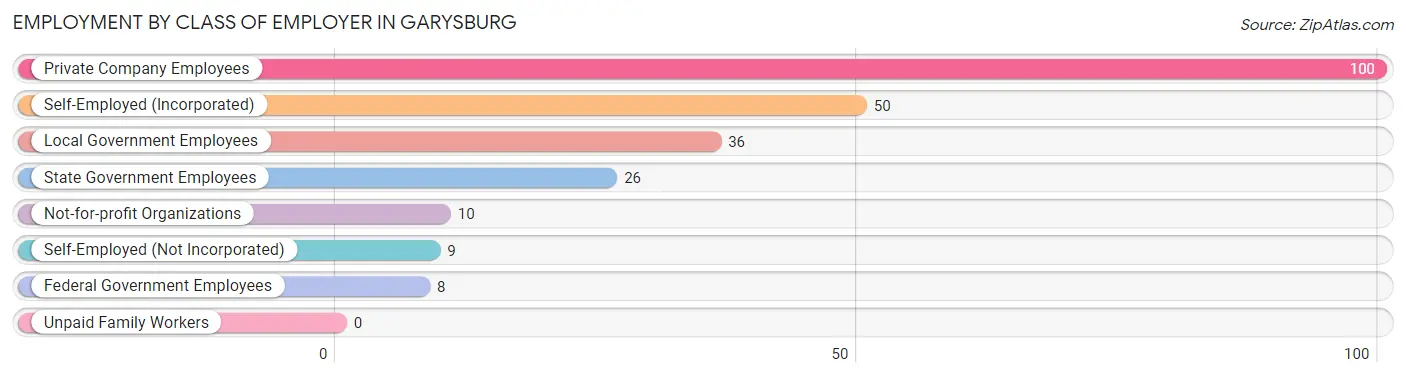
Employment by Class of Employer in Garysburg
Among the 239 employed individuals in Garysburg, private company employees (100 | 41.8%), self-employed (incorporated) (50 | 20.9%), and local government employees (36 | 15.1%) make up the most common classes of employment.
| Employer Class | # Employees | % Employees |
| Private Company Employees | 100 | 41.8% |
| Self-Employed (Incorporated) | 50 | 20.9% |
| Self-Employed (Not Incorporated) | 9 | 3.8% |
| Not-for-profit Organizations | 10 | 4.2% |
| Local Government Employees | 36 | 15.1% |
| State Government Employees | 26 | 10.9% |
| Federal Government Employees | 8 | 3.4% |
| Unpaid Family Workers | 0 | 0.0% |
| Total | 239 | 100.0% |
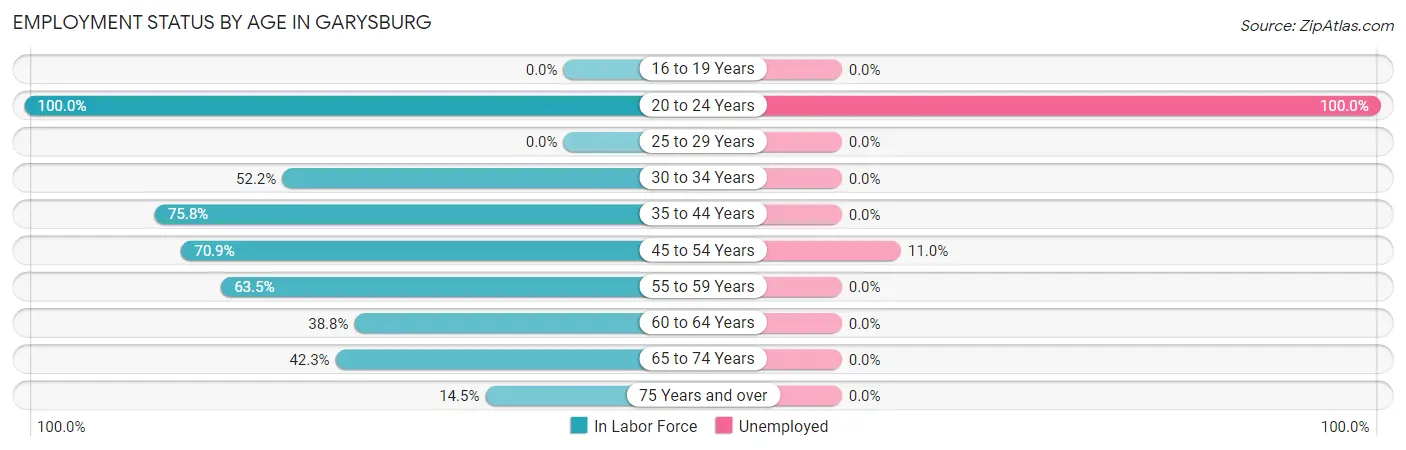
Employment Status by Age in Garysburg
According to the labor force statistics for Garysburg, out of the total population over 16 years of age (532), 49.1% or 261 individuals are in the labor force, with 8.4% or 22 of them unemployed. The age group with the highest labor force participation rate is 20 to 24 years, with 100.0% or 11 individuals in the labor force. Within the labor force, the 20 to 24 years age range has the highest percentage of unemployed individuals, with 100.0% or 11 of them being unemployed.
| Age Bracket | In Labor Force | Unemployed |
| 16 to 19 Years | 0 (0.0%) | 0 (0.0%) |
| 20 to 24 Years | 11 (100.0%) | 11 (100.0%) |
| 25 to 29 Years | 0 (0.0%) | 0 (0.0%) |
| 30 to 34 Years | 12 (52.2%) | 0 (0.0%) |
| 35 to 44 Years | 25 (75.8%) | 0 (0.0%) |
| 45 to 54 Years | 100 (70.9%) | 11 (11.0%) |
| 55 to 59 Years | 33 (63.5%) | 0 (0.0%) |
| 60 to 64 Years | 19 (38.8%) | 0 (0.0%) |
| 65 to 74 Years | 52 (42.3%) | 0 (0.0%) |
| 75 Years and over | 9 (14.5%) | 0 (0.0%) |
| Total | 261 (49.1%) | 22 (8.4%) |
Employment Status by Educational Attainment in Garysburg
According to labor force statistics for Garysburg, 61.8% of individuals (189) out of the total population between 25 and 64 years of age (306) are in the labor force, with 5.8% or 11 of them being unemployed. The group with the highest labor force participation rate are those with the educational attainment of bachelor's degree or higher, with 100.0% or 84 individuals in the labor force. Within the labor force, individuals with high school diploma education have the highest percentage of unemployment, with 24.4% or 11 of them being unemployed.
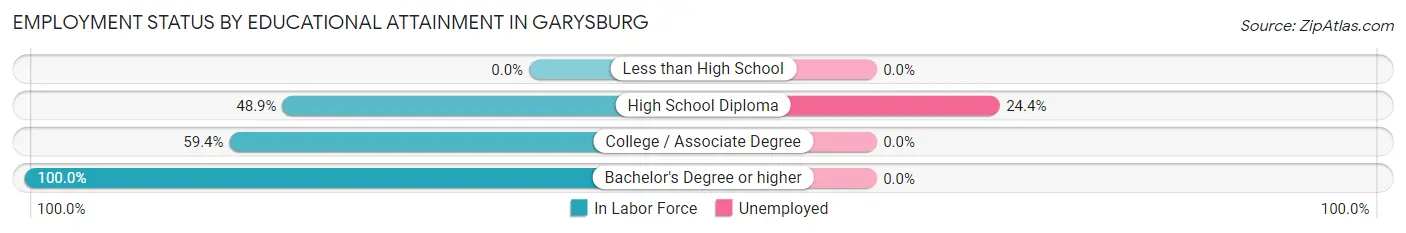
| Educational Attainment | In Labor Force | Unemployed |
| Less than High School | 0 (0.0%) | 0 (0.0%) |
| High School Diploma | 45 (48.9%) | 22 (24.4%) |
| College / Associate Degree | 60 (59.4%) | 0 (0.0%) |
| Bachelor's Degree or higher | 84 (100.0%) | 0 (0.0%) |
| Total | 189 (61.8%) | 18 (5.8%) |
Employment Occupations by Sex in Garysburg
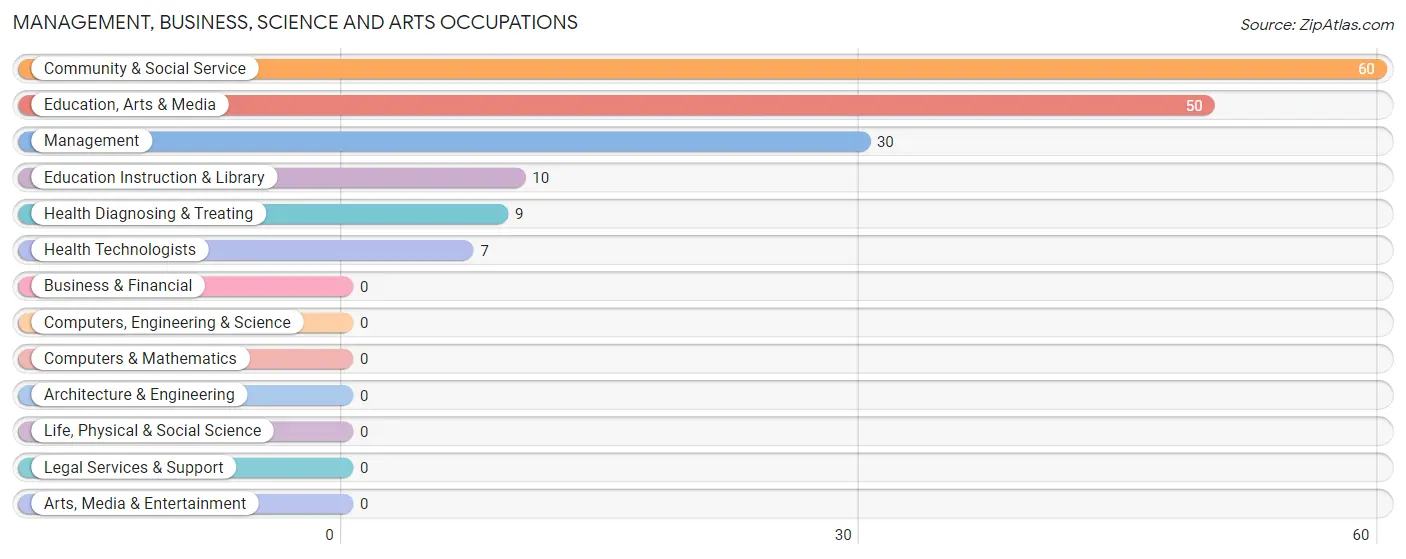
Management, Business, Science and Arts Occupations
The most common Management, Business, Science and Arts occupations in Garysburg are Community & Social Service (60 | 25.1%), Education, Arts & Media (50 | 20.9%), Management (30 | 12.6%), Education Instruction & Library (10 | 4.2%), and Health Diagnosing & Treating (9 | 3.8%).
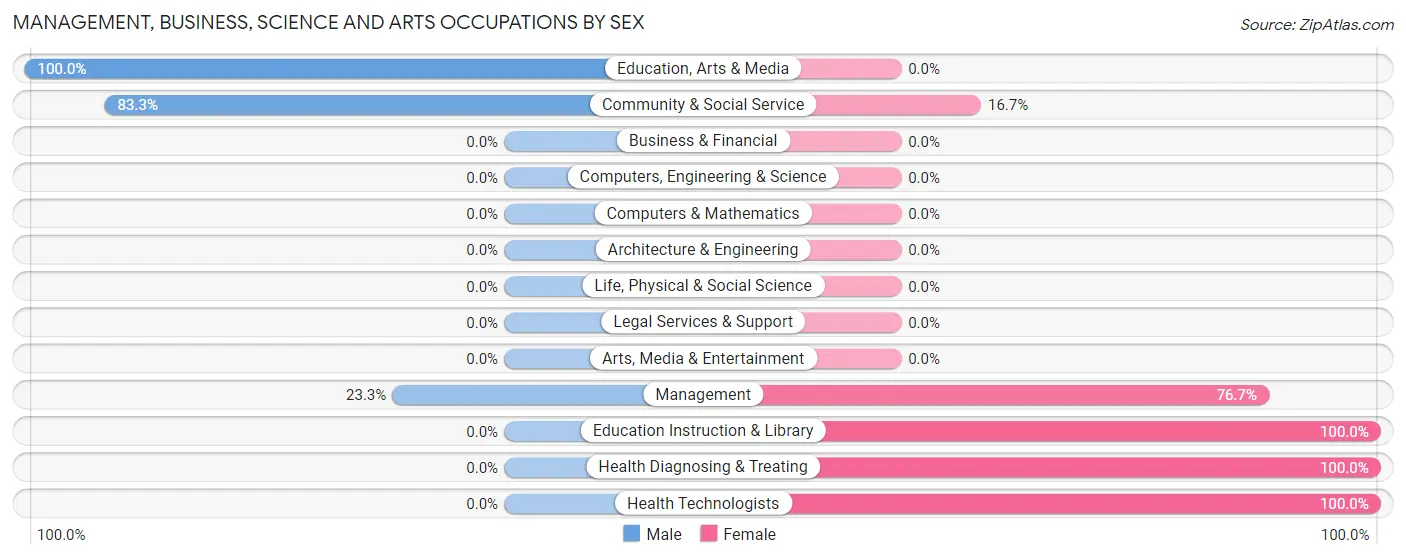
Management, Business, Science and Arts Occupations by Sex
Within the Management, Business, Science and Arts occupations in Garysburg, the most male-oriented occupations are Education, Arts & Media (100.0%), Community & Social Service (83.3%), and Management (23.3%), while the most female-oriented occupations are Education Instruction & Library (100.0%), Health Diagnosing & Treating (100.0%), and Health Technologists (100.0%).
| Occupation | Male | Female |
| Management | 7 (23.3%) | 23 (76.7%) |
| Business & Financial | 0 (0.0%) | 0 (0.0%) |
| Computers, Engineering & Science | 0 (0.0%) | 0 (0.0%) |
| Computers & Mathematics | 0 (0.0%) | 0 (0.0%) |
| Architecture & Engineering | 0 (0.0%) | 0 (0.0%) |
| Life, Physical & Social Science | 0 (0.0%) | 0 (0.0%) |
| Community & Social Service | 50 (83.3%) | 10 (16.7%) |
| Education, Arts & Media | 50 (100.0%) | 0 (0.0%) |
| Legal Services & Support | 0 (0.0%) | 0 (0.0%) |
| Education Instruction & Library | 0 (0.0%) | 10 (100.0%) |
| Arts, Media & Entertainment | 0 (0.0%) | 0 (0.0%) |
| Health Diagnosing & Treating | 0 (0.0%) | 9 (100.0%) |
| Health Technologists | 0 (0.0%) | 7 (100.0%) |
| Total (Category) | 57 (57.6%) | 42 (42.4%) |
| Total (Overall) | 98 (41.0%) | 141 (59.0%) |
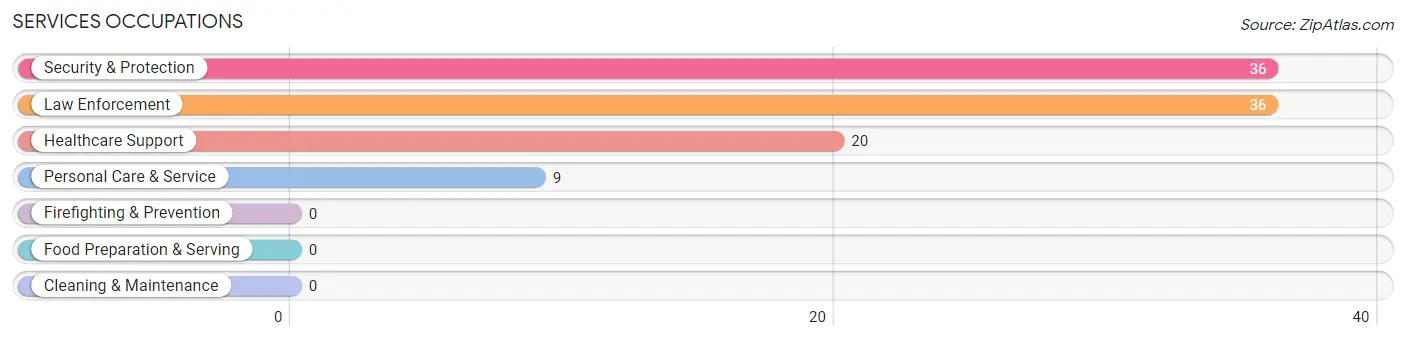
Services Occupations
The most common Services occupations in Garysburg are Security & Protection (36 | 15.1%), Law Enforcement (36 | 15.1%), Healthcare Support (20 | 8.4%), and Personal Care & Service (9 | 3.8%).
Services Occupations by Sex
Within the Services occupations in Garysburg, the most male-oriented occupations are Security & Protection (55.6%), and Law Enforcement (55.6%), while the most female-oriented occupations are Healthcare Support (100.0%), Personal Care & Service (100.0%), and Security & Protection (44.4%).
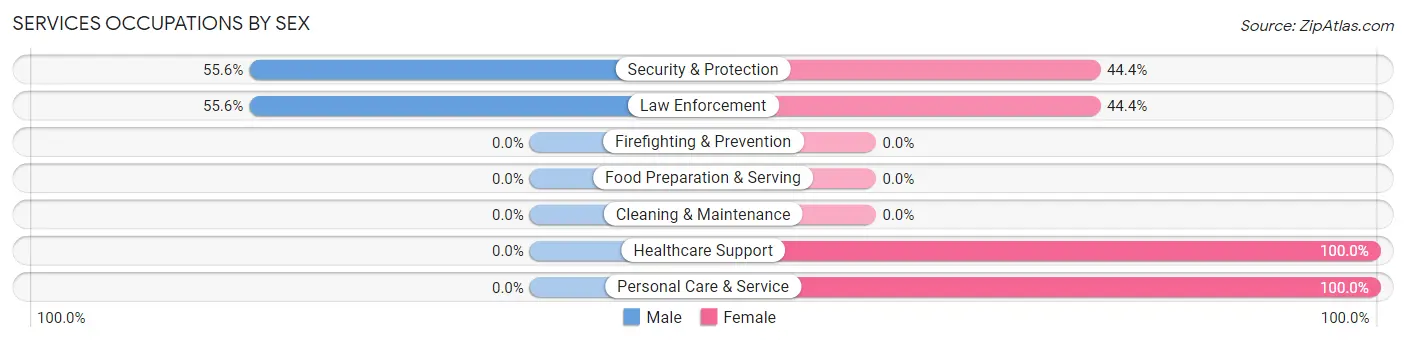
| Occupation | Male | Female |
| Healthcare Support | 0 (0.0%) | 20 (100.0%) |
| Security & Protection | 20 (55.6%) | 16 (44.4%) |
| Firefighting & Prevention | 0 (0.0%) | 0 (0.0%) |
| Law Enforcement | 20 (55.6%) | 16 (44.4%) |
| Food Preparation & Serving | 0 (0.0%) | 0 (0.0%) |
| Cleaning & Maintenance | 0 (0.0%) | 0 (0.0%) |
| Personal Care & Service | 0 (0.0%) | 9 (100.0%) |
| Total (Category) | 20 (30.8%) | 45 (69.2%) |
| Total (Overall) | 98 (41.0%) | 141 (59.0%) |
Sales and Office Occupations
The most common Sales and Office occupations in Garysburg are Office & Administration (43 | 18.0%), and Sales & Related (4 | 1.7%).
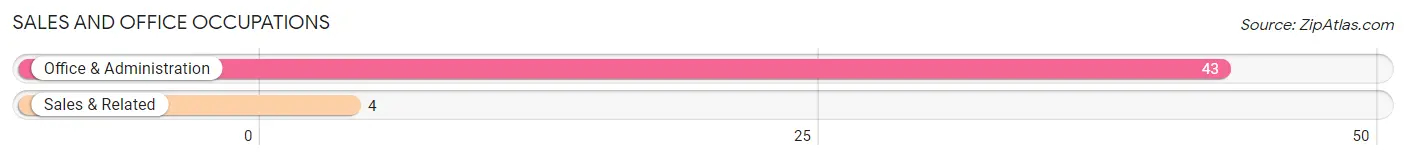
Sales and Office Occupations by Sex

| Occupation | Male | Female |
| Sales & Related | 4 (100.0%) | 0 (0.0%) |
| Office & Administration | 0 (0.0%) | 43 (100.0%) |
| Total (Category) | 4 (8.5%) | 43 (91.5%) |
| Total (Overall) | 98 (41.0%) | 141 (59.0%) |
Natural Resources, Construction and Maintenance Occupations
The most common Natural Resources, Construction and Maintenance occupations in Garysburg are , and Installation, Maintenance & Repair (10 | 4.2%).
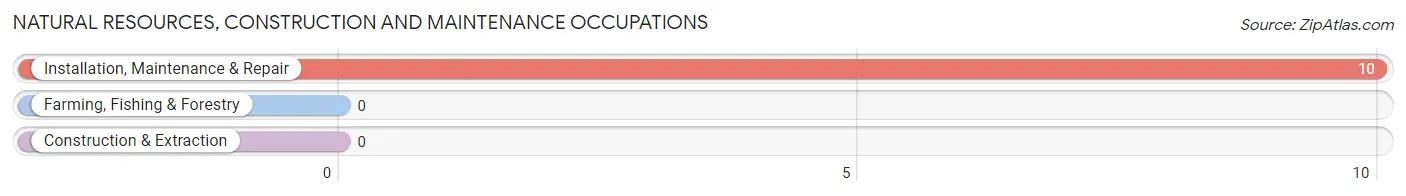
Natural Resources, Construction and Maintenance Occupations by Sex
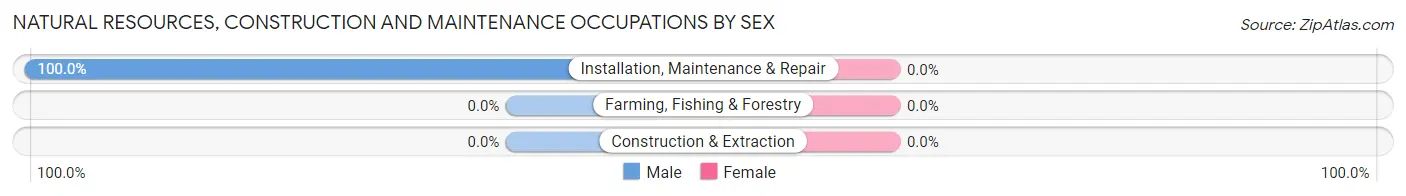
| Occupation | Male | Female |
| Farming, Fishing & Forestry | 0 (0.0%) | 0 (0.0%) |
| Construction & Extraction | 0 (0.0%) | 0 (0.0%) |
| Installation, Maintenance & Repair | 10 (100.0%) | 0 (0.0%) |
| Total (Category) | 10 (100.0%) | 0 (0.0%) |
| Total (Overall) | 98 (41.0%) | 141 (59.0%) |
Production, Transportation and Moving Occupations
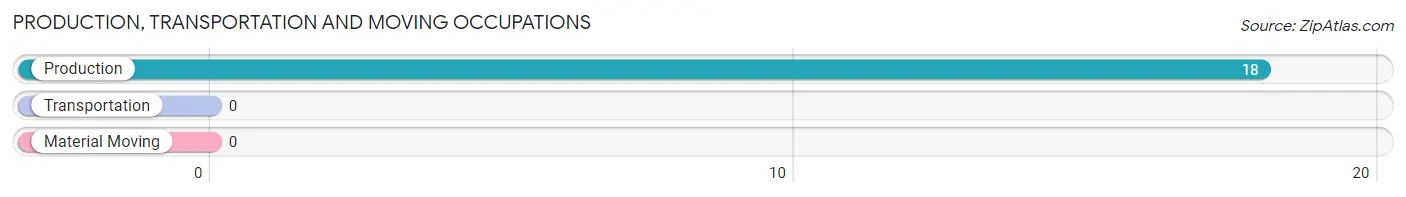
The most common Production, Transportation and Moving occupations in Garysburg are , and Production (18 | 7.5%).
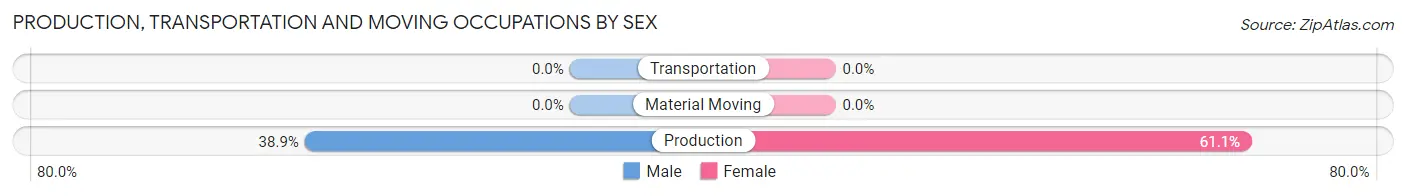
Production, Transportation and Moving Occupations by Sex
| Occupation | Male | Female |
| Production | 7 (38.9%) | 11 (61.1%) |
| Transportation | 0 (0.0%) | 0 (0.0%) |
| Material Moving | 0 (0.0%) | 0 (0.0%) |
| Total (Category) | 7 (38.9%) | 11 (61.1%) |
| Total (Overall) | 98 (41.0%) | 141 (59.0%) |
Employment Industries by Sex in Garysburg
Employment Industries in Garysburg
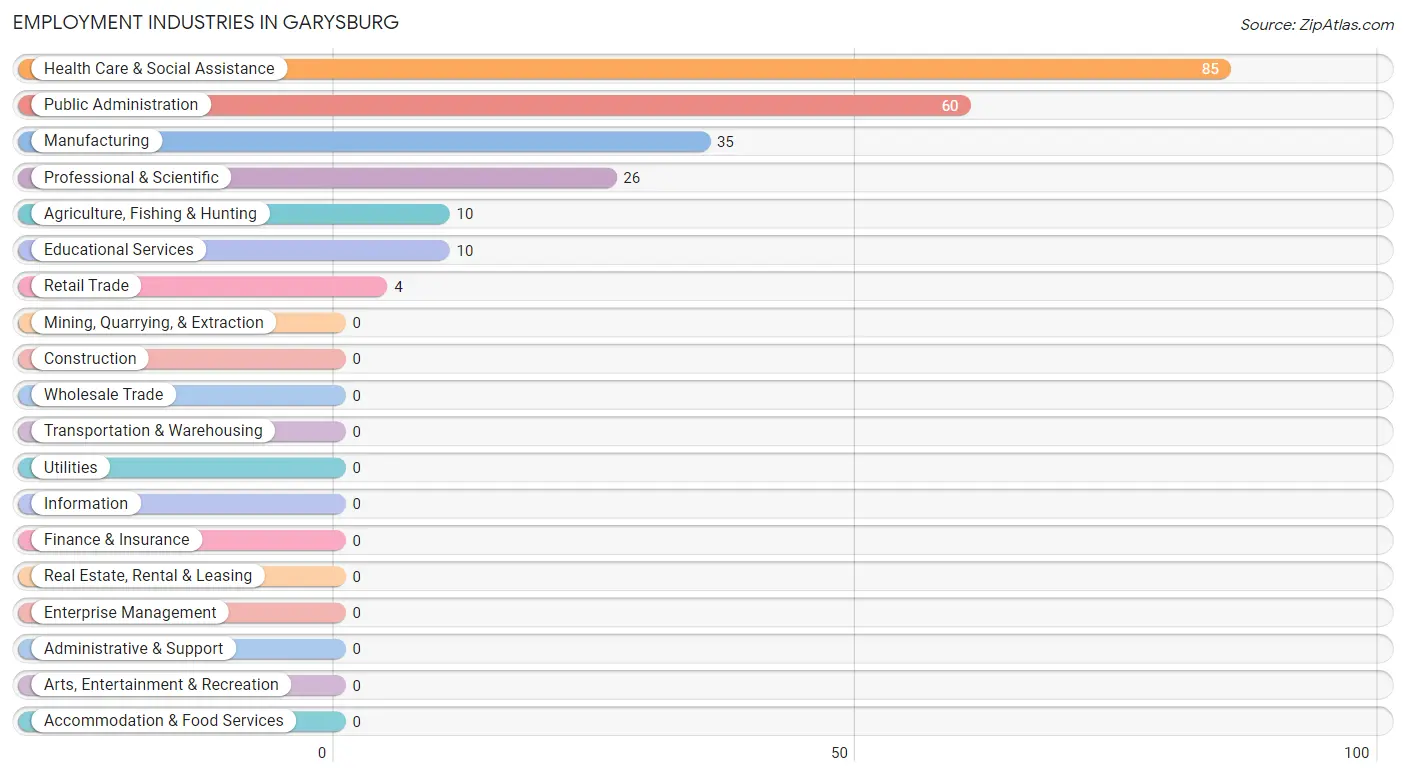
The major employment industries in Garysburg include Health Care & Social Assistance (85 | 35.6%), Public Administration (60 | 25.1%), Manufacturing (35 | 14.6%), Professional & Scientific (26 | 10.9%), and Agriculture, Fishing & Hunting (10 | 4.2%).
Employment Industries by Sex in Garysburg
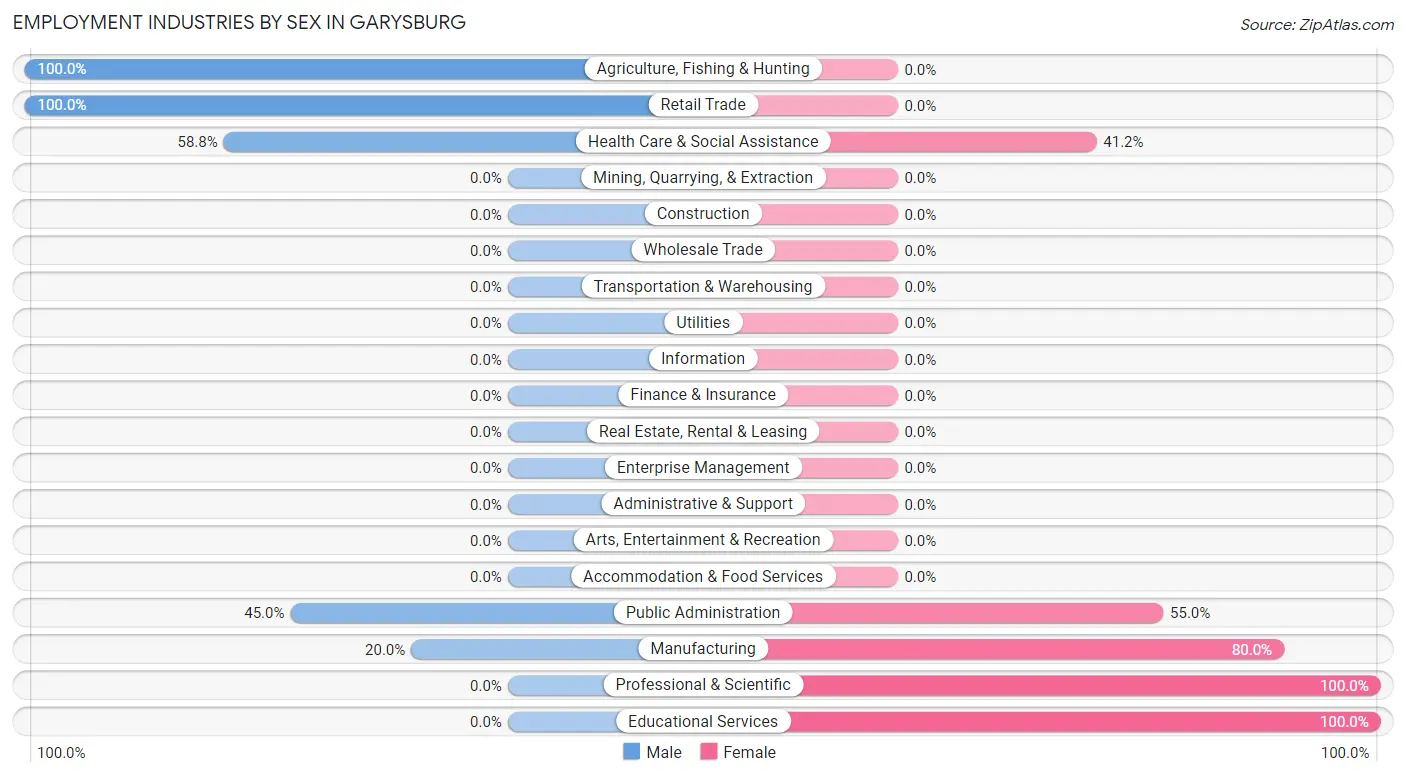
The Garysburg industries that see more men than women are Agriculture, Fishing & Hunting (100.0%), Retail Trade (100.0%), and Health Care & Social Assistance (58.8%), whereas the industries that tend to have a higher number of women are Professional & Scientific (100.0%), Educational Services (100.0%), and Manufacturing (80.0%).
| Industry | Male | Female |
| Agriculture, Fishing & Hunting | 10 (100.0%) | 0 (0.0%) |
| Mining, Quarrying, & Extraction | 0 (0.0%) | 0 (0.0%) |
| Construction | 0 (0.0%) | 0 (0.0%) |
| Manufacturing | 7 (20.0%) | 28 (80.0%) |
| Wholesale Trade | 0 (0.0%) | 0 (0.0%) |
| Retail Trade | 4 (100.0%) | 0 (0.0%) |
| Transportation & Warehousing | 0 (0.0%) | 0 (0.0%) |
| Utilities | 0 (0.0%) | 0 (0.0%) |
| Information | 0 (0.0%) | 0 (0.0%) |
| Finance & Insurance | 0 (0.0%) | 0 (0.0%) |
| Real Estate, Rental & Leasing | 0 (0.0%) | 0 (0.0%) |
| Professional & Scientific | 0 (0.0%) | 26 (100.0%) |
| Enterprise Management | 0 (0.0%) | 0 (0.0%) |
| Administrative & Support | 0 (0.0%) | 0 (0.0%) |
| Educational Services | 0 (0.0%) | 10 (100.0%) |
| Health Care & Social Assistance | 50 (58.8%) | 35 (41.2%) |
| Arts, Entertainment & Recreation | 0 (0.0%) | 0 (0.0%) |
| Accommodation & Food Services | 0 (0.0%) | 0 (0.0%) |
| Public Administration | 27 (45.0%) | 33 (55.0%) |
| Total | 98 (41.0%) | 141 (59.0%) |
Education in Garysburg
School Enrollment in Garysburg
The most common levels of schooling among the 117 students in Garysburg are high school (51 | 43.6%), middle school (23 | 19.7%), and elementary school (21 | 17.9%).
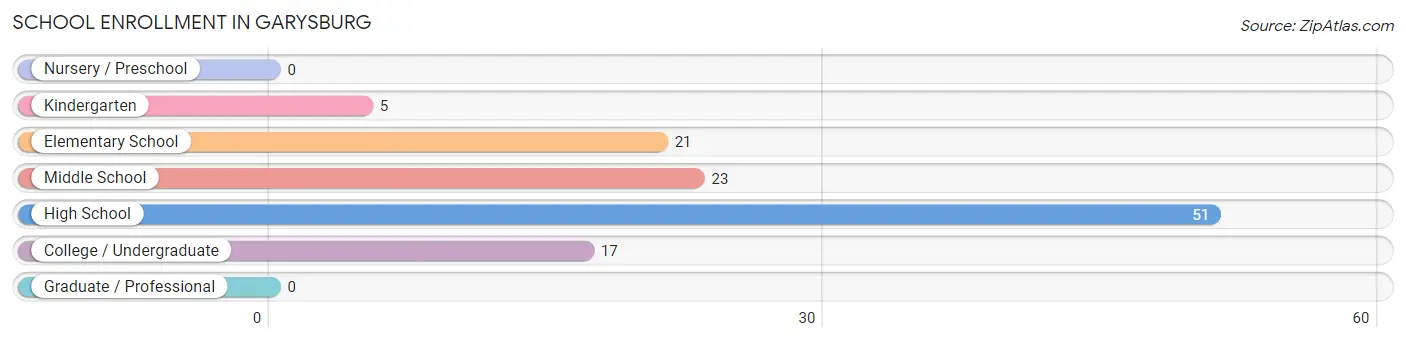
| School Level | # Students | % Students |
| Nursery / Preschool | 0 | 0.0% |
| Kindergarten | 5 | 4.3% |
| Elementary School | 21 | 17.9% |
| Middle School | 23 | 19.7% |
| High School | 51 | 43.6% |
| College / Undergraduate | 17 | 14.5% |
| Graduate / Professional | 0 | 0.0% |
| Total | 117 | 100.0% |
School Enrollment by Age by Funding Source in Garysburg
Out of a total of 117 students who are enrolled in schools in Garysburg, 10 (8.5%) attend a private institution, while the remaining 107 (91.5%) are enrolled in public schools. The age group of 35 years and over has the highest likelihood of being enrolled in private schools, with 10 (58.8% in the age bracket) enrolled. Conversely, the age group of 5 to 9 year old has the lowest likelihood of being enrolled in a private school, with 26 (100.0% in the age bracket) attending a public institution.
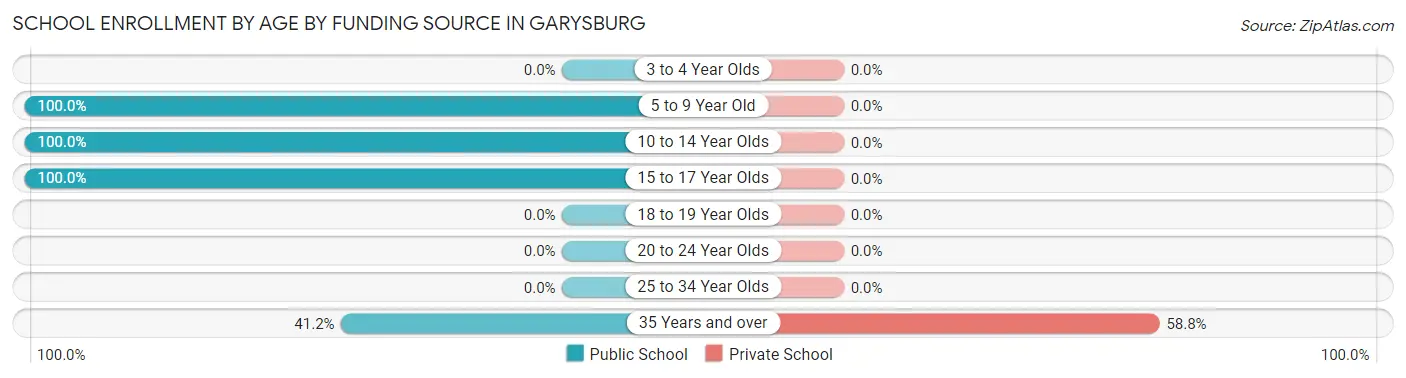
| Age Bracket | Public School | Private School |
| 3 to 4 Year Olds | 0 (0.0%) | 0 (0.0%) |
| 5 to 9 Year Old | 26 (100.0%) | 0 (0.0%) |
| 10 to 14 Year Olds | 38 (100.0%) | 0 (0.0%) |
| 15 to 17 Year Olds | 36 (100.0%) | 0 (0.0%) |
| 18 to 19 Year Olds | 0 (0.0%) | 0 (0.0%) |
| 20 to 24 Year Olds | 0 (0.0%) | 0 (0.0%) |
| 25 to 34 Year Olds | 0 (0.0%) | 0 (0.0%) |
| 35 Years and over | 7 (41.2%) | 10 (58.8%) |
| Total | 107 (91.5%) | 10 (8.5%) |
Educational Attainment by Field of Study in Garysburg
Psychology (76 | 42.9%), liberal arts & history (35 | 19.8%), social sciences (26 | 14.7%), education (13 | 7.3%), and bio, nature & agricultural (10 | 5.7%) are the most common fields of study among 177 individuals in Garysburg who have obtained a bachelor's degree or higher.
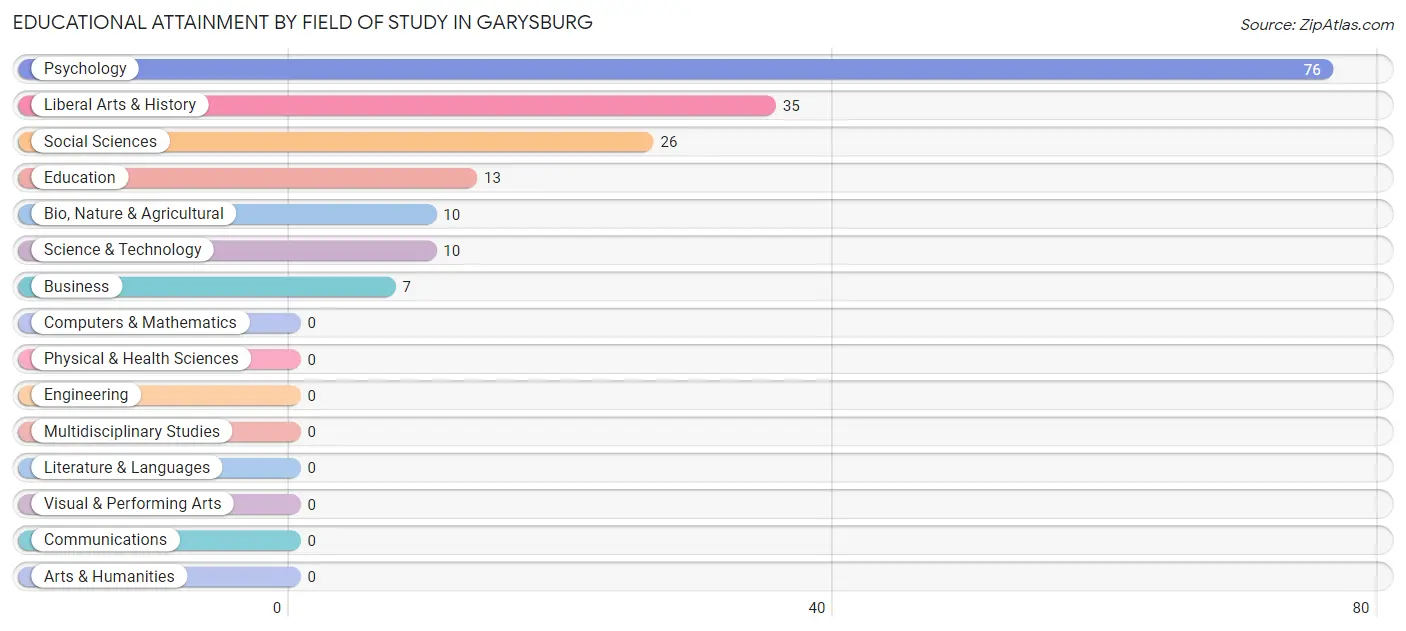
| Field of Study | # Graduates | % Graduates |
| Computers & Mathematics | 0 | 0.0% |
| Bio, Nature & Agricultural | 10 | 5.7% |
| Physical & Health Sciences | 0 | 0.0% |
| Psychology | 76 | 42.9% |
| Social Sciences | 26 | 14.7% |
| Engineering | 0 | 0.0% |
| Multidisciplinary Studies | 0 | 0.0% |
| Science & Technology | 10 | 5.7% |
| Business | 7 | 4.0% |
| Education | 13 | 7.3% |
| Literature & Languages | 0 | 0.0% |
| Liberal Arts & History | 35 | 19.8% |
| Visual & Performing Arts | 0 | 0.0% |
| Communications | 0 | 0.0% |
| Arts & Humanities | 0 | 0.0% |
| Total | 177 | 100.0% |
Transportation & Commute in Garysburg
Vehicle Availability by Sex in Garysburg
The most prevalent vehicle ownership categories in Garysburg are males with 2 vehicles (54, accounting for 55.1%) and females with 2 vehicles (62, making up 38.3%).
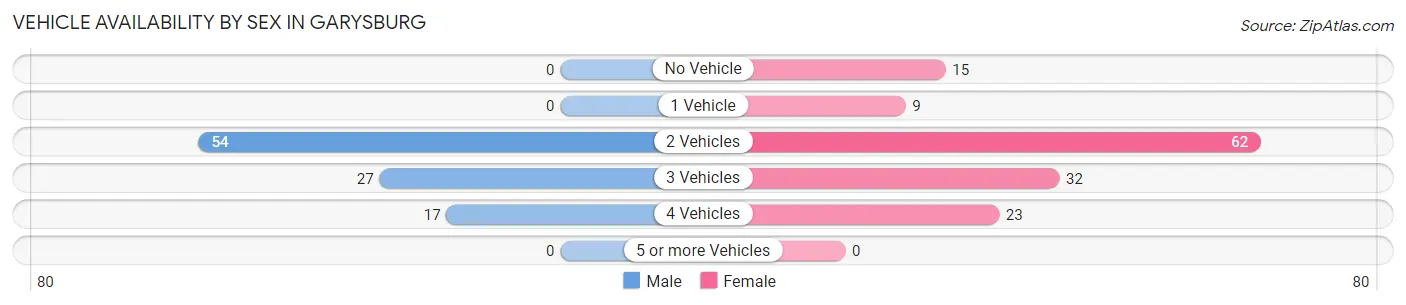
| Vehicles Available | Male | Female |
| No Vehicle | 0 (0.0%) | 15 (10.6%) |
| 1 Vehicle | 0 (0.0%) | 9 (6.4%) |
| 2 Vehicles | 54 (55.1%) | 62 (44.0%) |
| 3 Vehicles | 27 (27.6%) | 32 (22.7%) |
| 4 Vehicles | 17 (17.3%) | 23 (16.3%) |
| 5 or more Vehicles | 0 (0.0%) | 0 (0.0%) |
| Total | 98 (100.0%) | 141 (100.0%) |
Commute Time in Garysburg
The most frequently occuring commute durations in Garysburg are 30 to 34 minutes (75 commuters, 31.4%), less than 5 minutes (50 commuters, 20.9%), and 10 to 14 minutes (20 commuters, 8.4%).
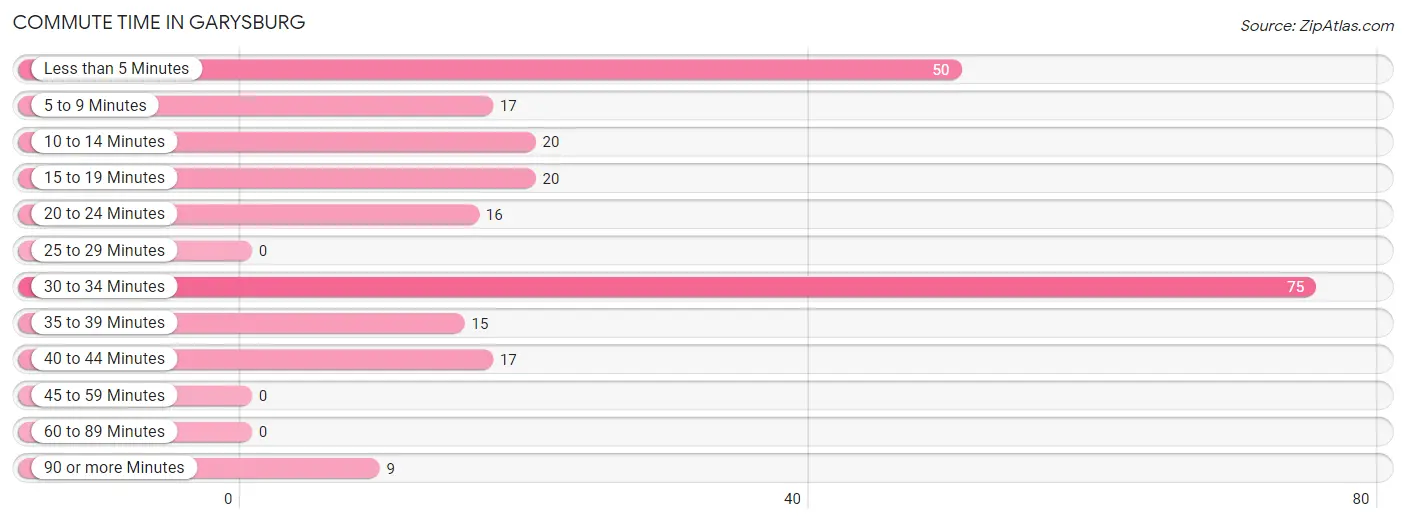
| Commute Time | # Commuters | % Commuters |
| Less than 5 Minutes | 50 | 20.9% |
| 5 to 9 Minutes | 17 | 7.1% |
| 10 to 14 Minutes | 20 | 8.4% |
| 15 to 19 Minutes | 20 | 8.4% |
| 20 to 24 Minutes | 16 | 6.7% |
| 25 to 29 Minutes | 0 | 0.0% |
| 30 to 34 Minutes | 75 | 31.4% |
| 35 to 39 Minutes | 15 | 6.3% |
| 40 to 44 Minutes | 17 | 7.1% |
| 45 to 59 Minutes | 0 | 0.0% |
| 60 to 89 Minutes | 0 | 0.0% |
| 90 or more Minutes | 9 | 3.8% |
Commute Time by Sex in Garysburg
The most common commute times in Garysburg are less than 5 minutes (50 commuters, 51.0%) for males and 30 to 34 minutes (75 commuters, 53.2%) for females.
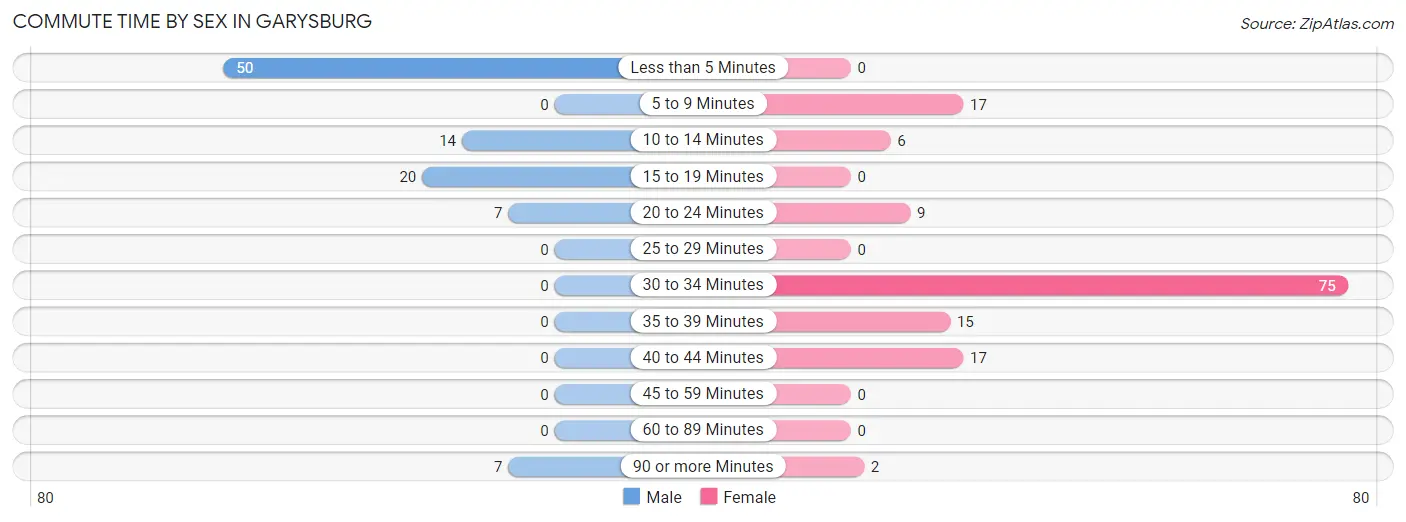
| Commute Time | Male | Female |
| Less than 5 Minutes | 50 (51.0%) | 0 (0.0%) |
| 5 to 9 Minutes | 0 (0.0%) | 17 (12.1%) |
| 10 to 14 Minutes | 14 (14.3%) | 6 (4.3%) |
| 15 to 19 Minutes | 20 (20.4%) | 0 (0.0%) |
| 20 to 24 Minutes | 7 (7.1%) | 9 (6.4%) |
| 25 to 29 Minutes | 0 (0.0%) | 0 (0.0%) |
| 30 to 34 Minutes | 0 (0.0%) | 75 (53.2%) |
| 35 to 39 Minutes | 0 (0.0%) | 15 (10.6%) |
| 40 to 44 Minutes | 0 (0.0%) | 17 (12.1%) |
| 45 to 59 Minutes | 0 (0.0%) | 0 (0.0%) |
| 60 to 89 Minutes | 0 (0.0%) | 0 (0.0%) |
| 90 or more Minutes | 7 (7.1%) | 2 (1.4%) |
Time of Departure to Work by Sex in Garysburg
The most frequent times of departure to work in Garysburg are 8:00 AM to 8:29 AM (50, 51.0%) for males and 7:00 AM to 7:29 AM (35, 24.8%) for females.
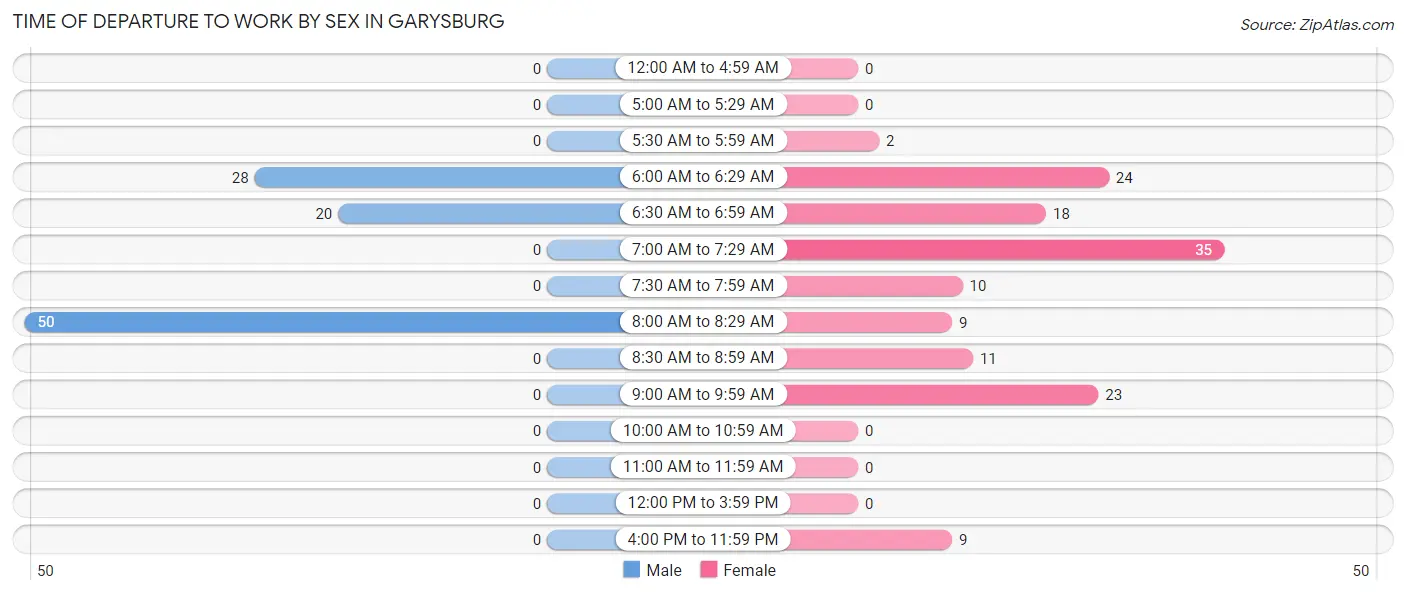
| Time of Departure | Male | Female |
| 12:00 AM to 4:59 AM | 0 (0.0%) | 0 (0.0%) |
| 5:00 AM to 5:29 AM | 0 (0.0%) | 0 (0.0%) |
| 5:30 AM to 5:59 AM | 0 (0.0%) | 2 (1.4%) |
| 6:00 AM to 6:29 AM | 28 (28.6%) | 24 (17.0%) |
| 6:30 AM to 6:59 AM | 20 (20.4%) | 18 (12.8%) |
| 7:00 AM to 7:29 AM | 0 (0.0%) | 35 (24.8%) |
| 7:30 AM to 7:59 AM | 0 (0.0%) | 10 (7.1%) |
| 8:00 AM to 8:29 AM | 50 (51.0%) | 9 (6.4%) |
| 8:30 AM to 8:59 AM | 0 (0.0%) | 11 (7.8%) |
| 9:00 AM to 9:59 AM | 0 (0.0%) | 23 (16.3%) |
| 10:00 AM to 10:59 AM | 0 (0.0%) | 0 (0.0%) |
| 11:00 AM to 11:59 AM | 0 (0.0%) | 0 (0.0%) |
| 12:00 PM to 3:59 PM | 0 (0.0%) | 0 (0.0%) |
| 4:00 PM to 11:59 PM | 0 (0.0%) | 9 (6.4%) |
| Total | 98 (100.0%) | 141 (100.0%) |
Housing Occupancy in Garysburg
Occupancy by Ownership in Garysburg
Of the total 345 dwellings in Garysburg, owner-occupied units account for 231 (67.0%), while renter-occupied units make up 114 (33.0%).
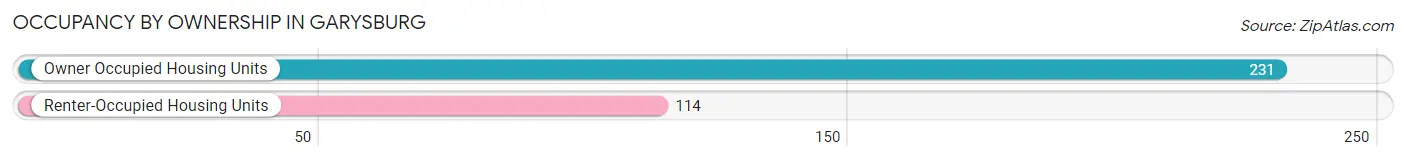
| Occupancy | # Housing Units | % Housing Units |
| Owner Occupied Housing Units | 231 | 67.0% |
| Renter-Occupied Housing Units | 114 | 33.0% |
| Total Occupied Housing Units | 345 | 100.0% |
Occupancy by Household Size in Garysburg
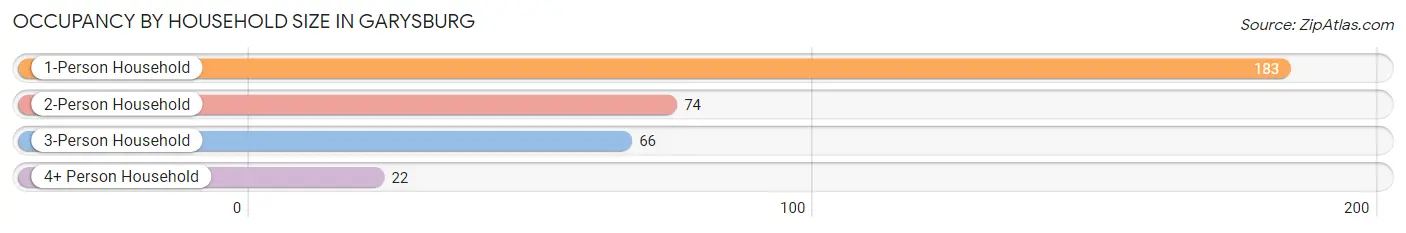
| Household Size | # Housing Units | % Housing Units |
| 1-Person Household | 183 | 53.0% |
| 2-Person Household | 74 | 21.4% |
| 3-Person Household | 66 | 19.1% |
| 4+ Person Household | 22 | 6.4% |
| Total Housing Units | 345 | 100.0% |
Occupancy by Ownership by Household Size in Garysburg
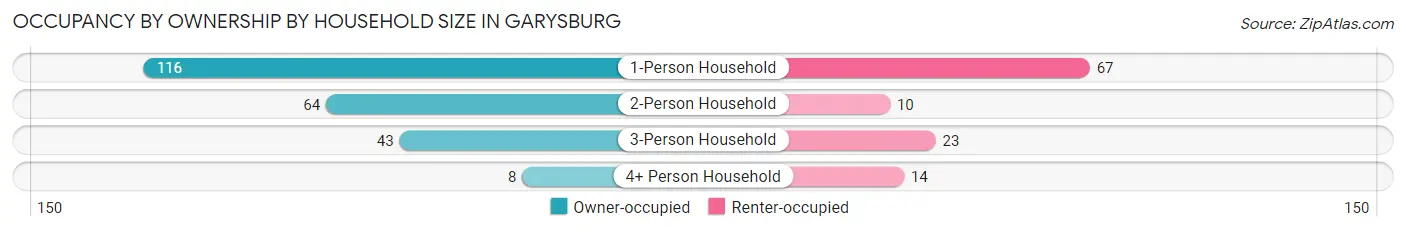
| Household Size | Owner-occupied | Renter-occupied |
| 1-Person Household | 116 (63.4%) | 67 (36.6%) |
| 2-Person Household | 64 (86.5%) | 10 (13.5%) |
| 3-Person Household | 43 (65.1%) | 23 (34.8%) |
| 4+ Person Household | 8 (36.4%) | 14 (63.6%) |
| Total Housing Units | 231 (67.0%) | 114 (33.0%) |
Occupancy by Educational Attainment in Garysburg
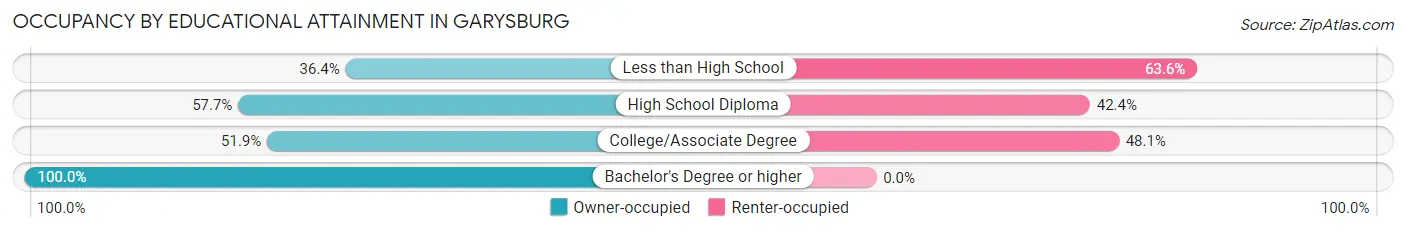
| Household Size | Owner-occupied | Renter-occupied |
| Less than High School | 16 (36.4%) | 28 (63.6%) |
| High School Diploma | 49 (57.7%) | 36 (42.3%) |
| College/Associate Degree | 54 (51.9%) | 50 (48.1%) |
| Bachelor's Degree or higher | 112 (100.0%) | 0 (0.0%) |
Occupancy by Age of Householder in Garysburg
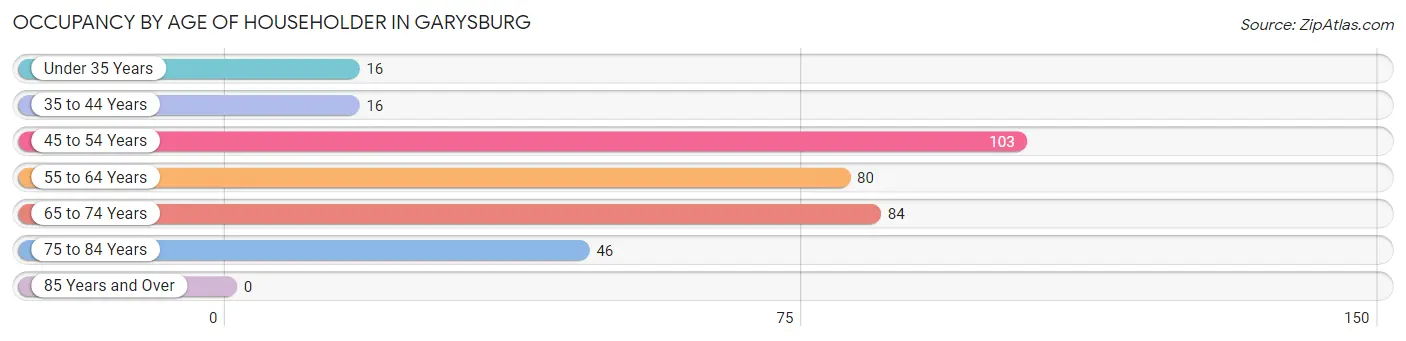
| Age Bracket | # Households | % Households |
| Under 35 Years | 16 | 4.6% |
| 35 to 44 Years | 16 | 4.6% |
| 45 to 54 Years | 103 | 29.9% |
| 55 to 64 Years | 80 | 23.2% |
| 65 to 74 Years | 84 | 24.3% |
| 75 to 84 Years | 46 | 13.3% |
| 85 Years and Over | 0 | 0.0% |
| Total | 345 | 100.0% |
Housing Finances in Garysburg
Median Income by Occupancy in Garysburg
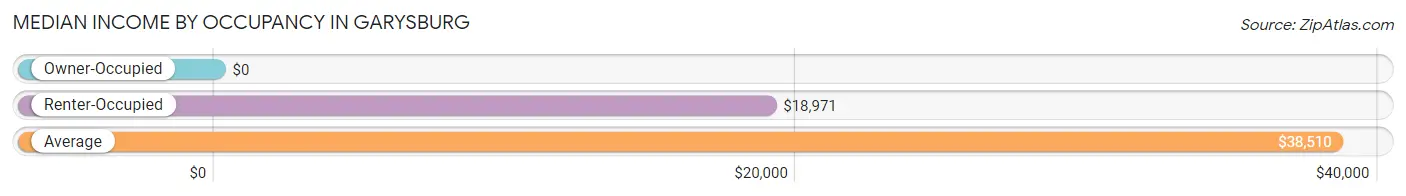
| Occupancy Type | # Households | Median Income |
| Owner-Occupied | 231 (67.0%) | $0 |
| Renter-Occupied | 114 (33.0%) | $18,971 |
| Average | 345 (100.0%) | $38,510 |
Occupancy by Householder Income Bracket in Garysburg
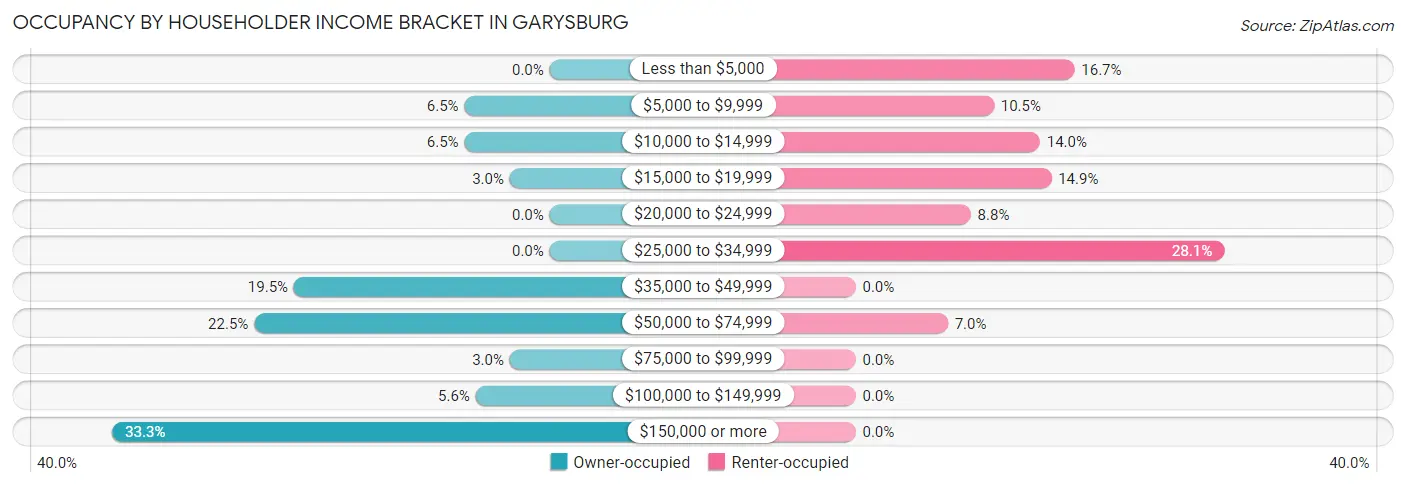
| Income Bracket | Owner-occupied | Renter-occupied |
| Less than $5,000 | 0 (0.0%) | 19 (16.7%) |
| $5,000 to $9,999 | 15 (6.5%) | 12 (10.5%) |
| $10,000 to $14,999 | 15 (6.5%) | 16 (14.0%) |
| $15,000 to $19,999 | 7 (3.0%) | 17 (14.9%) |
| $20,000 to $24,999 | 0 (0.0%) | 10 (8.8%) |
| $25,000 to $34,999 | 0 (0.0%) | 32 (28.1%) |
| $35,000 to $49,999 | 45 (19.5%) | 0 (0.0%) |
| $50,000 to $74,999 | 52 (22.5%) | 8 (7.0%) |
| $75,000 to $99,999 | 7 (3.0%) | 0 (0.0%) |
| $100,000 to $149,999 | 13 (5.6%) | 0 (0.0%) |
| $150,000 or more | 77 (33.3%) | 0 (0.0%) |
| Total | 231 (100.0%) | 114 (100.0%) |
Monthly Housing Cost Tiers in Garysburg
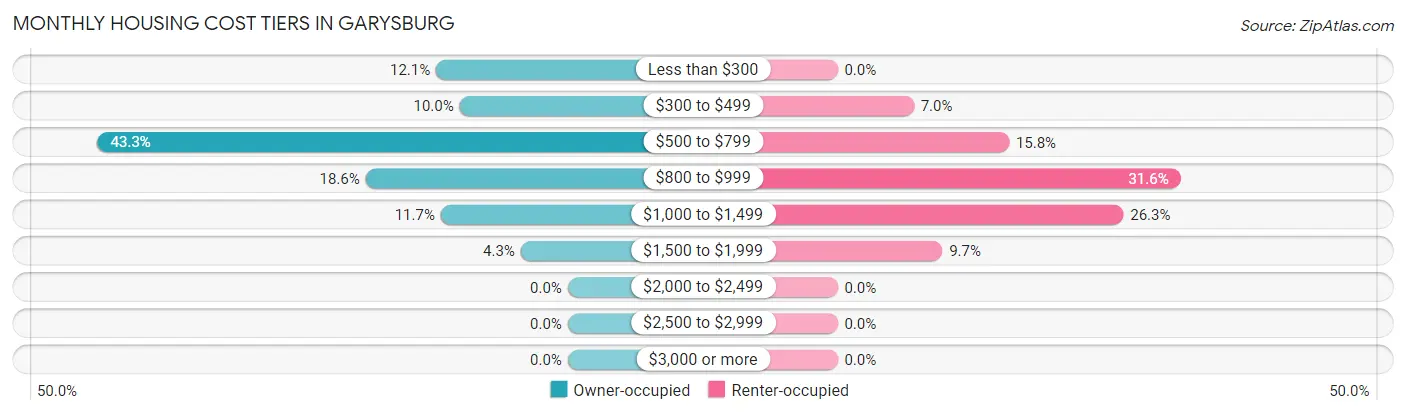
| Monthly Cost | Owner-occupied | Renter-occupied |
| Less than $300 | 28 (12.1%) | 0 (0.0%) |
| $300 to $499 | 23 (10.0%) | 8 (7.0%) |
| $500 to $799 | 100 (43.3%) | 18 (15.8%) |
| $800 to $999 | 43 (18.6%) | 36 (31.6%) |
| $1,000 to $1,499 | 27 (11.7%) | 30 (26.3%) |
| $1,500 to $1,999 | 10 (4.3%) | 11 (9.7%) |
| $2,000 to $2,499 | 0 (0.0%) | 0 (0.0%) |
| $2,500 to $2,999 | 0 (0.0%) | 0 (0.0%) |
| $3,000 or more | 0 (0.0%) | 0 (0.0%) |
| Total | 231 (100.0%) | 114 (100.0%) |
Physical Housing Characteristics in Garysburg
Housing Structures in Garysburg
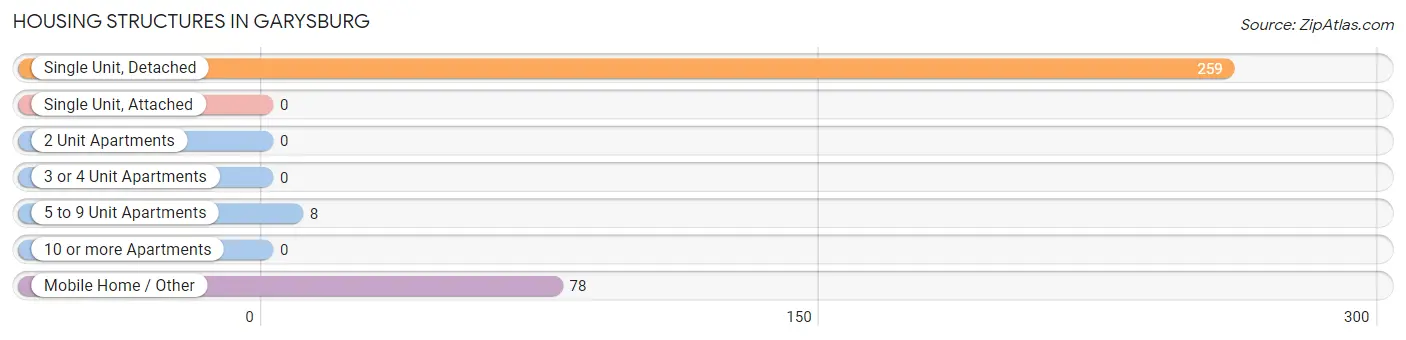
| Structure Type | # Housing Units | % Housing Units |
| Single Unit, Detached | 259 | 75.1% |
| Single Unit, Attached | 0 | 0.0% |
| 2 Unit Apartments | 0 | 0.0% |
| 3 or 4 Unit Apartments | 0 | 0.0% |
| 5 to 9 Unit Apartments | 8 | 2.3% |
| 10 or more Apartments | 0 | 0.0% |
| Mobile Home / Other | 78 | 22.6% |
| Total | 345 | 100.0% |
Housing Structures by Occupancy in Garysburg
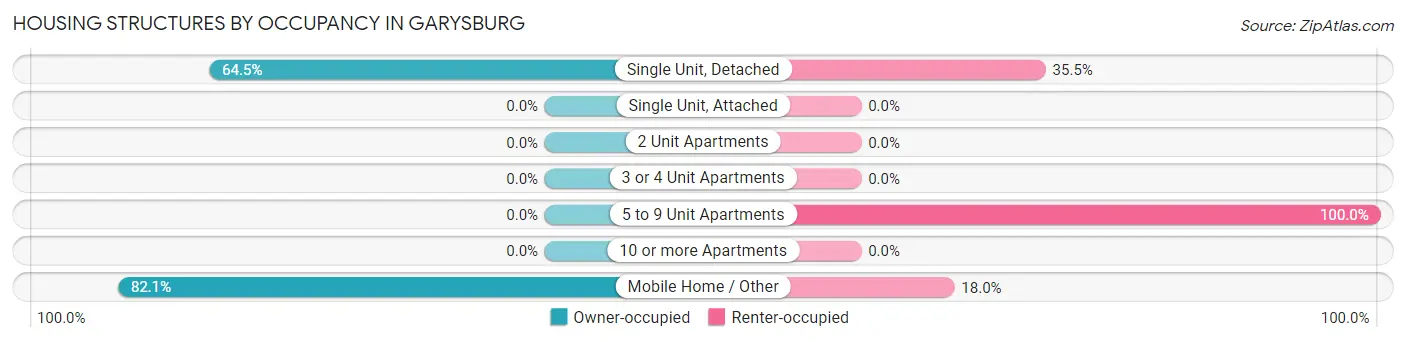
| Structure Type | Owner-occupied | Renter-occupied |
| Single Unit, Detached | 167 (64.5%) | 92 (35.5%) |
| Single Unit, Attached | 0 (0.0%) | 0 (0.0%) |
| 2 Unit Apartments | 0 (0.0%) | 0 (0.0%) |
| 3 or 4 Unit Apartments | 0 (0.0%) | 0 (0.0%) |
| 5 to 9 Unit Apartments | 0 (0.0%) | 8 (100.0%) |
| 10 or more Apartments | 0 (0.0%) | 0 (0.0%) |
| Mobile Home / Other | 64 (82.1%) | 14 (17.9%) |
| Total | 231 (67.0%) | 114 (33.0%) |
Housing Structures by Number of Rooms in Garysburg
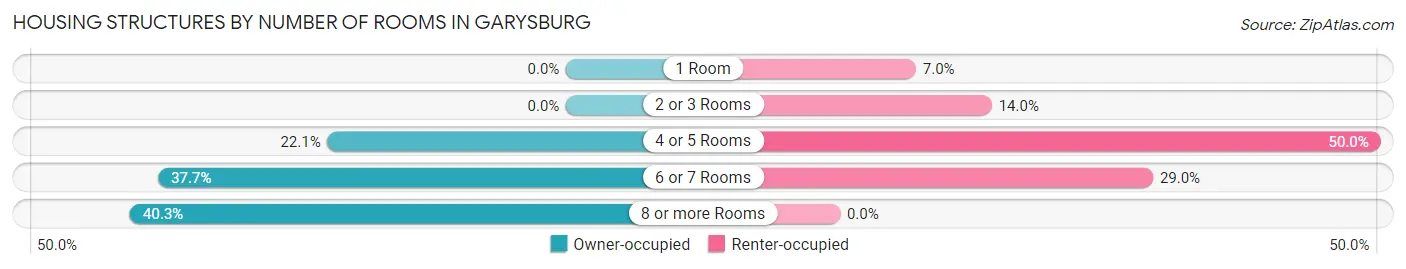
| Number of Rooms | Owner-occupied | Renter-occupied |
| 1 Room | 0 (0.0%) | 8 (7.0%) |
| 2 or 3 Rooms | 0 (0.0%) | 16 (14.0%) |
| 4 or 5 Rooms | 51 (22.1%) | 57 (50.0%) |
| 6 or 7 Rooms | 87 (37.7%) | 33 (28.9%) |
| 8 or more Rooms | 93 (40.3%) | 0 (0.0%) |
| Total | 231 (100.0%) | 114 (100.0%) |
Housing Structure by Heating Type in Garysburg
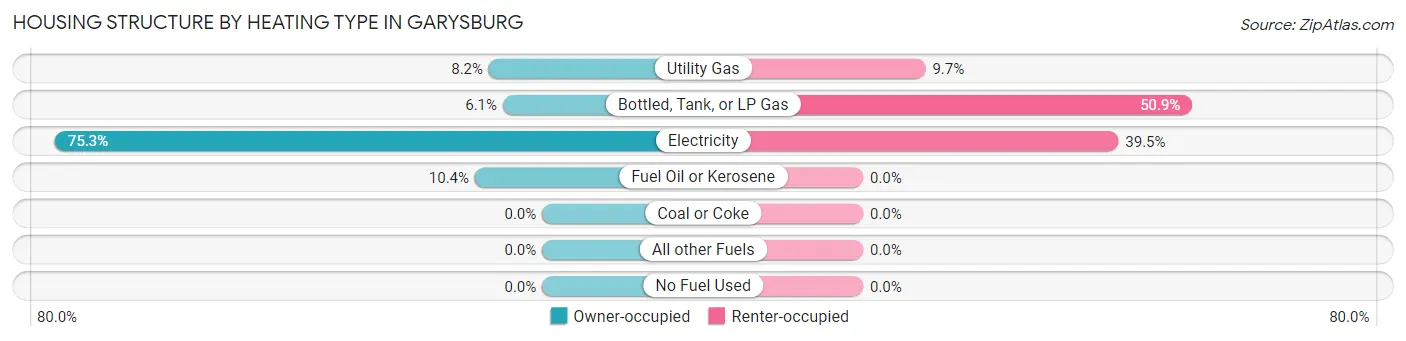
| Heating Type | Owner-occupied | Renter-occupied |
| Utility Gas | 19 (8.2%) | 11 (9.7%) |
| Bottled, Tank, or LP Gas | 14 (6.1%) | 58 (50.9%) |
| Electricity | 174 (75.3%) | 45 (39.5%) |
| Fuel Oil or Kerosene | 24 (10.4%) | 0 (0.0%) |
| Coal or Coke | 0 (0.0%) | 0 (0.0%) |
| All other Fuels | 0 (0.0%) | 0 (0.0%) |
| No Fuel Used | 0 (0.0%) | 0 (0.0%) |
| Total | 231 (100.0%) | 114 (100.0%) |
Household Vehicle Usage in Garysburg
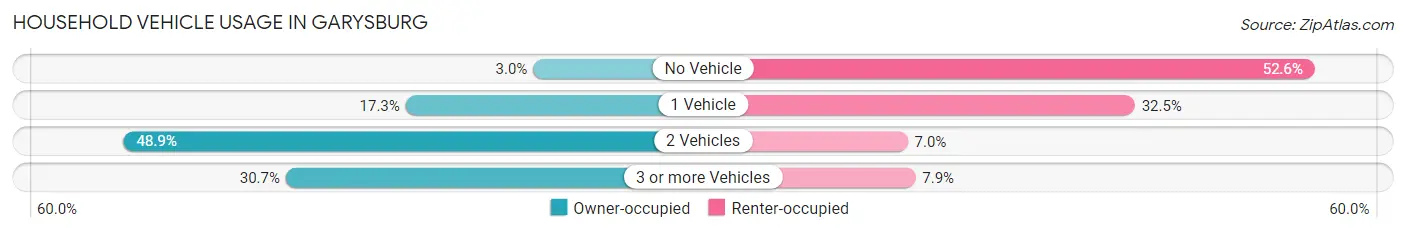
| Vehicles per Household | Owner-occupied | Renter-occupied |
| No Vehicle | 7 (3.0%) | 60 (52.6%) |
| 1 Vehicle | 40 (17.3%) | 37 (32.5%) |
| 2 Vehicles | 113 (48.9%) | 8 (7.0%) |
| 3 or more Vehicles | 71 (30.7%) | 9 (7.9%) |
| Total | 231 (100.0%) | 114 (100.0%) |
Real Estate & Mortgages in Garysburg
Real Estate and Mortgage Overview in Garysburg
| Characteristic | Without Mortgage | With Mortgage |
| Housing Units | 152 | 79 |
| Median Property Value | $109,600 | $93,700 |
| Median Household Income | - | - |
| Monthly Housing Costs | $712 | $0 |
| Real Estate Taxes | $1,250 | $0 |
Property Value by Mortgage Status in Garysburg
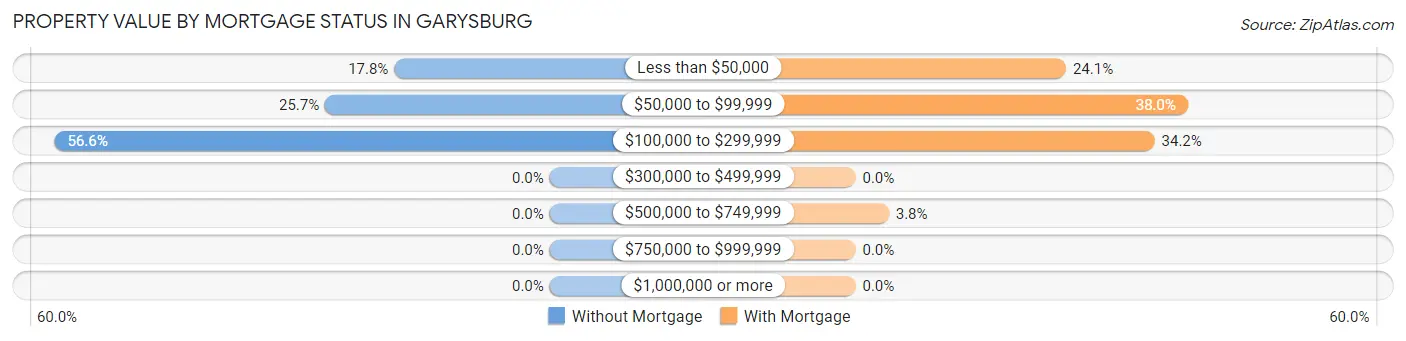
| Property Value | Without Mortgage | With Mortgage |
| Less than $50,000 | 27 (17.8%) | 19 (24.0%) |
| $50,000 to $99,999 | 39 (25.7%) | 30 (38.0%) |
| $100,000 to $299,999 | 86 (56.6%) | 27 (34.2%) |
| $300,000 to $499,999 | 0 (0.0%) | 0 (0.0%) |
| $500,000 to $749,999 | 0 (0.0%) | 3 (3.8%) |
| $750,000 to $999,999 | 0 (0.0%) | 0 (0.0%) |
| $1,000,000 or more | 0 (0.0%) | 0 (0.0%) |
| Total | 152 (100.0%) | 79 (100.0%) |
Household Income by Mortgage Status in Garysburg
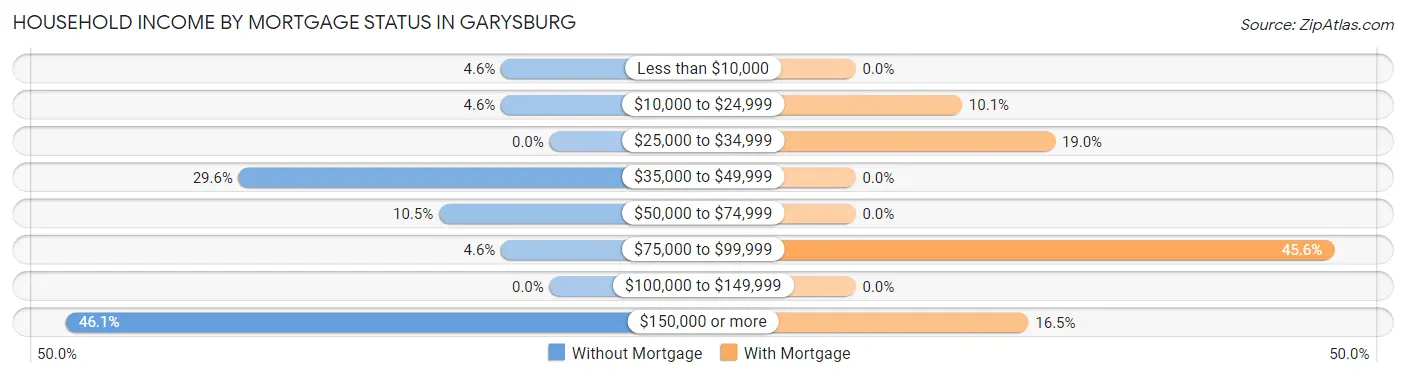
| Household Income | Without Mortgage | With Mortgage |
| Less than $10,000 | 7 (4.6%) | 0 (0.0%) |
| $10,000 to $24,999 | 7 (4.6%) | 8 (10.1%) |
| $25,000 to $34,999 | 0 (0.0%) | 15 (19.0%) |
| $35,000 to $49,999 | 45 (29.6%) | 0 (0.0%) |
| $50,000 to $74,999 | 16 (10.5%) | 0 (0.0%) |
| $75,000 to $99,999 | 7 (4.6%) | 36 (45.6%) |
| $100,000 to $149,999 | 0 (0.0%) | 0 (0.0%) |
| $150,000 or more | 70 (46.1%) | 13 (16.5%) |
| Total | 152 (100.0%) | 79 (100.0%) |
Property Value to Household Income Ratio in Garysburg
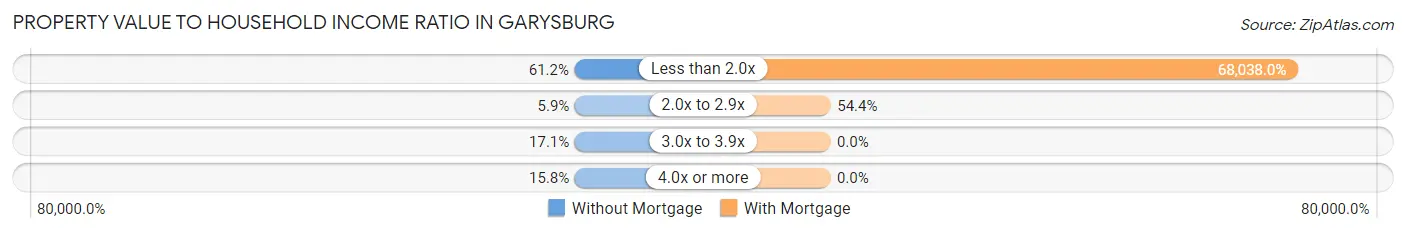
| Value-to-Income Ratio | Without Mortgage | With Mortgage |
| Less than 2.0x | 93 (61.2%) | 53,750 (68,038.0%) |
| 2.0x to 2.9x | 9 (5.9%) | 43 (54.4%) |
| 3.0x to 3.9x | 26 (17.1%) | 0 (0.0%) |
| 4.0x or more | 24 (15.8%) | 0 (0.0%) |
| Total | 152 (100.0%) | 79 (100.0%) |
Real Estate Taxes by Mortgage Status in Garysburg
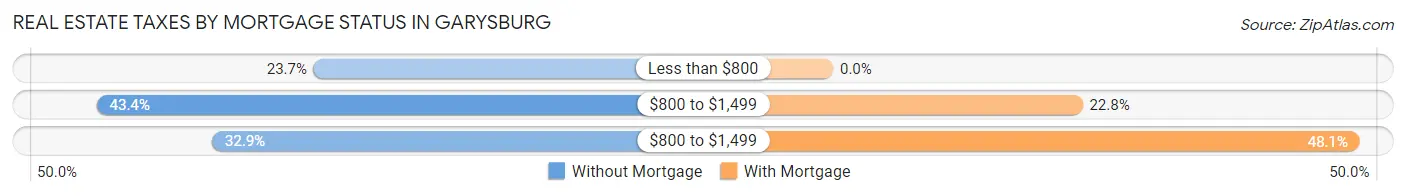
| Property Taxes | Without Mortgage | With Mortgage |
| Less than $800 | 36 (23.7%) | 0 (0.0%) |
| $800 to $1,499 | 66 (43.4%) | 18 (22.8%) |
| $800 to $1,499 | 50 (32.9%) | 38 (48.1%) |
| Total | 152 (100.0%) | 79 (100.0%) |
Health & Disability in Garysburg
Health Insurance Coverage by Age in Garysburg
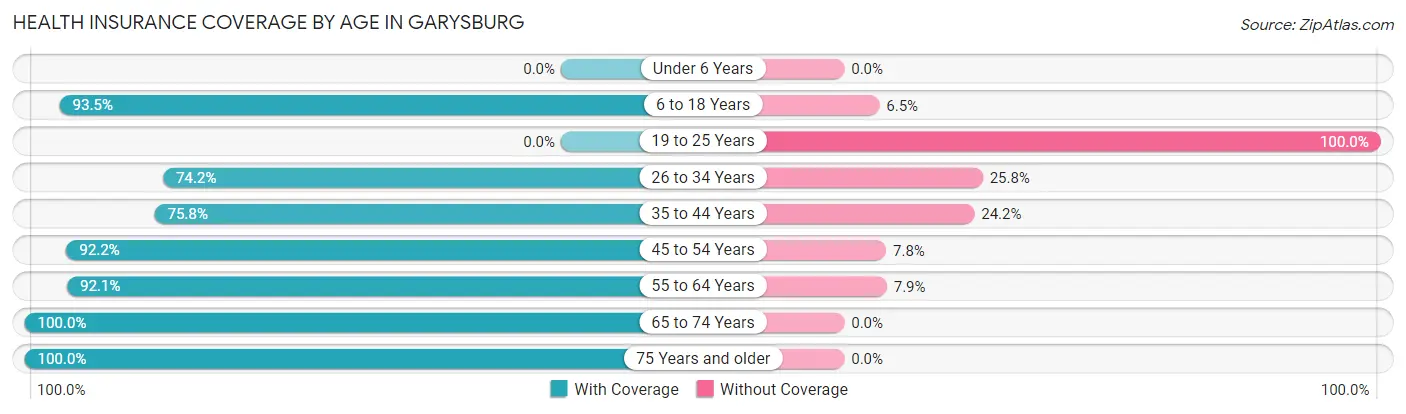
| Age Bracket | With Coverage | Without Coverage |
| Under 6 Years | 0 (0.0%) | 0 (0.0%) |
| 6 to 18 Years | 100 (93.5%) | 7 (6.5%) |
| 19 to 25 Years | 0 (0.0%) | 22 (100.0%) |
| 26 to 34 Years | 23 (74.2%) | 8 (25.8%) |
| 35 to 44 Years | 25 (75.8%) | 8 (24.2%) |
| 45 to 54 Years | 130 (92.2%) | 11 (7.8%) |
| 55 to 64 Years | 93 (92.1%) | 8 (7.9%) |
| 65 to 74 Years | 123 (100.0%) | 0 (0.0%) |
| 75 Years and older | 62 (100.0%) | 0 (0.0%) |
| Total | 556 (89.7%) | 64 (10.3%) |
Health Insurance Coverage by Citizenship Status in Garysburg
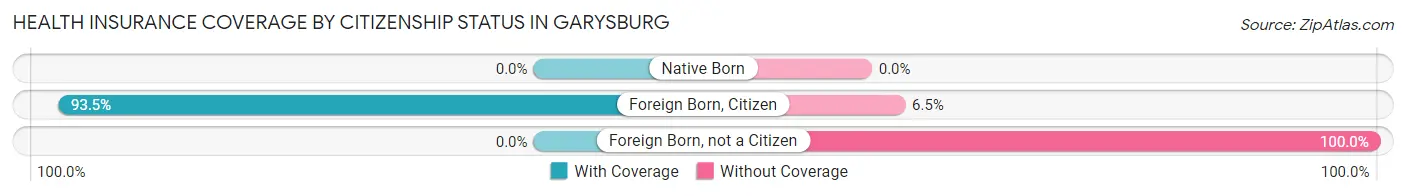
| Citizenship Status | With Coverage | Without Coverage |
| Native Born | 0 (0.0%) | 0 (0.0%) |
| Foreign Born, Citizen | 100 (93.5%) | 7 (6.5%) |
| Foreign Born, not a Citizen | 0 (0.0%) | 22 (100.0%) |
Health Insurance Coverage by Household Income in Garysburg
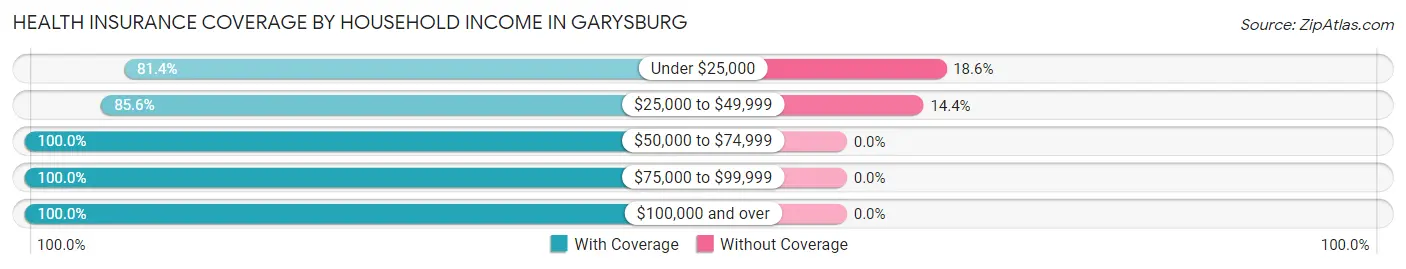
| Household Income | With Coverage | Without Coverage |
| Under $25,000 | 166 (81.4%) | 38 (18.6%) |
| $25,000 to $49,999 | 155 (85.6%) | 26 (14.4%) |
| $50,000 to $74,999 | 82 (100.0%) | 0 (0.0%) |
| $75,000 to $99,999 | 22 (100.0%) | 0 (0.0%) |
| $100,000 and over | 131 (100.0%) | 0 (0.0%) |
Public vs Private Health Insurance Coverage by Age in Garysburg
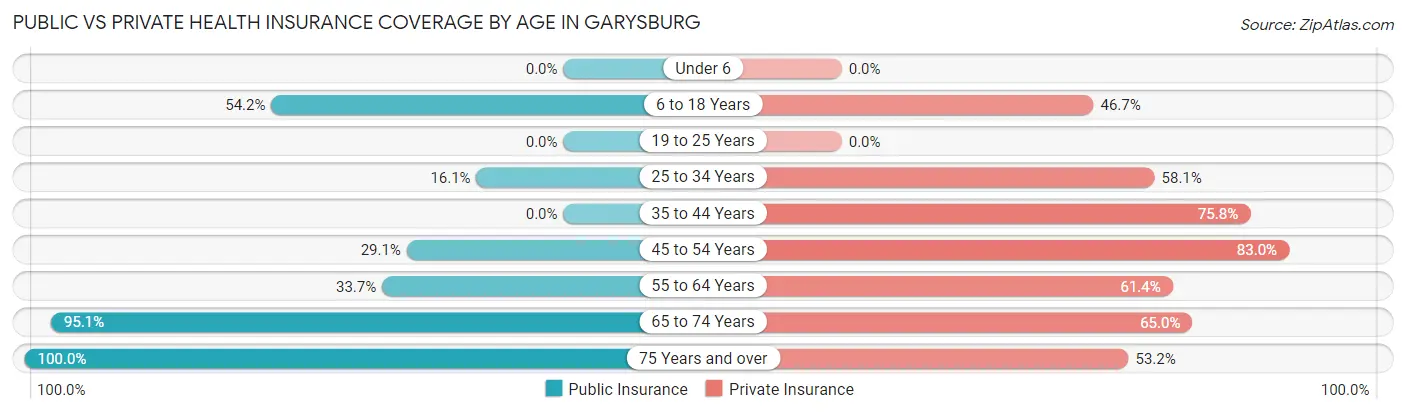
| Age Bracket | Public Insurance | Private Insurance |
| Under 6 | 0 (0.0%) | 0 (0.0%) |
| 6 to 18 Years | 58 (54.2%) | 50 (46.7%) |
| 19 to 25 Years | 0 (0.0%) | 0 (0.0%) |
| 25 to 34 Years | 5 (16.1%) | 18 (58.1%) |
| 35 to 44 Years | 0 (0.0%) | 25 (75.8%) |
| 45 to 54 Years | 41 (29.1%) | 117 (83.0%) |
| 55 to 64 Years | 34 (33.7%) | 62 (61.4%) |
| 65 to 74 Years | 117 (95.1%) | 80 (65.0%) |
| 75 Years and over | 62 (100.0%) | 33 (53.2%) |
| Total | 317 (51.1%) | 385 (62.1%) |
Disability Status by Sex by Age in Garysburg
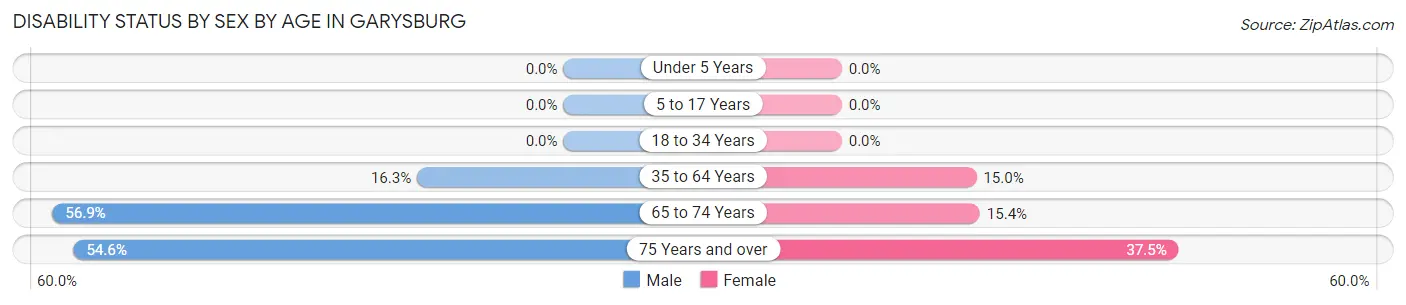
| Age Bracket | Male | Female |
| Under 5 Years | 0 (0.0%) | 0 (0.0%) |
| 5 to 17 Years | 0 (0.0%) | 0 (0.0%) |
| 18 to 34 Years | 0 (0.0%) | 0 (0.0%) |
| 35 to 64 Years | 22 (16.3%) | 21 (15.0%) |
| 65 to 74 Years | 33 (56.9%) | 10 (15.4%) |
| 75 Years and over | 12 (54.5%) | 15 (37.5%) |
Disability Class by Sex by Age in Garysburg
Disability Class: Hearing Difficulty
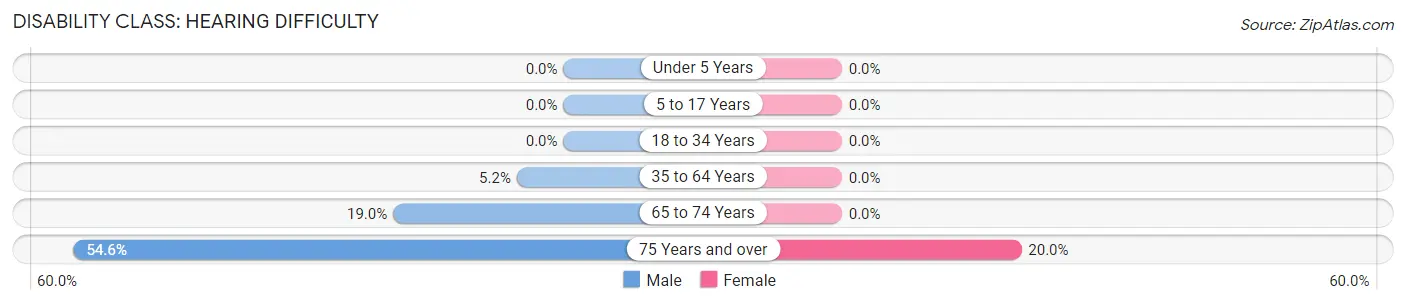
| Age Bracket | Male | Female |
| Under 5 Years | 0 (0.0%) | 0 (0.0%) |
| 5 to 17 Years | 0 (0.0%) | 0 (0.0%) |
| 18 to 34 Years | 0 (0.0%) | 0 (0.0%) |
| 35 to 64 Years | 7 (5.2%) | 0 (0.0%) |
| 65 to 74 Years | 11 (19.0%) | 0 (0.0%) |
| 75 Years and over | 12 (54.5%) | 8 (20.0%) |
Disability Class: Vision Difficulty
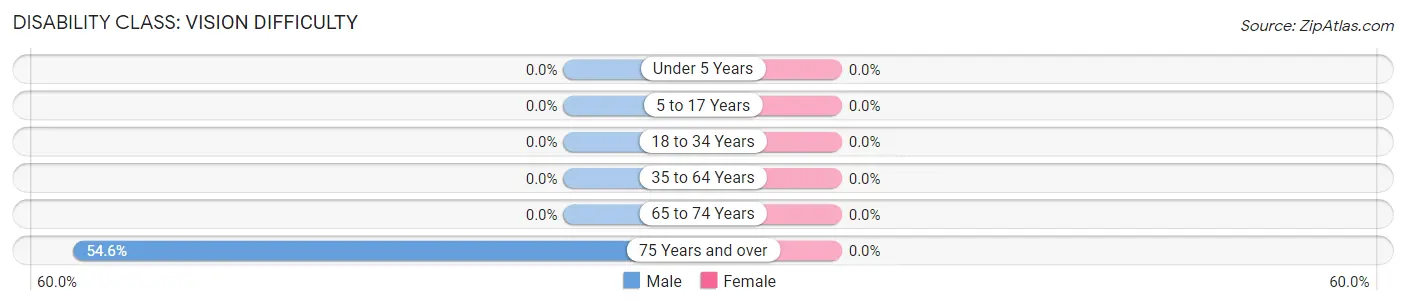
| Age Bracket | Male | Female |
| Under 5 Years | 0 (0.0%) | 0 (0.0%) |
| 5 to 17 Years | 0 (0.0%) | 0 (0.0%) |
| 18 to 34 Years | 0 (0.0%) | 0 (0.0%) |
| 35 to 64 Years | 0 (0.0%) | 0 (0.0%) |
| 65 to 74 Years | 0 (0.0%) | 0 (0.0%) |
| 75 Years and over | 12 (54.5%) | 0 (0.0%) |
Disability Class: Cognitive Difficulty
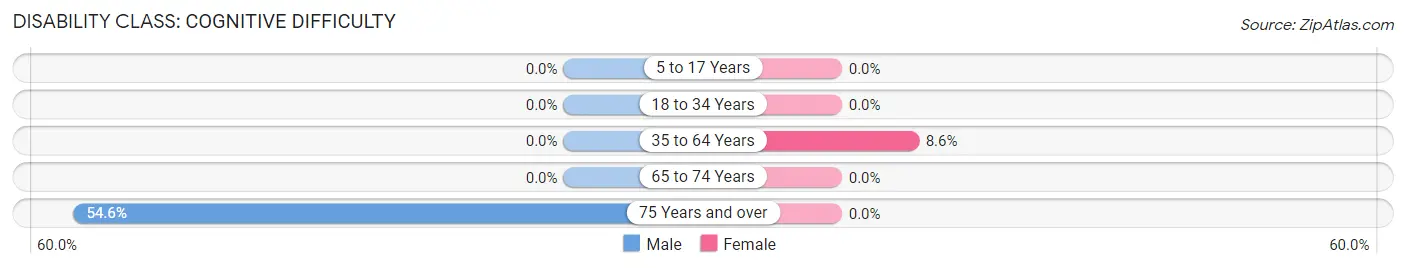
| Age Bracket | Male | Female |
| 5 to 17 Years | 0 (0.0%) | 0 (0.0%) |
| 18 to 34 Years | 0 (0.0%) | 0 (0.0%) |
| 35 to 64 Years | 0 (0.0%) | 12 (8.6%) |
| 65 to 74 Years | 0 (0.0%) | 0 (0.0%) |
| 75 Years and over | 12 (54.5%) | 0 (0.0%) |
Disability Class: Ambulatory Difficulty
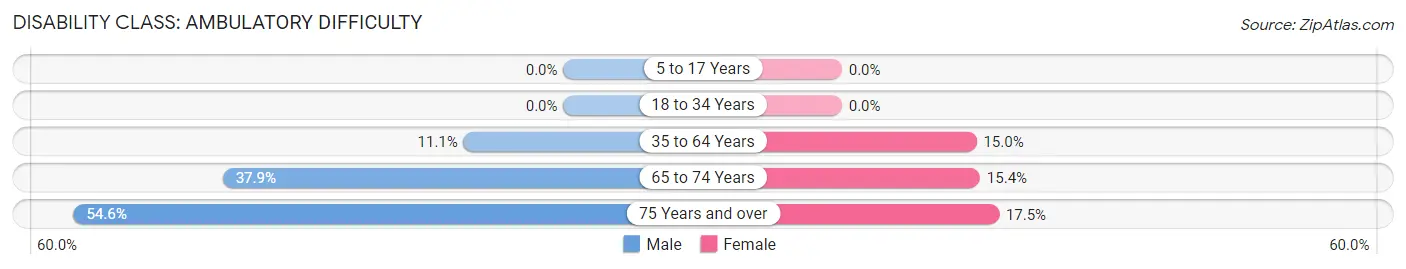
| Age Bracket | Male | Female |
| 5 to 17 Years | 0 (0.0%) | 0 (0.0%) |
| 18 to 34 Years | 0 (0.0%) | 0 (0.0%) |
| 35 to 64 Years | 15 (11.1%) | 21 (15.0%) |
| 65 to 74 Years | 22 (37.9%) | 10 (15.4%) |
| 75 Years and over | 12 (54.5%) | 7 (17.5%) |
Disability Class: Self-Care Difficulty
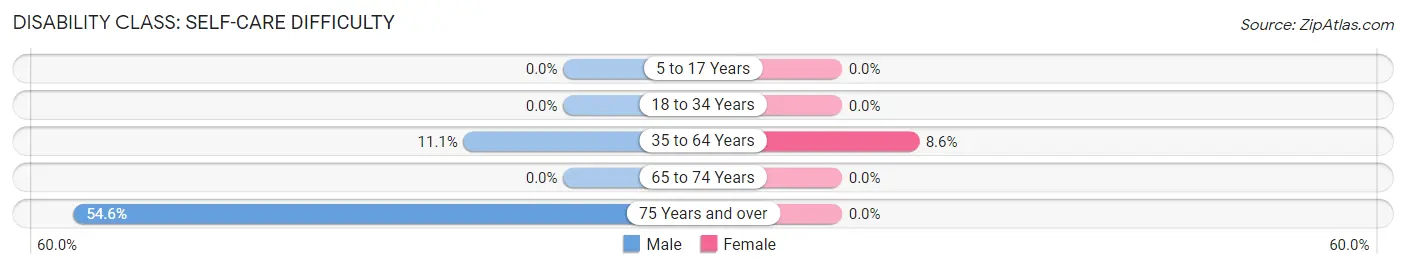
| Age Bracket | Male | Female |
| 5 to 17 Years | 0 (0.0%) | 0 (0.0%) |
| 18 to 34 Years | 0 (0.0%) | 0 (0.0%) |
| 35 to 64 Years | 15 (11.1%) | 12 (8.6%) |
| 65 to 74 Years | 0 (0.0%) | 0 (0.0%) |
| 75 Years and over | 12 (54.5%) | 0 (0.0%) |
Technology Access in Garysburg
Computing Device Access in Garysburg
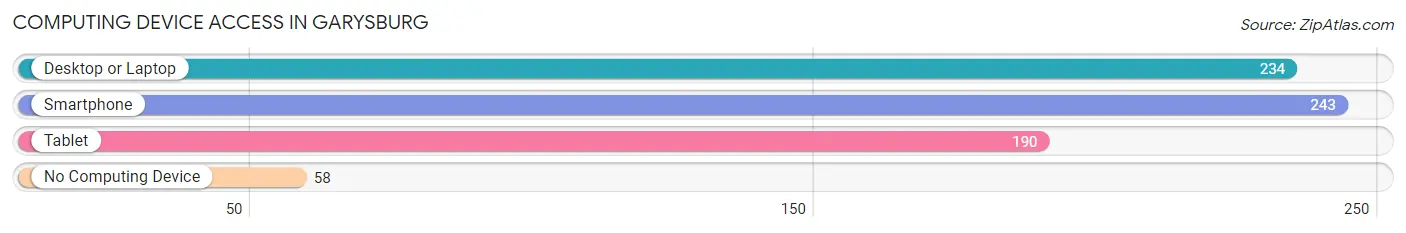
| Device Type | # Households | % Households |
| Desktop or Laptop | 234 | 67.8% |
| Smartphone | 243 | 70.4% |
| Tablet | 190 | 55.1% |
| No Computing Device | 58 | 16.8% |
| Total | 345 | 100.0% |
Internet Access in Garysburg
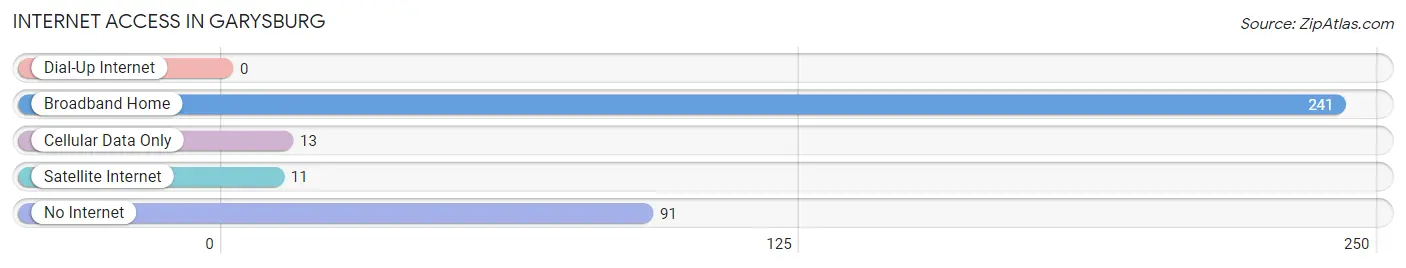
| Internet Type | # Households | % Households |
| Dial-Up Internet | 0 | 0.0% |
| Broadband Home | 241 | 69.9% |
| Cellular Data Only | 13 | 3.8% |
| Satellite Internet | 11 | 3.2% |
| No Internet | 91 | 26.4% |
| Total | 345 | 100.0% |
Garysburg Summary
History
The town of Garysburg, North Carolina is located in Northampton County, in the northeastern part of the state. It is situated on the Roanoke River, near the Virginia border. The town was founded in 1790 by William Gary, a Revolutionary War veteran, and was named after him.
The town was originally a small farming community, but in the late 19th century, it began to grow and develop. The railroad came to Garysburg in 1887, and the town became a major hub for the lumber industry. The lumber industry was the main source of employment for the town, and it continued to be a major employer until the mid-20th century.
In the early 20th century, Garysburg began to diversify its economy. The town became a center for manufacturing, with several factories producing furniture, textiles, and other goods. The town also became a center for education, with several schools and colleges being established in the area.
Geography
Garysburg is located in Northampton County, in the northeastern part of North Carolina. It is situated on the Roanoke River, near the Virginia border. The town is located in the Coastal Plain region of the state, and is surrounded by rolling hills and forests. The town is located about 30 miles from the Atlantic Ocean, and is about an hour’s drive from the state capital of Raleigh.
The town has a humid subtropical climate, with hot, humid summers and mild winters. The average annual temperature is around 70 degrees Fahrenheit, and the average annual precipitation is around 45 inches.
Economy
The economy of Garysburg is largely based on manufacturing and services. The town is home to several factories that produce furniture, textiles, and other goods. The town is also home to several businesses that provide services such as banking, insurance, and healthcare.
The town is also home to several educational institutions, including a community college and a technical institute. These institutions provide educational opportunities for the residents of Garysburg and the surrounding area.
Demographics
As of the 2010 census, the population of Garysburg was 2,845. The population is largely African American, with about 75% of the population being African American. The median household income is around $30,000, and the median age is around 40 years old.
The town is served by the Garysburg-Northampton County Public Schools, which includes two elementary schools, one middle school, and one high school. The town is also home to several churches, including the Garysburg United Methodist Church and the Garysburg Baptist Church.
Conclusion
Garysburg, North Carolina is a small town located in Northampton County, in the northeastern part of the state. The town was founded in 1790 and was originally a small farming community. In the late 19th century, the town began to grow and develop, and the railroad came to Garysburg in 1887. The town is now a center for manufacturing and services, and is home to several educational institutions. The population of Garysburg is largely African American, and the median household income is around $30,000.
Common Questions
What is the Total Population of Garysburg?
Total Population of Garysburg is 620.
What is the Total Male Population of Garysburg?
Total Male Population of Garysburg is 252.
What is the Total Female Population of Garysburg?
Total Female Population of Garysburg is 368.
What is the Ratio of Males per 100 Females in Garysburg?
There are 68.48 Males per 100 Females in Garysburg.
What is the Ratio of Females per 100 Males in Garysburg?
There are 146.03 Females per 100 Males in Garysburg.
What is the Median Population Age in Garysburg?
Median Population Age in Garysburg is 54.6 Years.
What is the Average Family Size in Garysburg
Average Family Size in Garysburg is 2.6 People.
What is the Average Household Size in Garysburg
Average Household Size in Garysburg is 1.8 People.
What is Per Capita Income in Garysburg?
Per Capita income in Garysburg is $36,800.
What is the Median Family Income in Garysburg?
Median Family Income in Garysburg is $36,579.
What is the Median Household income in Garysburg?
Median Household Income in Garysburg is $38,510.
What is Income or Wage Gap in Garysburg?
Income or Wage Gap in Garysburg is 80.8%.
Women in Garysburg earn 19.2 cents for every dollar earned by a man.
What is Family Income Deficit in Garysburg?
Family Income Deficit in Garysburg is $10,689.
Families that are below poverty line in Garysburg earn $10,689 less on average than the poverty threshold level.
What is Inequality or Gini Index in Garysburg?
Inequality or Gini Index in Garysburg is 0.52.
How Large is the Labor Force in Garysburg?
There are 261 People in the Labor Forcein in Garysburg.
What is the Percentage of People in the Labor Force in Garysburg?
49.1% of People are in the Labor Force in Garysburg.
What is the Unemployment Rate in Garysburg?
Unemployment Rate in Garysburg is 8.4%.