Askewville, NC
Askewville Map
Askewville Overview
184
TOTAL POPULATION
89
MALE POPULATION
95
FEMALE POPULATION
93.68
MALES / 100 FEMALES
106.74
FEMALES / 100 MALES
50.8
MEDIAN AGE
3.0
AVG FAMILY SIZE
2.1
AVG HOUSEHOLD SIZE
$29,014
PER CAPITA INCOME
$77,500
AVG FAMILY INCOME
$48,750
AVG HOUSEHOLD INCOME
19.3%
WAGE / INCOME GAP [ % ]
80.7¢/ $1
WAGE / INCOME GAP [ $ ]
0.46
INEQUALITY / GINI INDEX
74
LABOR FORCE [ PEOPLE ]
45.1%
PERCENT IN LABOR FORCE
Askewville Area Codes
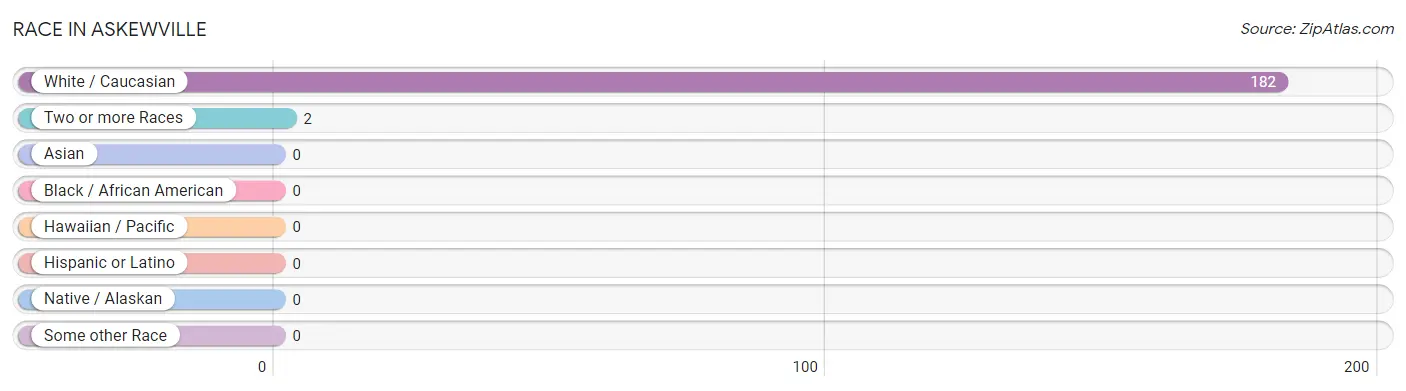
Race in Askewville
The most populous races in Askewville are White / Caucasian (182 | 98.9%), and Two or more Races (2 | 1.1%).
| Race | # Population | % Population |
| Asian | 0 | 0.0% |
| Black / African American | 0 | 0.0% |
| Hawaiian / Pacific | 0 | 0.0% |
| Hispanic or Latino | 0 | 0.0% |
| Native / Alaskan | 0 | 0.0% |
| White / Caucasian | 182 | 98.9% |
| Two or more Races | 2 | 1.1% |
| Some other Race | 0 | 0.0% |
| Total | 184 | 100.0% |
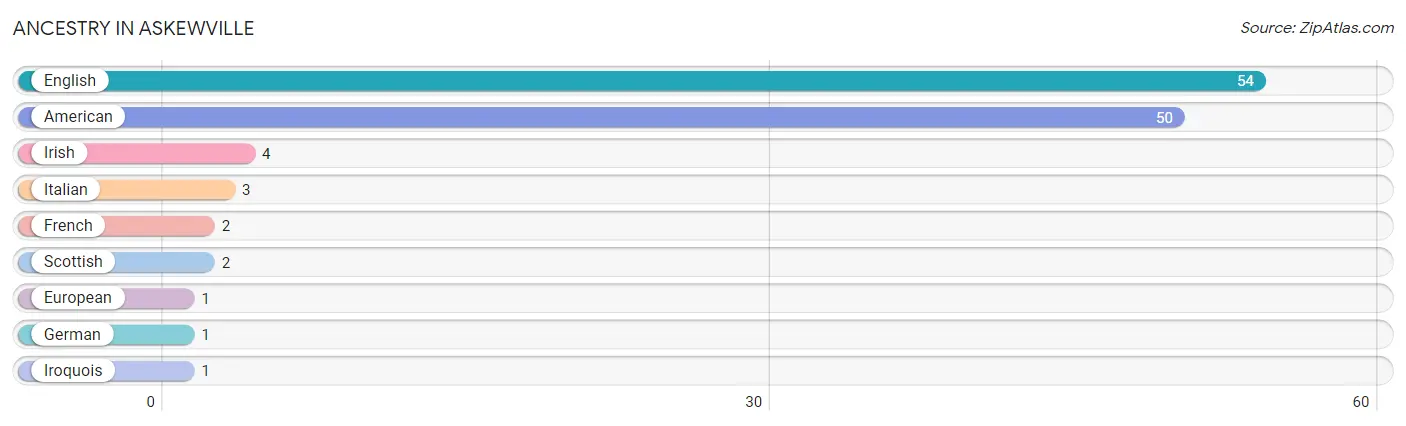
Ancestry in Askewville
The most populous ancestries reported in Askewville are English (54 | 29.3%), American (50 | 27.2%), Irish (4 | 2.2%), Italian (3 | 1.6%), and French (2 | 1.1%), together accounting for 61.4% of all Askewville residents.
| Ancestry | # Population | % Population |
| American | 50 | 27.2% |
| English | 54 | 29.3% |
| European | 1 | 0.5% |
| French | 2 | 1.1% |
| German | 1 | 0.5% |
| Irish | 4 | 2.2% |
| Iroquois | 1 | 0.5% |
| Italian | 3 | 1.6% |
| Scottish | 2 | 1.1% | View All 9 Rows |
Immigrants in Askewville

| Immigration Origin | # Population | % Population | View All 0 Rows |
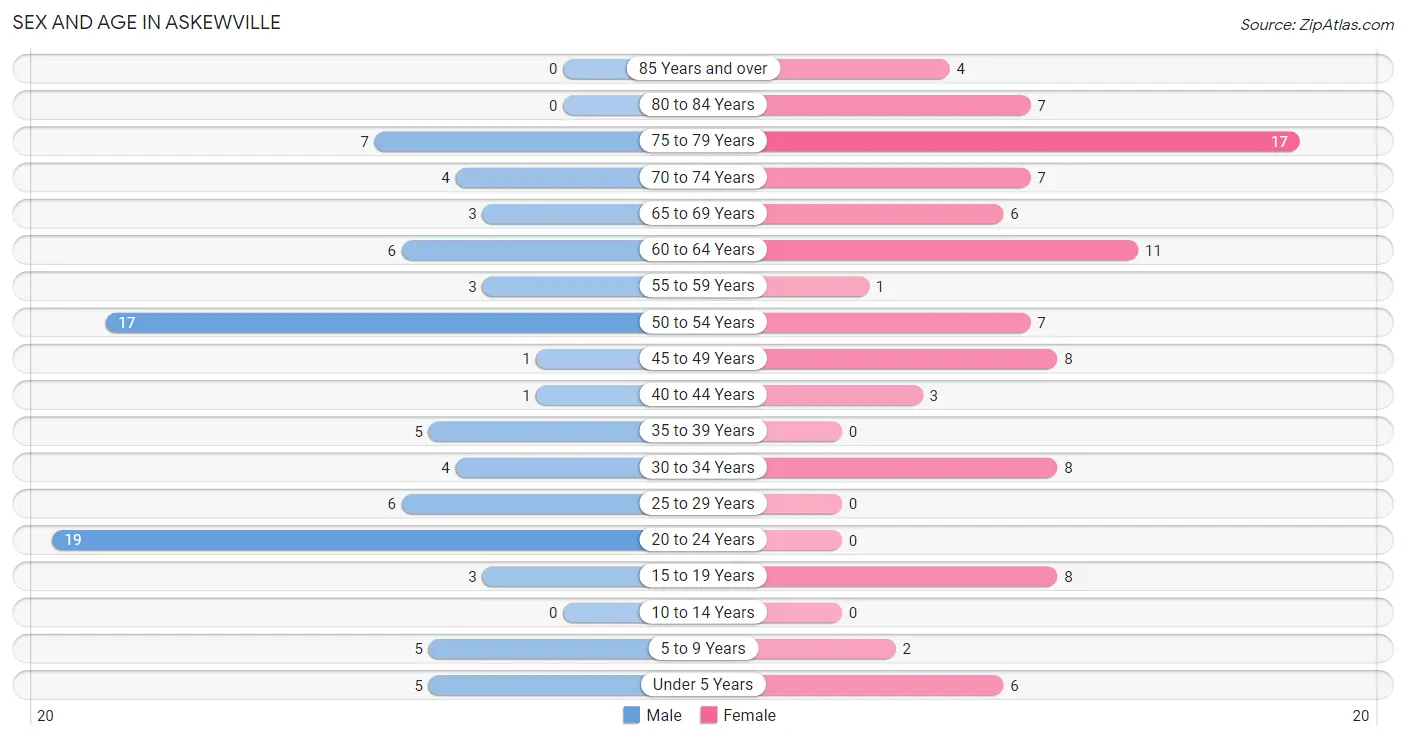
Sex and Age in Askewville
Sex and Age in Askewville
The most populous age groups in Askewville are 20 to 24 Years (19 | 21.3%) for men and 75 to 79 Years (17 | 17.9%) for women.
| Age Bracket | Male | Female |
| Under 5 Years | 5 (5.6%) | 6 (6.3%) |
| 5 to 9 Years | 5 (5.6%) | 2 (2.1%) |
| 10 to 14 Years | 0 (0.0%) | 0 (0.0%) |
| 15 to 19 Years | 3 (3.4%) | 8 (8.4%) |
| 20 to 24 Years | 19 (21.3%) | 0 (0.0%) |
| 25 to 29 Years | 6 (6.7%) | 0 (0.0%) |
| 30 to 34 Years | 4 (4.5%) | 8 (8.4%) |
| 35 to 39 Years | 5 (5.6%) | 0 (0.0%) |
| 40 to 44 Years | 1 (1.1%) | 3 (3.2%) |
| 45 to 49 Years | 1 (1.1%) | 8 (8.4%) |
| 50 to 54 Years | 17 (19.1%) | 7 (7.4%) |
| 55 to 59 Years | 3 (3.4%) | 1 (1.1%) |
| 60 to 64 Years | 6 (6.7%) | 11 (11.6%) |
| 65 to 69 Years | 3 (3.4%) | 6 (6.3%) |
| 70 to 74 Years | 4 (4.5%) | 7 (7.4%) |
| 75 to 79 Years | 7 (7.9%) | 17 (17.9%) |
| 80 to 84 Years | 0 (0.0%) | 7 (7.4%) |
| 85 Years and over | 0 (0.0%) | 4 (4.2%) |
| Total | 89 (100.0%) | 95 (100.0%) |
Families and Households in Askewville
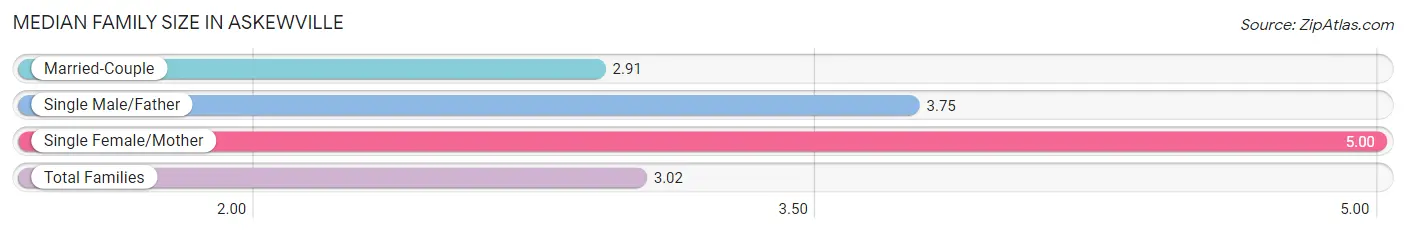
Median Family Size in Askewville
The median family size in Askewville is 3.02 persons per family, with single female/mother families (1 | 2.1%) accounting for the largest median family size of 5 persons per family. On the other hand, married-couple families (43 | 89.6%) represent the smallest median family size with 2.91 persons per family.
| Family Type | # Families | Family Size |
| Married-Couple | 43 (89.6%) | 2.91 |
| Single Male/Father | 4 (8.3%) | 3.75 |
| Single Female/Mother | 1 (2.1%) | 5.00 |
| Total Families | 48 (100.0%) | 3.02 |
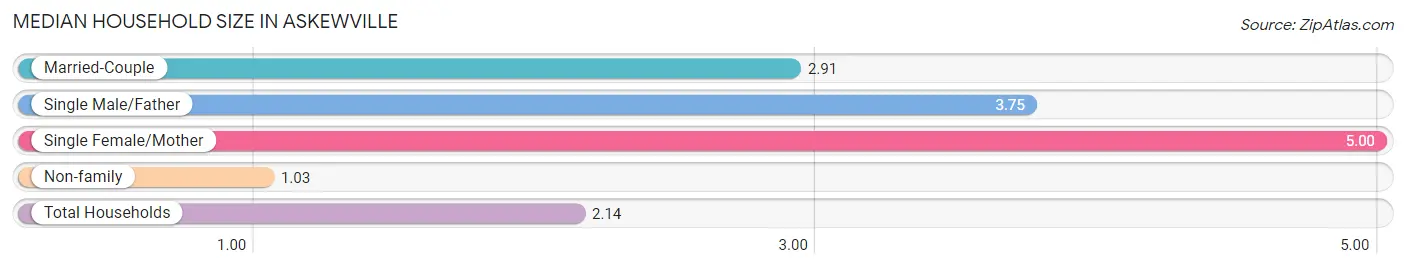
Median Household Size in Askewville
The median household size in Askewville is 2.14 persons per household, with single female/mother households (1 | 1.2%) accounting for the largest median household size of 5 persons per household. non-family households (38 | 44.2%) represent the smallest median household size with 1.03 persons per household.
| Household Type | # Households | Household Size |
| Married-Couple | 43 (50.0%) | 2.91 |
| Single Male/Father | 4 (4.6%) | 3.75 |
| Single Female/Mother | 1 (1.2%) | 5.00 |
| Non-family | 38 (44.2%) | 1.03 |
| Total Households | 86 (100.0%) | 2.14 |
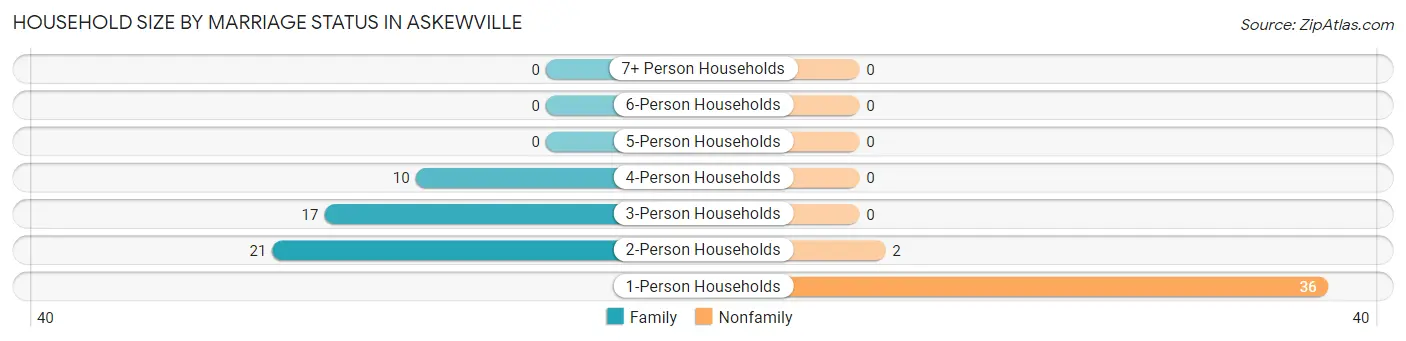
Household Size by Marriage Status in Askewville
Out of a total of 86 households in Askewville, 48 (55.8%) are family households, while 38 (44.2%) are nonfamily households. The most numerous type of family households are 2-person households, comprising 21, and the most common type of nonfamily households are 1-person households, comprising 36.
| Household Size | Family Households | Nonfamily Households |
| 1-Person Households | - | 36 (41.9%) |
| 2-Person Households | 21 (24.4%) | 2 (2.3%) |
| 3-Person Households | 17 (19.8%) | 0 (0.0%) |
| 4-Person Households | 10 (11.6%) | 0 (0.0%) |
| 5-Person Households | 0 (0.0%) | 0 (0.0%) |
| 6-Person Households | 0 (0.0%) | 0 (0.0%) |
| 7+ Person Households | 0 (0.0%) | 0 (0.0%) |
| Total | 48 (55.8%) | 38 (44.2%) |
Female Fertility in Askewville
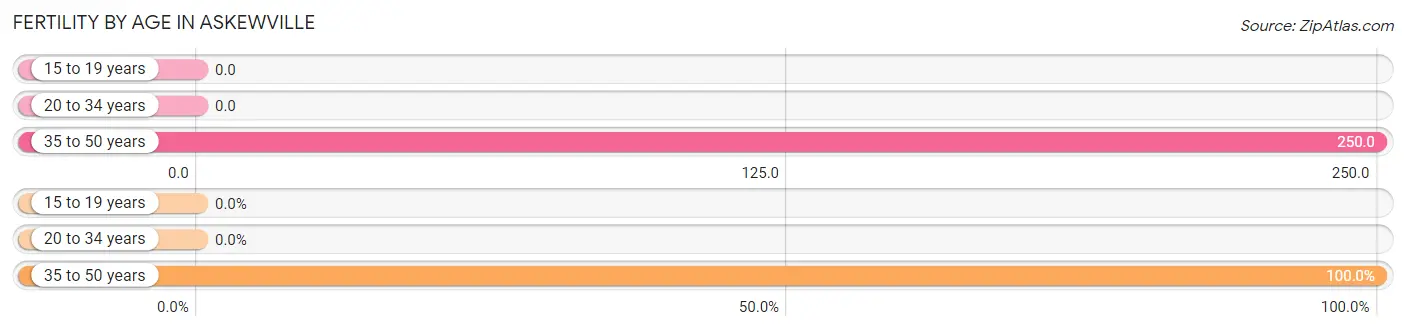
Fertility by Age in Askewville
Average fertility rate in Askewville is 107.0 births per 1,000 women. Women in the age bracket of 35 to 50 years have the highest fertility rate with 250.0 births per 1,000 women. Women in the age bracket of 35 to 50 years acount for 100.0% of all women with births.
| Age Bracket | Women with Births | Births / 1,000 Women |
| 15 to 19 years | 0 (0.0%) | 0.0 |
| 20 to 34 years | 0 (0.0%) | 0.0 |
| 35 to 50 years | 3 (100.0%) | 250.0 |
| Total | 3 (100.0%) | 107.0 |
Fertility by Age by Marriage Status in Askewville
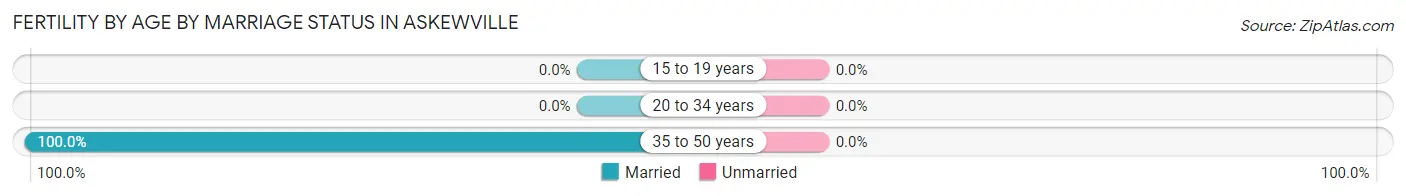
| Age Bracket | Married | Unmarried |
| 15 to 19 years | 0 (0.0%) | 0 (0.0%) |
| 20 to 34 years | 0 (0.0%) | 0 (0.0%) |
| 35 to 50 years | 3 (100.0%) | 0 (0.0%) |
| Total | 3 (100.0%) | 0 (0.0%) |
Fertility by Education in Askewville
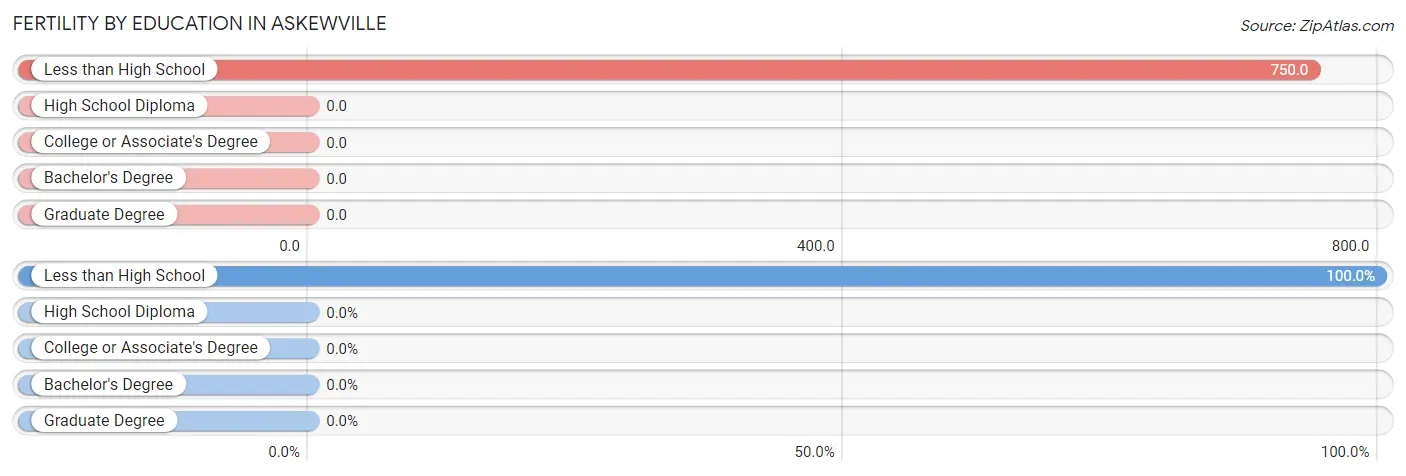
| Educational Attainment | Women with Births | Births / 1,000 Women |
| Less than High School | 3 (100.0%) | 750.0 |
| High School Diploma | 0 (0.0%) | 0.0 |
| College or Associate's Degree | 0 (0.0%) | 0.0 |
| Bachelor's Degree | 0 (0.0%) | 0.0 |
| Graduate Degree | 0 (0.0%) | 0.0 |
| Total | 3 (100.0%) | 107.0 |
Fertility by Education by Marriage Status in Askewville
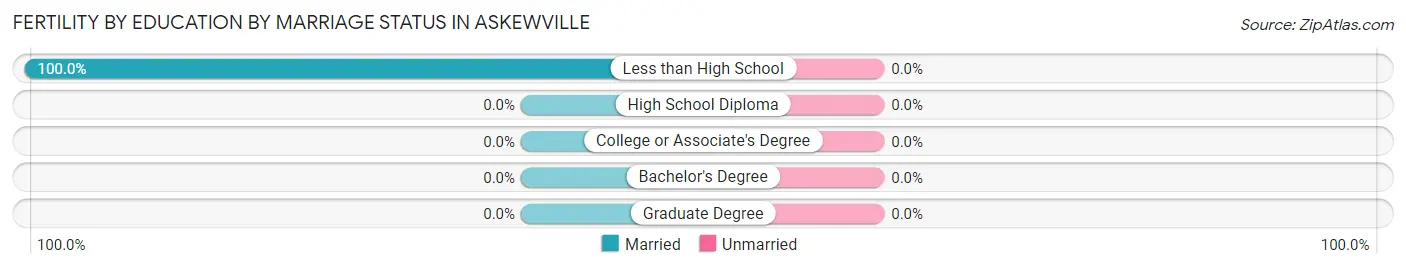
| Educational Attainment | Married | Unmarried |
| Less than High School | 3 (100.0%) | 0 (0.0%) |
| High School Diploma | 0 (0.0%) | 0 (0.0%) |
| College or Associate's Degree | 0 (0.0%) | 0 (0.0%) |
| Bachelor's Degree | 0 (0.0%) | 0 (0.0%) |
| Graduate Degree | 0 (0.0%) | 0 (0.0%) |
| Total | 3 (100.0%) | 0 (0.0%) |
Income in Askewville
Income Overview in Askewville
Per Capita Income in Askewville is $29,014, while median incomes of families and households are $77,500 and $48,750 respectively.
| Characteristic | Number | Measure |
| Per Capita Income | 184 | $29,014 |
| Median Family Income | 48 | $77,500 |
| Mean Family Income | 48 | $92,517 |
| Median Household Income | 86 | $48,750 |
| Mean Household Income | 86 | $61,447 |
| Income Deficit | 48 | $0 |
| Wage / Income Gap (%) | 184 | 19.26% |
| Wage / Income Gap ($) | 184 | 80.74¢ per $1 |
| Gini / Inequality Index | 184 | 0.46 |
Earnings by Sex in Askewville
Average Earnings in Askewville are $46,458, $45,417 for men and $56,250 for women, a difference of 19.3%.
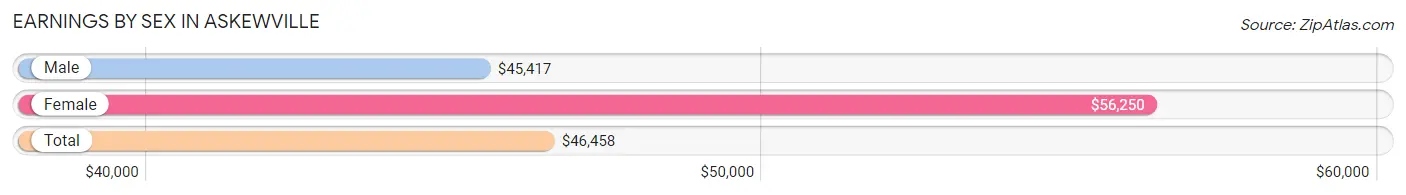
| Sex | Number | Average Earnings |
| Male | 44 (58.7%) | $45,417 |
| Female | 31 (41.3%) | $56,250 |
| Total | 75 (100.0%) | $46,458 |
Earnings by Sex by Income Bracket in Askewville
The most common earnings brackets in Askewville are $5,000 to $7,499 for men (10 | 22.7%) and $55,000 to $64,999 for women (15 | 48.4%).
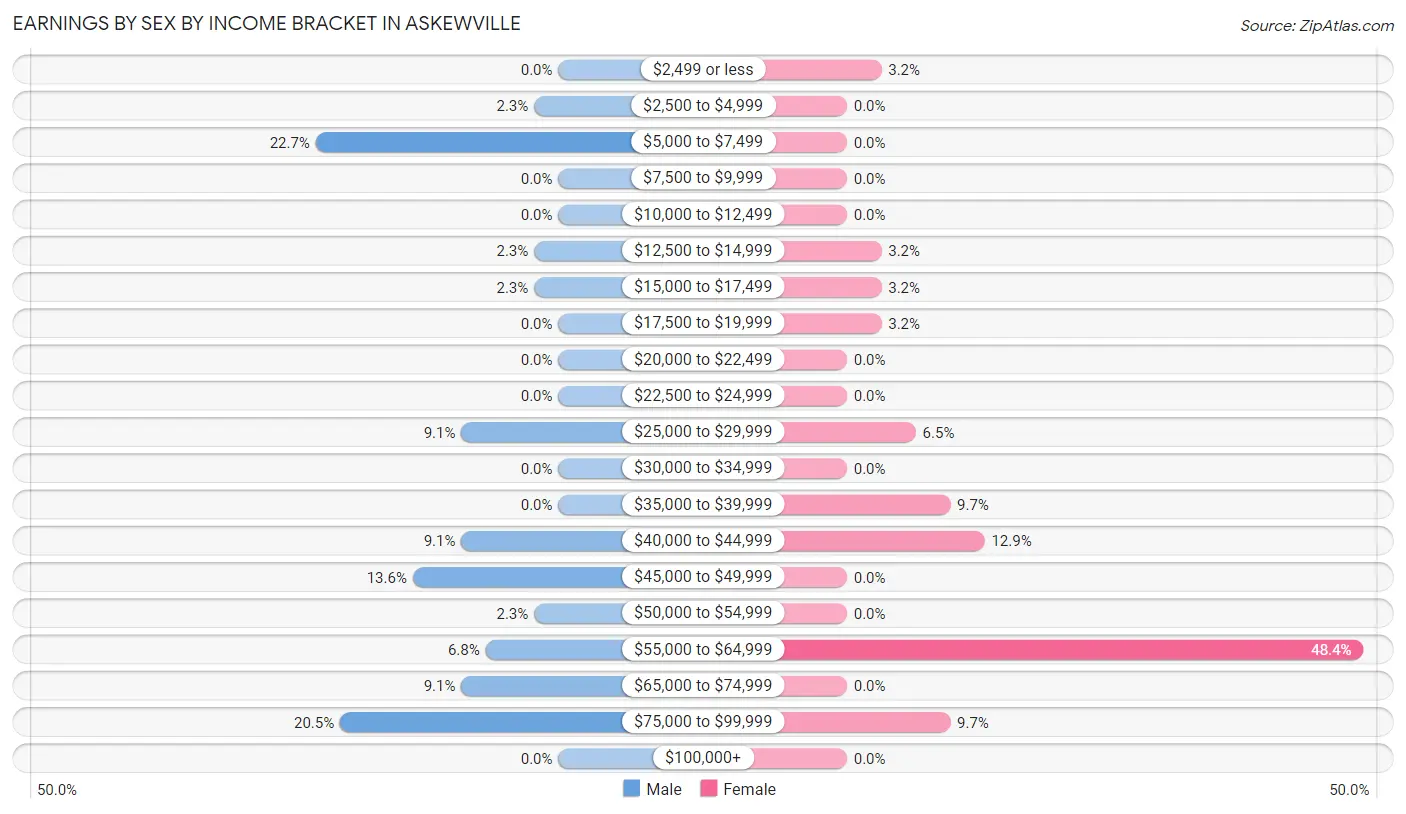
| Income | Male | Female |
| $2,499 or less | 0 (0.0%) | 1 (3.2%) |
| $2,500 to $4,999 | 1 (2.3%) | 0 (0.0%) |
| $5,000 to $7,499 | 10 (22.7%) | 0 (0.0%) |
| $7,500 to $9,999 | 0 (0.0%) | 0 (0.0%) |
| $10,000 to $12,499 | 0 (0.0%) | 0 (0.0%) |
| $12,500 to $14,999 | 1 (2.3%) | 1 (3.2%) |
| $15,000 to $17,499 | 1 (2.3%) | 1 (3.2%) |
| $17,500 to $19,999 | 0 (0.0%) | 1 (3.2%) |
| $20,000 to $22,499 | 0 (0.0%) | 0 (0.0%) |
| $22,500 to $24,999 | 0 (0.0%) | 0 (0.0%) |
| $25,000 to $29,999 | 4 (9.1%) | 2 (6.5%) |
| $30,000 to $34,999 | 0 (0.0%) | 0 (0.0%) |
| $35,000 to $39,999 | 0 (0.0%) | 3 (9.7%) |
| $40,000 to $44,999 | 4 (9.1%) | 4 (12.9%) |
| $45,000 to $49,999 | 6 (13.6%) | 0 (0.0%) |
| $50,000 to $54,999 | 1 (2.3%) | 0 (0.0%) |
| $55,000 to $64,999 | 3 (6.8%) | 15 (48.4%) |
| $65,000 to $74,999 | 4 (9.1%) | 0 (0.0%) |
| $75,000 to $99,999 | 9 (20.4%) | 3 (9.7%) |
| $100,000+ | 0 (0.0%) | 0 (0.0%) |
| Total | 44 (100.0%) | 31 (100.0%) |
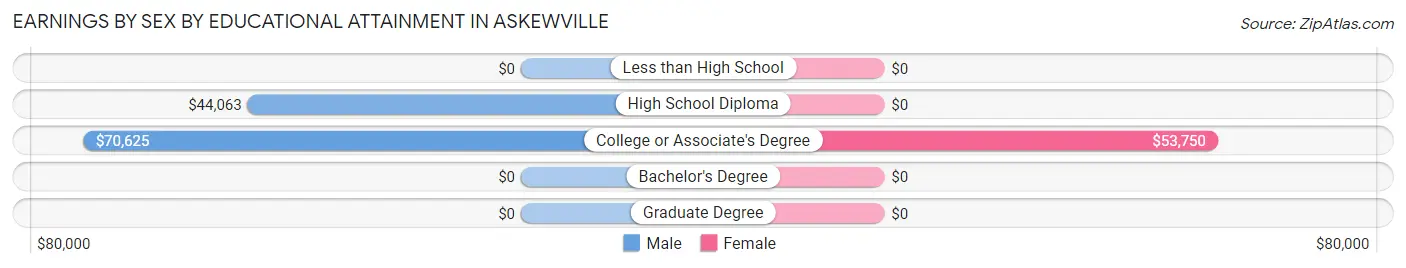
Earnings by Sex by Educational Attainment in Askewville
Average earnings in Askewville are $47,292 for men and $56,250 for women, a difference of 15.9%. Men with an educational attainment of college or associate's degree enjoy the highest average annual earnings of $70,625, while those with high school diploma education earn the least with $44,063. Women with an educational attainment of college or associate's degree earn the most with the average annual earnings of $53,750, while those with college or associate's degree education have the smallest earnings of $53,750.
| Educational Attainment | Male Income | Female Income |
| Less than High School | - | - |
| High School Diploma | $44,063 | $0 |
| College or Associate's Degree | $70,625 | $53,750 |
| Bachelor's Degree | - | - |
| Graduate Degree | - | - |
| Total | $47,292 | $56,250 |
Family Income in Askewville
Family Income Brackets in Askewville
According to the Askewville family income data, there are 17 families falling into the $50,000 to $74,999 income range, which is the most common income bracket and makes up 35.4% of all families.
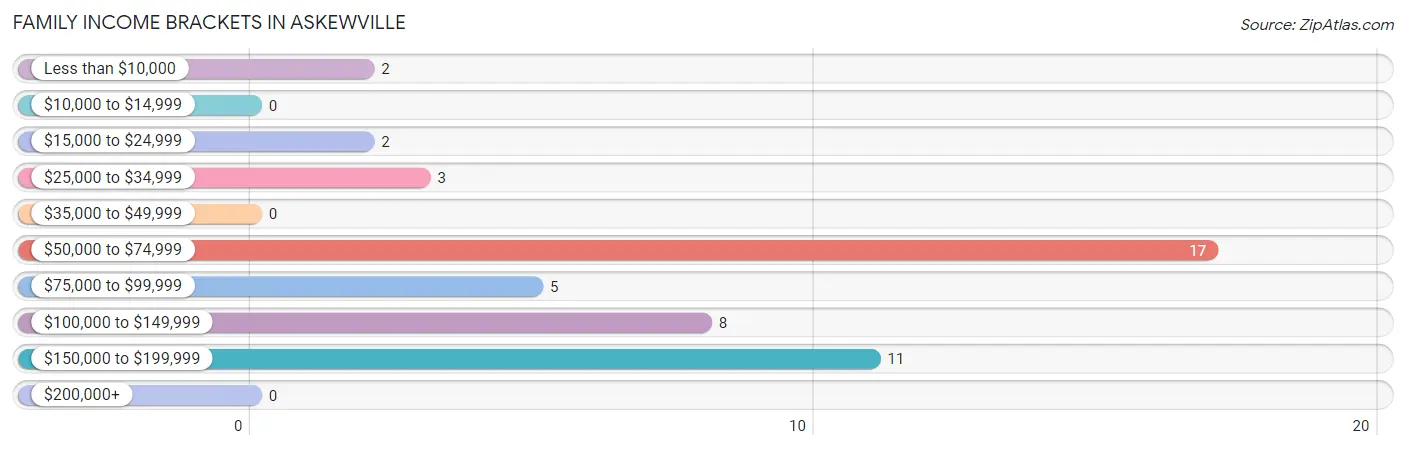
| Income Bracket | # Families | % Families |
| Less than $10,000 | 2 | 4.2% |
| $10,000 to $14,999 | 0 | 0.0% |
| $15,000 to $24,999 | 2 | 4.2% |
| $25,000 to $34,999 | 3 | 6.3% |
| $35,000 to $49,999 | 0 | 0.0% |
| $50,000 to $74,999 | 17 | 35.4% |
| $75,000 to $99,999 | 5 | 10.4% |
| $100,000 to $149,999 | 8 | 16.7% |
| $150,000 to $199,999 | 11 | 22.9% |
| $200,000+ | 0 | 0.0% |
Family Income by Famaliy Size in Askewville
4-person families (10 | 20.8%) account for the highest median family income in Askewville with $160,714 per family, while 4-person families (10 | 20.8%) have the highest median income of $40,178 per family member.
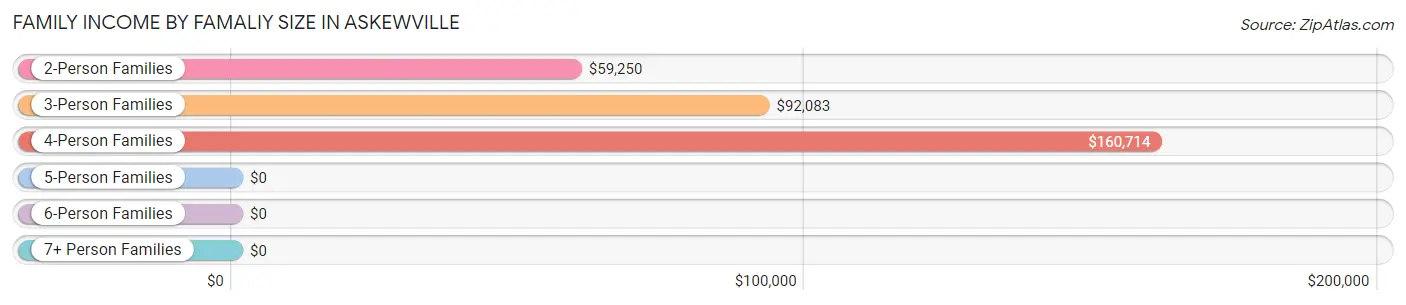
| Income Bracket | # Families | Median Income |
| 2-Person Families | 21 (43.8%) | $59,250 |
| 3-Person Families | 17 (35.4%) | $92,083 |
| 4-Person Families | 10 (20.8%) | $160,714 |
| 5-Person Families | 0 (0.0%) | $0 |
| 6-Person Families | 0 (0.0%) | $0 |
| 7+ Person Families | 0 (0.0%) | $0 |
| Total | 48 (100.0%) | $77,500 |
Family Income by Number of Earners in Askewville
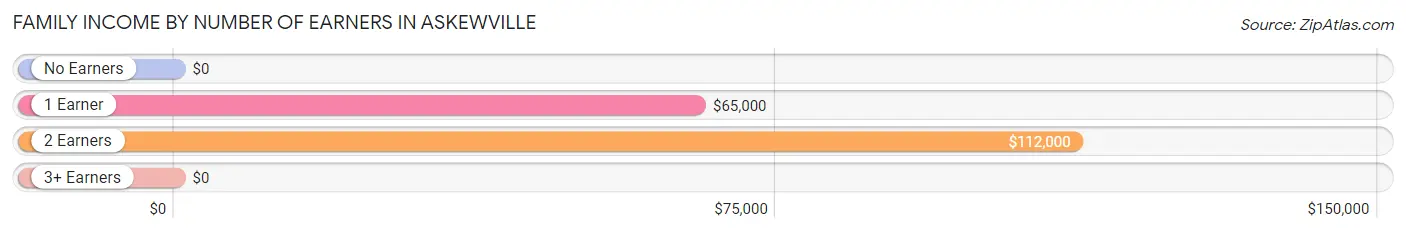
| Number of Earners | # Families | Median Income |
| No Earners | 11 (22.9%) | $0 |
| 1 Earner | 14 (29.2%) | $65,000 |
| 2 Earners | 18 (37.5%) | $112,000 |
| 3+ Earners | 5 (10.4%) | $0 |
| Total | 48 (100.0%) | $77,500 |
Household Income in Askewville
Household Income Brackets in Askewville
With 20 households falling in the category, the $10,000 to $14,999 income range is the most frequent in Askewville, accounting for 23.3% of all households.
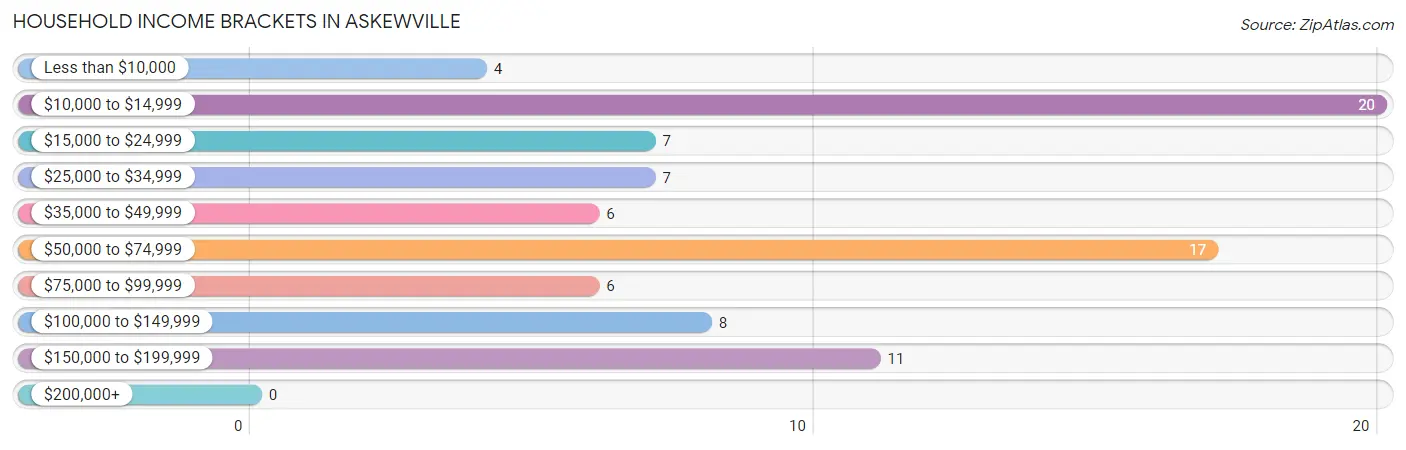
| Income Bracket | # Households | % Households |
| Less than $10,000 | 4 | 4.7% |
| $10,000 to $14,999 | 20 | 23.3% |
| $15,000 to $24,999 | 7 | 8.1% |
| $25,000 to $34,999 | 7 | 8.1% |
| $35,000 to $49,999 | 6 | 7.0% |
| $50,000 to $74,999 | 17 | 19.8% |
| $75,000 to $99,999 | 6 | 7.0% |
| $100,000 to $149,999 | 8 | 9.3% |
| $150,000 to $199,999 | 11 | 12.8% |
| $200,000+ | 0 | 0.0% |
Household Income by Householder Age in Askewville
The median household income in Askewville is $48,750, with the highest median household income of $68,750 found in the 45 to 64 years age bracket for the primary householder. A total of 32 households (37.2%) fall into this category.
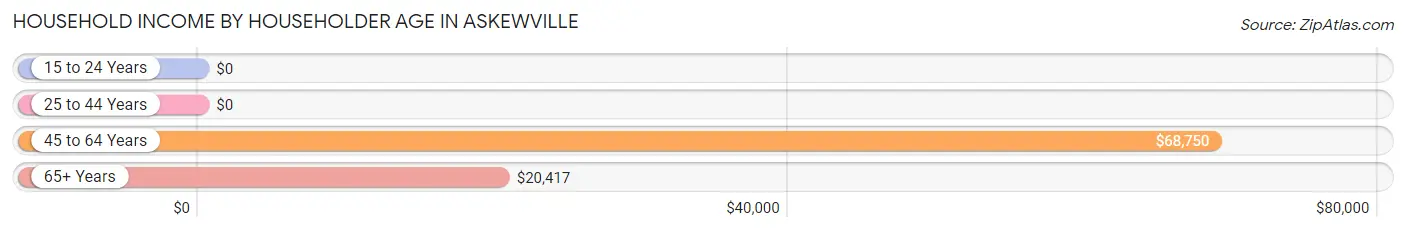
| Income Bracket | # Households | Median Income |
| 15 to 24 Years | 0 (0.0%) | $0 |
| 25 to 44 Years | 11 (12.8%) | $0 |
| 45 to 64 Years | 32 (37.2%) | $68,750 |
| 65+ Years | 43 (50.0%) | $20,417 |
| Total | 86 (100.0%) | $48,750 |
Poverty in Askewville
Income Below Poverty by Sex and Age in Askewville
With 5.6% poverty level for males and 25.3% for females among the residents of Askewville, 25 to 34 year old males and 18 to 24 year old females are the most vulnerable to poverty, with 2 males (20.0%) and 2 females (100.0%) in their respective age groups living below the poverty level.
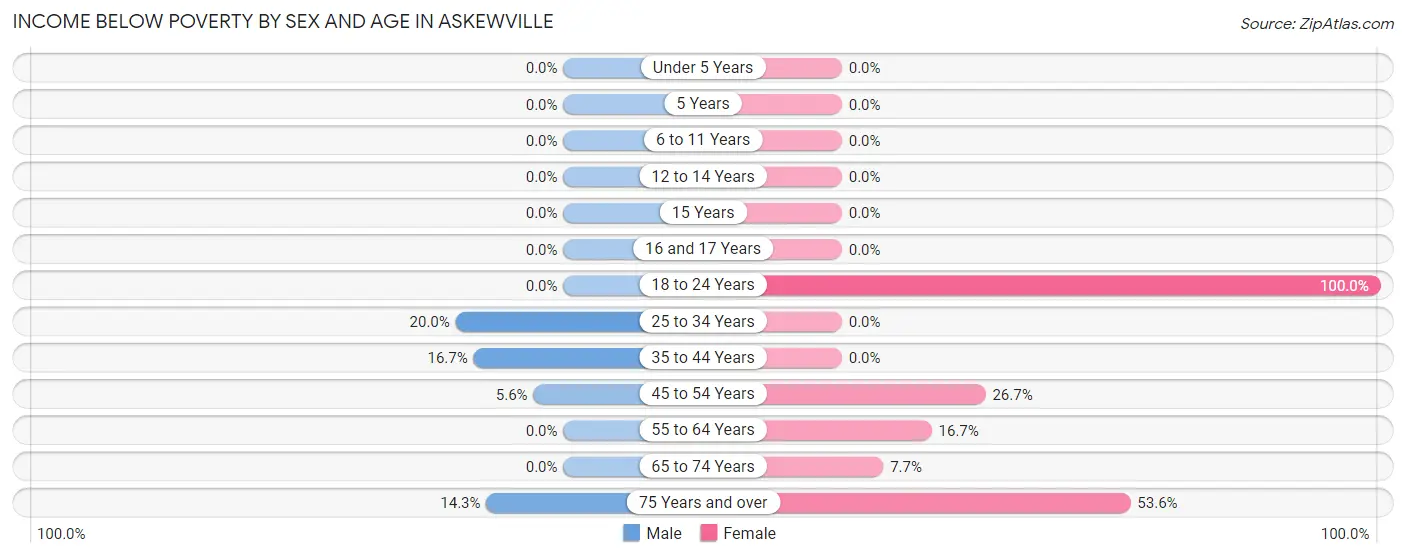
| Age Bracket | Male | Female |
| Under 5 Years | 0 (0.0%) | 0 (0.0%) |
| 5 Years | 0 (0.0%) | 0 (0.0%) |
| 6 to 11 Years | 0 (0.0%) | 0 (0.0%) |
| 12 to 14 Years | 0 (0.0%) | 0 (0.0%) |
| 15 Years | 0 (0.0%) | 0 (0.0%) |
| 16 and 17 Years | 0 (0.0%) | 0 (0.0%) |
| 18 to 24 Years | 0 (0.0%) | 2 (100.0%) |
| 25 to 34 Years | 2 (20.0%) | 0 (0.0%) |
| 35 to 44 Years | 1 (16.7%) | 0 (0.0%) |
| 45 to 54 Years | 1 (5.6%) | 4 (26.7%) |
| 55 to 64 Years | 0 (0.0%) | 2 (16.7%) |
| 65 to 74 Years | 0 (0.0%) | 1 (7.7%) |
| 75 Years and over | 1 (14.3%) | 15 (53.6%) |
| Total | 5 (5.6%) | 24 (25.3%) |
Income Above Poverty by Sex and Age in Askewville
According to the poverty statistics in Askewville, males aged under 5 years and females aged under 5 years are the age groups that are most secure financially, with 100.0% of males and 100.0% of females in these age groups living above the poverty line.
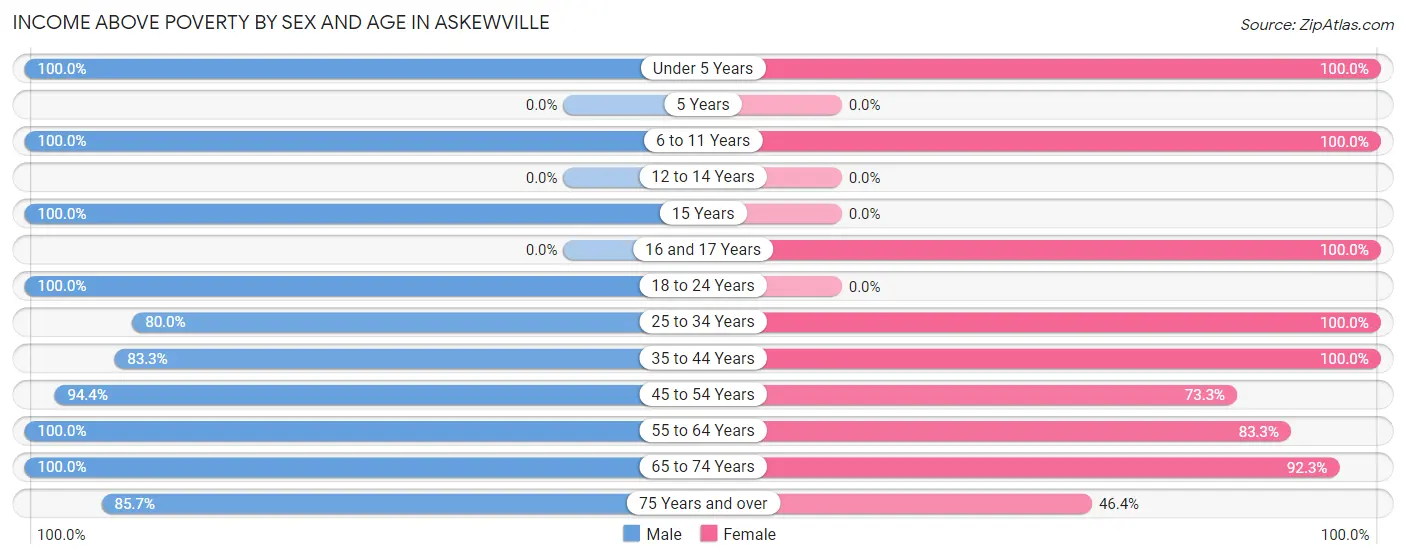
| Age Bracket | Male | Female |
| Under 5 Years | 5 (100.0%) | 6 (100.0%) |
| 5 Years | 0 (0.0%) | 0 (0.0%) |
| 6 to 11 Years | 5 (100.0%) | 2 (100.0%) |
| 12 to 14 Years | 0 (0.0%) | 0 (0.0%) |
| 15 Years | 2 (100.0%) | 0 (0.0%) |
| 16 and 17 Years | 0 (0.0%) | 6 (100.0%) |
| 18 to 24 Years | 20 (100.0%) | 0 (0.0%) |
| 25 to 34 Years | 8 (80.0%) | 8 (100.0%) |
| 35 to 44 Years | 5 (83.3%) | 3 (100.0%) |
| 45 to 54 Years | 17 (94.4%) | 11 (73.3%) |
| 55 to 64 Years | 9 (100.0%) | 10 (83.3%) |
| 65 to 74 Years | 7 (100.0%) | 12 (92.3%) |
| 75 Years and over | 6 (85.7%) | 13 (46.4%) |
| Total | 84 (94.4%) | 71 (74.7%) |
Income Below Poverty Among Married-Couple Families in Askewville
The poverty statistics for married-couple families in Askewville show that 4.6% or 2 of the total 43 families live below the poverty line. Families with no children have the highest poverty rate of 7.4%, comprising of 2 families. On the other hand, families with 1 or 2 children have the lowest poverty rate of 0.0%, which includes 0 families.
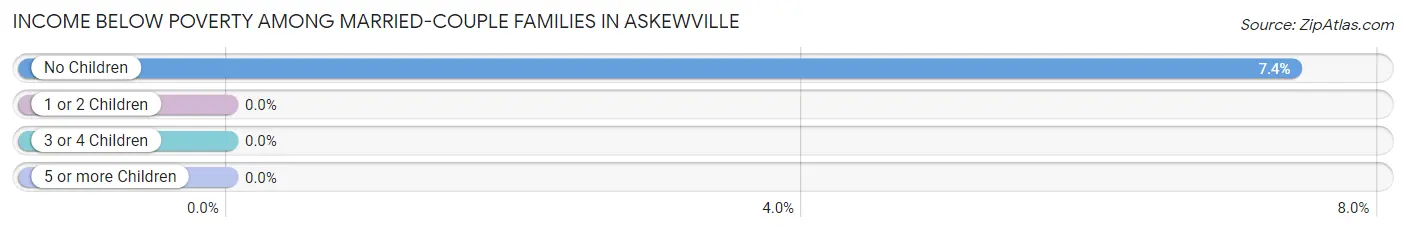
| Children | Above Poverty | Below Poverty |
| No Children | 25 (92.6%) | 2 (7.4%) |
| 1 or 2 Children | 16 (100.0%) | 0 (0.0%) |
| 3 or 4 Children | 0 (0.0%) | 0 (0.0%) |
| 5 or more Children | 0 (0.0%) | 0 (0.0%) |
| Total | 41 (95.4%) | 2 (4.6%) |
Income Below Poverty Among Single-Parent Households in Askewville
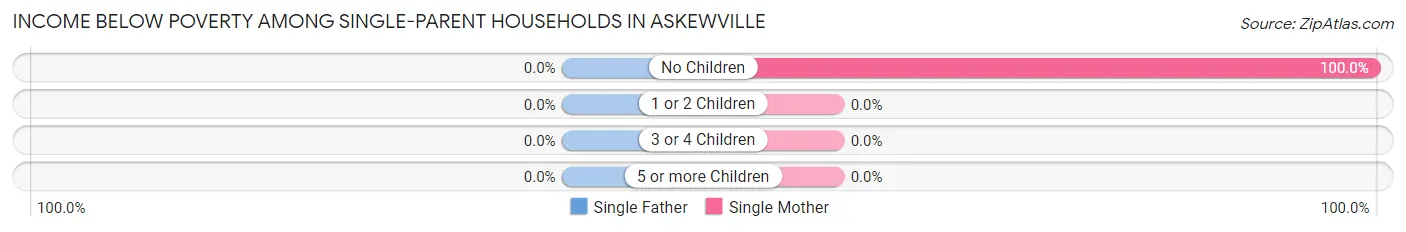
| Children | Single Father | Single Mother |
| No Children | 0 (0.0%) | 1 (100.0%) |
| 1 or 2 Children | 0 (0.0%) | 0 (0.0%) |
| 3 or 4 Children | 0 (0.0%) | 0 (0.0%) |
| 5 or more Children | 0 (0.0%) | 0 (0.0%) |
| Total | 0 (0.0%) | 1 (100.0%) |
Income Below Poverty Among Married-Couple vs Single-Parent Households in Askewville
The poverty data for Askewville shows that 2 of the married-couple family households (4.6%) and 1 of the single-parent households (20.0%) are living below the poverty level. Within the married-couple family households, those with no children have the highest poverty rate, with 2 households (7.4%) falling below the poverty line. Among the single-parent households, those with no children have the highest poverty rate, with 1 household (100.0%) living below poverty.
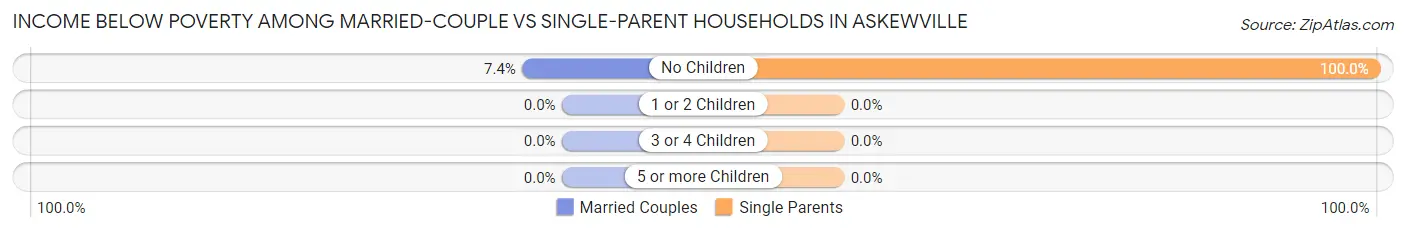
| Children | Married-Couple Families | Single-Parent Households |
| No Children | 2 (7.4%) | 1 (100.0%) |
| 1 or 2 Children | 0 (0.0%) | 0 (0.0%) |
| 3 or 4 Children | 0 (0.0%) | 0 (0.0%) |
| 5 or more Children | 0 (0.0%) | 0 (0.0%) |
| Total | 2 (4.6%) | 1 (20.0%) |
Employment Characteristics in Askewville
Employment by Class of Employer in Askewville
Among the 72 employed individuals in Askewville, state government employees (25 | 34.7%), private company employees (22 | 30.6%), and local government employees (8 | 11.1%) make up the most common classes of employment.
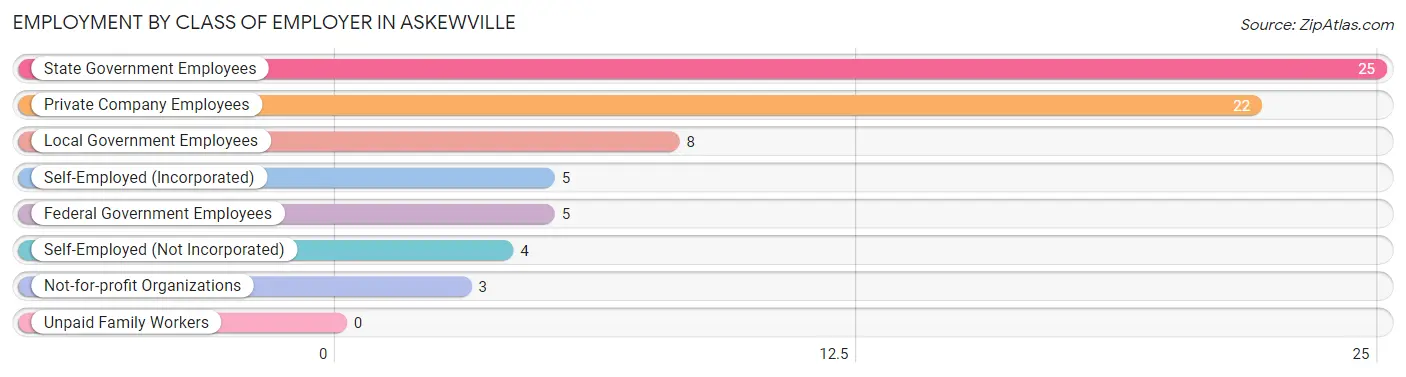
| Employer Class | # Employees | % Employees |
| Private Company Employees | 22 | 30.6% |
| Self-Employed (Incorporated) | 5 | 6.9% |
| Self-Employed (Not Incorporated) | 4 | 5.6% |
| Not-for-profit Organizations | 3 | 4.2% |
| Local Government Employees | 8 | 11.1% |
| State Government Employees | 25 | 34.7% |
| Federal Government Employees | 5 | 6.9% |
| Unpaid Family Workers | 0 | 0.0% |
| Total | 72 | 100.0% |
Employment Status by Age in Askewville
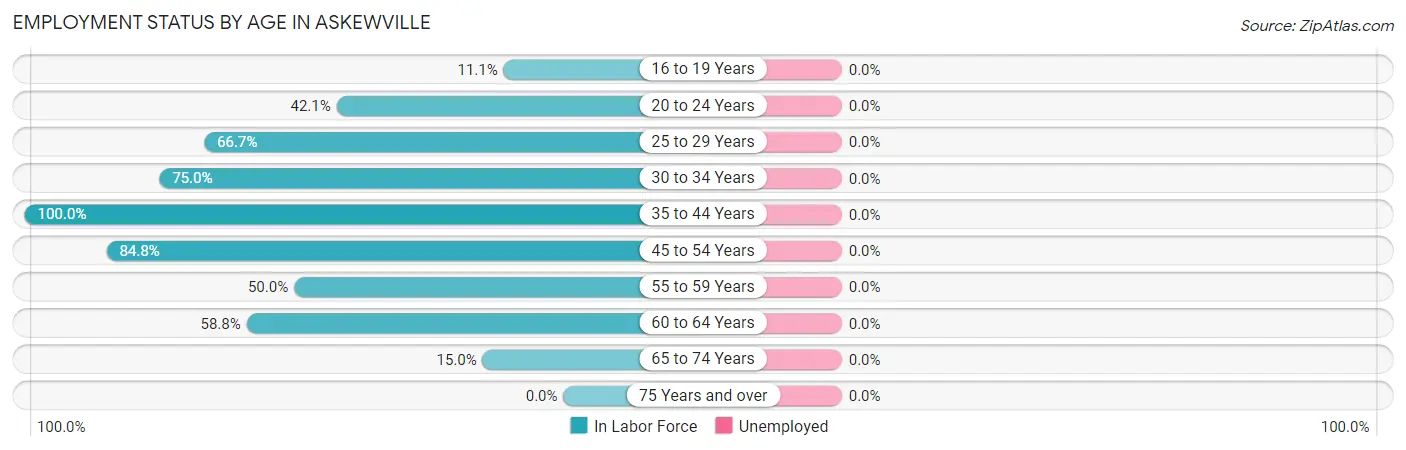
| Age Bracket | In Labor Force | Unemployed |
| 16 to 19 Years | 1 (11.1%) | 0 (0.0%) |
| 20 to 24 Years | 8 (42.1%) | 0 (0.0%) |
| 25 to 29 Years | 4 (66.7%) | 0 (0.0%) |
| 30 to 34 Years | 9 (75.0%) | 0 (0.0%) |
| 35 to 44 Years | 9 (100.0%) | 0 (0.0%) |
| 45 to 54 Years | 28 (84.8%) | 0 (0.0%) |
| 55 to 59 Years | 2 (50.0%) | 0 (0.0%) |
| 60 to 64 Years | 10 (58.8%) | 0 (0.0%) |
| 65 to 74 Years | 3 (15.0%) | 0 (0.0%) |
| 75 Years and over | 0 (0.0%) | 0 (0.0%) |
| Total | 74 (45.1%) | 0 (0.0%) |
Employment Status by Educational Attainment in Askewville
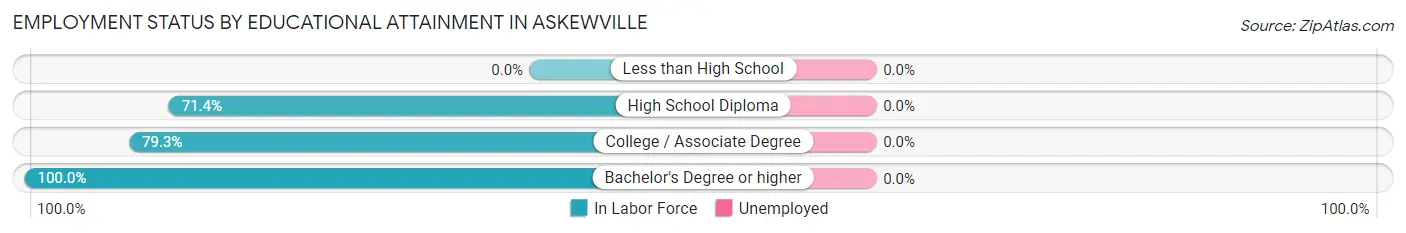
| Educational Attainment | In Labor Force | Unemployed |
| Less than High School | 0 (0.0%) | 0 (0.0%) |
| High School Diploma | 25 (71.4%) | 0 (0.0%) |
| College / Associate Degree | 23 (79.3%) | 0 (0.0%) |
| Bachelor's Degree or higher | 14 (100.0%) | 0 (0.0%) |
| Total | 62 (76.5%) | 0 (0.0%) |
Employment Occupations by Sex in Askewville
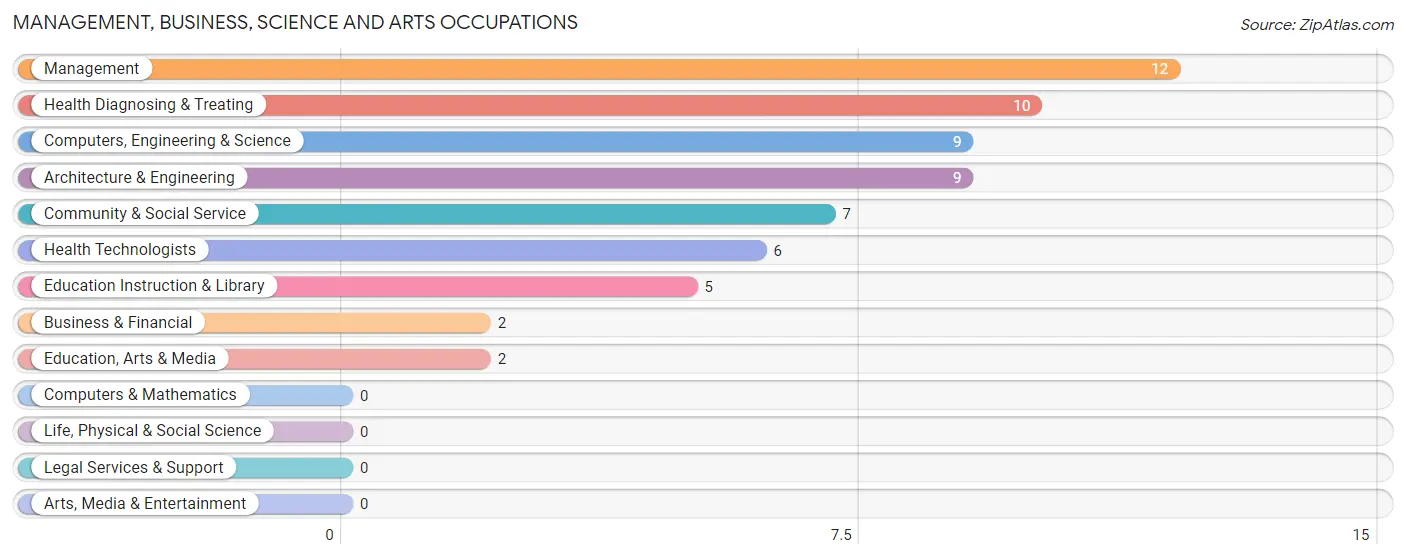
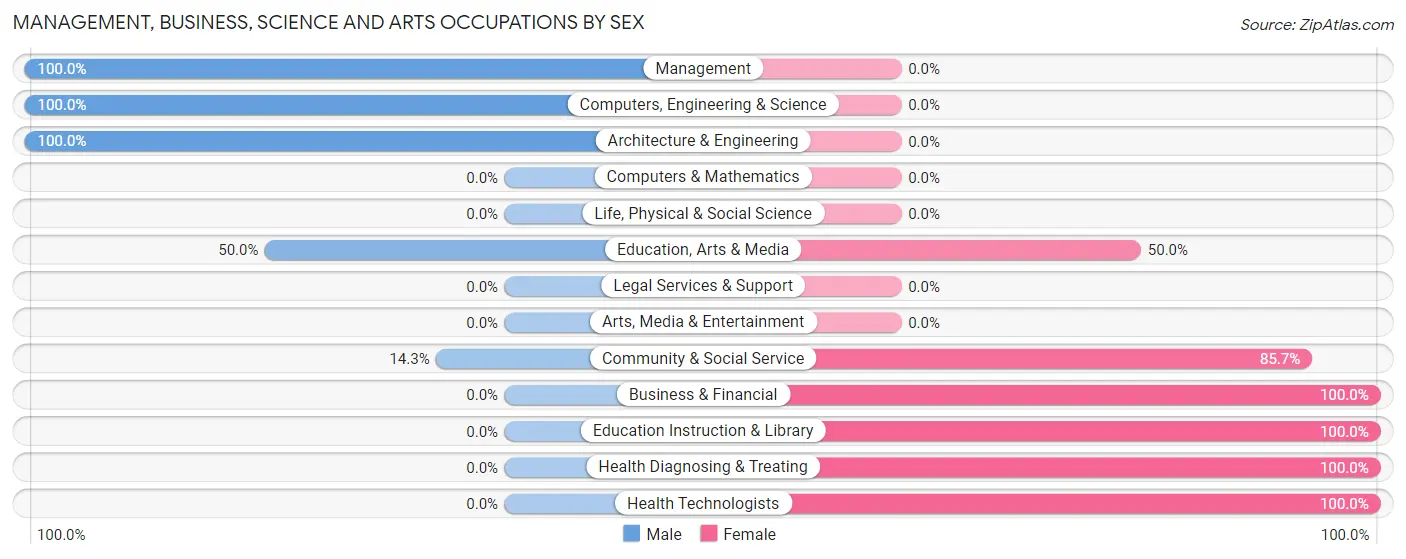
Management, Business, Science and Arts Occupations
The most common Management, Business, Science and Arts occupations in Askewville are Management (12 | 16.2%), Health Diagnosing & Treating (10 | 13.5%), Computers, Engineering & Science (9 | 12.2%), Architecture & Engineering (9 | 12.2%), and Community & Social Service (7 | 9.5%).
Management, Business, Science and Arts Occupations by Sex
Within the Management, Business, Science and Arts occupations in Askewville, the most male-oriented occupations are Management (100.0%), Computers, Engineering & Science (100.0%), and Architecture & Engineering (100.0%), while the most female-oriented occupations are Business & Financial (100.0%), Education Instruction & Library (100.0%), and Health Diagnosing & Treating (100.0%).
| Occupation | Male | Female |
| Management | 12 (100.0%) | 0 (0.0%) |
| Business & Financial | 0 (0.0%) | 2 (100.0%) |
| Computers, Engineering & Science | 9 (100.0%) | 0 (0.0%) |
| Computers & Mathematics | 0 (0.0%) | 0 (0.0%) |
| Architecture & Engineering | 9 (100.0%) | 0 (0.0%) |
| Life, Physical & Social Science | 0 (0.0%) | 0 (0.0%) |
| Community & Social Service | 1 (14.3%) | 6 (85.7%) |
| Education, Arts & Media | 1 (50.0%) | 1 (50.0%) |
| Legal Services & Support | 0 (0.0%) | 0 (0.0%) |
| Education Instruction & Library | 0 (0.0%) | 5 (100.0%) |
| Arts, Media & Entertainment | 0 (0.0%) | 0 (0.0%) |
| Health Diagnosing & Treating | 0 (0.0%) | 10 (100.0%) |
| Health Technologists | 0 (0.0%) | 6 (100.0%) |
| Total (Category) | 22 (55.0%) | 18 (45.0%) |
| Total (Overall) | 43 (58.1%) | 31 (41.9%) |
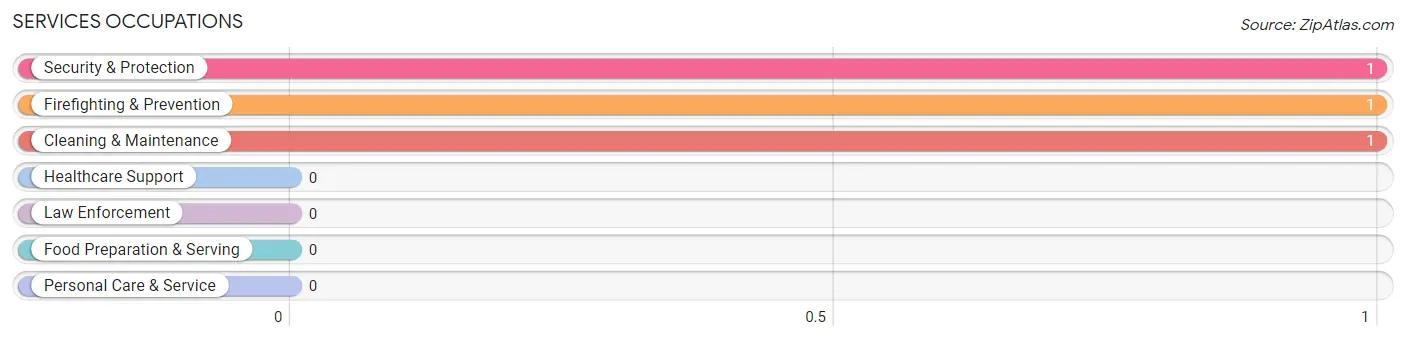
Services Occupations
The most common Services occupations in Askewville are Security & Protection (1 | 1.3%), Firefighting & Prevention (1 | 1.3%), and Cleaning & Maintenance (1 | 1.3%).
Services Occupations by Sex
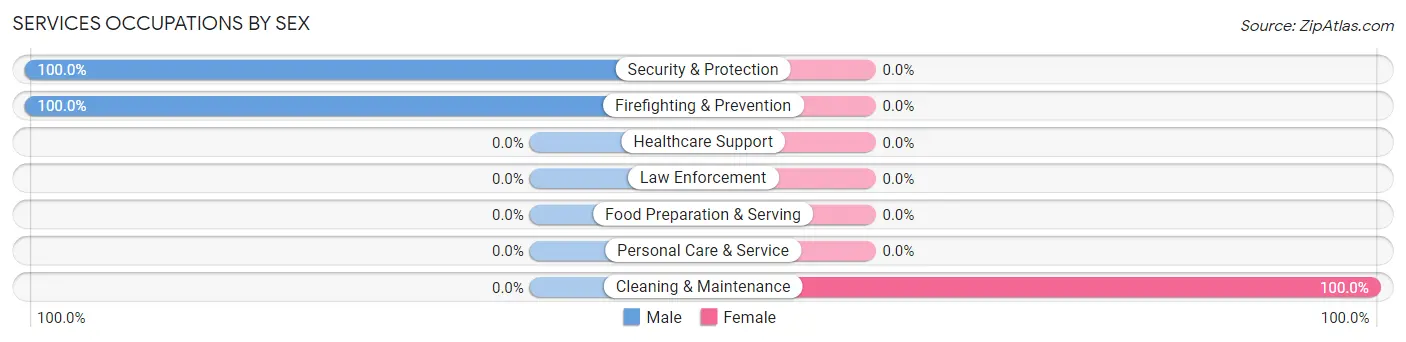
| Occupation | Male | Female |
| Healthcare Support | 0 (0.0%) | 0 (0.0%) |
| Security & Protection | 1 (100.0%) | 0 (0.0%) |
| Firefighting & Prevention | 1 (100.0%) | 0 (0.0%) |
| Law Enforcement | 0 (0.0%) | 0 (0.0%) |
| Food Preparation & Serving | 0 (0.0%) | 0 (0.0%) |
| Cleaning & Maintenance | 0 (0.0%) | 1 (100.0%) |
| Personal Care & Service | 0 (0.0%) | 0 (0.0%) |
| Total (Category) | 1 (50.0%) | 1 (50.0%) |
| Total (Overall) | 43 (58.1%) | 31 (41.9%) |
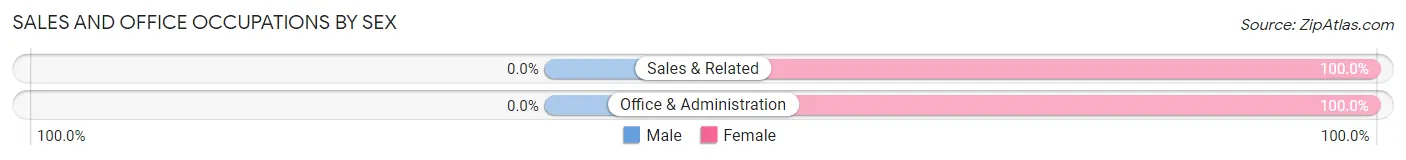
Sales and Office Occupations
The most common Sales and Office occupations in Askewville are Office & Administration (10 | 13.5%), and Sales & Related (2 | 2.7%).

Sales and Office Occupations by Sex
| Occupation | Male | Female |
| Sales & Related | 0 (0.0%) | 2 (100.0%) |
| Office & Administration | 0 (0.0%) | 10 (100.0%) |
| Total (Category) | 0 (0.0%) | 12 (100.0%) |
| Total (Overall) | 43 (58.1%) | 31 (41.9%) |
Natural Resources, Construction and Maintenance Occupations
The most common Natural Resources, Construction and Maintenance occupations in Askewville are , and Construction & Extraction (16 | 21.6%).
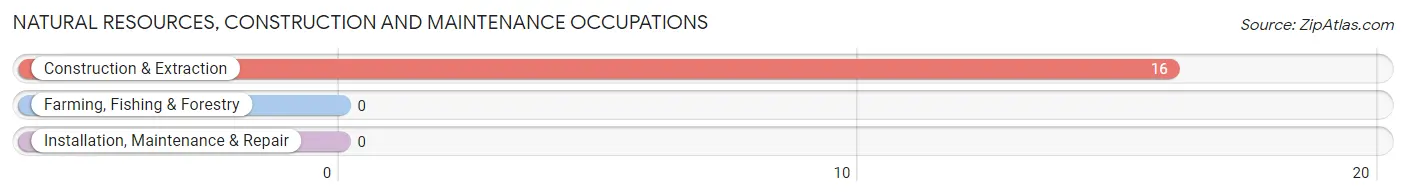
Natural Resources, Construction and Maintenance Occupations by Sex
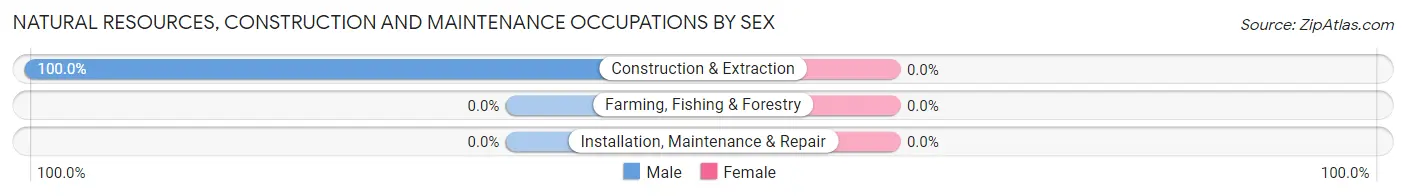
| Occupation | Male | Female |
| Farming, Fishing & Forestry | 0 (0.0%) | 0 (0.0%) |
| Construction & Extraction | 16 (100.0%) | 0 (0.0%) |
| Installation, Maintenance & Repair | 0 (0.0%) | 0 (0.0%) |
| Total (Category) | 16 (100.0%) | 0 (0.0%) |
| Total (Overall) | 43 (58.1%) | 31 (41.9%) |
Production, Transportation and Moving Occupations
The most common Production, Transportation and Moving occupations in Askewville are Production (2 | 2.7%), and Material Moving (2 | 2.7%).
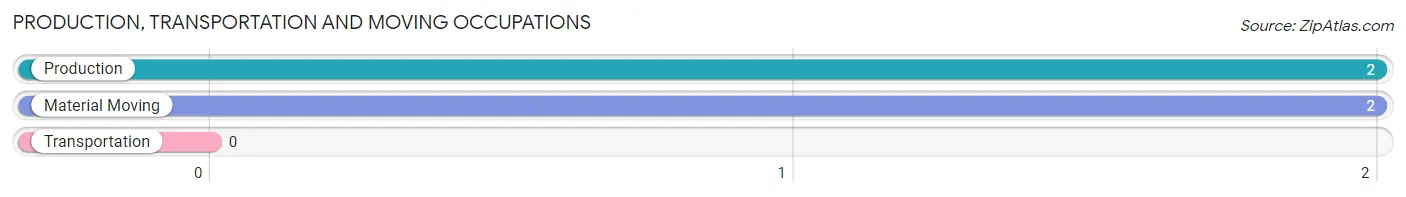
Production, Transportation and Moving Occupations by Sex
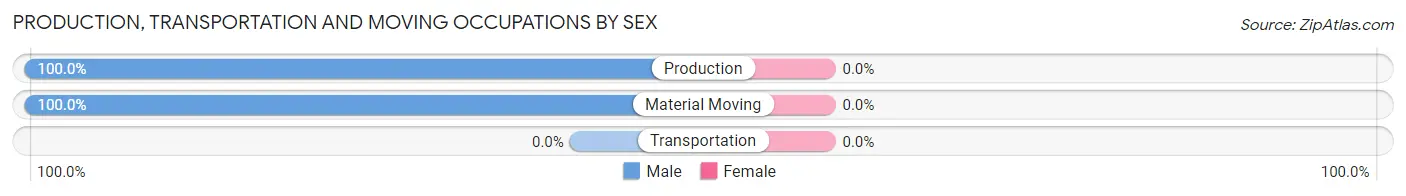
| Occupation | Male | Female |
| Production | 2 (100.0%) | 0 (0.0%) |
| Transportation | 0 (0.0%) | 0 (0.0%) |
| Material Moving | 2 (100.0%) | 0 (0.0%) |
| Total (Category) | 4 (100.0%) | 0 (0.0%) |
| Total (Overall) | 43 (58.1%) | 31 (41.9%) |
Employment Industries by Sex in Askewville
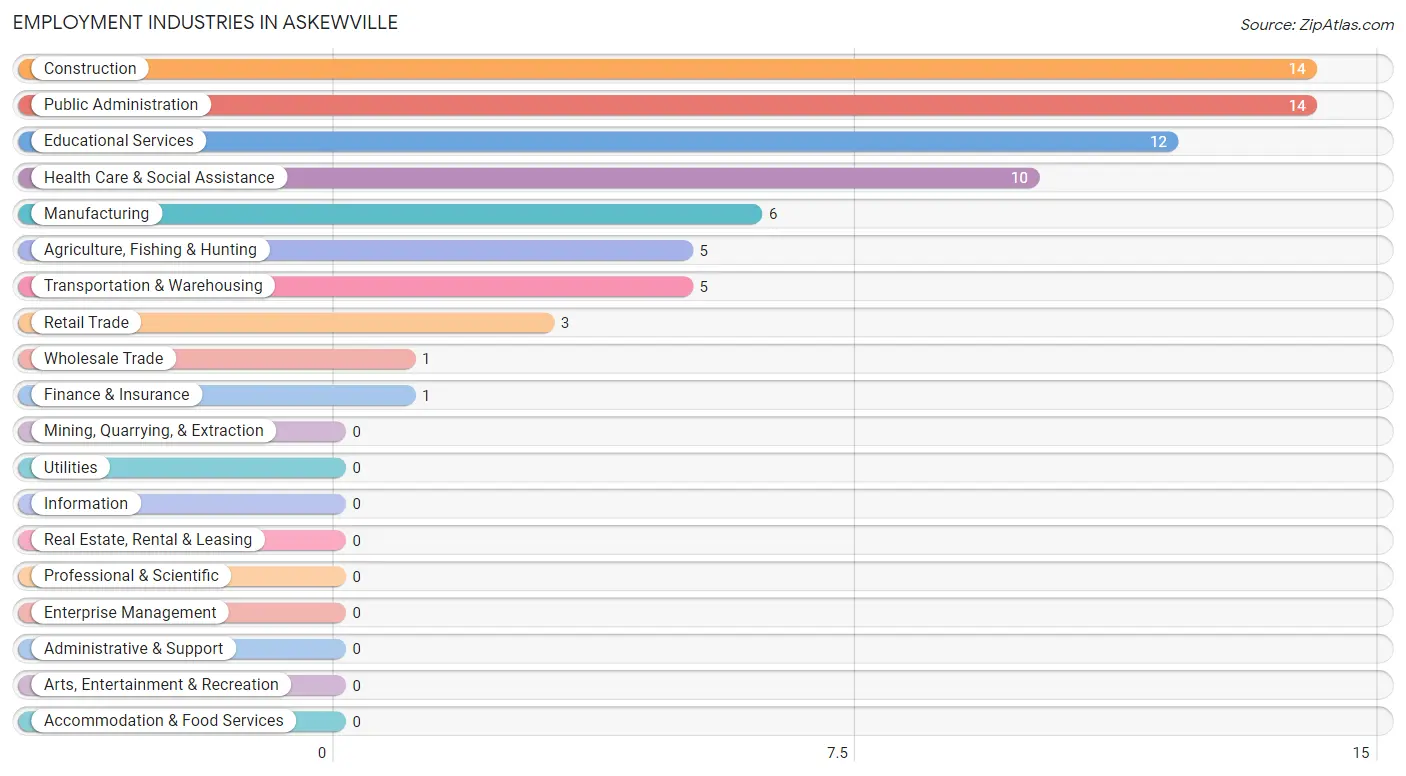
Employment Industries in Askewville
The major employment industries in Askewville include Construction (14 | 18.9%), Public Administration (14 | 18.9%), Educational Services (12 | 16.2%), Health Care & Social Assistance (10 | 13.5%), and Manufacturing (6 | 8.1%).
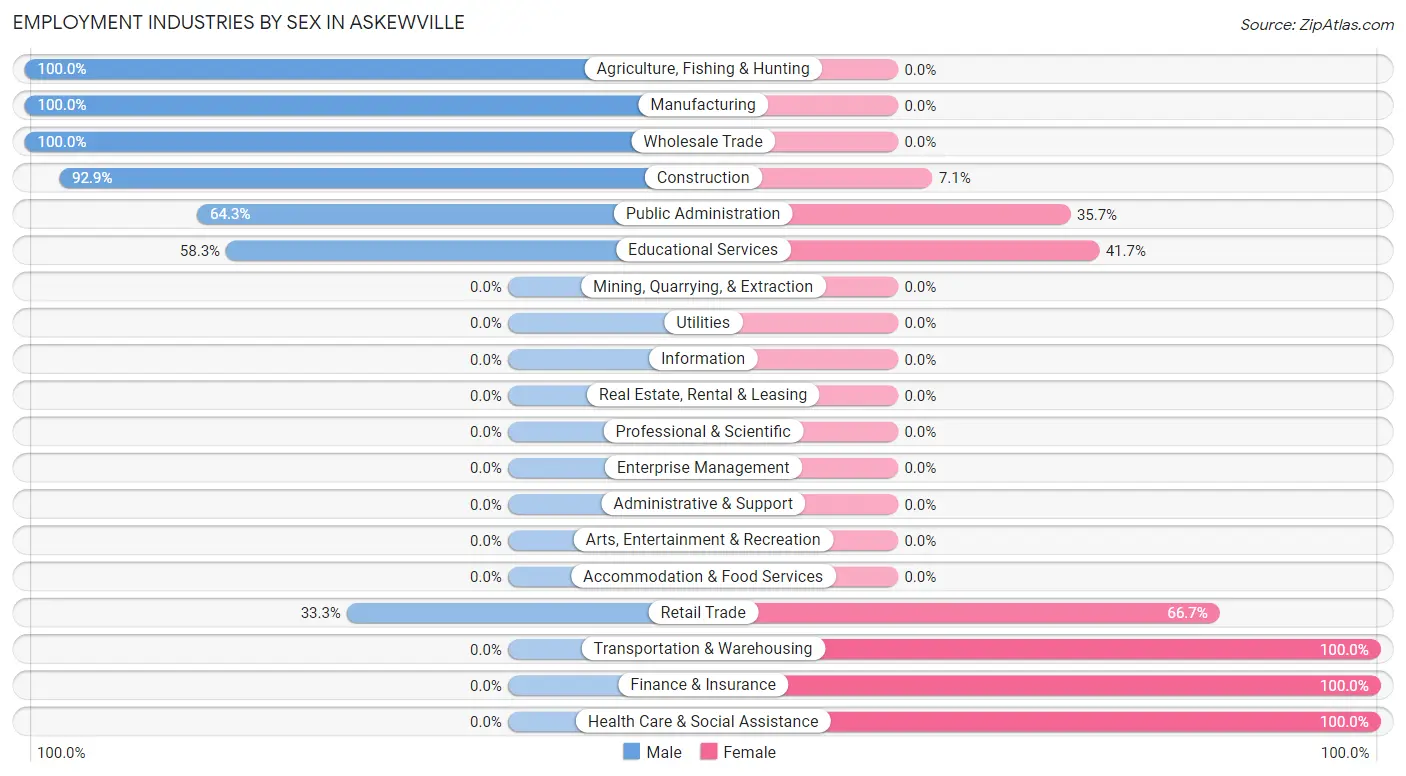
Employment Industries by Sex in Askewville
The Askewville industries that see more men than women are Agriculture, Fishing & Hunting (100.0%), Manufacturing (100.0%), and Wholesale Trade (100.0%), whereas the industries that tend to have a higher number of women are Transportation & Warehousing (100.0%), Finance & Insurance (100.0%), and Health Care & Social Assistance (100.0%).
| Industry | Male | Female |
| Agriculture, Fishing & Hunting | 5 (100.0%) | 0 (0.0%) |
| Mining, Quarrying, & Extraction | 0 (0.0%) | 0 (0.0%) |
| Construction | 13 (92.9%) | 1 (7.1%) |
| Manufacturing | 6 (100.0%) | 0 (0.0%) |
| Wholesale Trade | 1 (100.0%) | 0 (0.0%) |
| Retail Trade | 1 (33.3%) | 2 (66.7%) |
| Transportation & Warehousing | 0 (0.0%) | 5 (100.0%) |
| Utilities | 0 (0.0%) | 0 (0.0%) |
| Information | 0 (0.0%) | 0 (0.0%) |
| Finance & Insurance | 0 (0.0%) | 1 (100.0%) |
| Real Estate, Rental & Leasing | 0 (0.0%) | 0 (0.0%) |
| Professional & Scientific | 0 (0.0%) | 0 (0.0%) |
| Enterprise Management | 0 (0.0%) | 0 (0.0%) |
| Administrative & Support | 0 (0.0%) | 0 (0.0%) |
| Educational Services | 7 (58.3%) | 5 (41.7%) |
| Health Care & Social Assistance | 0 (0.0%) | 10 (100.0%) |
| Arts, Entertainment & Recreation | 0 (0.0%) | 0 (0.0%) |
| Accommodation & Food Services | 0 (0.0%) | 0 (0.0%) |
| Public Administration | 9 (64.3%) | 5 (35.7%) |
| Total | 43 (58.1%) | 31 (41.9%) |
Education in Askewville
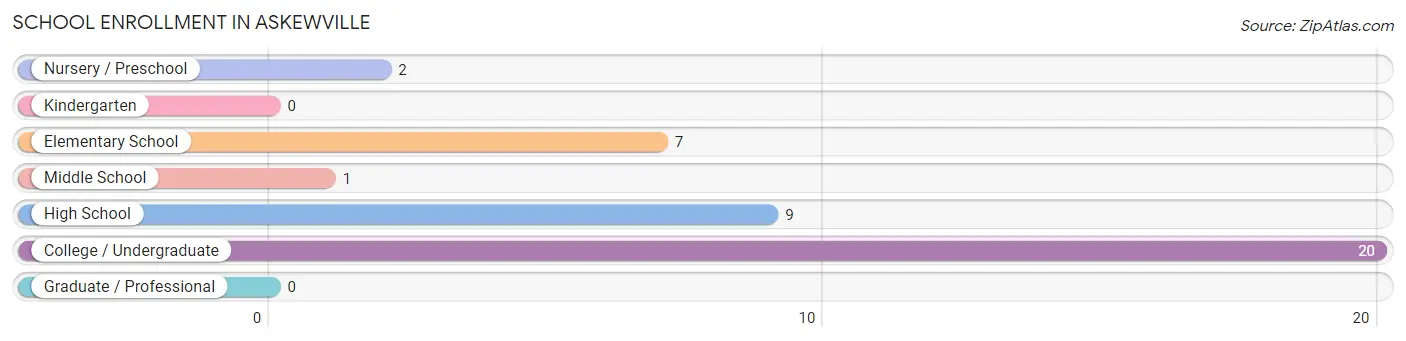
School Enrollment in Askewville
The most common levels of schooling among the 39 students in Askewville are college / undergraduate (20 | 51.3%), high school (9 | 23.1%), and elementary school (7 | 17.9%).
| School Level | # Students | % Students |
| Nursery / Preschool | 2 | 5.1% |
| Kindergarten | 0 | 0.0% |
| Elementary School | 7 | 17.9% |
| Middle School | 1 | 2.6% |
| High School | 9 | 23.1% |
| College / Undergraduate | 20 | 51.3% |
| Graduate / Professional | 0 | 0.0% |
| Total | 39 | 100.0% |
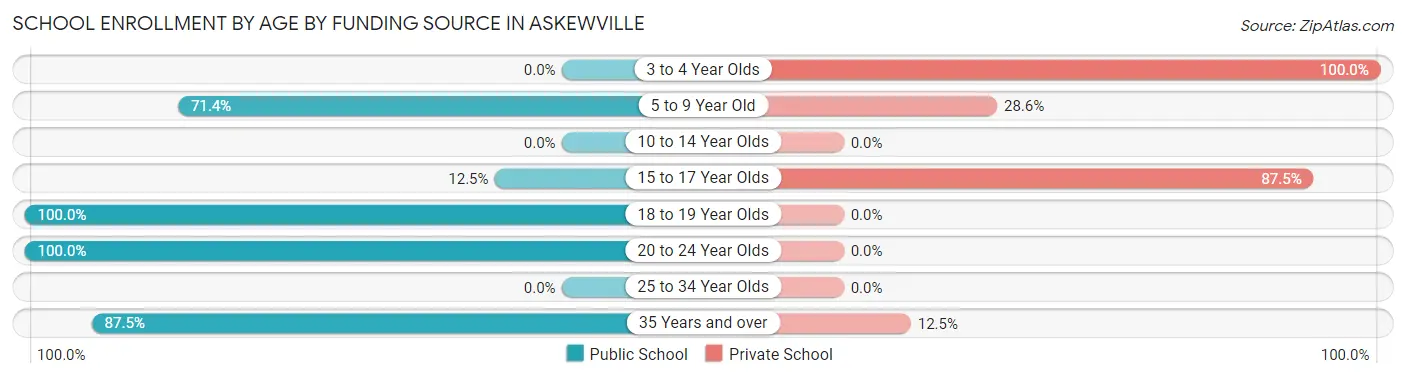
School Enrollment by Age by Funding Source in Askewville
Out of a total of 39 students who are enrolled in schools in Askewville, 12 (30.8%) attend a private institution, while the remaining 27 (69.2%) are enrolled in public schools. The age group of 3 to 4 year olds has the highest likelihood of being enrolled in private schools, with 2 (100.0% in the age bracket) enrolled. Conversely, the age group of 18 to 19 year olds has the lowest likelihood of being enrolled in a private school, with 3 (100.0% in the age bracket) attending a public institution.
| Age Bracket | Public School | Private School |
| 3 to 4 Year Olds | 0 (0.0%) | 2 (100.0%) |
| 5 to 9 Year Old | 5 (71.4%) | 2 (28.6%) |
| 10 to 14 Year Olds | 0 (0.0%) | 0 (0.0%) |
| 15 to 17 Year Olds | 1 (12.5%) | 7 (87.5%) |
| 18 to 19 Year Olds | 3 (100.0%) | 0 (0.0%) |
| 20 to 24 Year Olds | 11 (100.0%) | 0 (0.0%) |
| 25 to 34 Year Olds | 0 (0.0%) | 0 (0.0%) |
| 35 Years and over | 7 (87.5%) | 1 (12.5%) |
| Total | 27 (69.2%) | 12 (30.8%) |
Educational Attainment by Field of Study in Askewville
Computers & mathematics (7 | 50.0%), education (5 | 35.7%), and liberal arts & history (2 | 14.3%) are the most common fields of study among 14 individuals in Askewville who have obtained a bachelor's degree or higher.
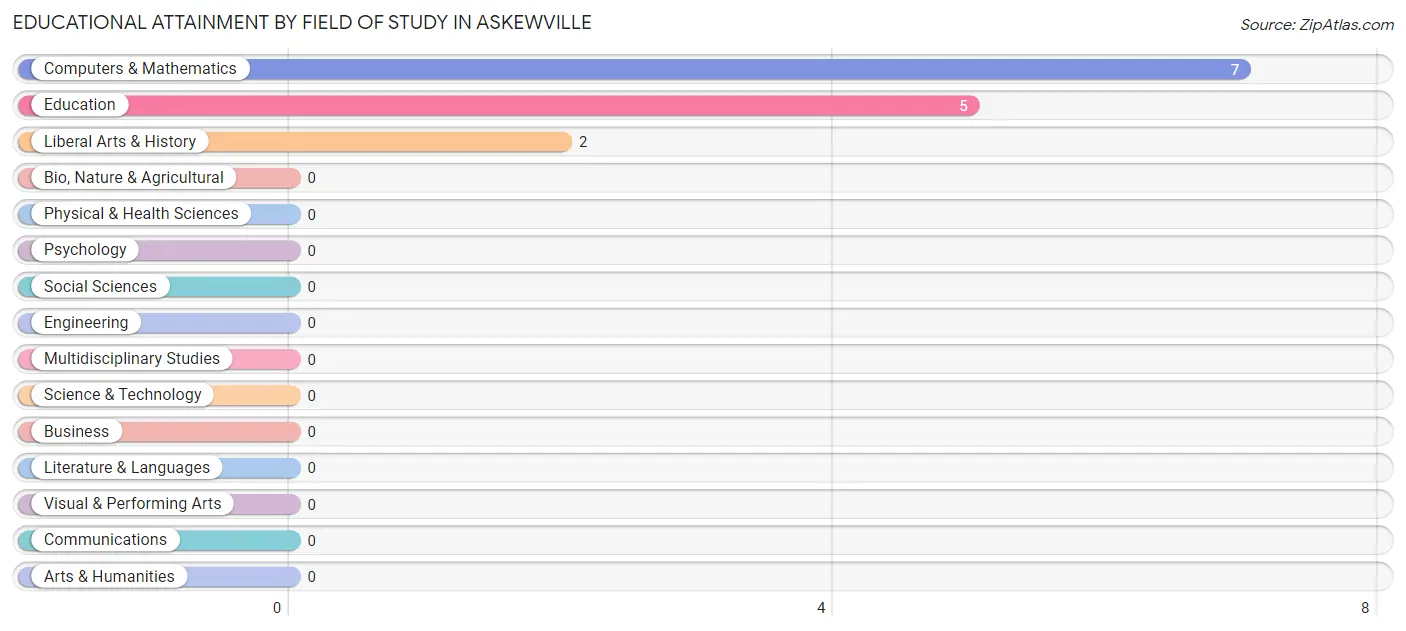
| Field of Study | # Graduates | % Graduates |
| Computers & Mathematics | 7 | 50.0% |
| Bio, Nature & Agricultural | 0 | 0.0% |
| Physical & Health Sciences | 0 | 0.0% |
| Psychology | 0 | 0.0% |
| Social Sciences | 0 | 0.0% |
| Engineering | 0 | 0.0% |
| Multidisciplinary Studies | 0 | 0.0% |
| Science & Technology | 0 | 0.0% |
| Business | 0 | 0.0% |
| Education | 5 | 35.7% |
| Literature & Languages | 0 | 0.0% |
| Liberal Arts & History | 2 | 14.3% |
| Visual & Performing Arts | 0 | 0.0% |
| Communications | 0 | 0.0% |
| Arts & Humanities | 0 | 0.0% |
| Total | 14 | 100.0% |
Transportation & Commute in Askewville
Vehicle Availability by Sex in Askewville
The most prevalent vehicle ownership categories in Askewville are males with 3 vehicles (24, accounting for 58.5%) and females with 3 vehicles (18, making up 77.4%).
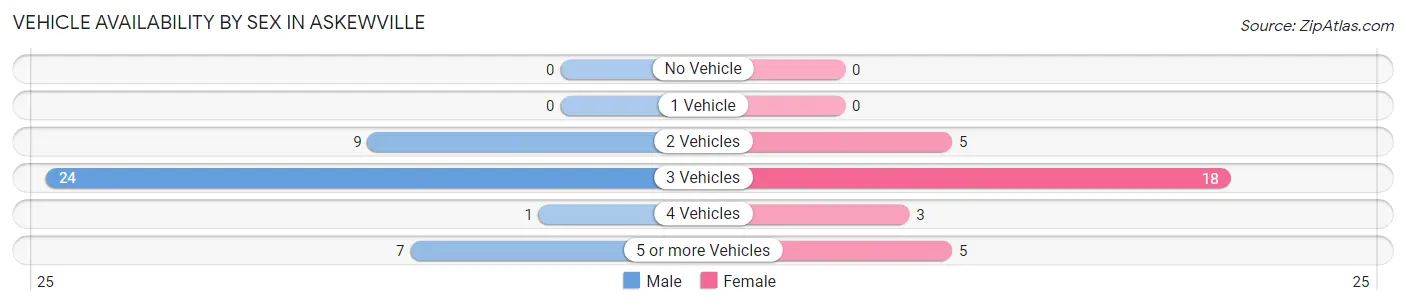
| Vehicles Available | Male | Female |
| No Vehicle | 0 (0.0%) | 0 (0.0%) |
| 1 Vehicle | 0 (0.0%) | 0 (0.0%) |
| 2 Vehicles | 9 (22.0%) | 5 (16.1%) |
| 3 Vehicles | 24 (58.5%) | 18 (58.1%) |
| 4 Vehicles | 1 (2.4%) | 3 (9.7%) |
| 5 or more Vehicles | 7 (17.1%) | 5 (16.1%) |
| Total | 41 (100.0%) | 31 (100.0%) |
Commute Time in Askewville
The most frequently occuring commute durations in Askewville are 15 to 19 minutes (14 commuters, 19.4%), 25 to 29 minutes (13 commuters, 18.1%), and less than 5 minutes (11 commuters, 15.3%).
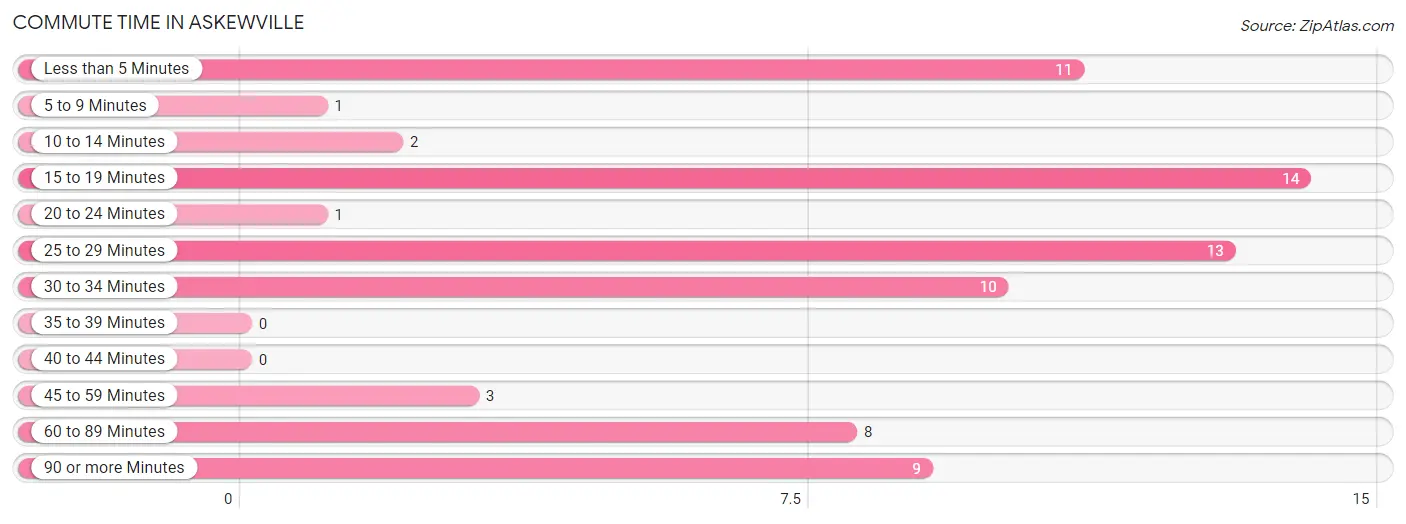
| Commute Time | # Commuters | % Commuters |
| Less than 5 Minutes | 11 | 15.3% |
| 5 to 9 Minutes | 1 | 1.4% |
| 10 to 14 Minutes | 2 | 2.8% |
| 15 to 19 Minutes | 14 | 19.4% |
| 20 to 24 Minutes | 1 | 1.4% |
| 25 to 29 Minutes | 13 | 18.1% |
| 30 to 34 Minutes | 10 | 13.9% |
| 35 to 39 Minutes | 0 | 0.0% |
| 40 to 44 Minutes | 0 | 0.0% |
| 45 to 59 Minutes | 3 | 4.2% |
| 60 to 89 Minutes | 8 | 11.1% |
| 90 or more Minutes | 9 | 12.5% |
Commute Time by Sex in Askewville
The most common commute times in Askewville are 25 to 29 minutes (12 commuters, 29.3%) for males and 30 to 34 minutes (8 commuters, 25.8%) for females.
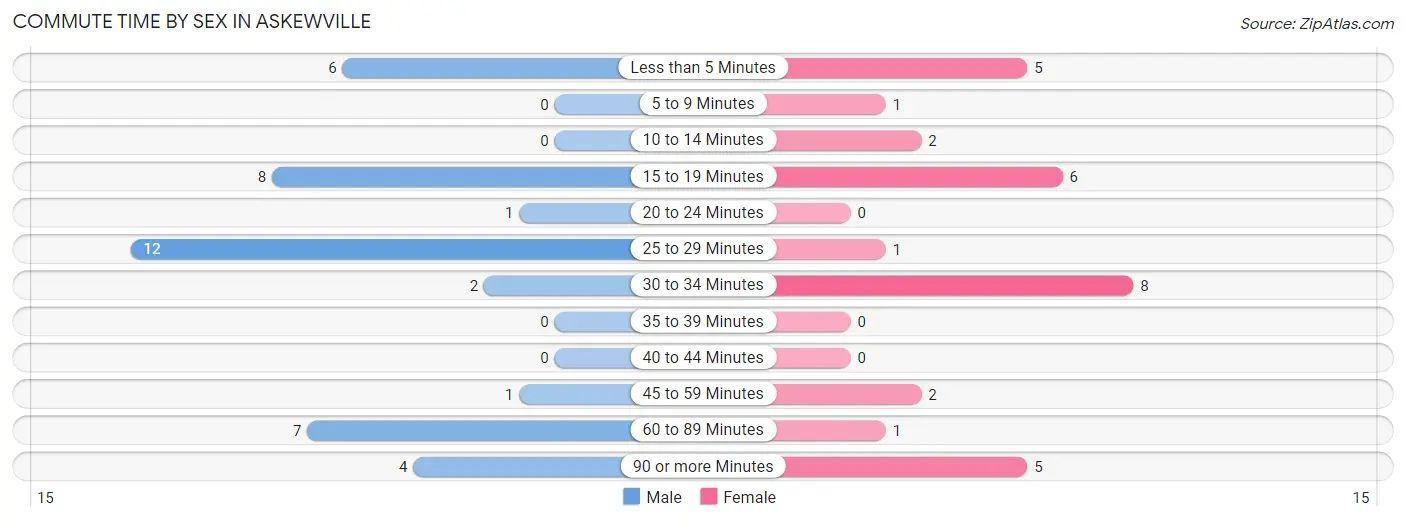
| Commute Time | Male | Female |
| Less than 5 Minutes | 6 (14.6%) | 5 (16.1%) |
| 5 to 9 Minutes | 0 (0.0%) | 1 (3.2%) |
| 10 to 14 Minutes | 0 (0.0%) | 2 (6.5%) |
| 15 to 19 Minutes | 8 (19.5%) | 6 (19.4%) |
| 20 to 24 Minutes | 1 (2.4%) | 0 (0.0%) |
| 25 to 29 Minutes | 12 (29.3%) | 1 (3.2%) |
| 30 to 34 Minutes | 2 (4.9%) | 8 (25.8%) |
| 35 to 39 Minutes | 0 (0.0%) | 0 (0.0%) |
| 40 to 44 Minutes | 0 (0.0%) | 0 (0.0%) |
| 45 to 59 Minutes | 1 (2.4%) | 2 (6.5%) |
| 60 to 89 Minutes | 7 (17.1%) | 1 (3.2%) |
| 90 or more Minutes | 4 (9.8%) | 5 (16.1%) |
Time of Departure to Work by Sex in Askewville
The most frequent times of departure to work in Askewville are 6:00 AM to 6:29 AM (15, 36.6%) for males and 7:30 AM to 7:59 AM (15, 48.4%) for females.
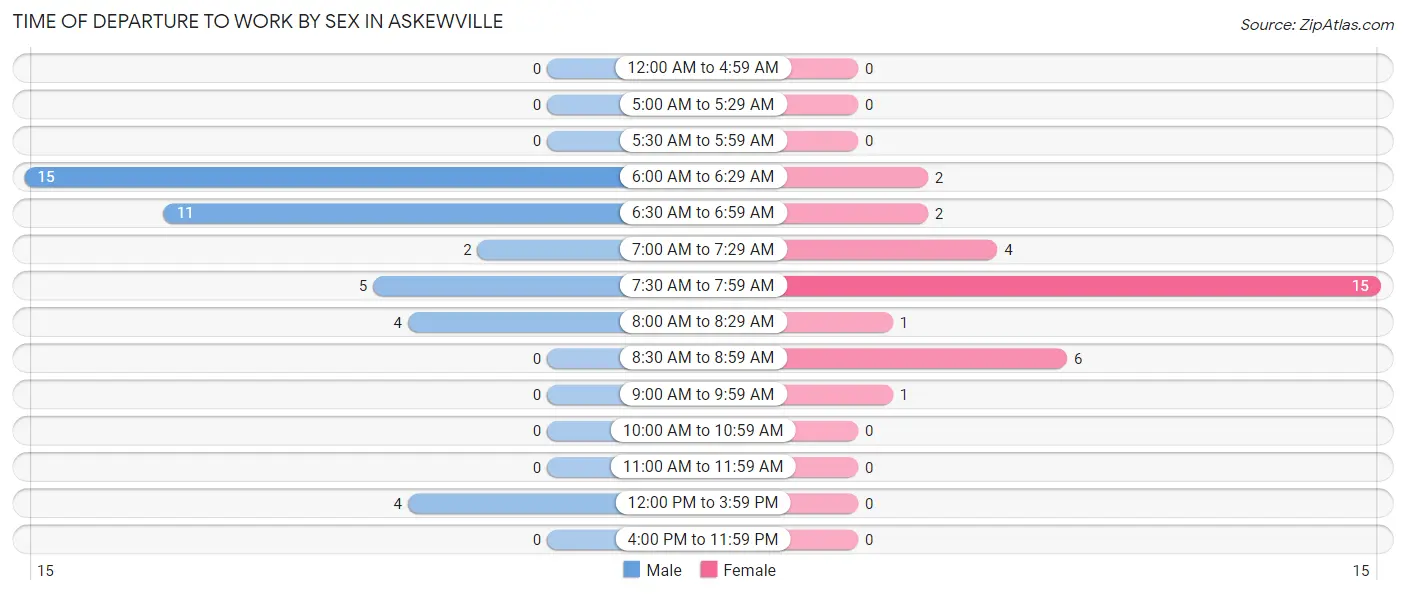
| Time of Departure | Male | Female |
| 12:00 AM to 4:59 AM | 0 (0.0%) | 0 (0.0%) |
| 5:00 AM to 5:29 AM | 0 (0.0%) | 0 (0.0%) |
| 5:30 AM to 5:59 AM | 0 (0.0%) | 0 (0.0%) |
| 6:00 AM to 6:29 AM | 15 (36.6%) | 2 (6.5%) |
| 6:30 AM to 6:59 AM | 11 (26.8%) | 2 (6.5%) |
| 7:00 AM to 7:29 AM | 2 (4.9%) | 4 (12.9%) |
| 7:30 AM to 7:59 AM | 5 (12.2%) | 15 (48.4%) |
| 8:00 AM to 8:29 AM | 4 (9.8%) | 1 (3.2%) |
| 8:30 AM to 8:59 AM | 0 (0.0%) | 6 (19.4%) |
| 9:00 AM to 9:59 AM | 0 (0.0%) | 1 (3.2%) |
| 10:00 AM to 10:59 AM | 0 (0.0%) | 0 (0.0%) |
| 11:00 AM to 11:59 AM | 0 (0.0%) | 0 (0.0%) |
| 12:00 PM to 3:59 PM | 4 (9.8%) | 0 (0.0%) |
| 4:00 PM to 11:59 PM | 0 (0.0%) | 0 (0.0%) |
| Total | 41 (100.0%) | 31 (100.0%) |
Housing Occupancy in Askewville
Occupancy by Ownership in Askewville
Of the total 86 dwellings in Askewville, owner-occupied units account for 64 (74.4%), while renter-occupied units make up 22 (25.6%).
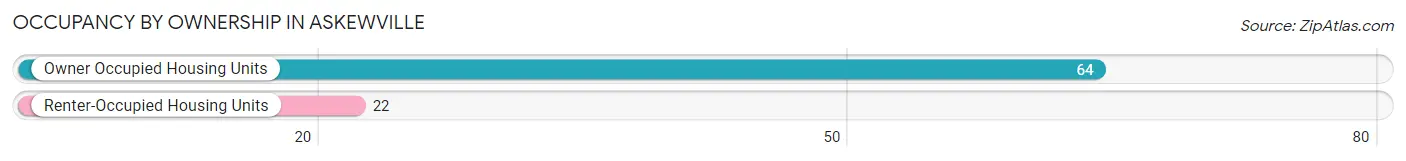
| Occupancy | # Housing Units | % Housing Units |
| Owner Occupied Housing Units | 64 | 74.4% |
| Renter-Occupied Housing Units | 22 | 25.6% |
| Total Occupied Housing Units | 86 | 100.0% |
Occupancy by Household Size in Askewville
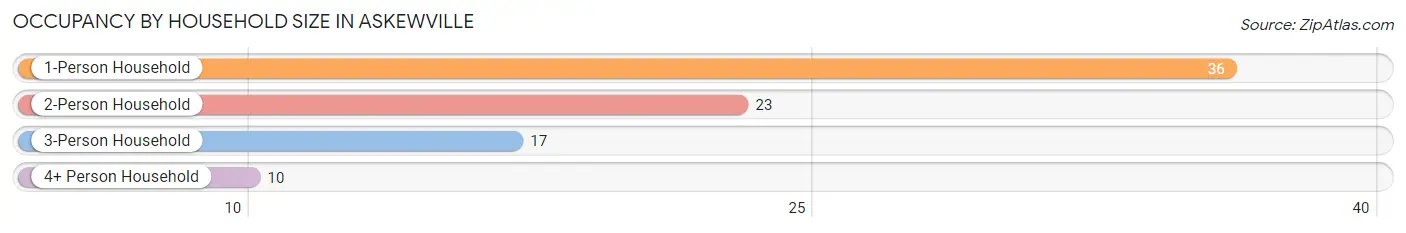
| Household Size | # Housing Units | % Housing Units |
| 1-Person Household | 36 | 41.9% |
| 2-Person Household | 23 | 26.7% |
| 3-Person Household | 17 | 19.8% |
| 4+ Person Household | 10 | 11.6% |
| Total Housing Units | 86 | 100.0% |
Occupancy by Ownership by Household Size in Askewville
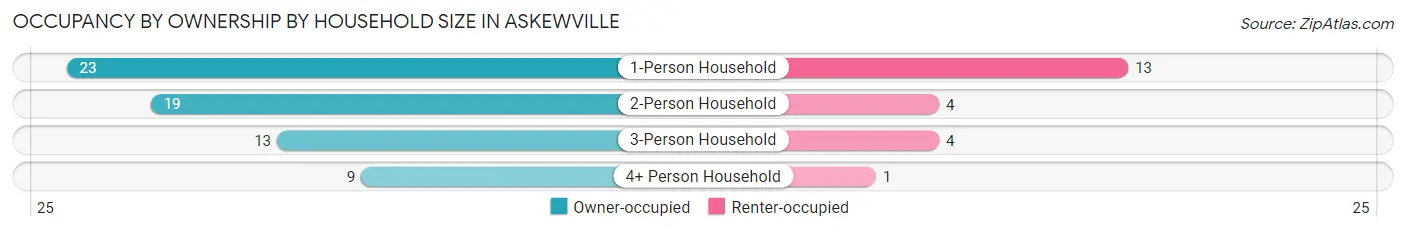
| Household Size | Owner-occupied | Renter-occupied |
| 1-Person Household | 23 (63.9%) | 13 (36.1%) |
| 2-Person Household | 19 (82.6%) | 4 (17.4%) |
| 3-Person Household | 13 (76.5%) | 4 (23.5%) |
| 4+ Person Household | 9 (90.0%) | 1 (10.0%) |
| Total Housing Units | 64 (74.4%) | 22 (25.6%) |
Occupancy by Educational Attainment in Askewville
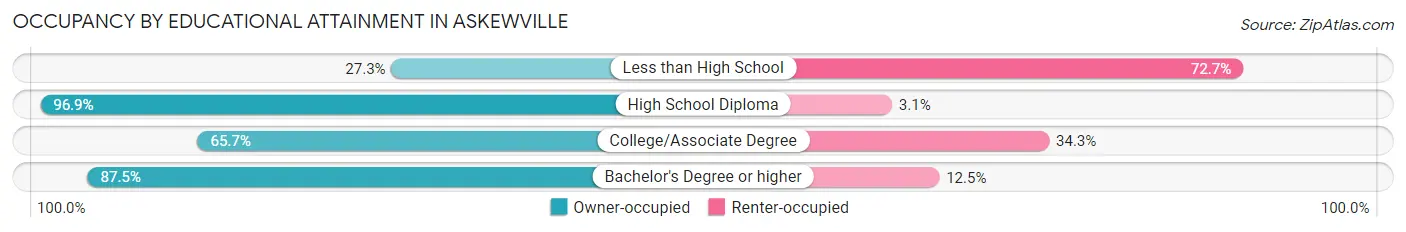
| Household Size | Owner-occupied | Renter-occupied |
| Less than High School | 3 (27.3%) | 8 (72.7%) |
| High School Diploma | 31 (96.9%) | 1 (3.1%) |
| College/Associate Degree | 23 (65.7%) | 12 (34.3%) |
| Bachelor's Degree or higher | 7 (87.5%) | 1 (12.5%) |
Occupancy by Age of Householder in Askewville
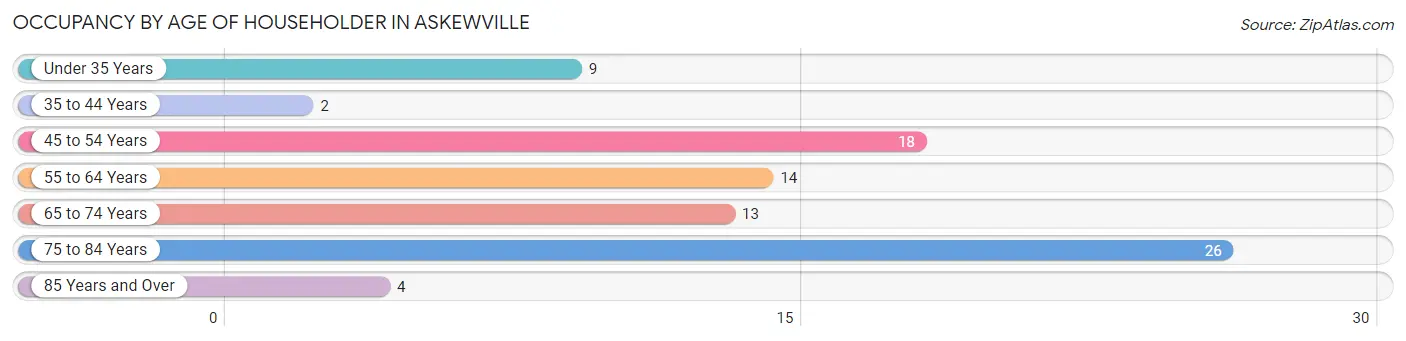
| Age Bracket | # Households | % Households |
| Under 35 Years | 9 | 10.5% |
| 35 to 44 Years | 2 | 2.3% |
| 45 to 54 Years | 18 | 20.9% |
| 55 to 64 Years | 14 | 16.3% |
| 65 to 74 Years | 13 | 15.1% |
| 75 to 84 Years | 26 | 30.2% |
| 85 Years and Over | 4 | 4.6% |
| Total | 86 | 100.0% |
Housing Finances in Askewville
Median Income by Occupancy in Askewville
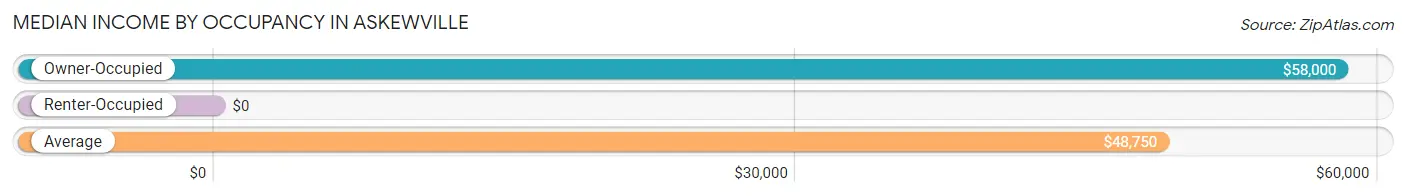
| Occupancy Type | # Households | Median Income |
| Owner-Occupied | 64 (74.4%) | $58,000 |
| Renter-Occupied | 22 (25.6%) | $0 |
| Average | 86 (100.0%) | $48,750 |
Occupancy by Householder Income Bracket in Askewville
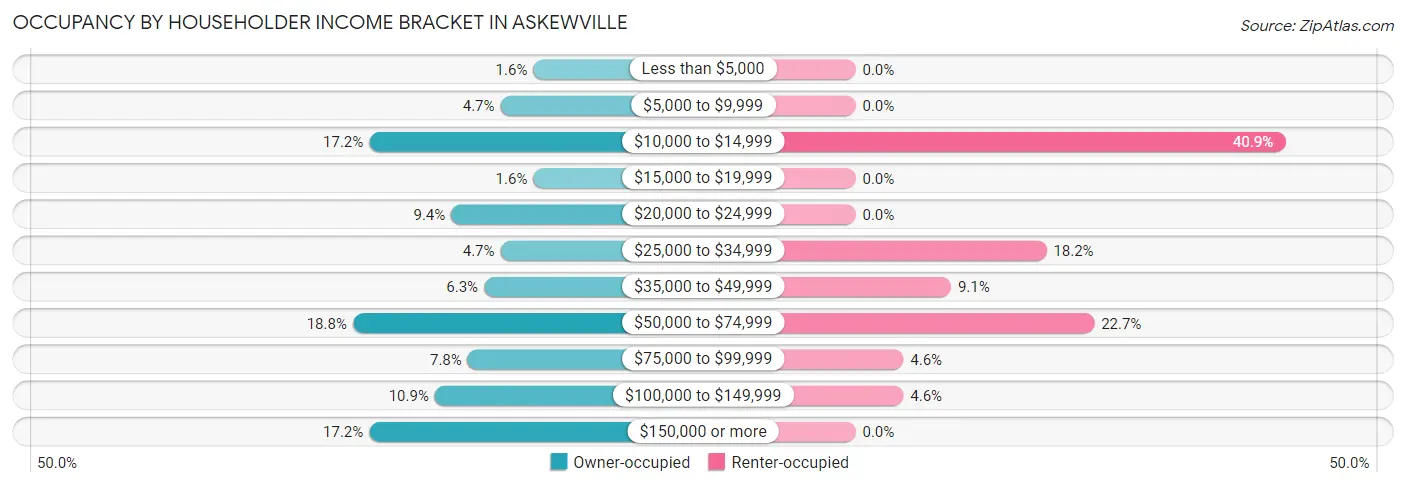
| Income Bracket | Owner-occupied | Renter-occupied |
| Less than $5,000 | 1 (1.6%) | 0 (0.0%) |
| $5,000 to $9,999 | 3 (4.7%) | 0 (0.0%) |
| $10,000 to $14,999 | 11 (17.2%) | 9 (40.9%) |
| $15,000 to $19,999 | 1 (1.6%) | 0 (0.0%) |
| $20,000 to $24,999 | 6 (9.4%) | 0 (0.0%) |
| $25,000 to $34,999 | 3 (4.7%) | 4 (18.2%) |
| $35,000 to $49,999 | 4 (6.2%) | 2 (9.1%) |
| $50,000 to $74,999 | 12 (18.8%) | 5 (22.7%) |
| $75,000 to $99,999 | 5 (7.8%) | 1 (4.5%) |
| $100,000 to $149,999 | 7 (10.9%) | 1 (4.5%) |
| $150,000 or more | 11 (17.2%) | 0 (0.0%) |
| Total | 64 (100.0%) | 22 (100.0%) |
Monthly Housing Cost Tiers in Askewville
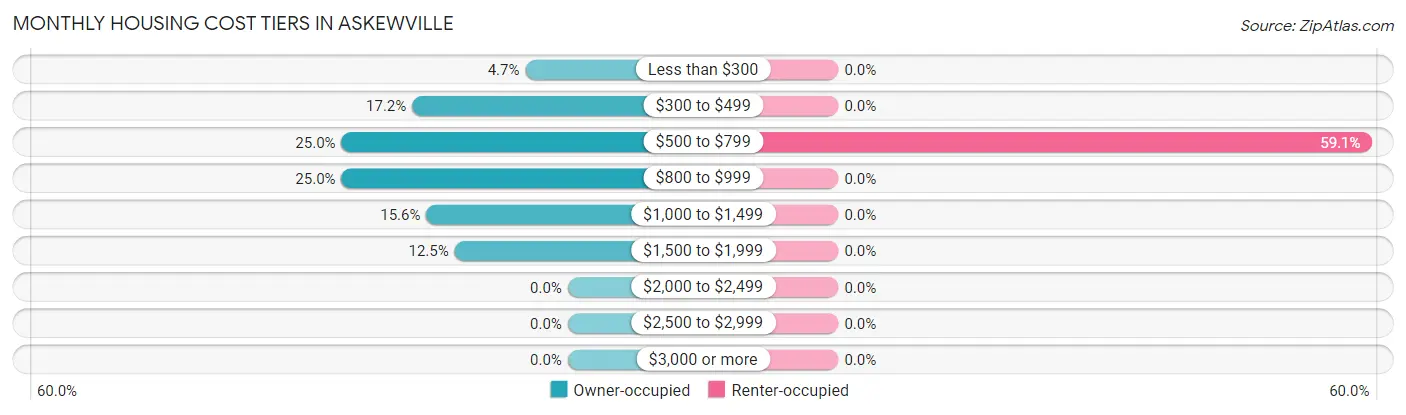
| Monthly Cost | Owner-occupied | Renter-occupied |
| Less than $300 | 3 (4.7%) | 0 (0.0%) |
| $300 to $499 | 11 (17.2%) | 0 (0.0%) |
| $500 to $799 | 16 (25.0%) | 13 (59.1%) |
| $800 to $999 | 16 (25.0%) | 0 (0.0%) |
| $1,000 to $1,499 | 10 (15.6%) | 0 (0.0%) |
| $1,500 to $1,999 | 8 (12.5%) | 0 (0.0%) |
| $2,000 to $2,499 | 0 (0.0%) | 0 (0.0%) |
| $2,500 to $2,999 | 0 (0.0%) | 0 (0.0%) |
| $3,000 or more | 0 (0.0%) | 0 (0.0%) |
| Total | 64 (100.0%) | 22 (100.0%) |
Physical Housing Characteristics in Askewville
Housing Structures in Askewville
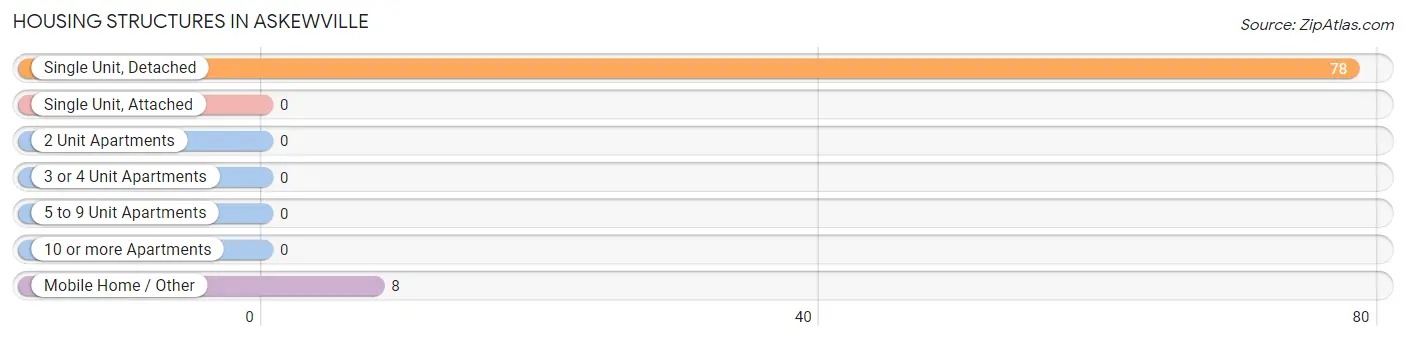
| Structure Type | # Housing Units | % Housing Units |
| Single Unit, Detached | 78 | 90.7% |
| Single Unit, Attached | 0 | 0.0% |
| 2 Unit Apartments | 0 | 0.0% |
| 3 or 4 Unit Apartments | 0 | 0.0% |
| 5 to 9 Unit Apartments | 0 | 0.0% |
| 10 or more Apartments | 0 | 0.0% |
| Mobile Home / Other | 8 | 9.3% |
| Total | 86 | 100.0% |
Housing Structures by Occupancy in Askewville
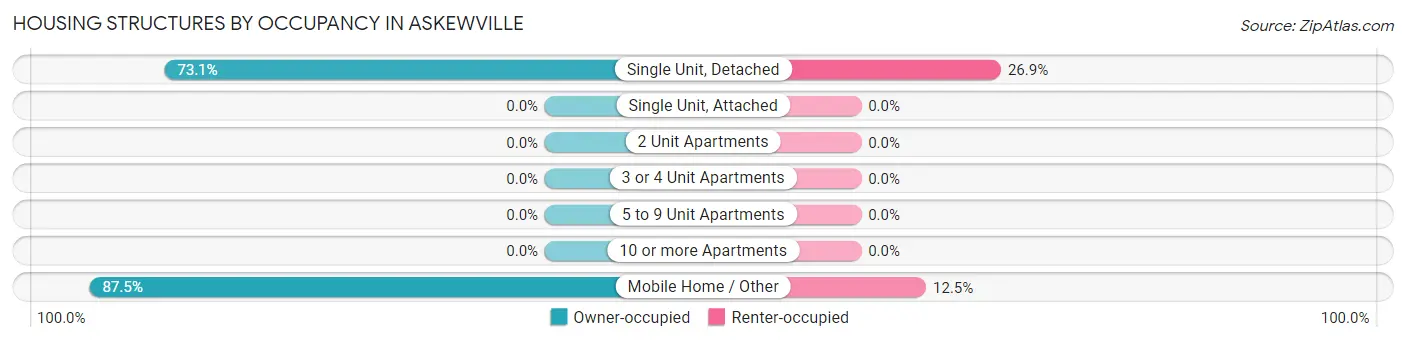
| Structure Type | Owner-occupied | Renter-occupied |
| Single Unit, Detached | 57 (73.1%) | 21 (26.9%) |
| Single Unit, Attached | 0 (0.0%) | 0 (0.0%) |
| 2 Unit Apartments | 0 (0.0%) | 0 (0.0%) |
| 3 or 4 Unit Apartments | 0 (0.0%) | 0 (0.0%) |
| 5 to 9 Unit Apartments | 0 (0.0%) | 0 (0.0%) |
| 10 or more Apartments | 0 (0.0%) | 0 (0.0%) |
| Mobile Home / Other | 7 (87.5%) | 1 (12.5%) |
| Total | 64 (74.4%) | 22 (25.6%) |
Housing Structures by Number of Rooms in Askewville
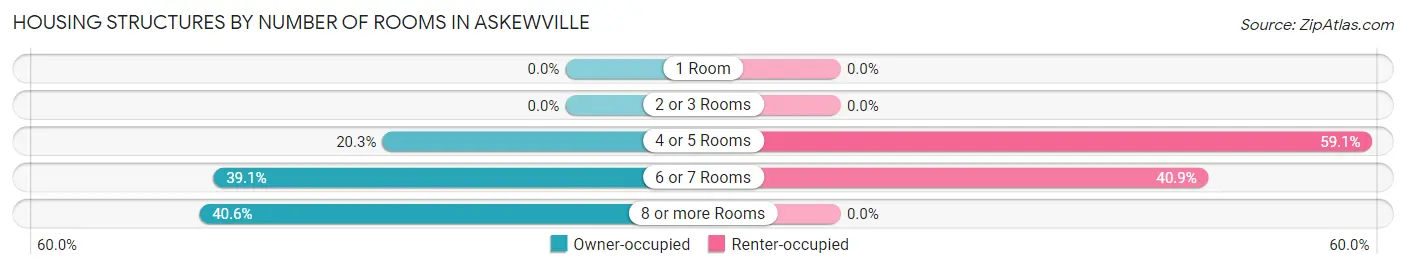
| Number of Rooms | Owner-occupied | Renter-occupied |
| 1 Room | 0 (0.0%) | 0 (0.0%) |
| 2 or 3 Rooms | 0 (0.0%) | 0 (0.0%) |
| 4 or 5 Rooms | 13 (20.3%) | 13 (59.1%) |
| 6 or 7 Rooms | 25 (39.1%) | 9 (40.9%) |
| 8 or more Rooms | 26 (40.6%) | 0 (0.0%) |
| Total | 64 (100.0%) | 22 (100.0%) |
Housing Structure by Heating Type in Askewville
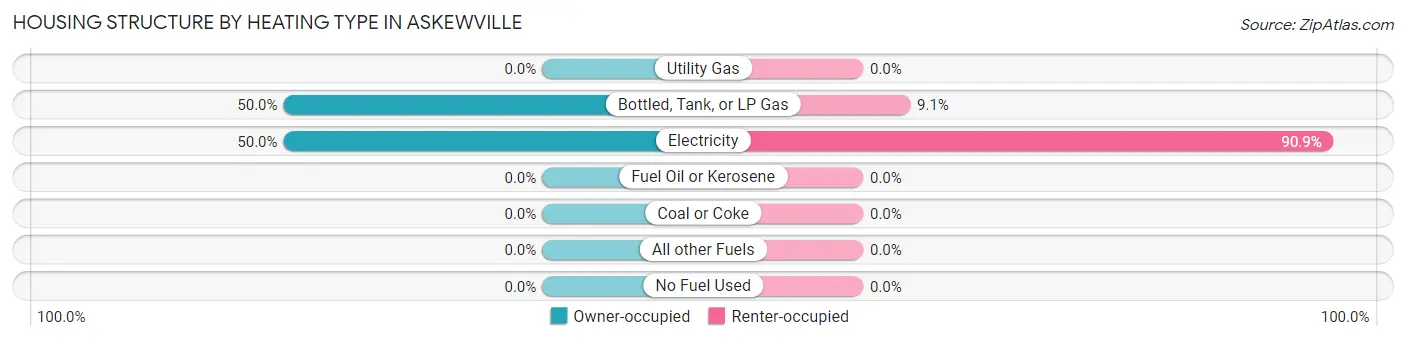
| Heating Type | Owner-occupied | Renter-occupied |
| Utility Gas | 0 (0.0%) | 0 (0.0%) |
| Bottled, Tank, or LP Gas | 32 (50.0%) | 2 (9.1%) |
| Electricity | 32 (50.0%) | 20 (90.9%) |
| Fuel Oil or Kerosene | 0 (0.0%) | 0 (0.0%) |
| Coal or Coke | 0 (0.0%) | 0 (0.0%) |
| All other Fuels | 0 (0.0%) | 0 (0.0%) |
| No Fuel Used | 0 (0.0%) | 0 (0.0%) |
| Total | 64 (100.0%) | 22 (100.0%) |
Household Vehicle Usage in Askewville
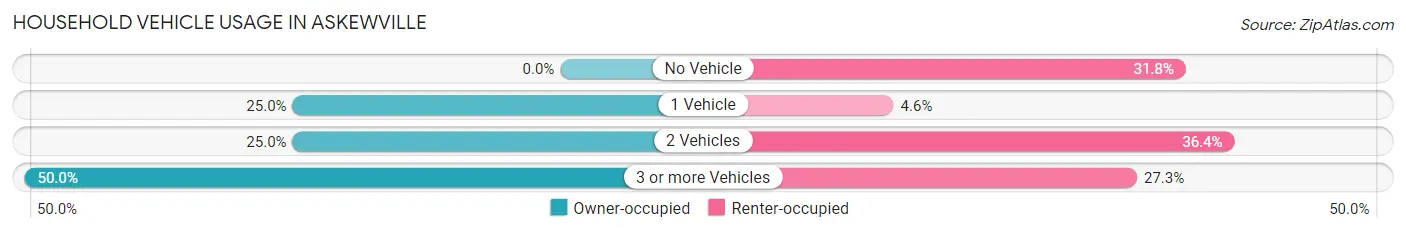
| Vehicles per Household | Owner-occupied | Renter-occupied |
| No Vehicle | 0 (0.0%) | 7 (31.8%) |
| 1 Vehicle | 16 (25.0%) | 1 (4.5%) |
| 2 Vehicles | 16 (25.0%) | 8 (36.4%) |
| 3 or more Vehicles | 32 (50.0%) | 6 (27.3%) |
| Total | 64 (100.0%) | 22 (100.0%) |
Real Estate & Mortgages in Askewville
Real Estate and Mortgage Overview in Askewville
| Characteristic | Without Mortgage | With Mortgage |
| Housing Units | 44 | 20 |
| Median Property Value | $98,600 | $271,400 |
| Median Household Income | - | - |
| Monthly Housing Costs | $573 | $0 |
| Real Estate Taxes | - | - |
Property Value by Mortgage Status in Askewville
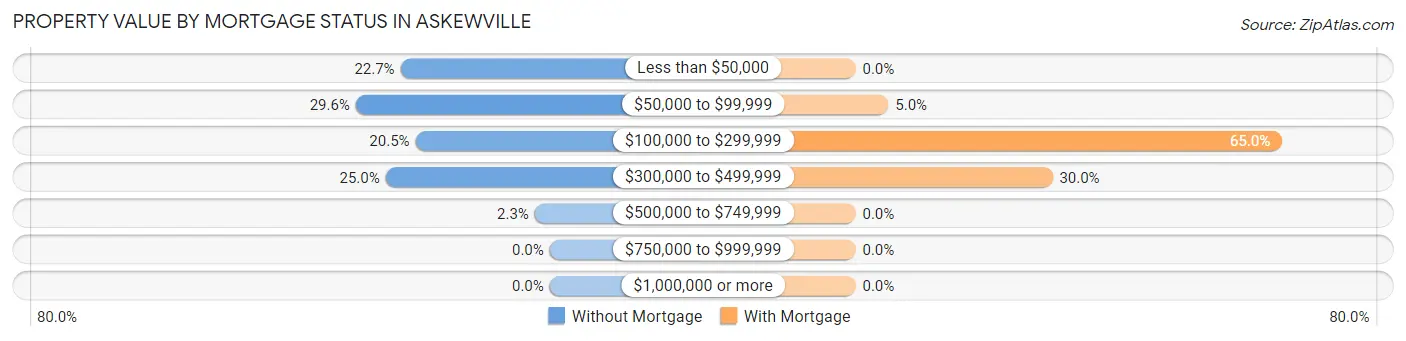
| Property Value | Without Mortgage | With Mortgage |
| Less than $50,000 | 10 (22.7%) | 0 (0.0%) |
| $50,000 to $99,999 | 13 (29.5%) | 1 (5.0%) |
| $100,000 to $299,999 | 9 (20.4%) | 13 (65.0%) |
| $300,000 to $499,999 | 11 (25.0%) | 6 (30.0%) |
| $500,000 to $749,999 | 1 (2.3%) | 0 (0.0%) |
| $750,000 to $999,999 | 0 (0.0%) | 0 (0.0%) |
| $1,000,000 or more | 0 (0.0%) | 0 (0.0%) |
| Total | 44 (100.0%) | 20 (100.0%) |
Household Income by Mortgage Status in Askewville
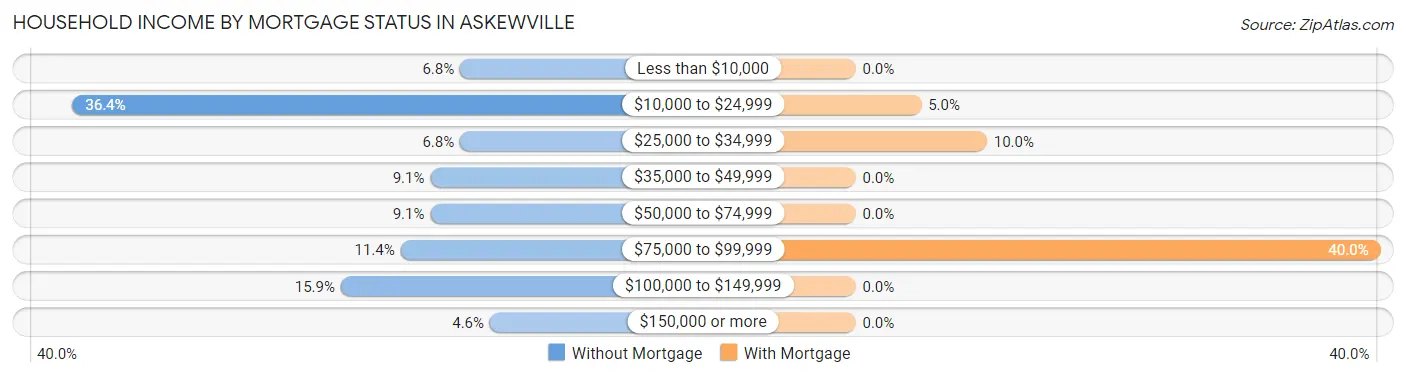
| Household Income | Without Mortgage | With Mortgage |
| Less than $10,000 | 3 (6.8%) | 0 (0.0%) |
| $10,000 to $24,999 | 16 (36.4%) | 1 (5.0%) |
| $25,000 to $34,999 | 3 (6.8%) | 2 (10.0%) |
| $35,000 to $49,999 | 4 (9.1%) | 0 (0.0%) |
| $50,000 to $74,999 | 4 (9.1%) | 0 (0.0%) |
| $75,000 to $99,999 | 5 (11.4%) | 8 (40.0%) |
| $100,000 to $149,999 | 7 (15.9%) | 0 (0.0%) |
| $150,000 or more | 2 (4.5%) | 0 (0.0%) |
| Total | 44 (100.0%) | 20 (100.0%) |
Property Value to Household Income Ratio in Askewville
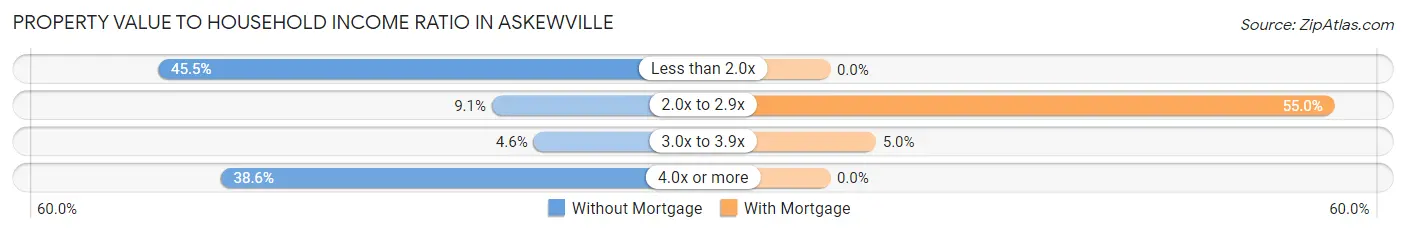
| Value-to-Income Ratio | Without Mortgage | With Mortgage |
| Less than 2.0x | 20 (45.5%) | 0 (0.0%) |
| 2.0x to 2.9x | 4 (9.1%) | 11 (55.0%) |
| 3.0x to 3.9x | 2 (4.5%) | 1 (5.0%) |
| 4.0x or more | 17 (38.6%) | 0 (0.0%) |
| Total | 44 (100.0%) | 20 (100.0%) |
Real Estate Taxes by Mortgage Status in Askewville
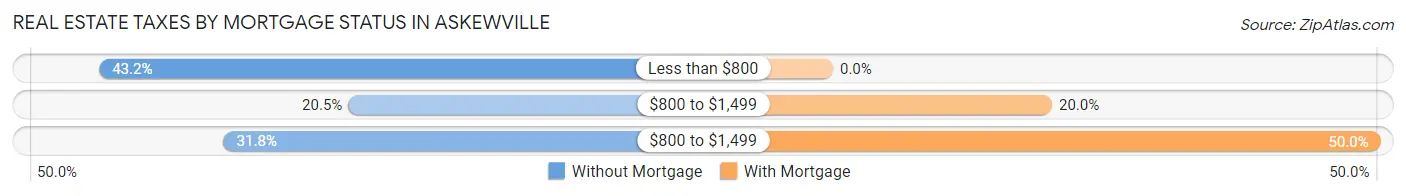
| Property Taxes | Without Mortgage | With Mortgage |
| Less than $800 | 19 (43.2%) | 0 (0.0%) |
| $800 to $1,499 | 9 (20.4%) | 4 (20.0%) |
| $800 to $1,499 | 14 (31.8%) | 10 (50.0%) |
| Total | 44 (100.0%) | 20 (100.0%) |
Health & Disability in Askewville
Health Insurance Coverage by Age in Askewville
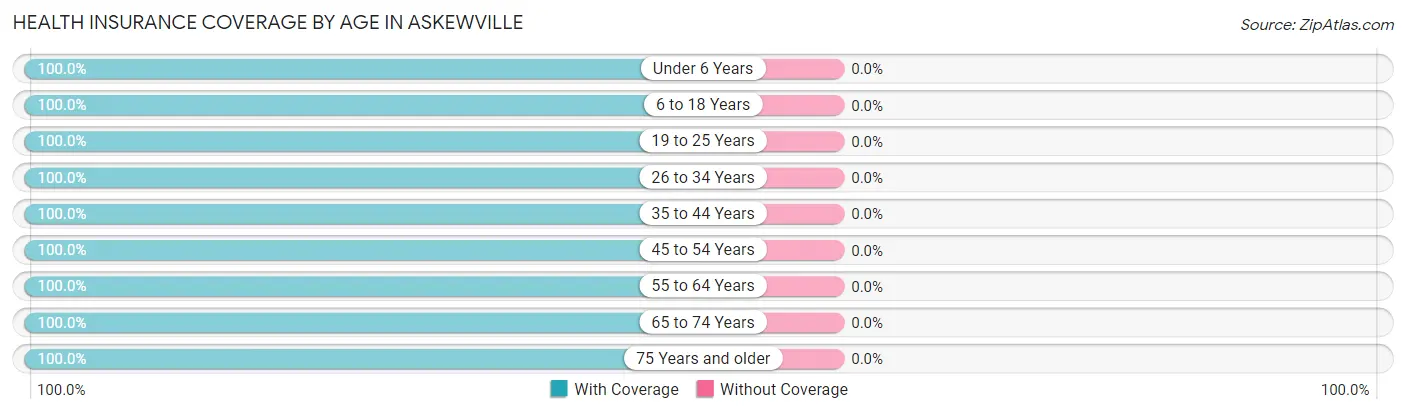
| Age Bracket | With Coverage | Without Coverage |
| Under 6 Years | 11 (100.0%) | 0 (0.0%) |
| 6 to 18 Years | 16 (100.0%) | 0 (0.0%) |
| 19 to 25 Years | 21 (100.0%) | 0 (0.0%) |
| 26 to 34 Years | 18 (100.0%) | 0 (0.0%) |
| 35 to 44 Years | 9 (100.0%) | 0 (0.0%) |
| 45 to 54 Years | 33 (100.0%) | 0 (0.0%) |
| 55 to 64 Years | 21 (100.0%) | 0 (0.0%) |
| 65 to 74 Years | 20 (100.0%) | 0 (0.0%) |
| 75 Years and older | 35 (100.0%) | 0 (0.0%) |
| Total | 184 (100.0%) | 0 (0.0%) |
Health Insurance Coverage by Citizenship Status in Askewville
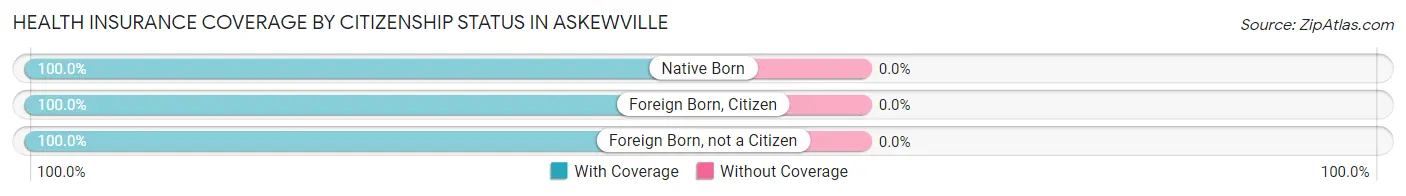
| Citizenship Status | With Coverage | Without Coverage |
| Native Born | 11 (100.0%) | 0 (0.0%) |
| Foreign Born, Citizen | 16 (100.0%) | 0 (0.0%) |
| Foreign Born, not a Citizen | 21 (100.0%) | 0 (0.0%) |
Health Insurance Coverage by Household Income in Askewville
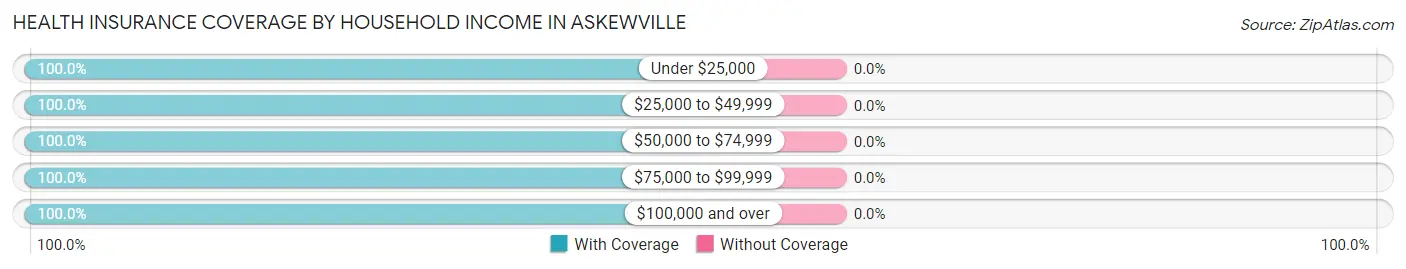
| Household Income | With Coverage | Without Coverage |
| Under $25,000 | 40 (100.0%) | 0 (0.0%) |
| $25,000 to $49,999 | 15 (100.0%) | 0 (0.0%) |
| $50,000 to $74,999 | 47 (100.0%) | 0 (0.0%) |
| $75,000 to $99,999 | 22 (100.0%) | 0 (0.0%) |
| $100,000 and over | 60 (100.0%) | 0 (0.0%) |
Public vs Private Health Insurance Coverage by Age in Askewville
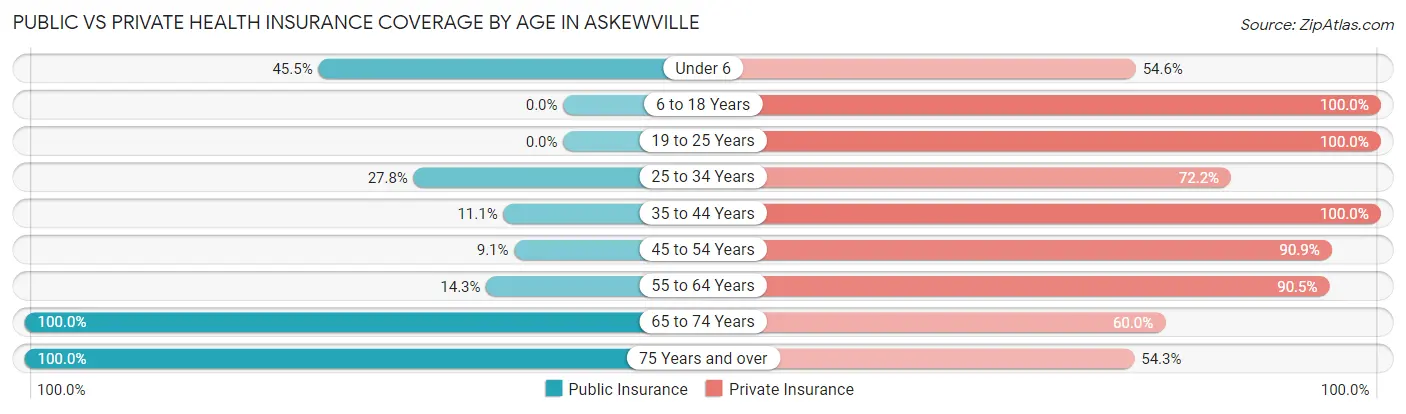
| Age Bracket | Public Insurance | Private Insurance |
| Under 6 | 5 (45.5%) | 6 (54.5%) |
| 6 to 18 Years | 0 (0.0%) | 16 (100.0%) |
| 19 to 25 Years | 0 (0.0%) | 21 (100.0%) |
| 25 to 34 Years | 5 (27.8%) | 13 (72.2%) |
| 35 to 44 Years | 1 (11.1%) | 9 (100.0%) |
| 45 to 54 Years | 3 (9.1%) | 30 (90.9%) |
| 55 to 64 Years | 3 (14.3%) | 19 (90.5%) |
| 65 to 74 Years | 20 (100.0%) | 12 (60.0%) |
| 75 Years and over | 35 (100.0%) | 19 (54.3%) |
| Total | 72 (39.1%) | 145 (78.8%) |
Disability Status by Sex by Age in Askewville
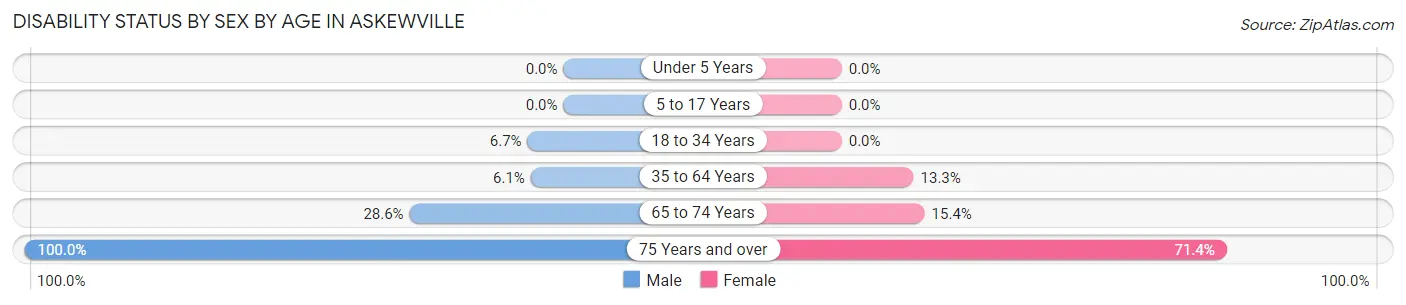
| Age Bracket | Male | Female |
| Under 5 Years | 0 (0.0%) | 0 (0.0%) |
| 5 to 17 Years | 0 (0.0%) | 0 (0.0%) |
| 18 to 34 Years | 2 (6.7%) | 0 (0.0%) |
| 35 to 64 Years | 2 (6.1%) | 4 (13.3%) |
| 65 to 74 Years | 2 (28.6%) | 2 (15.4%) |
| 75 Years and over | 7 (100.0%) | 20 (71.4%) |
Disability Class by Sex by Age in Askewville
Disability Class: Hearing Difficulty
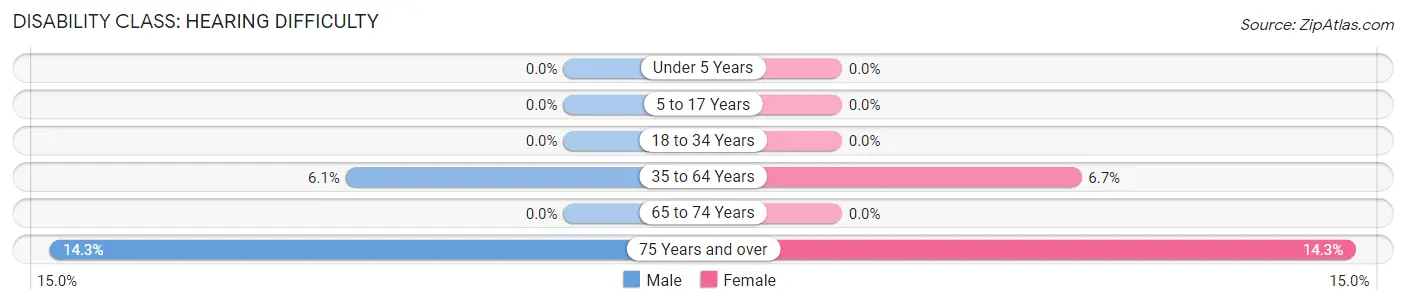
| Age Bracket | Male | Female |
| Under 5 Years | 0 (0.0%) | 0 (0.0%) |
| 5 to 17 Years | 0 (0.0%) | 0 (0.0%) |
| 18 to 34 Years | 0 (0.0%) | 0 (0.0%) |
| 35 to 64 Years | 2 (6.1%) | 2 (6.7%) |
| 65 to 74 Years | 0 (0.0%) | 0 (0.0%) |
| 75 Years and over | 1 (14.3%) | 4 (14.3%) |
Disability Class: Vision Difficulty
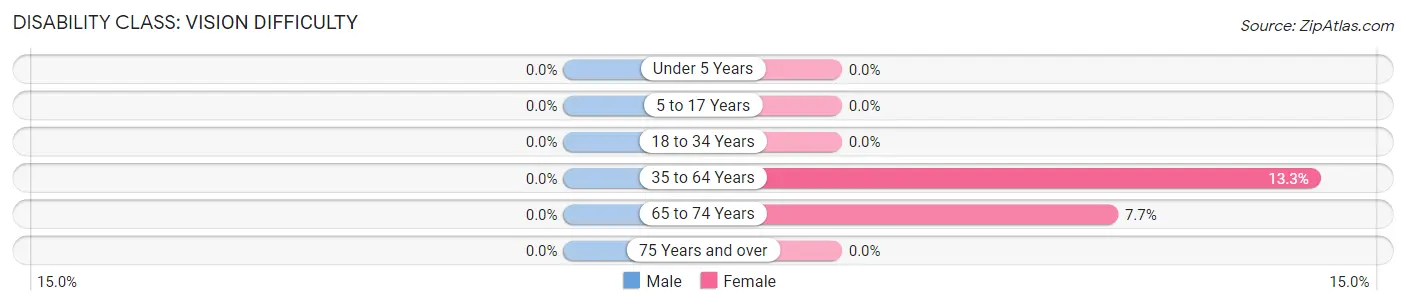
| Age Bracket | Male | Female |
| Under 5 Years | 0 (0.0%) | 0 (0.0%) |
| 5 to 17 Years | 0 (0.0%) | 0 (0.0%) |
| 18 to 34 Years | 0 (0.0%) | 0 (0.0%) |
| 35 to 64 Years | 0 (0.0%) | 4 (13.3%) |
| 65 to 74 Years | 0 (0.0%) | 1 (7.7%) |
| 75 Years and over | 0 (0.0%) | 0 (0.0%) |
Disability Class: Cognitive Difficulty
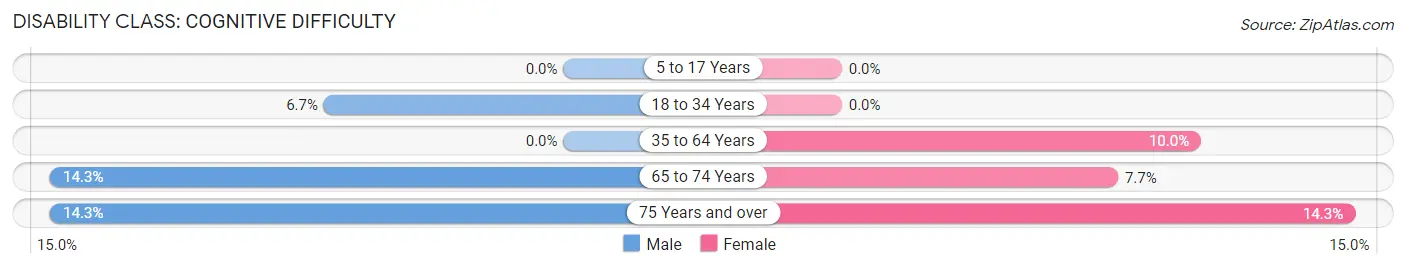
| Age Bracket | Male | Female |
| 5 to 17 Years | 0 (0.0%) | 0 (0.0%) |
| 18 to 34 Years | 2 (6.7%) | 0 (0.0%) |
| 35 to 64 Years | 0 (0.0%) | 3 (10.0%) |
| 65 to 74 Years | 1 (14.3%) | 1 (7.7%) |
| 75 Years and over | 1 (14.3%) | 4 (14.3%) |
Disability Class: Ambulatory Difficulty
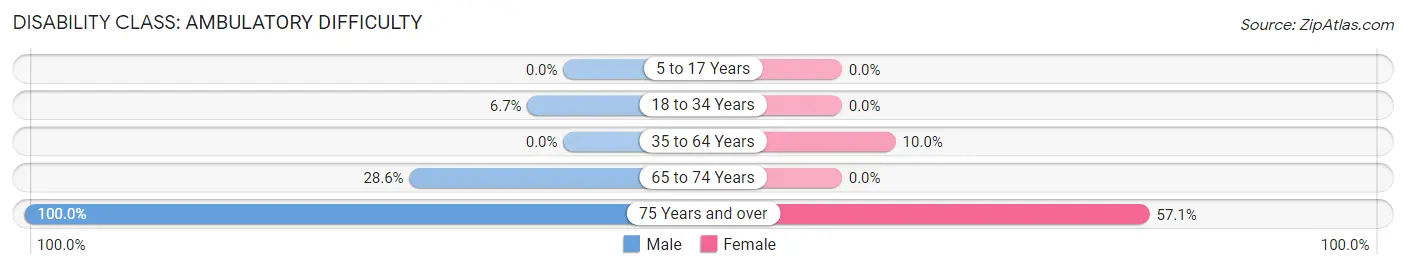
| Age Bracket | Male | Female |
| 5 to 17 Years | 0 (0.0%) | 0 (0.0%) |
| 18 to 34 Years | 2 (6.7%) | 0 (0.0%) |
| 35 to 64 Years | 0 (0.0%) | 3 (10.0%) |
| 65 to 74 Years | 2 (28.6%) | 0 (0.0%) |
| 75 Years and over | 7 (100.0%) | 16 (57.1%) |
Disability Class: Self-Care Difficulty
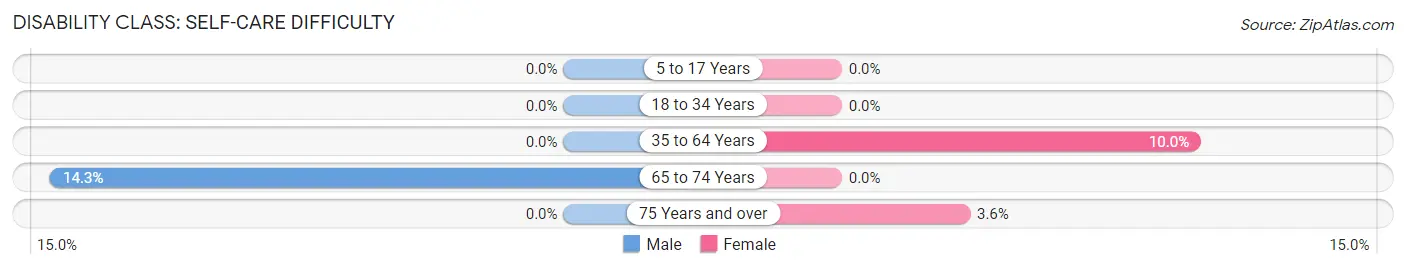
| Age Bracket | Male | Female |
| 5 to 17 Years | 0 (0.0%) | 0 (0.0%) |
| 18 to 34 Years | 0 (0.0%) | 0 (0.0%) |
| 35 to 64 Years | 0 (0.0%) | 3 (10.0%) |
| 65 to 74 Years | 1 (14.3%) | 0 (0.0%) |
| 75 Years and over | 0 (0.0%) | 1 (3.6%) |
Technology Access in Askewville
Computing Device Access in Askewville
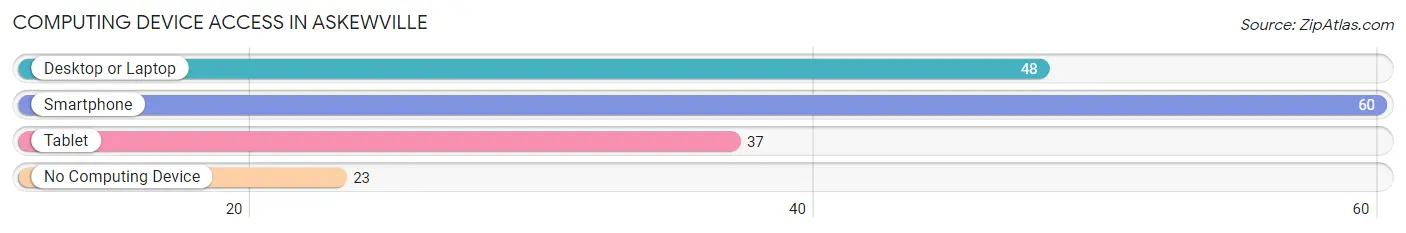
| Device Type | # Households | % Households |
| Desktop or Laptop | 48 | 55.8% |
| Smartphone | 60 | 69.8% |
| Tablet | 37 | 43.0% |
| No Computing Device | 23 | 26.7% |
| Total | 86 | 100.0% |
Internet Access in Askewville
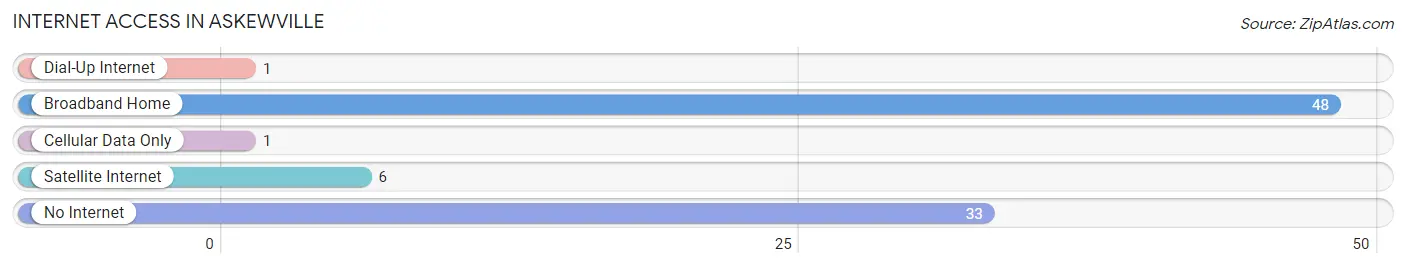
| Internet Type | # Households | % Households |
| Dial-Up Internet | 1 | 1.2% |
| Broadband Home | 48 | 55.8% |
| Cellular Data Only | 1 | 1.2% |
| Satellite Internet | 6 | 7.0% |
| No Internet | 33 | 38.4% |
| Total | 86 | 100.0% |
Askewville Summary
Askewville is a small unincorporated community located in Bertie County, North Carolina. It is situated on the banks of the Cashie River, approximately 10 miles south of Windsor and 25 miles north of Greenville. The population of Askewville was estimated to be around 500 in 2020.
History
Askewville was founded in 1820 by William Askew, a planter from Virginia. He purchased the land from the local Native Americans and established a plantation. The town was named after him and grew to become a thriving community. Askewville was a major stop on the Wilmington and Weldon Railroad, which connected the town to the rest of the state. The railroad brought in new businesses and industries, and the town flourished.
In the late 19th century, Askewville was a major center of the tobacco industry. The town was home to several tobacco warehouses and factories, and the local economy was heavily dependent on the industry. However, the Great Depression of the 1930s caused a decline in the tobacco industry, and Askewville suffered greatly. The town was further impacted by the Civil Rights Movement of the 1960s, which caused many of the town’s African American residents to leave in search of better opportunities.
Geography
Askewville is located in the northeastern corner of Bertie County, North Carolina. It is situated on the banks of the Cashie River, approximately 10 miles south of Windsor and 25 miles north of Greenville. The town is surrounded by farmland and is located in a rural area. The climate in Askewville is humid subtropical, with hot summers and mild winters.
Economy
Askewville’s economy is largely based on agriculture. The town is home to several farms, which produce a variety of crops, including corn, soybeans, cotton, and tobacco. The town is also home to several small businesses, including a grocery store, a hardware store, and a few restaurants.
Demographics
As of the 2020 census, the population of Askewville was estimated to be around 500. The town is predominantly white, with African Americans making up the majority of the remaining population. The median household income in Askewville is $35,000, and the median home value is $90,000. The town has a high rate of poverty, with nearly 30% of the population living below the poverty line.
Askewville is a small, rural community with a rich history and a strong sense of community. The town is home to a diverse population and is a great place to live and work. Despite its small size, Askewville has a lot to offer, from its agricultural roots to its vibrant local businesses.
Common Questions
What is the Total Population of Askewville?
Total Population of Askewville is 184.
What is the Total Male Population of Askewville?
Total Male Population of Askewville is 89.
What is the Total Female Population of Askewville?
Total Female Population of Askewville is 95.
What is the Ratio of Males per 100 Females in Askewville?
There are 93.68 Males per 100 Females in Askewville.
What is the Ratio of Females per 100 Males in Askewville?
There are 106.74 Females per 100 Males in Askewville.
What is the Median Population Age in Askewville?
Median Population Age in Askewville is 50.8 Years.
What is the Average Family Size in Askewville
Average Family Size in Askewville is 3.0 People.
What is the Average Household Size in Askewville
Average Household Size in Askewville is 2.1 People.
What is Per Capita Income in Askewville?
Per Capita income in Askewville is $29,014.
What is the Median Family Income in Askewville?
Median Family Income in Askewville is $77,500.
What is the Median Household income in Askewville?
Median Household Income in Askewville is $48,750.
What is Income or Wage Gap in Askewville?
Income or Wage Gap in Askewville is 19.3%.
Women in Askewville earn 80.7 cents for every dollar earned by a man.
What is Inequality or Gini Index in Askewville?
Inequality or Gini Index in Askewville is 0.46.
How Large is the Labor Force in Askewville?
There are 74 People in the Labor Forcein in Askewville.
What is the Percentage of People in the Labor Force in Askewville?
45.1% of People are in the Labor Force in Askewville.