East Newnan, GA
East Newnan Map
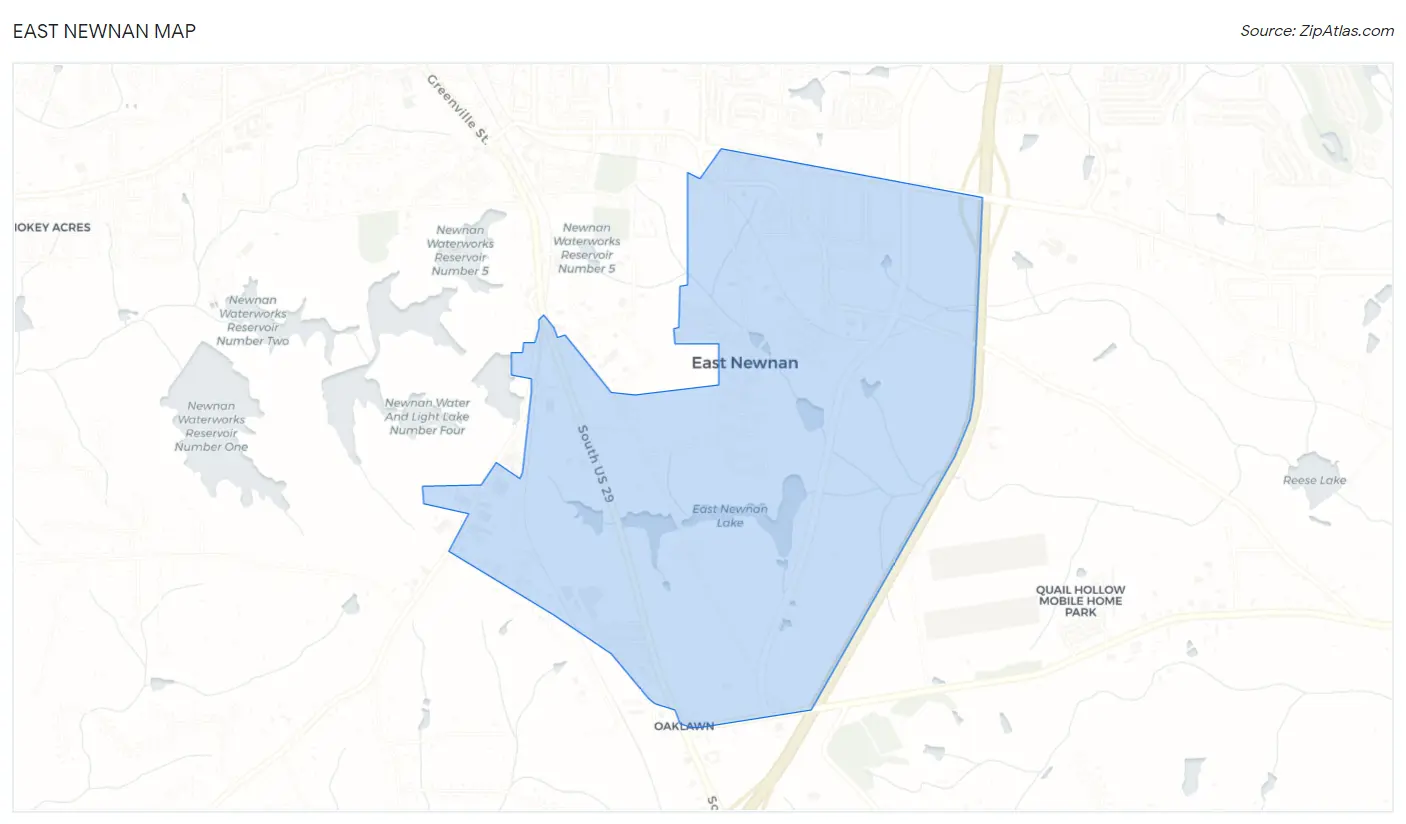
East Newnan Overview
917
TOTAL POPULATION
451
MALE POPULATION
466
FEMALE POPULATION
96.78
MALES / 100 FEMALES
103.33
FEMALES / 100 MALES
45.9
MEDIAN AGE
3.1
AVG FAMILY SIZE
2.7
AVG HOUSEHOLD SIZE
$17,494
PER CAPITA INCOME
$40,833
AVG FAMILY INCOME
$36,192
AVG HOUSEHOLD INCOME
0.42
INEQUALITY / GINI INDEX
364
LABOR FORCE [ PEOPLE ]
43.9%
PERCENT IN LABOR FORCE
11.5%
UNEMPLOYMENT RATE
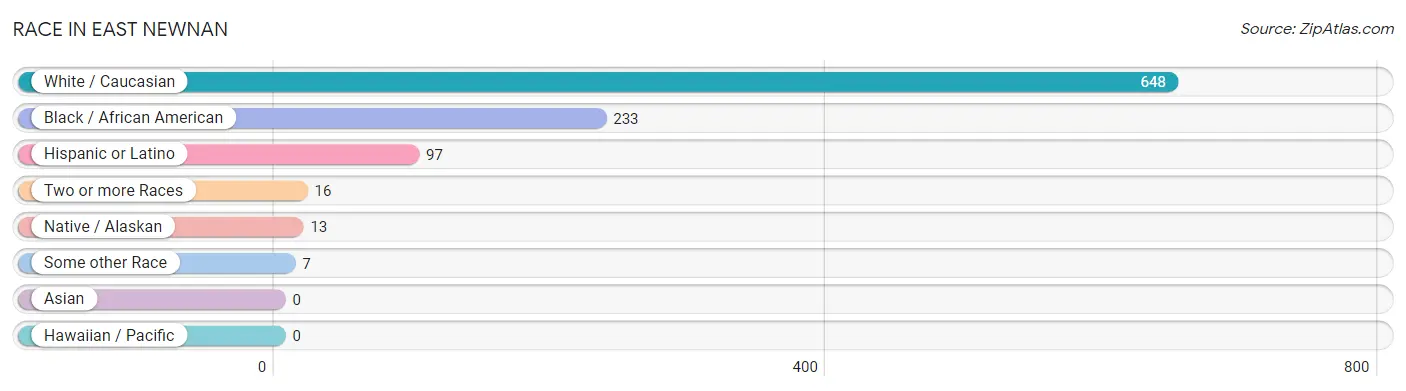
Race in East Newnan
The most populous races in East Newnan are White / Caucasian (648 | 70.7%), Black / African American (233 | 25.4%), and Hispanic or Latino (97 | 10.6%).
| Race | # Population | % Population |
| Asian | 0 | 0.0% |
| Black / African American | 233 | 25.4% |
| Hawaiian / Pacific | 0 | 0.0% |
| Hispanic or Latino | 97 | 10.6% |
| Native / Alaskan | 13 | 1.4% |
| White / Caucasian | 648 | 70.7% |
| Two or more Races | 16 | 1.7% |
| Some other Race | 7 | 0.8% |
| Total | 917 | 100.0% |
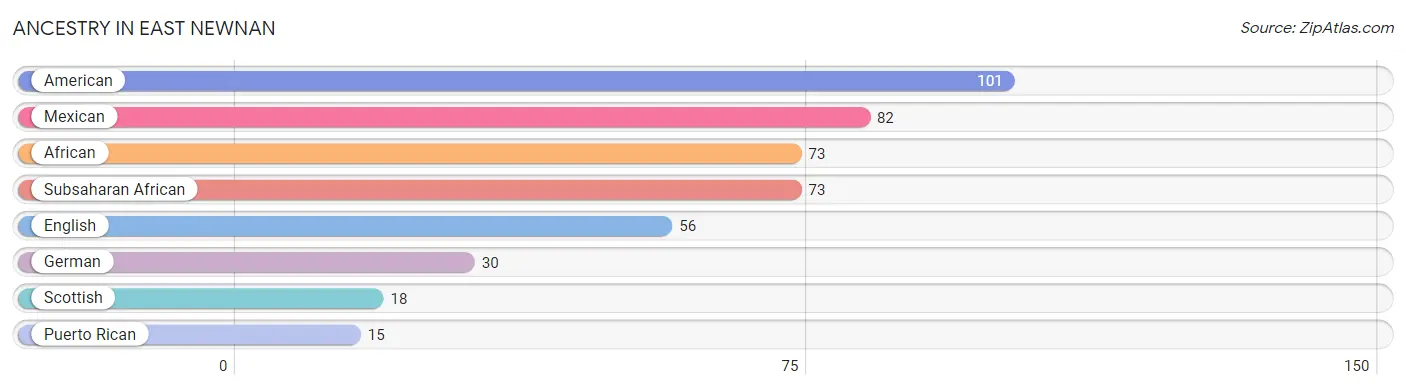
Ancestry in East Newnan
The most populous ancestries reported in East Newnan are American (101 | 11.0%), Mexican (82 | 8.9%), African (73 | 8.0%), Subsaharan African (73 | 8.0%), and English (56 | 6.1%), together accounting for 42.0% of all East Newnan residents.
| Ancestry | # Population | % Population |
| African | 73 | 8.0% |
| American | 101 | 11.0% |
| English | 56 | 6.1% |
| German | 30 | 3.3% |
| Mexican | 82 | 8.9% |
| Puerto Rican | 15 | 1.6% |
| Scottish | 18 | 2.0% |
| Subsaharan African | 73 | 8.0% | View All 8 Rows |
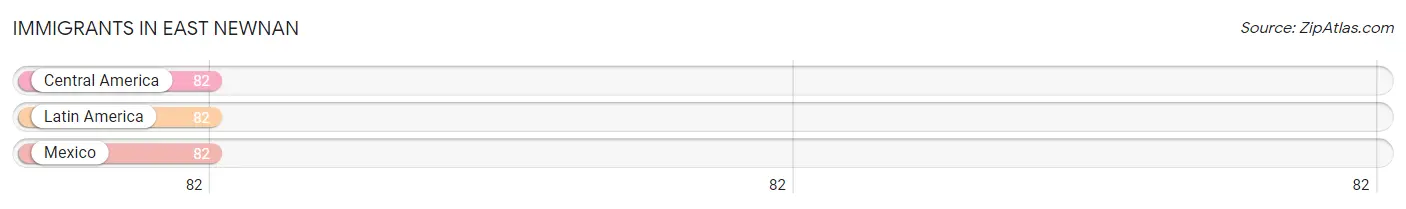
Immigrants in East Newnan
The most numerous immigrant groups reported in East Newnan came from Central America (82 | 8.9%), Latin America (82 | 8.9%), and Mexico (82 | 8.9%), together accounting for 26.8% of all East Newnan residents.
| Immigration Origin | # Population | % Population |
| Central America | 82 | 8.9% |
| Latin America | 82 | 8.9% |
| Mexico | 82 | 8.9% | View All 3 Rows |
Sex and Age in East Newnan
Sex and Age in East Newnan
The most populous age groups in East Newnan are 20 to 24 Years (137 | 30.4%) for men and 45 to 49 Years (123 | 26.4%) for women.

| Age Bracket | Male | Female |
| Under 5 Years | 24 (5.3%) | 7 (1.5%) |
| 5 to 9 Years | 0 (0.0%) | 26 (5.6%) |
| 10 to 14 Years | 0 (0.0%) | 31 (6.7%) |
| 15 to 19 Years | 62 (13.8%) | 38 (8.2%) |
| 20 to 24 Years | 137 (30.4%) | 0 (0.0%) |
| 25 to 29 Years | 27 (6.0%) | 0 (0.0%) |
| 30 to 34 Years | 29 (6.4%) | 22 (4.7%) |
| 35 to 39 Years | 0 (0.0%) | 0 (0.0%) |
| 40 to 44 Years | 17 (3.8%) | 7 (1.5%) |
| 45 to 49 Years | 49 (10.9%) | 123 (26.4%) |
| 50 to 54 Years | 0 (0.0%) | 0 (0.0%) |
| 55 to 59 Years | 0 (0.0%) | 0 (0.0%) |
| 60 to 64 Years | 36 (8.0%) | 108 (23.2%) |
| 65 to 69 Years | 70 (15.5%) | 17 (3.6%) |
| 70 to 74 Years | 0 (0.0%) | 51 (10.9%) |
| 75 to 79 Years | 0 (0.0%) | 0 (0.0%) |
| 80 to 84 Years | 0 (0.0%) | 0 (0.0%) |
| 85 Years and over | 0 (0.0%) | 36 (7.7%) |
| Total | 451 (100.0%) | 466 (100.0%) |
Families and Households in East Newnan
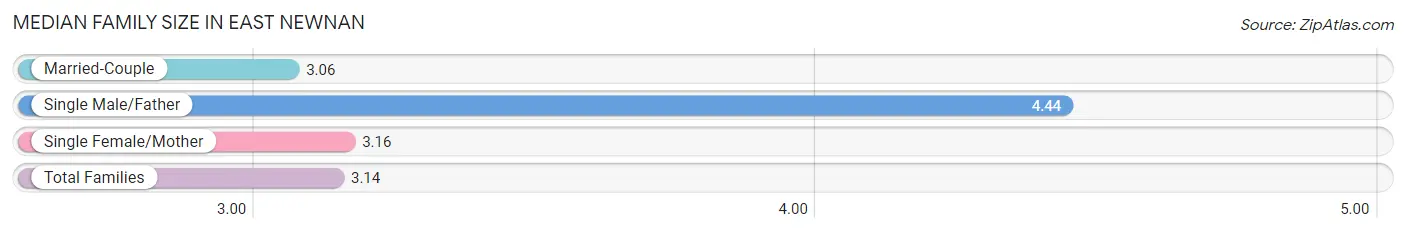
Median Family Size in East Newnan
The median family size in East Newnan is 3.14 persons per family, with single male/father families (9 | 3.4%) accounting for the largest median family size of 4.44 persons per family. On the other hand, married-couple families (159 | 59.3%) represent the smallest median family size with 3.06 persons per family.
| Family Type | # Families | Family Size |
| Married-Couple | 159 (59.3%) | 3.06 |
| Single Male/Father | 9 (3.4%) | 4.44 |
| Single Female/Mother | 100 (37.3%) | 3.16 |
| Total Families | 268 (100.0%) | 3.14 |
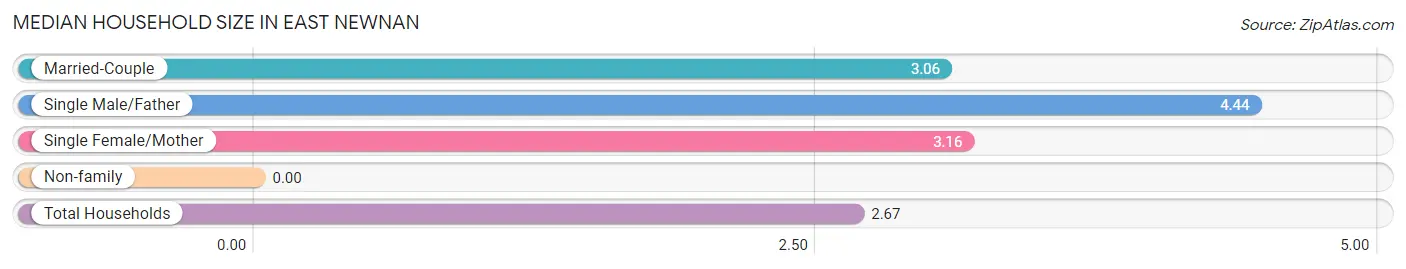
Median Household Size in East Newnan
| Household Type | # Households | Household Size |
| Married-Couple | 159 (46.4%) | 3.06 |
| Single Male/Father | 9 (2.6%) | 4.44 |
| Single Female/Mother | 100 (29.1%) | 3.16 |
| Non-family | 75 (21.9%) | - |
| Total Households | 343 (100.0%) | 2.67 |
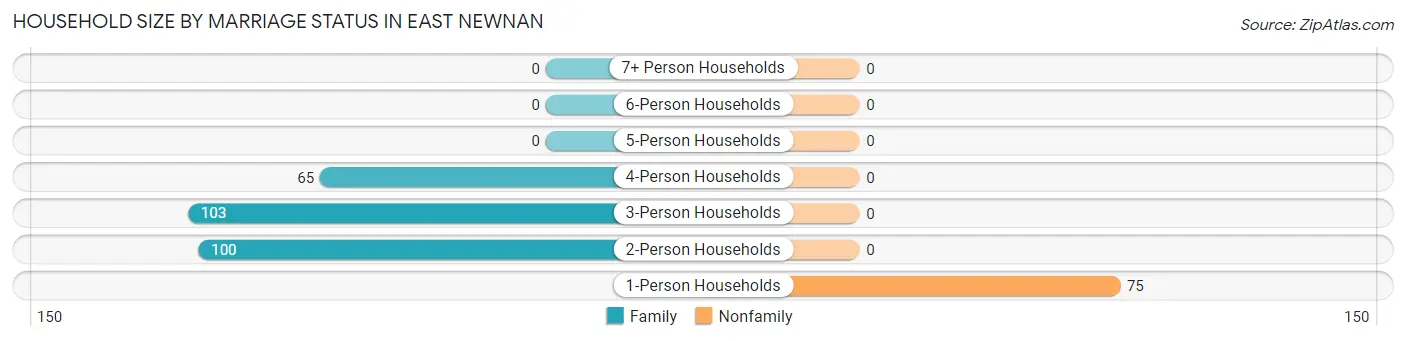
Household Size by Marriage Status in East Newnan
Out of a total of 343 households in East Newnan, 268 (78.1%) are family households, while 75 (21.9%) are nonfamily households. The most numerous type of family households are 3-person households, comprising 103, and the most common type of nonfamily households are 1-person households, comprising 75.
| Household Size | Family Households | Nonfamily Households |
| 1-Person Households | - | 75 (21.9%) |
| 2-Person Households | 100 (29.1%) | 0 (0.0%) |
| 3-Person Households | 103 (30.0%) | 0 (0.0%) |
| 4-Person Households | 65 (19.0%) | 0 (0.0%) |
| 5-Person Households | 0 (0.0%) | 0 (0.0%) |
| 6-Person Households | 0 (0.0%) | 0 (0.0%) |
| 7+ Person Households | 0 (0.0%) | 0 (0.0%) |
| Total | 268 (78.1%) | 75 (21.9%) |
Female Fertility in East Newnan
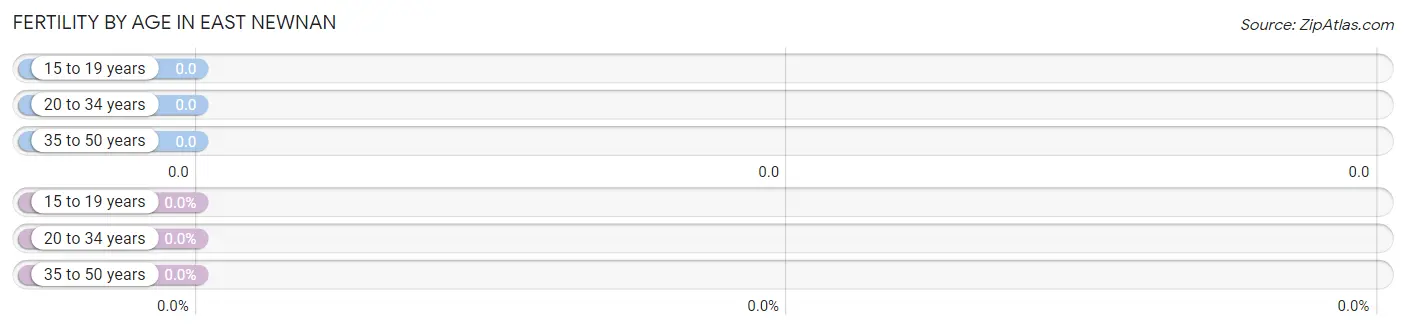
Fertility by Age in East Newnan
| Age Bracket | Women with Births | Births / 1,000 Women |
| 15 to 19 years | 0 (0.0%) | 0.0 |
| 20 to 34 years | 0 (0.0%) | 0.0 |
| 35 to 50 years | 0 (0.0%) | 0.0 |
| Total | 0 (0.0%) | 0.0 |
Fertility by Age by Marriage Status in East Newnan
| Age Bracket | Married | Unmarried |
| 15 to 19 years | 0 (0.0%) | 0 (0.0%) |
| 20 to 34 years | 0 (0.0%) | 0 (0.0%) |
| 35 to 50 years | 0 (0.0%) | 0 (0.0%) |
| Total | 0 (0.0%) | 0 (0.0%) |
Fertility by Education in East Newnan
| Educational Attainment | Women with Births | Births / 1,000 Women |
| Less than High School | 0 (0.0%) | 0.0 |
| High School Diploma | 0 (0.0%) | 0.0 |
| College or Associate's Degree | 0 (0.0%) | 0.0 |
| Bachelor's Degree | 0 (0.0%) | 0.0 |
| Graduate Degree | 0 (0.0%) | 0.0 |
| Total | 0 (0.0%) | 0.0 |
Fertility by Education by Marriage Status in East Newnan
| Educational Attainment | Married | Unmarried |
| Less than High School | 0 (0.0%) | 0 (0.0%) |
| High School Diploma | 0 (0.0%) | 0 (0.0%) |
| College or Associate's Degree | 0 (0.0%) | 0 (0.0%) |
| Bachelor's Degree | 0 (0.0%) | 0 (0.0%) |
| Graduate Degree | 0 (0.0%) | 0 (0.0%) |
| Total | 0 (0.0%) | 0 (0.0%) |
Income in East Newnan
Income Overview in East Newnan
Per Capita Income in East Newnan is $17,494, while median incomes of families and households are $40,833 and $36,192 respectively.
| Characteristic | Number | Measure |
| Per Capita Income | 917 | $17,494 |
| Median Family Income | 268 | $40,833 |
| Mean Family Income | 268 | $49,593 |
| Median Household Income | 343 | $36,192 |
| Mean Household Income | 343 | $42,185 |
| Income Deficit | 268 | $0 |
| Wage / Income Gap (%) | 917 | 0.00% |
| Wage / Income Gap ($) | 917 | 100.00¢ per $1 |
| Gini / Inequality Index | 917 | 0.42 |
Earnings by Sex in East Newnan
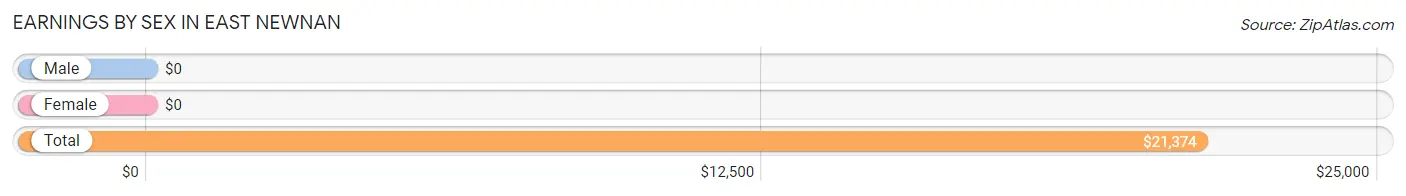
| Sex | Number | Average Earnings |
| Male | 183 (45.8%) | $0 |
| Female | 217 (54.2%) | $0 |
| Total | 400 (100.0%) | $21,374 |
Earnings by Sex by Income Bracket in East Newnan
The most common earnings brackets in East Newnan are $35,000 to $39,999 for men (49 | 26.8%) and $20,000 to $22,499 for women (64 | 29.5%).
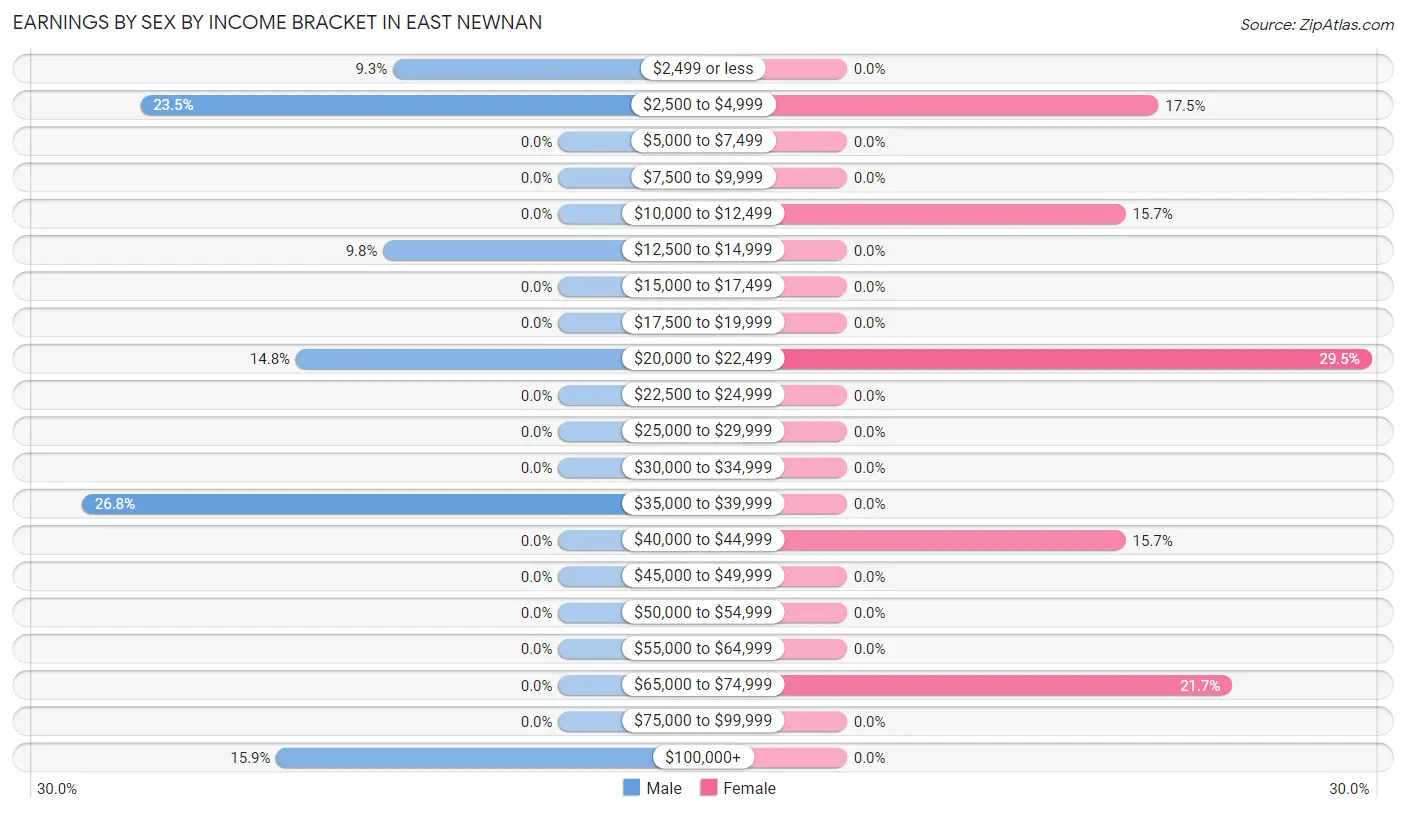
| Income | Male | Female |
| $2,499 or less | 17 (9.3%) | 0 (0.0%) |
| $2,500 to $4,999 | 43 (23.5%) | 38 (17.5%) |
| $5,000 to $7,499 | 0 (0.0%) | 0 (0.0%) |
| $7,500 to $9,999 | 0 (0.0%) | 0 (0.0%) |
| $10,000 to $12,499 | 0 (0.0%) | 34 (15.7%) |
| $12,500 to $14,999 | 18 (9.8%) | 0 (0.0%) |
| $15,000 to $17,499 | 0 (0.0%) | 0 (0.0%) |
| $17,500 to $19,999 | 0 (0.0%) | 0 (0.0%) |
| $20,000 to $22,499 | 27 (14.7%) | 64 (29.5%) |
| $22,500 to $24,999 | 0 (0.0%) | 0 (0.0%) |
| $25,000 to $29,999 | 0 (0.0%) | 0 (0.0%) |
| $30,000 to $34,999 | 0 (0.0%) | 0 (0.0%) |
| $35,000 to $39,999 | 49 (26.8%) | 0 (0.0%) |
| $40,000 to $44,999 | 0 (0.0%) | 34 (15.7%) |
| $45,000 to $49,999 | 0 (0.0%) | 0 (0.0%) |
| $50,000 to $54,999 | 0 (0.0%) | 0 (0.0%) |
| $55,000 to $64,999 | 0 (0.0%) | 0 (0.0%) |
| $65,000 to $74,999 | 0 (0.0%) | 47 (21.7%) |
| $75,000 to $99,999 | 0 (0.0%) | 0 (0.0%) |
| $100,000+ | 29 (15.9%) | 0 (0.0%) |
| Total | 183 (100.0%) | 217 (100.0%) |
Earnings by Sex by Educational Attainment in East Newnan
| Educational Attainment | Male Income | Female Income |
| Less than High School | - | - |
| High School Diploma | - | - |
| College or Associate's Degree | - | - |
| Bachelor's Degree | - | - |
| Graduate Degree | - | - |
| Total | - | - |
Family Income in East Newnan
Family Income Brackets in East Newnan
According to the East Newnan family income data, there are 70 families falling into the $35,000 to $49,999 income range, which is the most common income bracket and makes up 26.1% of all families.
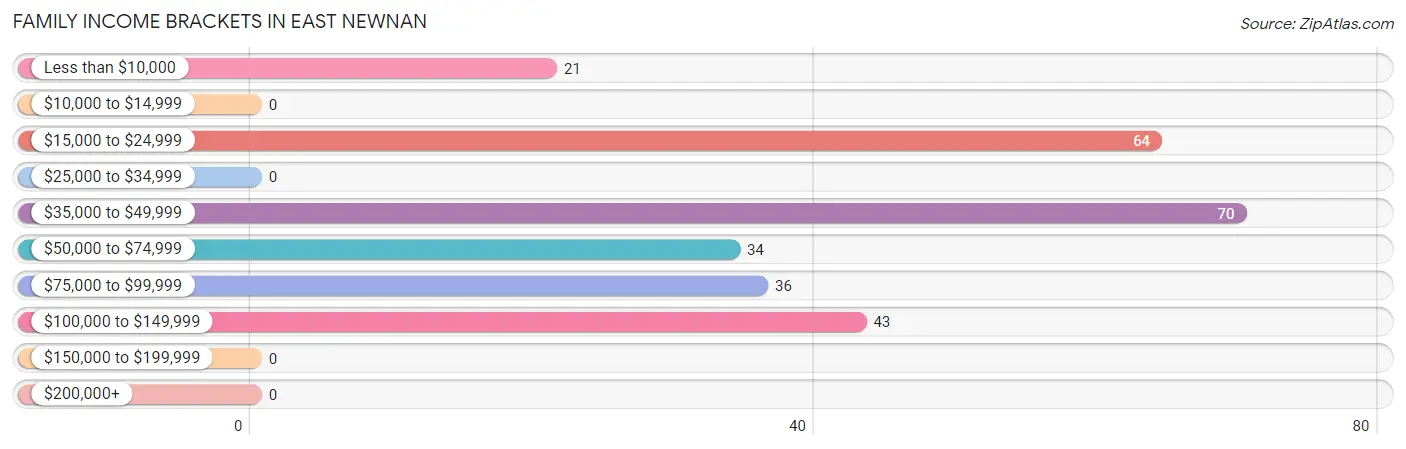
| Income Bracket | # Families | % Families |
| Less than $10,000 | 21 | 7.8% |
| $10,000 to $14,999 | 0 | 0.0% |
| $15,000 to $24,999 | 64 | 23.9% |
| $25,000 to $34,999 | 0 | 0.0% |
| $35,000 to $49,999 | 70 | 26.1% |
| $50,000 to $74,999 | 34 | 12.7% |
| $75,000 to $99,999 | 36 | 13.4% |
| $100,000 to $149,999 | 43 | 16.0% |
| $150,000 to $199,999 | 0 | 0.0% |
| $200,000+ | 0 | 0.0% |
Family Income by Famaliy Size in East Newnan
| Income Bracket | # Families | Median Income |
| 2-Person Families | 100 (37.3%) | $0 |
| 3-Person Families | 103 (38.4%) | $0 |
| 4-Person Families | 65 (24.2%) | $0 |
| 5-Person Families | 0 (0.0%) | $0 |
| 6-Person Families | 0 (0.0%) | $0 |
| 7+ Person Families | 0 (0.0%) | $0 |
| Total | 268 (100.0%) | $40,833 |
Family Income by Number of Earners in East Newnan
| Number of Earners | # Families | Median Income |
| No Earners | 21 (7.8%) | $0 |
| 1 Earner | 192 (71.6%) | $0 |
| 2 Earners | 0 (0.0%) | $0 |
| 3+ Earners | 55 (20.5%) | $0 |
| Total | 268 (100.0%) | $40,833 |
Household Income in East Newnan
Household Income Brackets in East Newnan
With 115 households falling in the category, the $15,000 to $24,999 income range is the most frequent in East Newnan, accounting for 33.5% of all households.
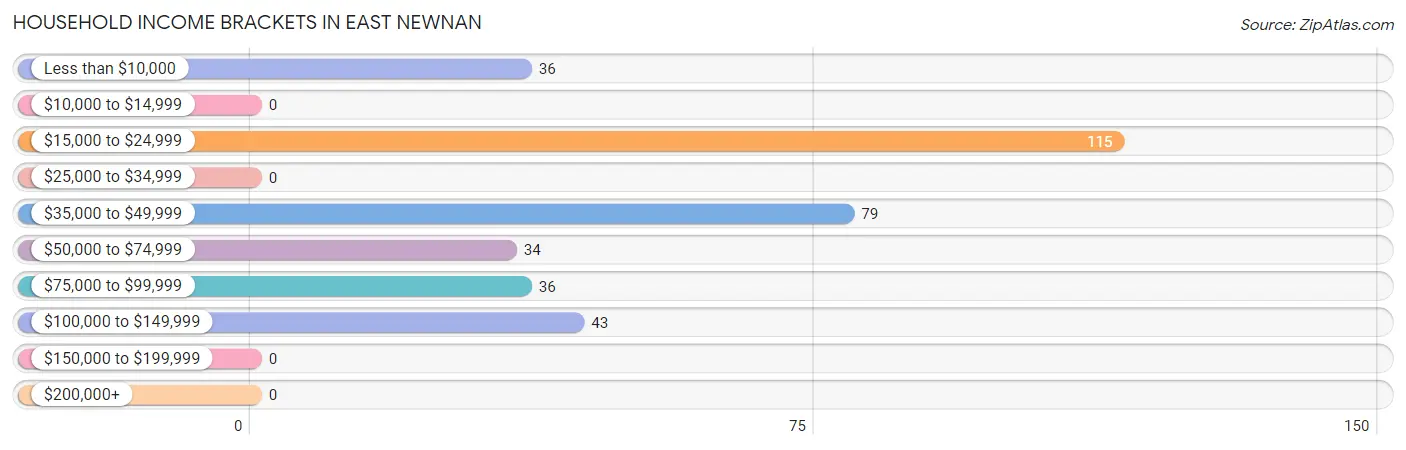
| Income Bracket | # Households | % Households |
| Less than $10,000 | 36 | 10.5% |
| $10,000 to $14,999 | 0 | 0.0% |
| $15,000 to $24,999 | 115 | 33.5% |
| $25,000 to $34,999 | 0 | 0.0% |
| $35,000 to $49,999 | 79 | 23.0% |
| $50,000 to $74,999 | 34 | 9.9% |
| $75,000 to $99,999 | 36 | 10.5% |
| $100,000 to $149,999 | 43 | 12.5% |
| $150,000 to $199,999 | 0 | 0.0% |
| $200,000+ | 0 | 0.0% |
Household Income by Householder Age in East Newnan
The median household income in East Newnan is $36,192, with the highest median household income of $36,599 found in the 65+ years age bracket for the primary householder. A total of 157 households (45.8%) fall into this category.
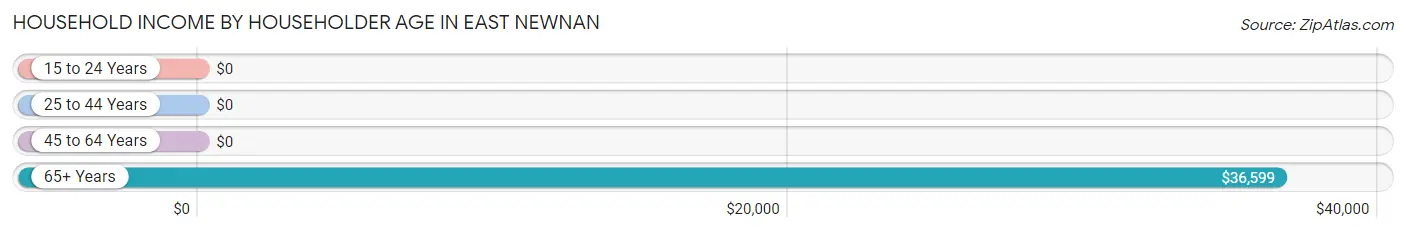
| Income Bracket | # Households | Median Income |
| 15 to 24 Years | 0 (0.0%) | $0 |
| 25 to 44 Years | 22 (6.4%) | $0 |
| 45 to 64 Years | 164 (47.8%) | $0 |
| 65+ Years | 157 (45.8%) | $36,599 |
| Total | 343 (100.0%) | $36,192 |
Poverty in East Newnan
Income Below Poverty by Sex and Age in East Newnan
With 45.5% poverty level for males and 16.5% for females among the residents of East Newnan, 55 to 64 year old males and 45 to 54 year old females are the most vulnerable to poverty, with 36 males (100.0%) and 64 females (52.0%) in their respective age groups living below the poverty level.
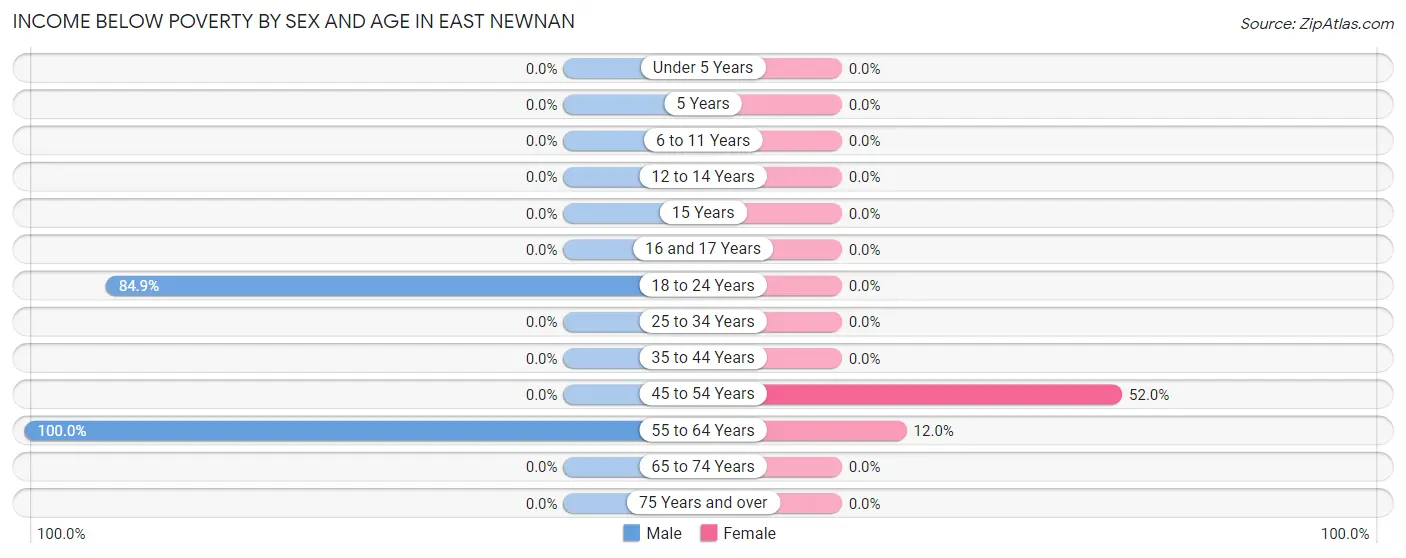
| Age Bracket | Male | Female |
| Under 5 Years | 0 (0.0%) | 0 (0.0%) |
| 5 Years | 0 (0.0%) | 0 (0.0%) |
| 6 to 11 Years | 0 (0.0%) | 0 (0.0%) |
| 12 to 14 Years | 0 (0.0%) | 0 (0.0%) |
| 15 Years | 0 (0.0%) | 0 (0.0%) |
| 16 and 17 Years | 0 (0.0%) | 0 (0.0%) |
| 18 to 24 Years | 169 (84.9%) | 0 (0.0%) |
| 25 to 34 Years | 0 (0.0%) | 0 (0.0%) |
| 35 to 44 Years | 0 (0.0%) | 0 (0.0%) |
| 45 to 54 Years | 0 (0.0%) | 64 (52.0%) |
| 55 to 64 Years | 36 (100.0%) | 13 (12.0%) |
| 65 to 74 Years | 0 (0.0%) | 0 (0.0%) |
| 75 Years and over | 0 (0.0%) | 0 (0.0%) |
| Total | 205 (45.5%) | 77 (16.5%) |
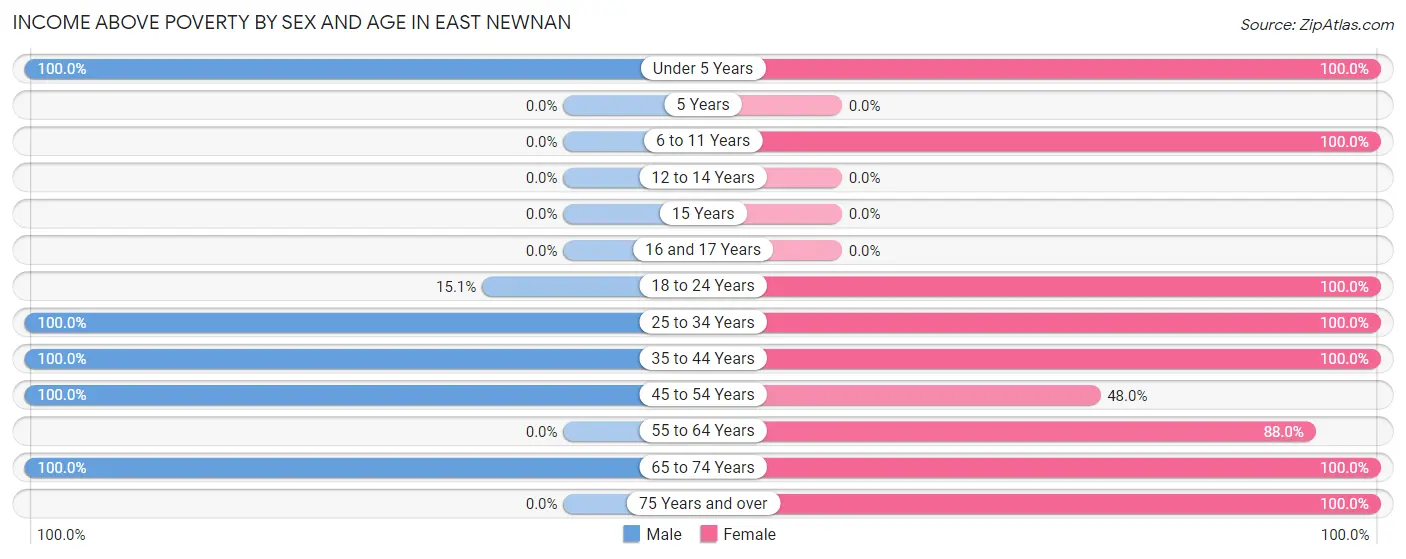
Income Above Poverty by Sex and Age in East Newnan
According to the poverty statistics in East Newnan, males aged under 5 years and females aged under 5 years are the age groups that are most secure financially, with 100.0% of males and 100.0% of females in these age groups living above the poverty line.
| Age Bracket | Male | Female |
| Under 5 Years | 24 (100.0%) | 7 (100.0%) |
| 5 Years | 0 (0.0%) | 0 (0.0%) |
| 6 to 11 Years | 0 (0.0%) | 57 (100.0%) |
| 12 to 14 Years | 0 (0.0%) | 0 (0.0%) |
| 15 Years | 0 (0.0%) | 0 (0.0%) |
| 16 and 17 Years | 0 (0.0%) | 0 (0.0%) |
| 18 to 24 Years | 30 (15.1%) | 38 (100.0%) |
| 25 to 34 Years | 56 (100.0%) | 22 (100.0%) |
| 35 to 44 Years | 17 (100.0%) | 7 (100.0%) |
| 45 to 54 Years | 49 (100.0%) | 59 (48.0%) |
| 55 to 64 Years | 0 (0.0%) | 95 (88.0%) |
| 65 to 74 Years | 70 (100.0%) | 68 (100.0%) |
| 75 Years and over | 0 (0.0%) | 36 (100.0%) |
| Total | 246 (54.5%) | 389 (83.5%) |
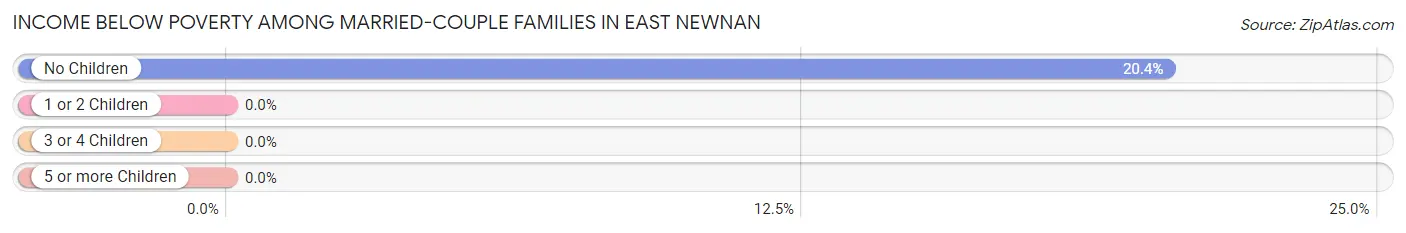
Income Below Poverty Among Married-Couple Families in East Newnan
The poverty statistics for married-couple families in East Newnan show that 13.2% or 21 of the total 159 families live below the poverty line. Families with no children have the highest poverty rate of 20.4%, comprising of 21 families. On the other hand, families with 1 or 2 children have the lowest poverty rate of 0.0%, which includes 0 families.
| Children | Above Poverty | Below Poverty |
| No Children | 82 (79.6%) | 21 (20.4%) |
| 1 or 2 Children | 56 (100.0%) | 0 (0.0%) |
| 3 or 4 Children | 0 (0.0%) | 0 (0.0%) |
| 5 or more Children | 0 (0.0%) | 0 (0.0%) |
| Total | 138 (86.8%) | 21 (13.2%) |
Income Below Poverty Among Single-Parent Households in East Newnan
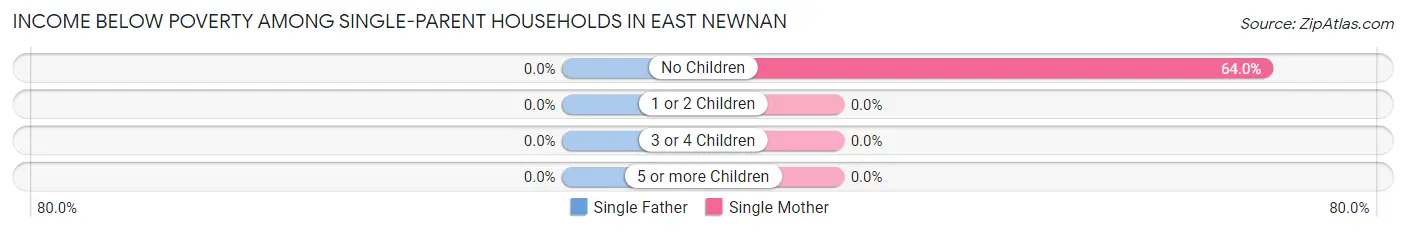
| Children | Single Father | Single Mother |
| No Children | 0 (0.0%) | 64 (64.0%) |
| 1 or 2 Children | 0 (0.0%) | 0 (0.0%) |
| 3 or 4 Children | 0 (0.0%) | 0 (0.0%) |
| 5 or more Children | 0 (0.0%) | 0 (0.0%) |
| Total | 0 (0.0%) | 64 (64.0%) |
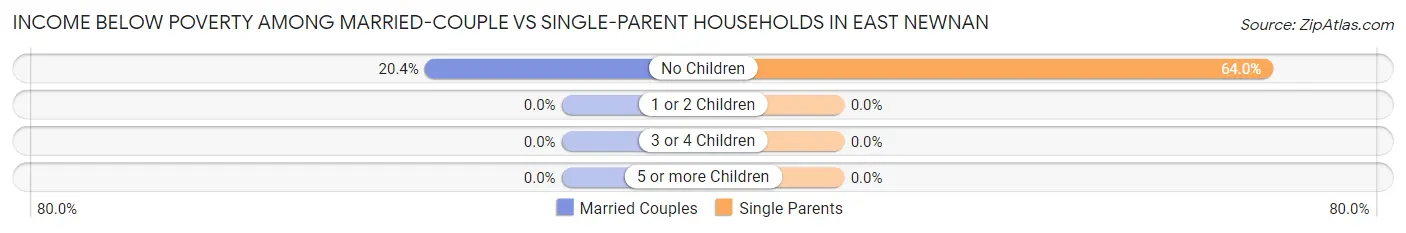
Income Below Poverty Among Married-Couple vs Single-Parent Households in East Newnan
The poverty data for East Newnan shows that 21 of the married-couple family households (13.2%) and 64 of the single-parent households (58.7%) are living below the poverty level. Within the married-couple family households, those with no children have the highest poverty rate, with 21 households (20.4%) falling below the poverty line. Among the single-parent households, those with no children have the highest poverty rate, with 64 household (64.0%) living below poverty.
| Children | Married-Couple Families | Single-Parent Households |
| No Children | 21 (20.4%) | 64 (64.0%) |
| 1 or 2 Children | 0 (0.0%) | 0 (0.0%) |
| 3 or 4 Children | 0 (0.0%) | 0 (0.0%) |
| 5 or more Children | 0 (0.0%) | 0 (0.0%) |
| Total | 21 (13.2%) | 64 (58.7%) |
Employment Characteristics in East Newnan
Employment by Class of Employer in East Newnan
Among the 322 employed individuals in East Newnan, private company employees (313 | 97.2%), and local government employees (9 | 2.8%) make up the most common classes of employment.
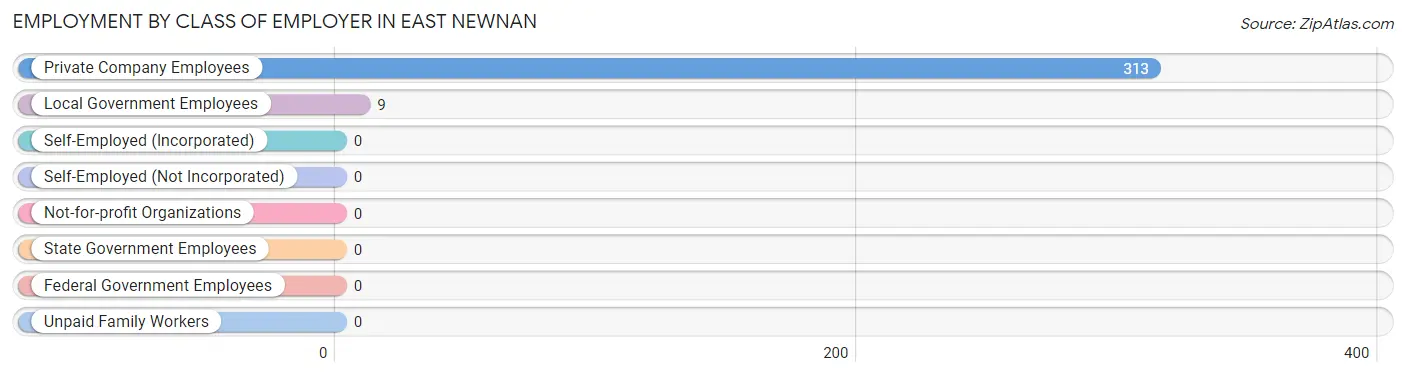
| Employer Class | # Employees | % Employees |
| Private Company Employees | 313 | 97.2% |
| Self-Employed (Incorporated) | 0 | 0.0% |
| Self-Employed (Not Incorporated) | 0 | 0.0% |
| Not-for-profit Organizations | 0 | 0.0% |
| Local Government Employees | 9 | 2.8% |
| State Government Employees | 0 | 0.0% |
| Federal Government Employees | 0 | 0.0% |
| Unpaid Family Workers | 0 | 0.0% |
| Total | 322 | 100.0% |
Employment Status by Age in East Newnan
According to the labor force statistics for East Newnan, out of the total population over 16 years of age (829), 43.9% or 364 individuals are in the labor force, with 11.5% or 42 of them unemployed. The age group with the highest labor force participation rate is 25 to 29 years, with 100.0% or 27 individuals in the labor force. Within the labor force, the 35 to 44 years age range has the highest percentage of unemployed individuals, with 100.0% or 24 of them being unemployed.
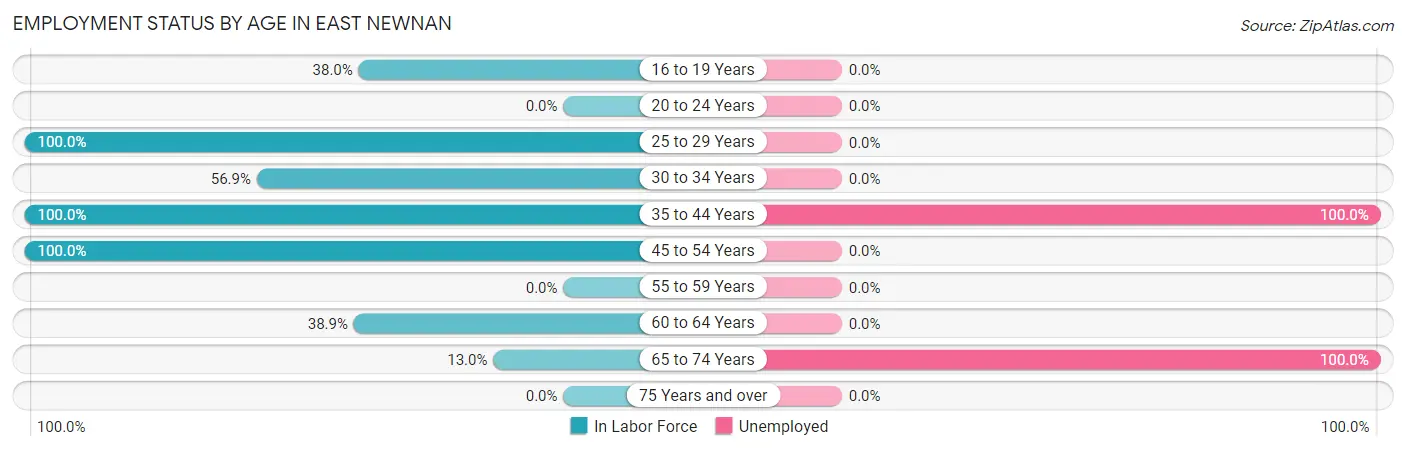
| Age Bracket | In Labor Force | Unemployed |
| 16 to 19 Years | 38 (38.0%) | 0 (0.0%) |
| 20 to 24 Years | 0 (0.0%) | 0 (0.0%) |
| 25 to 29 Years | 27 (100.0%) | 0 (0.0%) |
| 30 to 34 Years | 29 (56.9%) | 0 (0.0%) |
| 35 to 44 Years | 24 (100.0%) | 24 (100.0%) |
| 45 to 54 Years | 172 (100.0%) | 0 (0.0%) |
| 55 to 59 Years | 0 (0.0%) | 0 (0.0%) |
| 60 to 64 Years | 56 (38.9%) | 0 (0.0%) |
| 65 to 74 Years | 18 (13.0%) | 18 (100.0%) |
| 75 Years and over | 0 (0.0%) | 0 (0.0%) |
| Total | 364 (43.9%) | 42 (11.5%) |
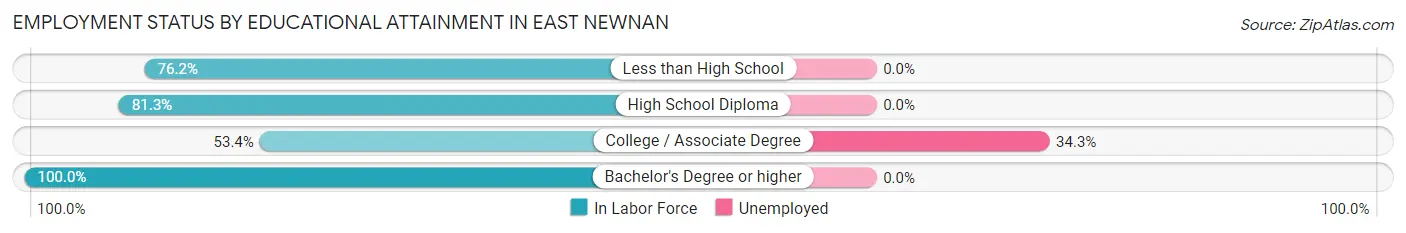
Employment Status by Educational Attainment in East Newnan
According to labor force statistics for East Newnan, 73.7% of individuals (308) out of the total population between 25 and 64 years of age (418) are in the labor force, with 7.8% or 24 of them being unemployed. The group with the highest labor force participation rate are those with the educational attainment of bachelor's degree or higher, with 100.0% or 64 individuals in the labor force. Within the labor force, individuals with college / associate degree education have the highest percentage of unemployment, with 34.3% or 24 of them being unemployed.
| Educational Attainment | In Labor Force | Unemployed |
| Less than High School | 109 (76.2%) | 0 (0.0%) |
| High School Diploma | 65 (81.3%) | 0 (0.0%) |
| College / Associate Degree | 70 (53.4%) | 45 (34.3%) |
| Bachelor's Degree or higher | 64 (100.0%) | 0 (0.0%) |
| Total | 308 (73.7%) | 33 (7.8%) |
Employment Occupations by Sex in East Newnan
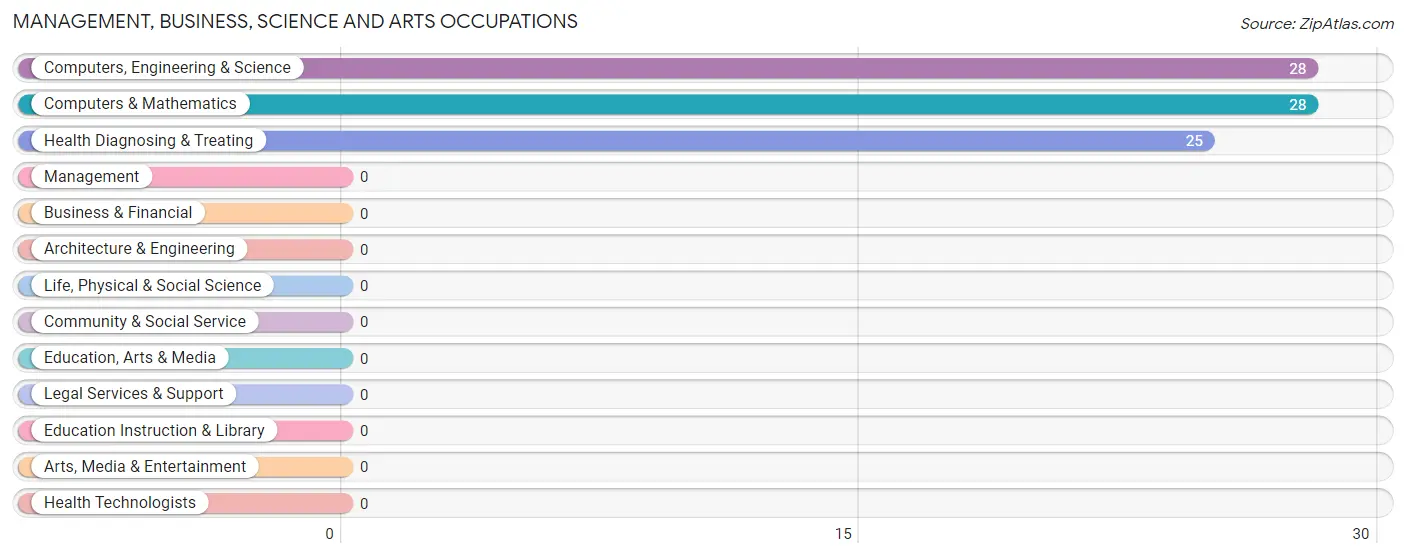
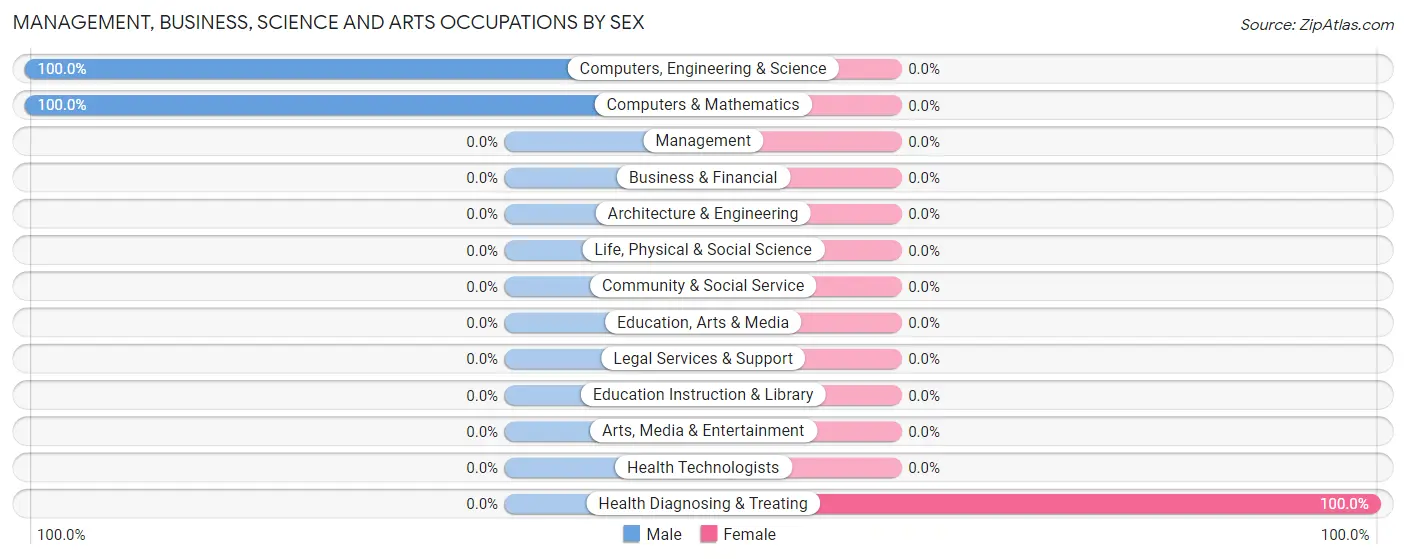
Management, Business, Science and Arts Occupations
The most common Management, Business, Science and Arts occupations in East Newnan are Computers, Engineering & Science (28 | 8.7%), Computers & Mathematics (28 | 8.7%), and Health Diagnosing & Treating (25 | 7.8%).
Management, Business, Science and Arts Occupations by Sex
| Occupation | Male | Female |
| Management | 0 (0.0%) | 0 (0.0%) |
| Business & Financial | 0 (0.0%) | 0 (0.0%) |
| Computers, Engineering & Science | 28 (100.0%) | 0 (0.0%) |
| Computers & Mathematics | 28 (100.0%) | 0 (0.0%) |
| Architecture & Engineering | 0 (0.0%) | 0 (0.0%) |
| Life, Physical & Social Science | 0 (0.0%) | 0 (0.0%) |
| Community & Social Service | 0 (0.0%) | 0 (0.0%) |
| Education, Arts & Media | 0 (0.0%) | 0 (0.0%) |
| Legal Services & Support | 0 (0.0%) | 0 (0.0%) |
| Education Instruction & Library | 0 (0.0%) | 0 (0.0%) |
| Arts, Media & Entertainment | 0 (0.0%) | 0 (0.0%) |
| Health Diagnosing & Treating | 0 (0.0%) | 25 (100.0%) |
| Health Technologists | 0 (0.0%) | 0 (0.0%) |
| Total (Category) | 28 (52.8%) | 25 (47.2%) |
| Total (Overall) | 105 (32.6%) | 217 (67.4%) |
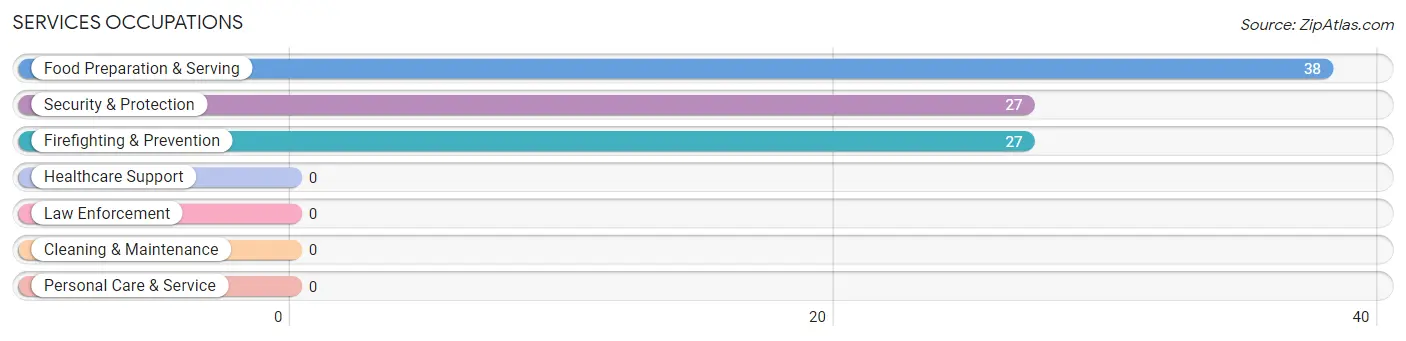
Services Occupations
The most common Services occupations in East Newnan are Food Preparation & Serving (38 | 11.8%), Security & Protection (27 | 8.4%), and Firefighting & Prevention (27 | 8.4%).
Services Occupations by Sex
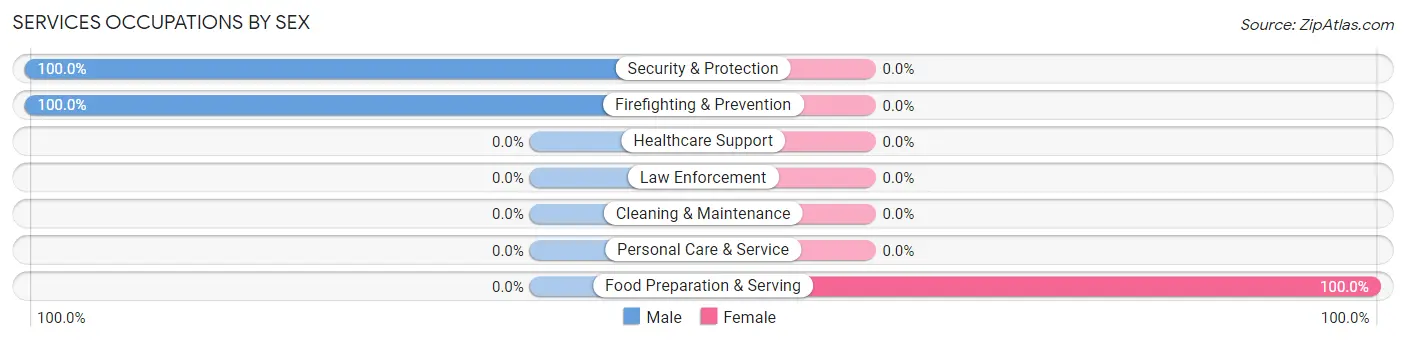
| Occupation | Male | Female |
| Healthcare Support | 0 (0.0%) | 0 (0.0%) |
| Security & Protection | 27 (100.0%) | 0 (0.0%) |
| Firefighting & Prevention | 27 (100.0%) | 0 (0.0%) |
| Law Enforcement | 0 (0.0%) | 0 (0.0%) |
| Food Preparation & Serving | 0 (0.0%) | 38 (100.0%) |
| Cleaning & Maintenance | 0 (0.0%) | 0 (0.0%) |
| Personal Care & Service | 0 (0.0%) | 0 (0.0%) |
| Total (Category) | 27 (41.5%) | 38 (58.5%) |
| Total (Overall) | 105 (32.6%) | 217 (67.4%) |
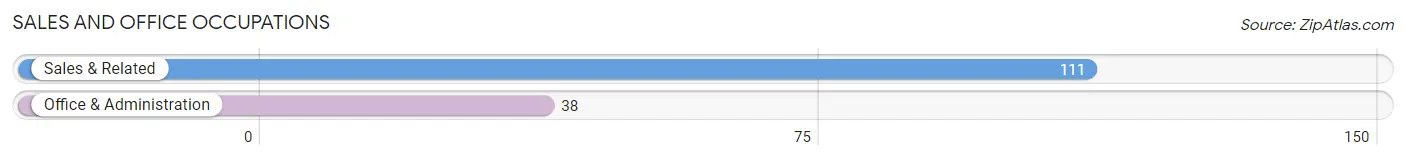
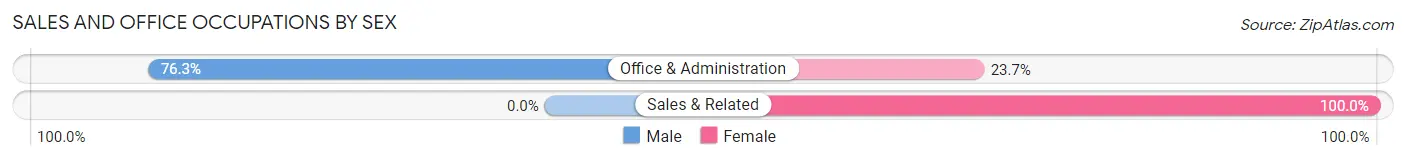
Sales and Office Occupations
The most common Sales and Office occupations in East Newnan are Sales & Related (111 | 34.5%), and Office & Administration (38 | 11.8%).
Sales and Office Occupations by Sex
| Occupation | Male | Female |
| Sales & Related | 0 (0.0%) | 111 (100.0%) |
| Office & Administration | 29 (76.3%) | 9 (23.7%) |
| Total (Category) | 29 (19.5%) | 120 (80.5%) |
| Total (Overall) | 105 (32.6%) | 217 (67.4%) |
Natural Resources, Construction and Maintenance Occupations
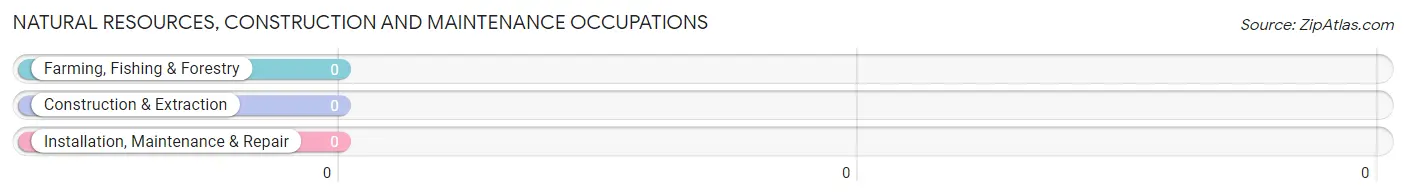
Natural Resources, Construction and Maintenance Occupations by Sex
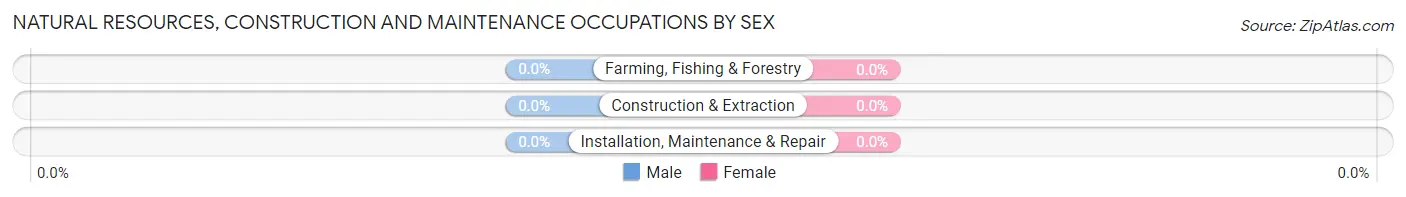
| Occupation | Male | Female |
| Farming, Fishing & Forestry | 0 (0.0%) | 0 (0.0%) |
| Construction & Extraction | 0 (0.0%) | 0 (0.0%) |
| Installation, Maintenance & Repair | 0 (0.0%) | 0 (0.0%) |
| Total (Category) | 0 (0.0%) | 0 (0.0%) |
| Total (Overall) | 105 (32.6%) | 217 (67.4%) |
Production, Transportation and Moving Occupations
The most common Production, Transportation and Moving occupations in East Newnan are Material Moving (34 | 10.6%), and Transportation (21 | 6.5%).
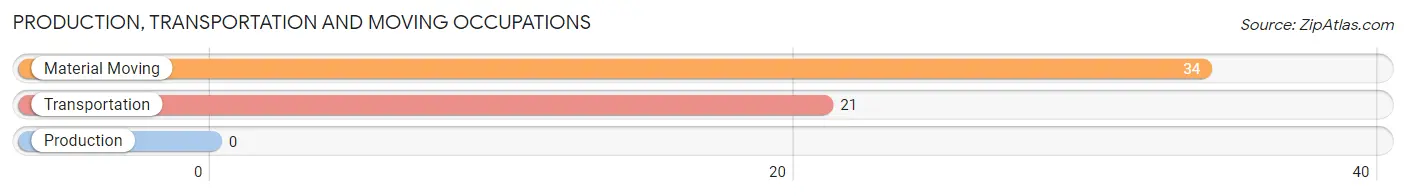
Production, Transportation and Moving Occupations by Sex
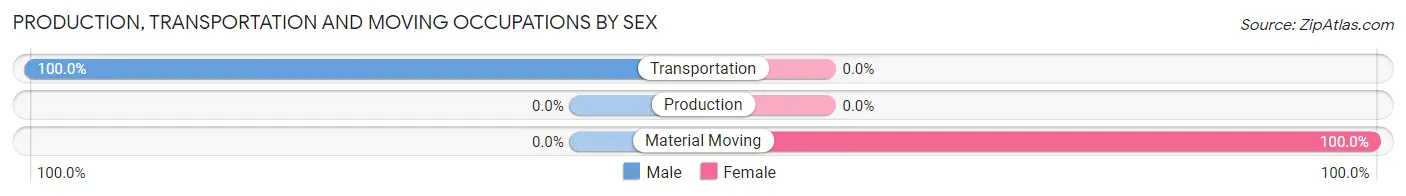
| Occupation | Male | Female |
| Production | 0 (0.0%) | 0 (0.0%) |
| Transportation | 21 (100.0%) | 0 (0.0%) |
| Material Moving | 0 (0.0%) | 34 (100.0%) |
| Total (Category) | 21 (38.2%) | 34 (61.8%) |
| Total (Overall) | 105 (32.6%) | 217 (67.4%) |
Employment Industries by Sex in East Newnan
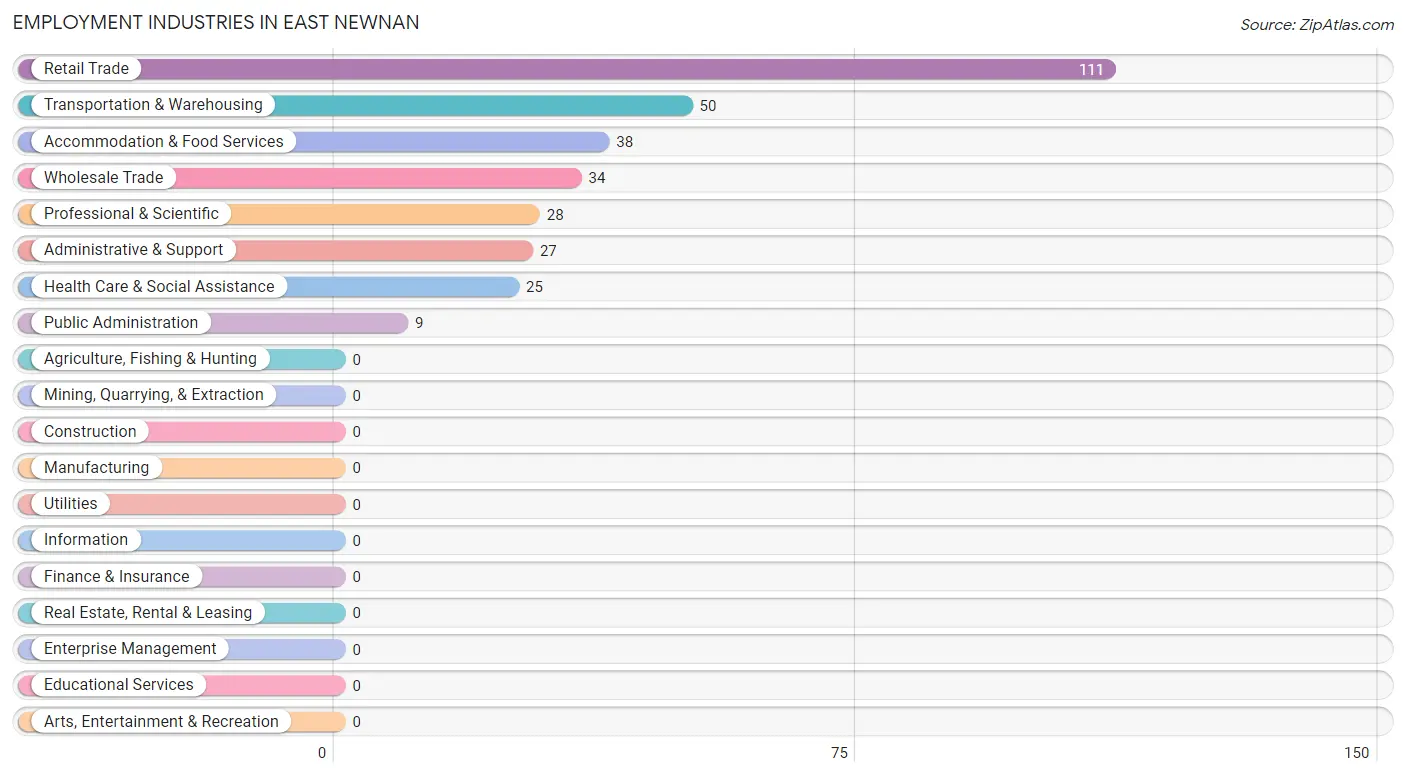
Employment Industries in East Newnan
The major employment industries in East Newnan include Retail Trade (111 | 34.5%), Transportation & Warehousing (50 | 15.5%), Accommodation & Food Services (38 | 11.8%), Wholesale Trade (34 | 10.6%), and Professional & Scientific (28 | 8.7%).
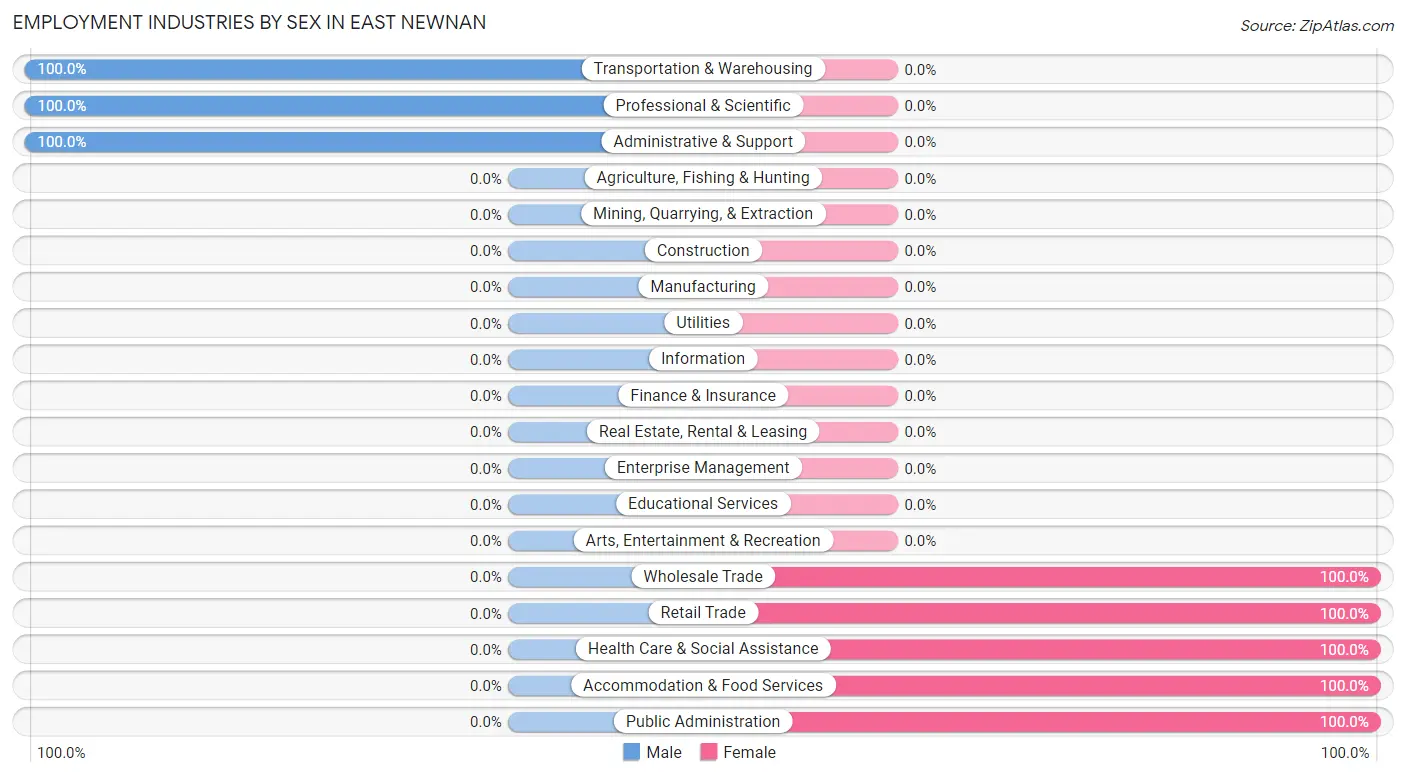
Employment Industries by Sex in East Newnan
The East Newnan industries that see more men than women are Transportation & Warehousing (100.0%), Professional & Scientific (100.0%), and Administrative & Support (100.0%), whereas the industries that tend to have a higher number of women are Wholesale Trade (100.0%), Retail Trade (100.0%), and Health Care & Social Assistance (100.0%).
| Industry | Male | Female |
| Agriculture, Fishing & Hunting | 0 (0.0%) | 0 (0.0%) |
| Mining, Quarrying, & Extraction | 0 (0.0%) | 0 (0.0%) |
| Construction | 0 (0.0%) | 0 (0.0%) |
| Manufacturing | 0 (0.0%) | 0 (0.0%) |
| Wholesale Trade | 0 (0.0%) | 34 (100.0%) |
| Retail Trade | 0 (0.0%) | 111 (100.0%) |
| Transportation & Warehousing | 50 (100.0%) | 0 (0.0%) |
| Utilities | 0 (0.0%) | 0 (0.0%) |
| Information | 0 (0.0%) | 0 (0.0%) |
| Finance & Insurance | 0 (0.0%) | 0 (0.0%) |
| Real Estate, Rental & Leasing | 0 (0.0%) | 0 (0.0%) |
| Professional & Scientific | 28 (100.0%) | 0 (0.0%) |
| Enterprise Management | 0 (0.0%) | 0 (0.0%) |
| Administrative & Support | 27 (100.0%) | 0 (0.0%) |
| Educational Services | 0 (0.0%) | 0 (0.0%) |
| Health Care & Social Assistance | 0 (0.0%) | 25 (100.0%) |
| Arts, Entertainment & Recreation | 0 (0.0%) | 0 (0.0%) |
| Accommodation & Food Services | 0 (0.0%) | 38 (100.0%) |
| Public Administration | 0 (0.0%) | 9 (100.0%) |
| Total | 105 (32.6%) | 217 (67.4%) |
Education in East Newnan
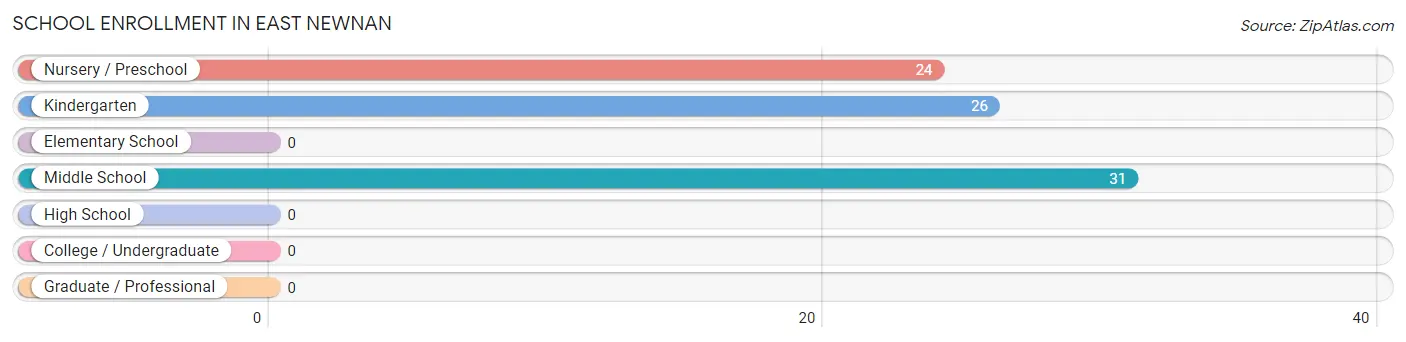
School Enrollment in East Newnan
The most common levels of schooling among the 81 students in East Newnan are middle school (31 | 38.3%), kindergarten (26 | 32.1%), and nursery / preschool (24 | 29.6%).
| School Level | # Students | % Students |
| Nursery / Preschool | 24 | 29.6% |
| Kindergarten | 26 | 32.1% |
| Elementary School | 0 | 0.0% |
| Middle School | 31 | 38.3% |
| High School | 0 | 0.0% |
| College / Undergraduate | 0 | 0.0% |
| Graduate / Professional | 0 | 0.0% |
| Total | 81 | 100.0% |
School Enrollment by Age by Funding Source in East Newnan
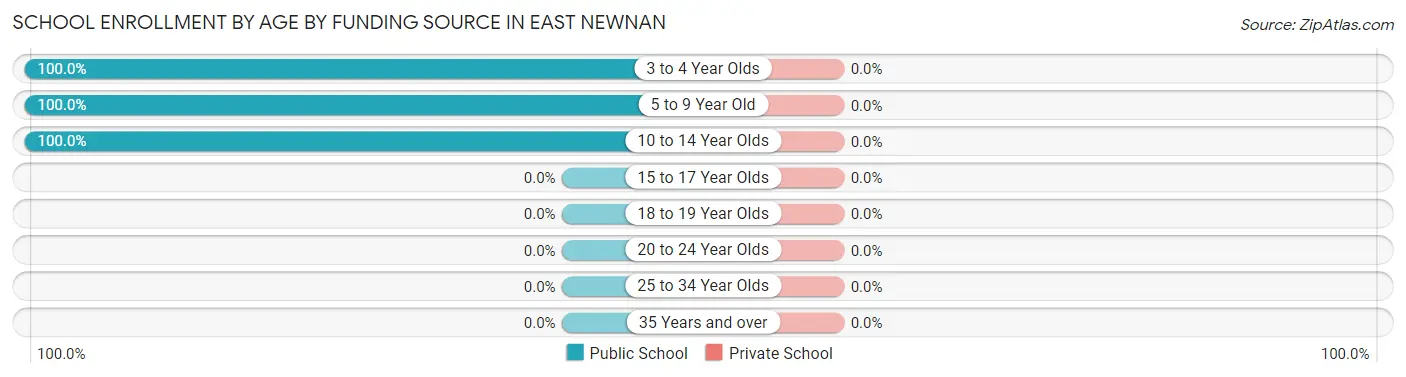
| Age Bracket | Public School | Private School |
| 3 to 4 Year Olds | 24 (100.0%) | 0 (0.0%) |
| 5 to 9 Year Old | 26 (100.0%) | 0 (0.0%) |
| 10 to 14 Year Olds | 31 (100.0%) | 0 (0.0%) |
| 15 to 17 Year Olds | 0 (0.0%) | 0 (0.0%) |
| 18 to 19 Year Olds | 0 (0.0%) | 0 (0.0%) |
| 20 to 24 Year Olds | 0 (0.0%) | 0 (0.0%) |
| 25 to 34 Year Olds | 0 (0.0%) | 0 (0.0%) |
| 35 Years and over | 0 (0.0%) | 0 (0.0%) |
| Total | 81 (100.0%) | 0 (0.0%) |
Educational Attainment by Field of Study in East Newnan
, and business (64 | 100.0%) are the most common fields of study among 64 individuals in East Newnan who have obtained a bachelor's degree or higher.
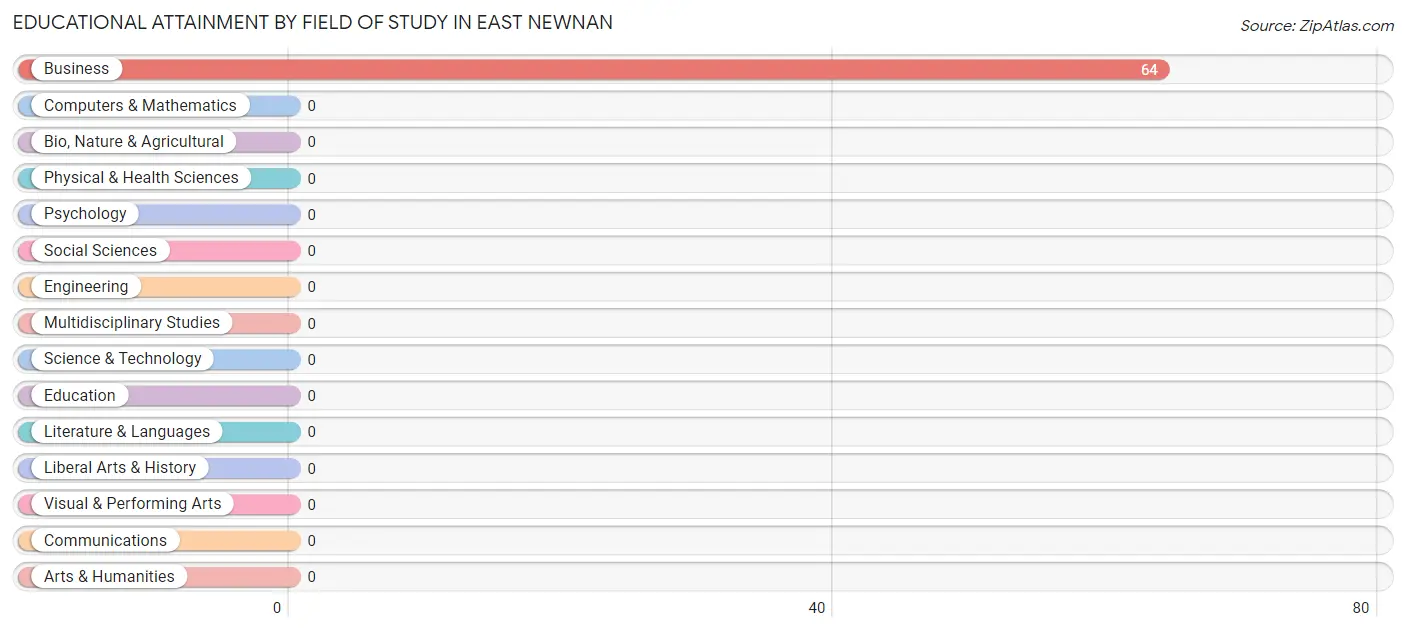
| Field of Study | # Graduates | % Graduates |
| Computers & Mathematics | 0 | 0.0% |
| Bio, Nature & Agricultural | 0 | 0.0% |
| Physical & Health Sciences | 0 | 0.0% |
| Psychology | 0 | 0.0% |
| Social Sciences | 0 | 0.0% |
| Engineering | 0 | 0.0% |
| Multidisciplinary Studies | 0 | 0.0% |
| Science & Technology | 0 | 0.0% |
| Business | 64 | 100.0% |
| Education | 0 | 0.0% |
| Literature & Languages | 0 | 0.0% |
| Liberal Arts & History | 0 | 0.0% |
| Visual & Performing Arts | 0 | 0.0% |
| Communications | 0 | 0.0% |
| Arts & Humanities | 0 | 0.0% |
| Total | 64 | 100.0% |
Transportation & Commute in East Newnan
Vehicle Availability by Sex in East Newnan
The most prevalent vehicle ownership categories in East Newnan are males with 2 vehicles (57, accounting for 54.3%) and females with 2 vehicles (72, making up 26.3%).
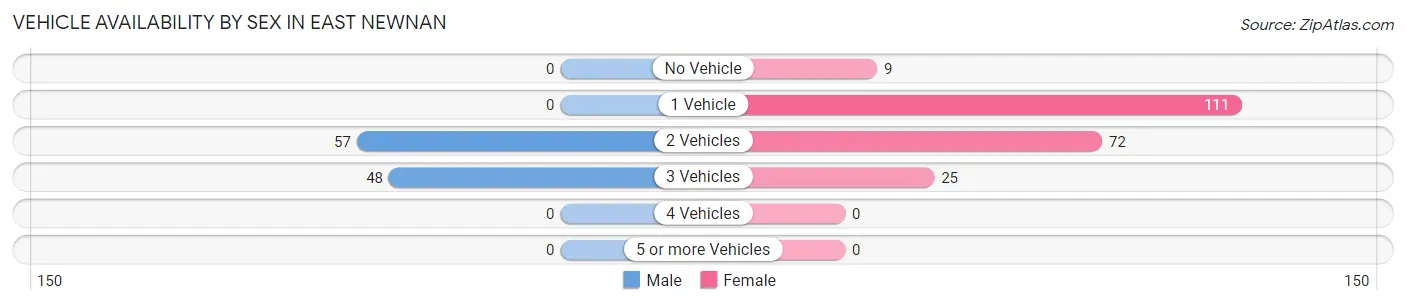
| Vehicles Available | Male | Female |
| No Vehicle | 0 (0.0%) | 9 (4.2%) |
| 1 Vehicle | 0 (0.0%) | 111 (51.1%) |
| 2 Vehicles | 57 (54.3%) | 72 (33.2%) |
| 3 Vehicles | 48 (45.7%) | 25 (11.5%) |
| 4 Vehicles | 0 (0.0%) | 0 (0.0%) |
| 5 or more Vehicles | 0 (0.0%) | 0 (0.0%) |
| Total | 105 (100.0%) | 217 (100.0%) |
Commute Time in East Newnan
The most frequently occuring commute durations in East Newnan are 15 to 19 minutes (111 commuters, 42.7%), 20 to 24 minutes (65 commuters, 25.0%), and 25 to 29 minutes (29 commuters, 11.2%).
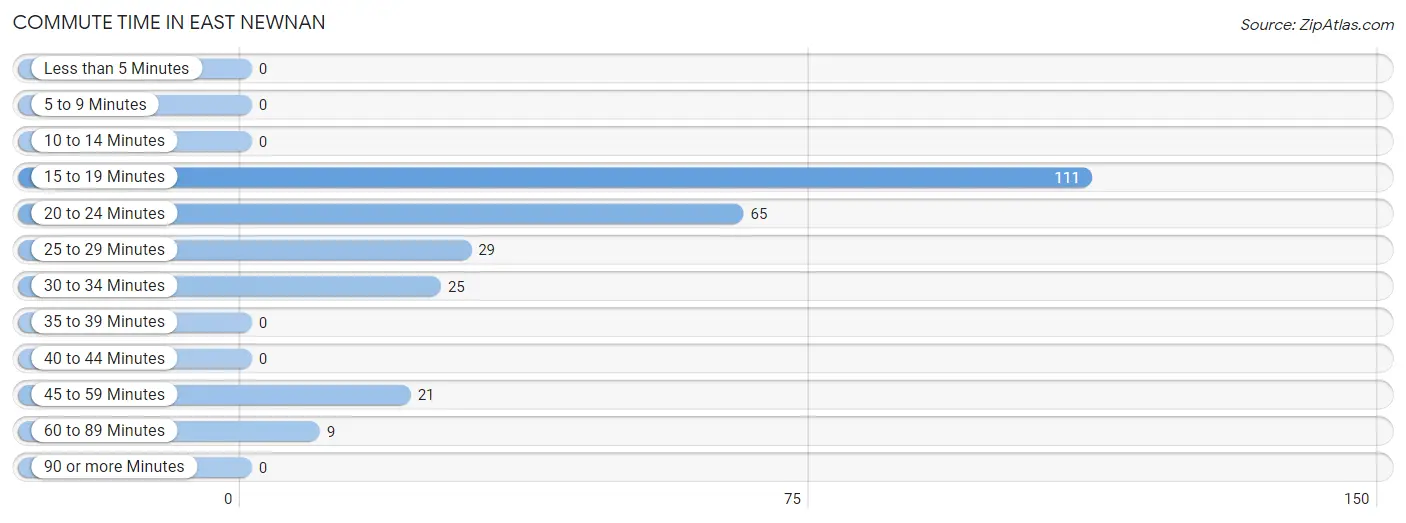
| Commute Time | # Commuters | % Commuters |
| Less than 5 Minutes | 0 | 0.0% |
| 5 to 9 Minutes | 0 | 0.0% |
| 10 to 14 Minutes | 0 | 0.0% |
| 15 to 19 Minutes | 111 | 42.7% |
| 20 to 24 Minutes | 65 | 25.0% |
| 25 to 29 Minutes | 29 | 11.2% |
| 30 to 34 Minutes | 25 | 9.6% |
| 35 to 39 Minutes | 0 | 0.0% |
| 40 to 44 Minutes | 0 | 0.0% |
| 45 to 59 Minutes | 21 | 8.1% |
| 60 to 89 Minutes | 9 | 3.5% |
| 90 or more Minutes | 0 | 0.0% |
Commute Time by Sex in East Newnan
The most common commute times in East Newnan are 25 to 29 minutes (29 commuters, 37.7%) for males and 15 to 19 minutes (111 commuters, 60.7%) for females.
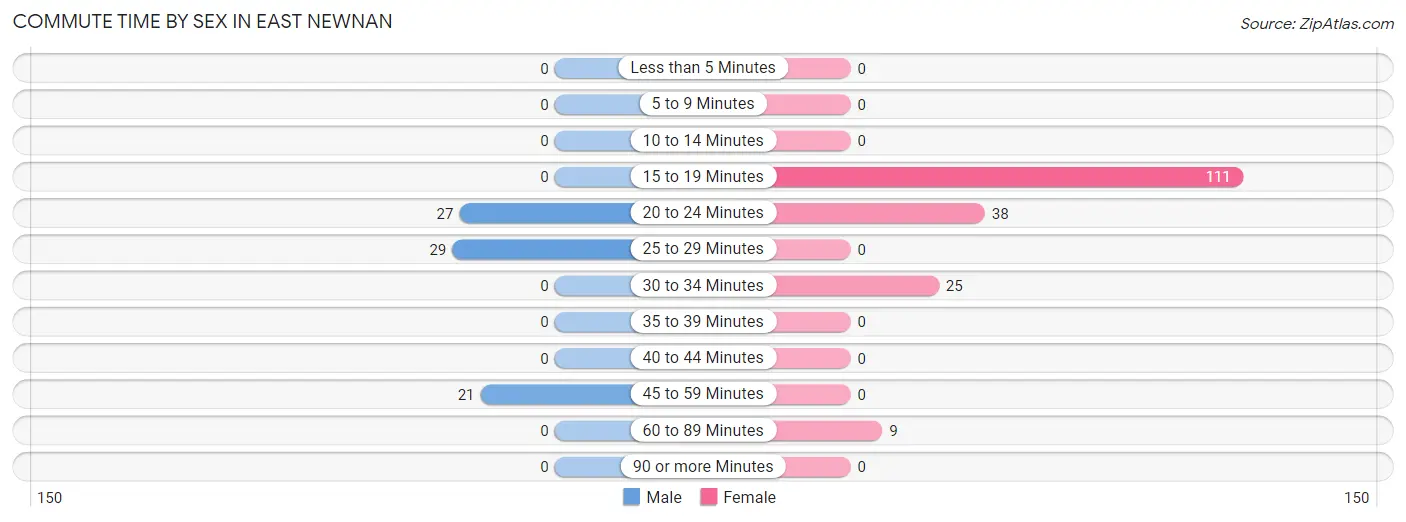
| Commute Time | Male | Female |
| Less than 5 Minutes | 0 (0.0%) | 0 (0.0%) |
| 5 to 9 Minutes | 0 (0.0%) | 0 (0.0%) |
| 10 to 14 Minutes | 0 (0.0%) | 0 (0.0%) |
| 15 to 19 Minutes | 0 (0.0%) | 111 (60.7%) |
| 20 to 24 Minutes | 27 (35.1%) | 38 (20.8%) |
| 25 to 29 Minutes | 29 (37.7%) | 0 (0.0%) |
| 30 to 34 Minutes | 0 (0.0%) | 25 (13.7%) |
| 35 to 39 Minutes | 0 (0.0%) | 0 (0.0%) |
| 40 to 44 Minutes | 0 (0.0%) | 0 (0.0%) |
| 45 to 59 Minutes | 21 (27.3%) | 0 (0.0%) |
| 60 to 89 Minutes | 0 (0.0%) | 9 (4.9%) |
| 90 or more Minutes | 0 (0.0%) | 0 (0.0%) |
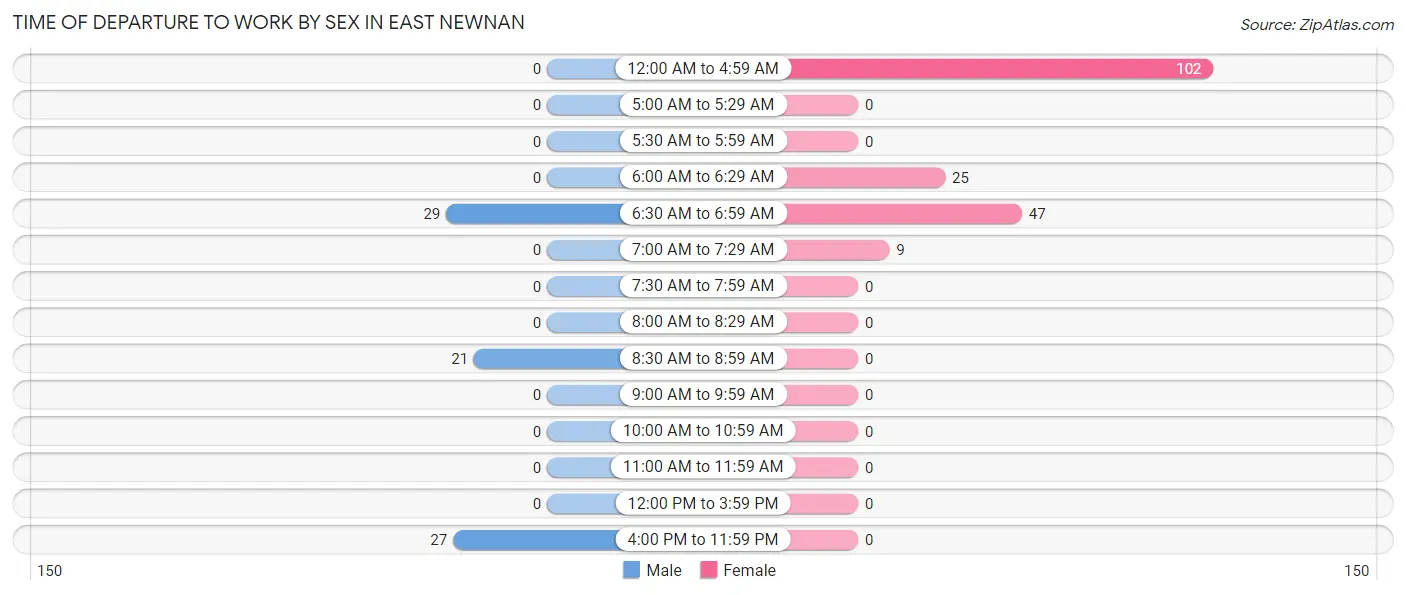
Time of Departure to Work by Sex in East Newnan
The most frequent times of departure to work in East Newnan are 6:30 AM to 6:59 AM (29, 37.7%) for males and 12:00 AM to 4:59 AM (102, 55.7%) for females.
| Time of Departure | Male | Female |
| 12:00 AM to 4:59 AM | 0 (0.0%) | 102 (55.7%) |
| 5:00 AM to 5:29 AM | 0 (0.0%) | 0 (0.0%) |
| 5:30 AM to 5:59 AM | 0 (0.0%) | 0 (0.0%) |
| 6:00 AM to 6:29 AM | 0 (0.0%) | 25 (13.7%) |
| 6:30 AM to 6:59 AM | 29 (37.7%) | 47 (25.7%) |
| 7:00 AM to 7:29 AM | 0 (0.0%) | 9 (4.9%) |
| 7:30 AM to 7:59 AM | 0 (0.0%) | 0 (0.0%) |
| 8:00 AM to 8:29 AM | 0 (0.0%) | 0 (0.0%) |
| 8:30 AM to 8:59 AM | 21 (27.3%) | 0 (0.0%) |
| 9:00 AM to 9:59 AM | 0 (0.0%) | 0 (0.0%) |
| 10:00 AM to 10:59 AM | 0 (0.0%) | 0 (0.0%) |
| 11:00 AM to 11:59 AM | 0 (0.0%) | 0 (0.0%) |
| 12:00 PM to 3:59 PM | 0 (0.0%) | 0 (0.0%) |
| 4:00 PM to 11:59 PM | 27 (35.1%) | 0 (0.0%) |
| Total | 77 (100.0%) | 183 (100.0%) |
Housing Occupancy in East Newnan
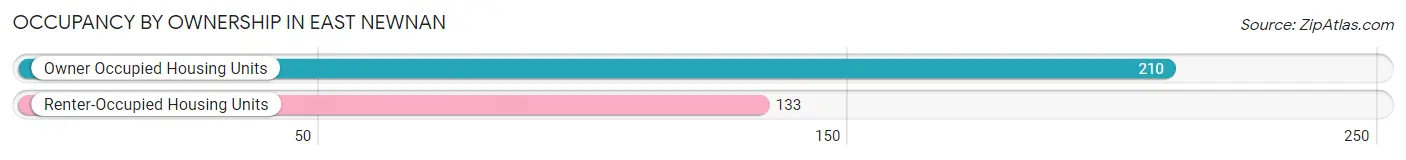
Occupancy by Ownership in East Newnan
Of the total 343 dwellings in East Newnan, owner-occupied units account for 210 (61.2%), while renter-occupied units make up 133 (38.8%).
| Occupancy | # Housing Units | % Housing Units |
| Owner Occupied Housing Units | 210 | 61.2% |
| Renter-Occupied Housing Units | 133 | 38.8% |
| Total Occupied Housing Units | 343 | 100.0% |
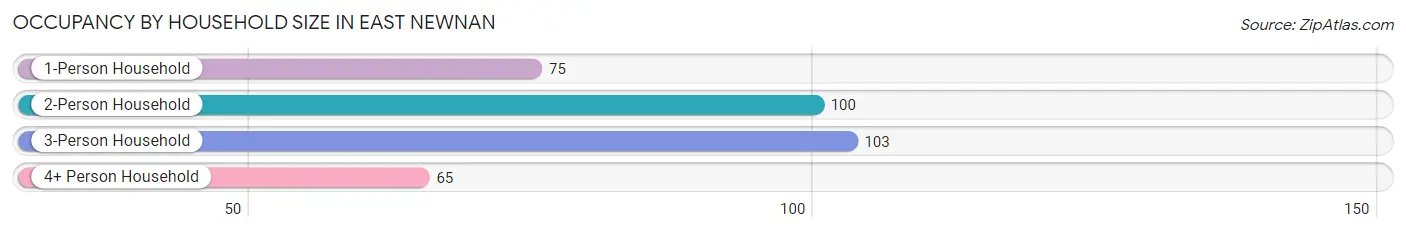
Occupancy by Household Size in East Newnan
| Household Size | # Housing Units | % Housing Units |
| 1-Person Household | 75 | 21.9% |
| 2-Person Household | 100 | 29.1% |
| 3-Person Household | 103 | 30.0% |
| 4+ Person Household | 65 | 19.0% |
| Total Housing Units | 343 | 100.0% |
Occupancy by Ownership by Household Size in East Newnan
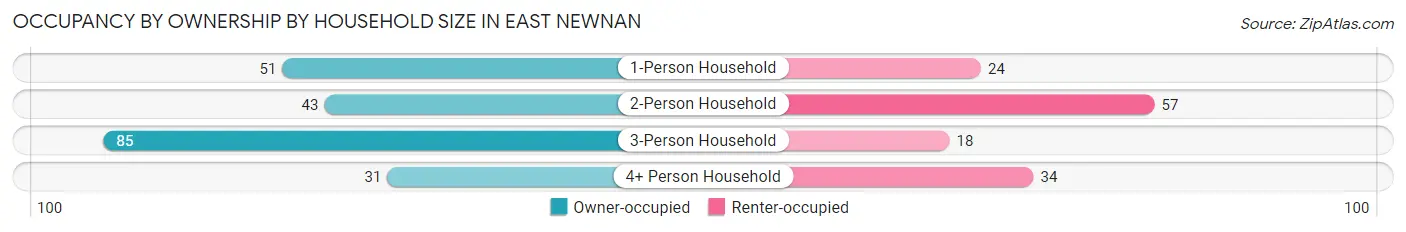
| Household Size | Owner-occupied | Renter-occupied |
| 1-Person Household | 51 (68.0%) | 24 (32.0%) |
| 2-Person Household | 43 (43.0%) | 57 (57.0%) |
| 3-Person Household | 85 (82.5%) | 18 (17.5%) |
| 4+ Person Household | 31 (47.7%) | 34 (52.3%) |
| Total Housing Units | 210 (61.2%) | 133 (38.8%) |
Occupancy by Educational Attainment in East Newnan
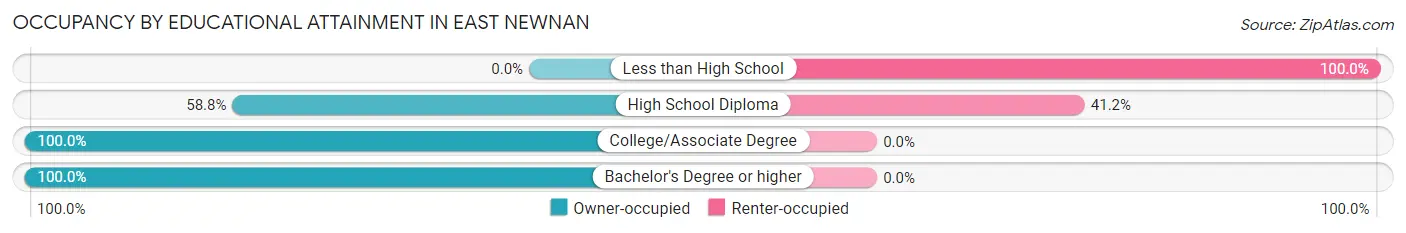
| Household Size | Owner-occupied | Renter-occupied |
| Less than High School | 0 (0.0%) | 91 (100.0%) |
| High School Diploma | 60 (58.8%) | 42 (41.2%) |
| College/Associate Degree | 86 (100.0%) | 0 (0.0%) |
| Bachelor's Degree or higher | 64 (100.0%) | 0 (0.0%) |
Occupancy by Age of Householder in East Newnan
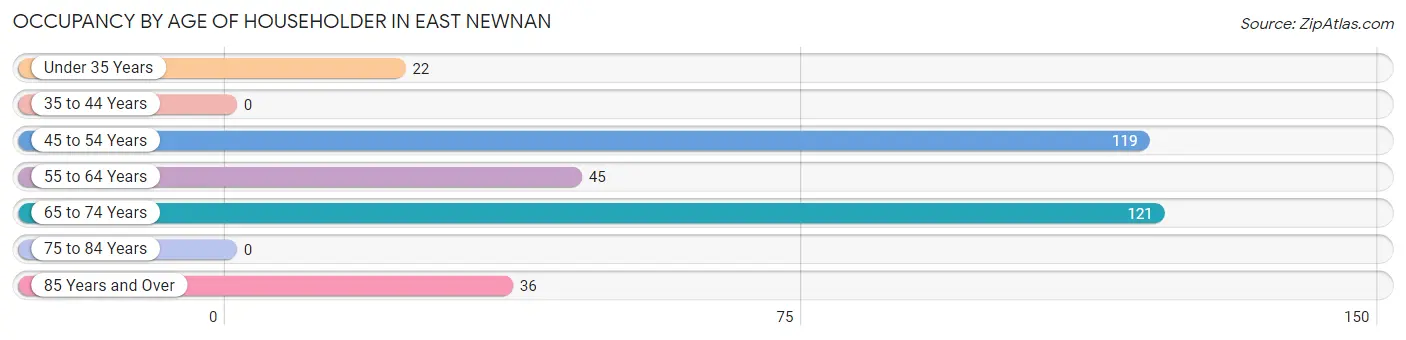
| Age Bracket | # Households | % Households |
| Under 35 Years | 22 | 6.4% |
| 35 to 44 Years | 0 | 0.0% |
| 45 to 54 Years | 119 | 34.7% |
| 55 to 64 Years | 45 | 13.1% |
| 65 to 74 Years | 121 | 35.3% |
| 75 to 84 Years | 0 | 0.0% |
| 85 Years and Over | 36 | 10.5% |
| Total | 343 | 100.0% |
Housing Finances in East Newnan
Median Income by Occupancy in East Newnan
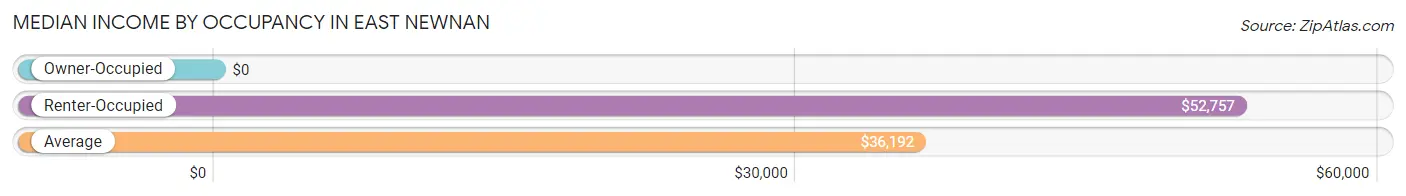
| Occupancy Type | # Households | Median Income |
| Owner-Occupied | 210 (61.2%) | $0 |
| Renter-Occupied | 133 (38.8%) | $52,757 |
| Average | 343 (100.0%) | $36,192 |
Occupancy by Householder Income Bracket in East Newnan
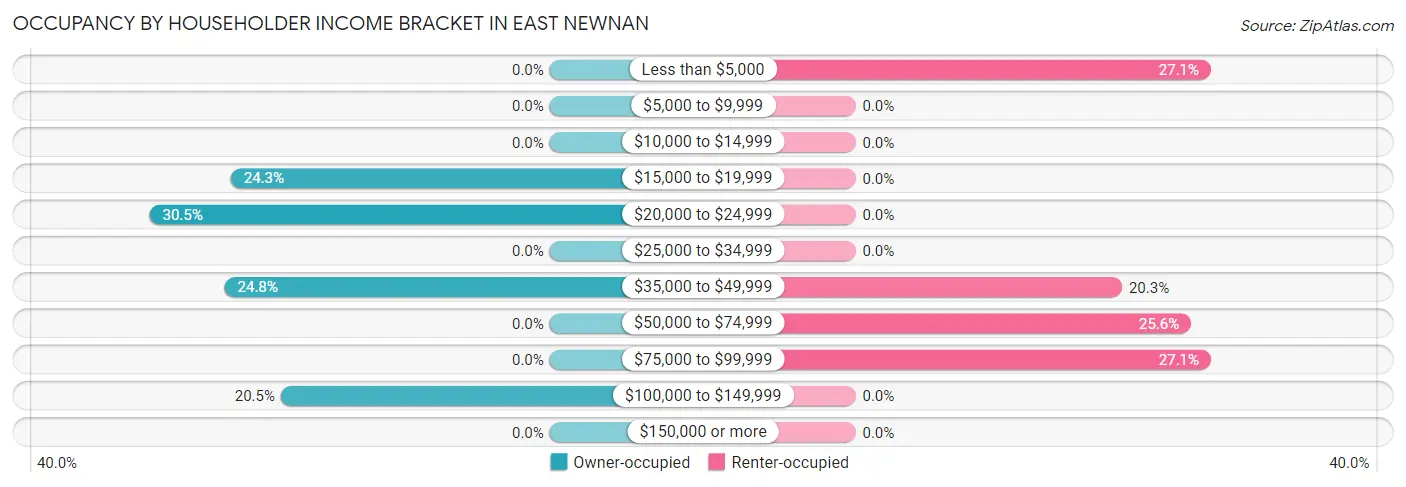
| Income Bracket | Owner-occupied | Renter-occupied |
| Less than $5,000 | 0 (0.0%) | 36 (27.1%) |
| $5,000 to $9,999 | 0 (0.0%) | 0 (0.0%) |
| $10,000 to $14,999 | 0 (0.0%) | 0 (0.0%) |
| $15,000 to $19,999 | 51 (24.3%) | 0 (0.0%) |
| $20,000 to $24,999 | 64 (30.5%) | 0 (0.0%) |
| $25,000 to $34,999 | 0 (0.0%) | 0 (0.0%) |
| $35,000 to $49,999 | 52 (24.8%) | 27 (20.3%) |
| $50,000 to $74,999 | 0 (0.0%) | 34 (25.6%) |
| $75,000 to $99,999 | 0 (0.0%) | 36 (27.1%) |
| $100,000 to $149,999 | 43 (20.5%) | 0 (0.0%) |
| $150,000 or more | 0 (0.0%) | 0 (0.0%) |
| Total | 210 (100.0%) | 133 (100.0%) |
Monthly Housing Cost Tiers in East Newnan
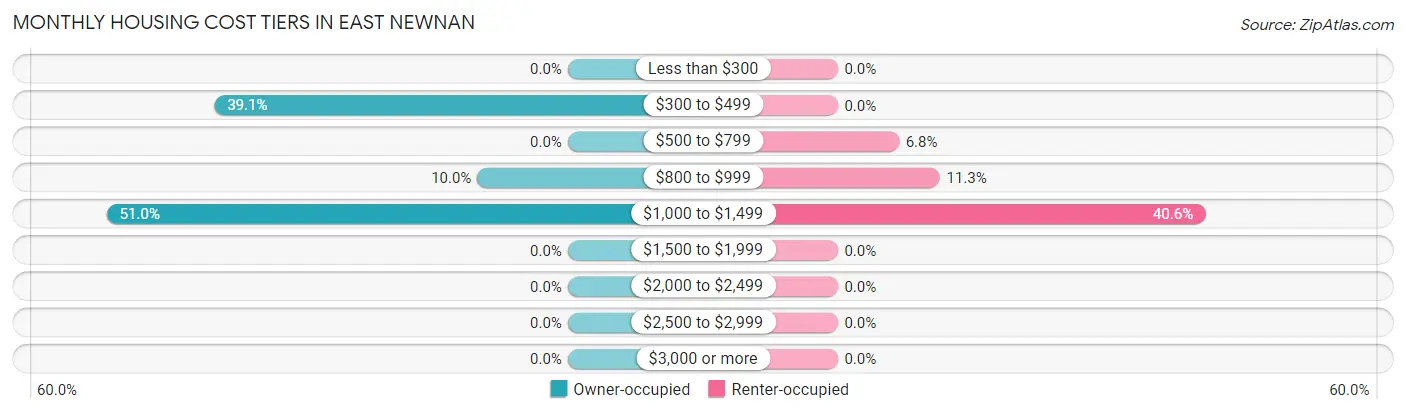
| Monthly Cost | Owner-occupied | Renter-occupied |
| Less than $300 | 0 (0.0%) | 0 (0.0%) |
| $300 to $499 | 82 (39.1%) | 0 (0.0%) |
| $500 to $799 | 0 (0.0%) | 9 (6.8%) |
| $800 to $999 | 21 (10.0%) | 15 (11.3%) |
| $1,000 to $1,499 | 107 (50.9%) | 54 (40.6%) |
| $1,500 to $1,999 | 0 (0.0%) | 0 (0.0%) |
| $2,000 to $2,499 | 0 (0.0%) | 0 (0.0%) |
| $2,500 to $2,999 | 0 (0.0%) | 0 (0.0%) |
| $3,000 or more | 0 (0.0%) | 0 (0.0%) |
| Total | 210 (100.0%) | 133 (100.0%) |
Physical Housing Characteristics in East Newnan
Housing Structures in East Newnan
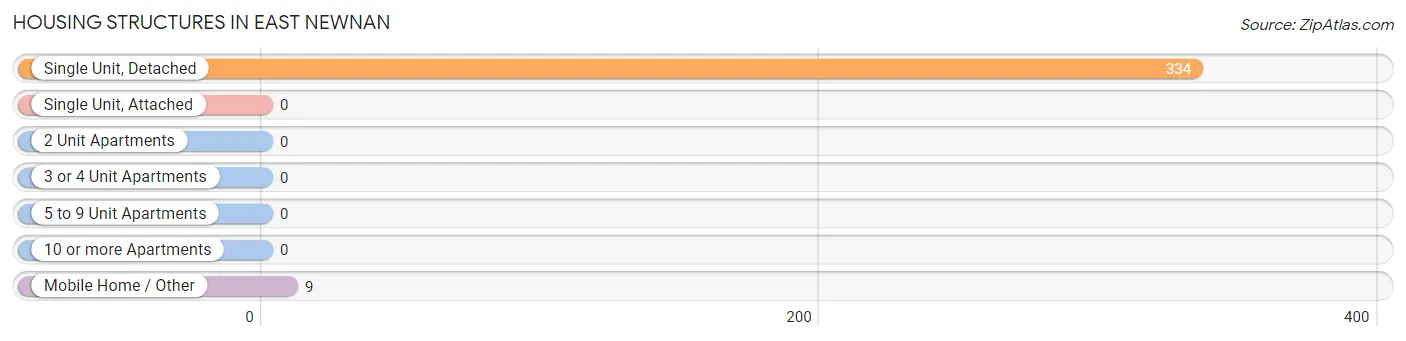
| Structure Type | # Housing Units | % Housing Units |
| Single Unit, Detached | 334 | 97.4% |
| Single Unit, Attached | 0 | 0.0% |
| 2 Unit Apartments | 0 | 0.0% |
| 3 or 4 Unit Apartments | 0 | 0.0% |
| 5 to 9 Unit Apartments | 0 | 0.0% |
| 10 or more Apartments | 0 | 0.0% |
| Mobile Home / Other | 9 | 2.6% |
| Total | 343 | 100.0% |
Housing Structures by Occupancy in East Newnan
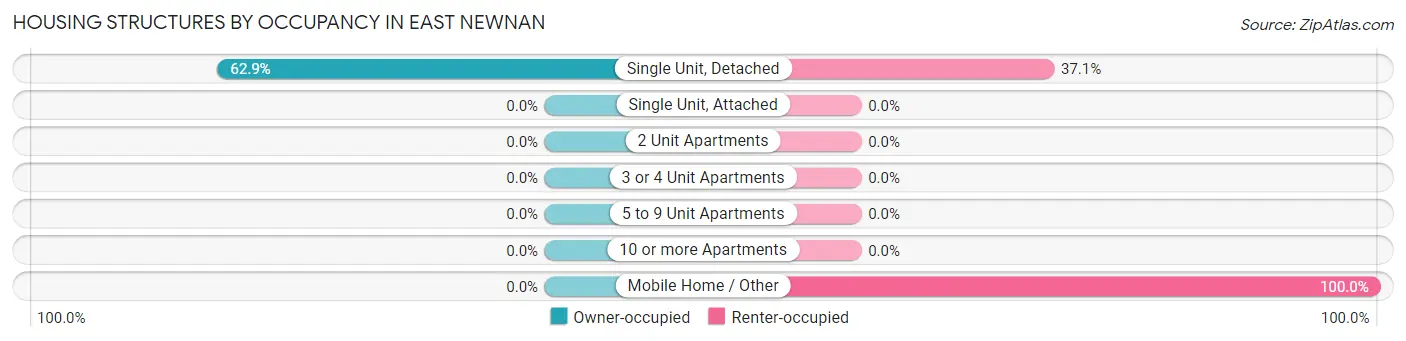
| Structure Type | Owner-occupied | Renter-occupied |
| Single Unit, Detached | 210 (62.9%) | 124 (37.1%) |
| Single Unit, Attached | 0 (0.0%) | 0 (0.0%) |
| 2 Unit Apartments | 0 (0.0%) | 0 (0.0%) |
| 3 or 4 Unit Apartments | 0 (0.0%) | 0 (0.0%) |
| 5 to 9 Unit Apartments | 0 (0.0%) | 0 (0.0%) |
| 10 or more Apartments | 0 (0.0%) | 0 (0.0%) |
| Mobile Home / Other | 0 (0.0%) | 9 (100.0%) |
| Total | 210 (61.2%) | 133 (38.8%) |
Housing Structures by Number of Rooms in East Newnan
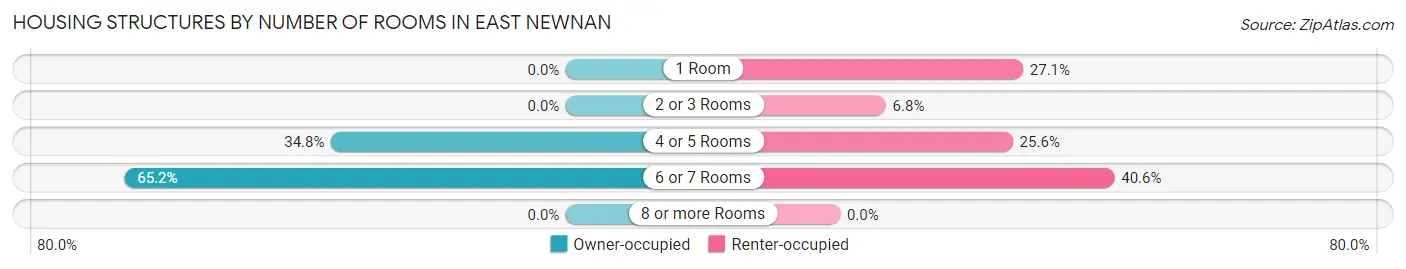
| Number of Rooms | Owner-occupied | Renter-occupied |
| 1 Room | 0 (0.0%) | 36 (27.1%) |
| 2 or 3 Rooms | 0 (0.0%) | 9 (6.8%) |
| 4 or 5 Rooms | 73 (34.8%) | 34 (25.6%) |
| 6 or 7 Rooms | 137 (65.2%) | 54 (40.6%) |
| 8 or more Rooms | 0 (0.0%) | 0 (0.0%) |
| Total | 210 (100.0%) | 133 (100.0%) |
Housing Structure by Heating Type in East Newnan
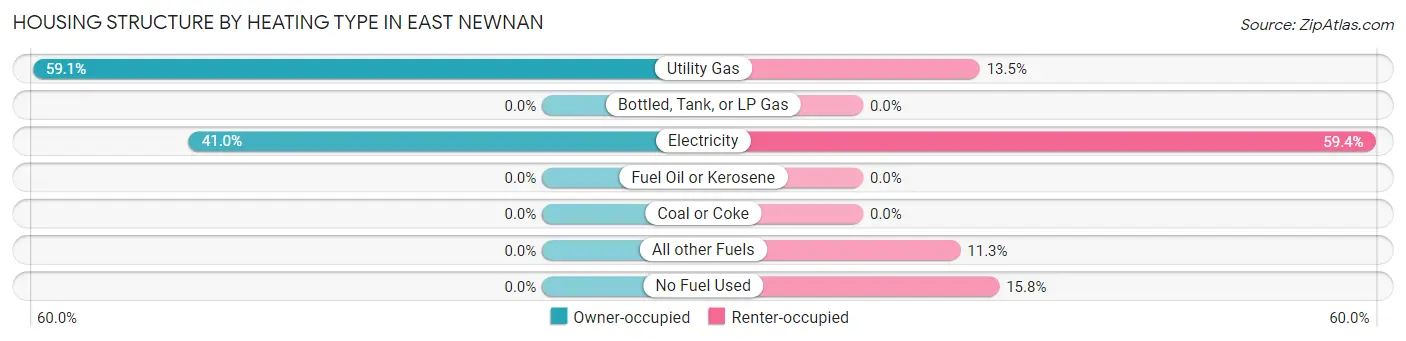
| Heating Type | Owner-occupied | Renter-occupied |
| Utility Gas | 124 (59.1%) | 18 (13.5%) |
| Bottled, Tank, or LP Gas | 0 (0.0%) | 0 (0.0%) |
| Electricity | 86 (40.9%) | 79 (59.4%) |
| Fuel Oil or Kerosene | 0 (0.0%) | 0 (0.0%) |
| Coal or Coke | 0 (0.0%) | 0 (0.0%) |
| All other Fuels | 0 (0.0%) | 15 (11.3%) |
| No Fuel Used | 0 (0.0%) | 21 (15.8%) |
| Total | 210 (100.0%) | 133 (100.0%) |
Household Vehicle Usage in East Newnan
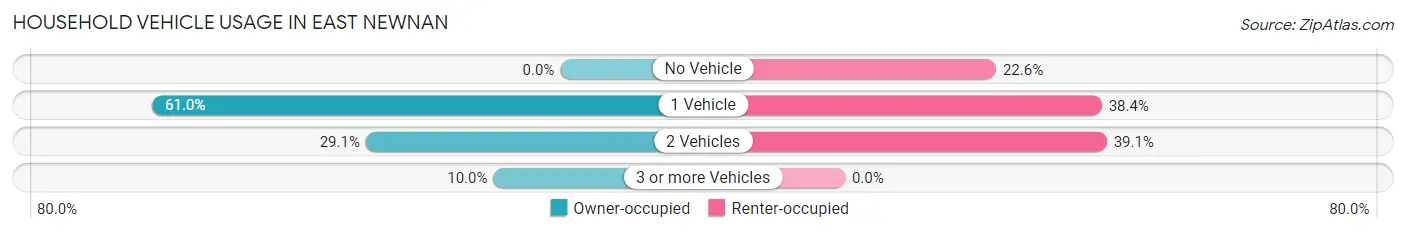
| Vehicles per Household | Owner-occupied | Renter-occupied |
| No Vehicle | 0 (0.0%) | 30 (22.6%) |
| 1 Vehicle | 128 (61.0%) | 51 (38.4%) |
| 2 Vehicles | 61 (29.0%) | 52 (39.1%) |
| 3 or more Vehicles | 21 (10.0%) | 0 (0.0%) |
| Total | 210 (100.0%) | 133 (100.0%) |
Real Estate & Mortgages in East Newnan
Real Estate and Mortgage Overview in East Newnan
| Characteristic | Without Mortgage | With Mortgage |
| Housing Units | 82 | 128 |
| Median Property Value | $106,400 | $0 |
| Median Household Income | $35,640 | $0 |
| Monthly Housing Costs | $348 | $0 |
| Real Estate Taxes | - | - |
Property Value by Mortgage Status in East Newnan
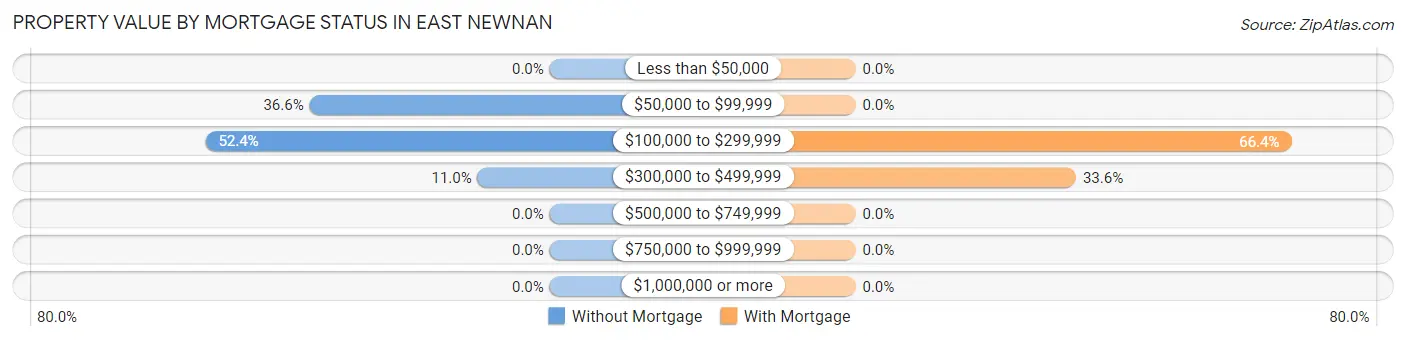
| Property Value | Without Mortgage | With Mortgage |
| Less than $50,000 | 0 (0.0%) | 0 (0.0%) |
| $50,000 to $99,999 | 30 (36.6%) | 0 (0.0%) |
| $100,000 to $299,999 | 43 (52.4%) | 85 (66.4%) |
| $300,000 to $499,999 | 9 (11.0%) | 43 (33.6%) |
| $500,000 to $749,999 | 0 (0.0%) | 0 (0.0%) |
| $750,000 to $999,999 | 0 (0.0%) | 0 (0.0%) |
| $1,000,000 or more | 0 (0.0%) | 0 (0.0%) |
| Total | 82 (100.0%) | 128 (100.0%) |
Household Income by Mortgage Status in East Newnan
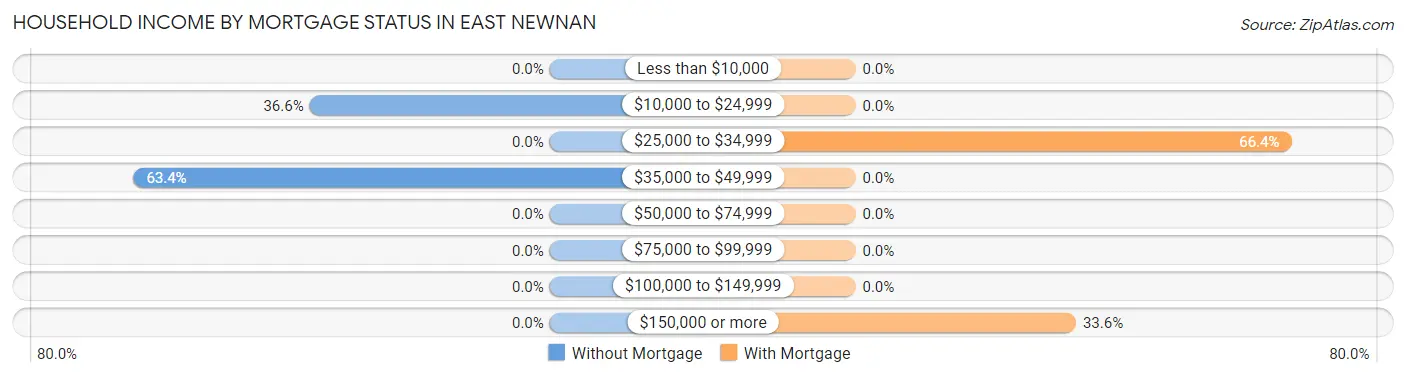
| Household Income | Without Mortgage | With Mortgage |
| Less than $10,000 | 0 (0.0%) | 0 (0.0%) |
| $10,000 to $24,999 | 30 (36.6%) | 0 (0.0%) |
| $25,000 to $34,999 | 0 (0.0%) | 85 (66.4%) |
| $35,000 to $49,999 | 52 (63.4%) | 0 (0.0%) |
| $50,000 to $74,999 | 0 (0.0%) | 0 (0.0%) |
| $75,000 to $99,999 | 0 (0.0%) | 0 (0.0%) |
| $100,000 to $149,999 | 0 (0.0%) | 0 (0.0%) |
| $150,000 or more | 0 (0.0%) | 43 (33.6%) |
| Total | 82 (100.0%) | 128 (100.0%) |
Property Value to Household Income Ratio in East Newnan
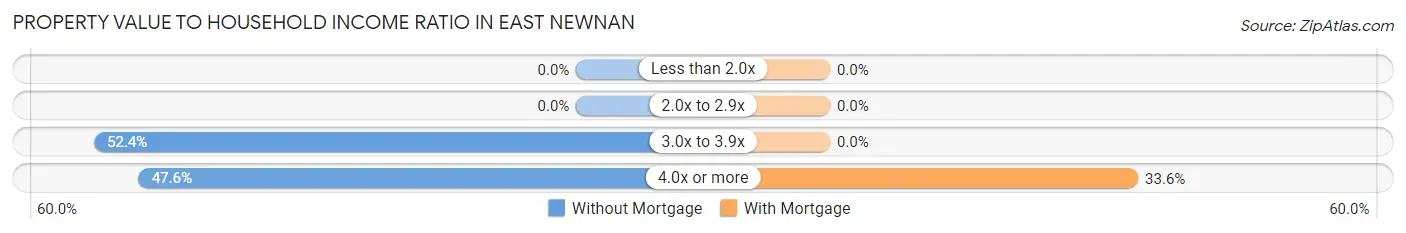
| Value-to-Income Ratio | Without Mortgage | With Mortgage |
| Less than 2.0x | 0 (0.0%) | 0 (0.0%) |
| 2.0x to 2.9x | 0 (0.0%) | 0 (0.0%) |
| 3.0x to 3.9x | 43 (52.4%) | 0 (0.0%) |
| 4.0x or more | 39 (47.6%) | 43 (33.6%) |
| Total | 82 (100.0%) | 128 (100.0%) |
Real Estate Taxes by Mortgage Status in East Newnan
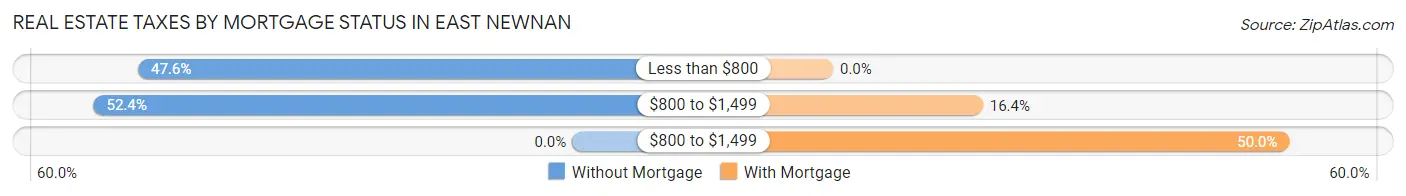
| Property Taxes | Without Mortgage | With Mortgage |
| Less than $800 | 39 (47.6%) | 0 (0.0%) |
| $800 to $1,499 | 43 (52.4%) | 21 (16.4%) |
| $800 to $1,499 | 0 (0.0%) | 64 (50.0%) |
| Total | 82 (100.0%) | 128 (100.0%) |
Health & Disability in East Newnan
Health Insurance Coverage by Age in East Newnan
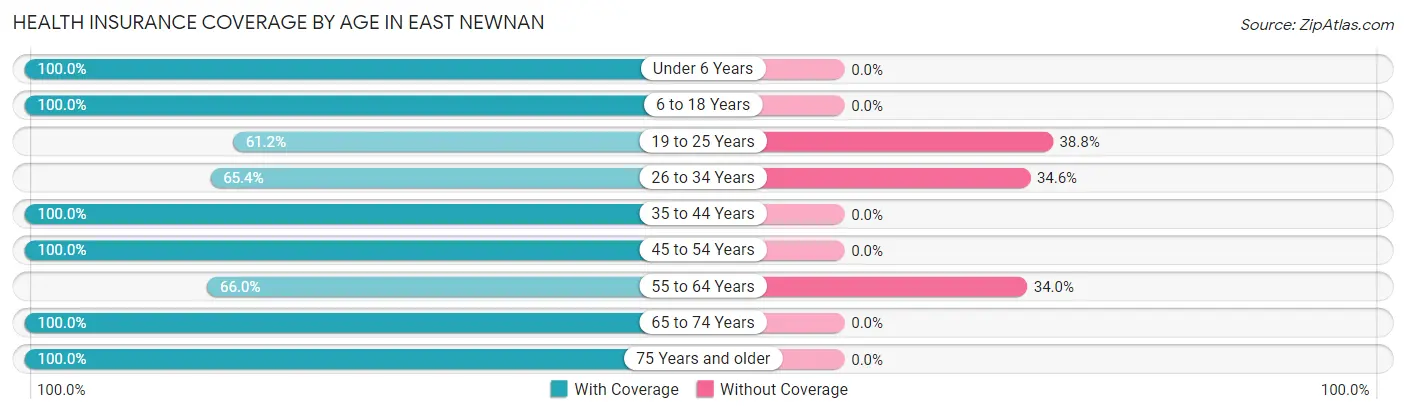
| Age Bracket | With Coverage | Without Coverage |
| Under 6 Years | 31 (100.0%) | 0 (0.0%) |
| 6 to 18 Years | 57 (100.0%) | 0 (0.0%) |
| 19 to 25 Years | 145 (61.2%) | 92 (38.8%) |
| 26 to 34 Years | 51 (65.4%) | 27 (34.6%) |
| 35 to 44 Years | 24 (100.0%) | 0 (0.0%) |
| 45 to 54 Years | 172 (100.0%) | 0 (0.0%) |
| 55 to 64 Years | 95 (66.0%) | 49 (34.0%) |
| 65 to 74 Years | 138 (100.0%) | 0 (0.0%) |
| 75 Years and older | 36 (100.0%) | 0 (0.0%) |
| Total | 749 (81.7%) | 168 (18.3%) |
Health Insurance Coverage by Citizenship Status in East Newnan
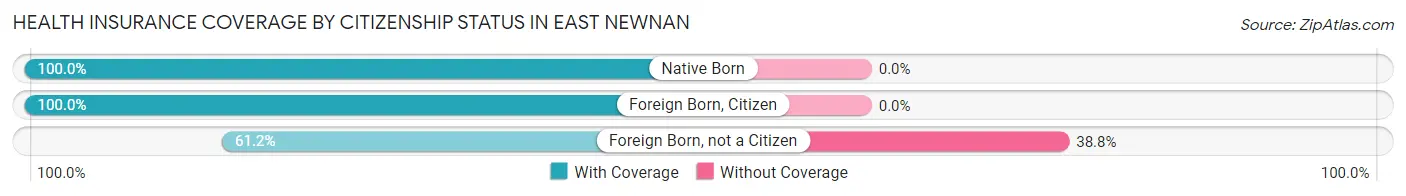
| Citizenship Status | With Coverage | Without Coverage |
| Native Born | 31 (100.0%) | 0 (0.0%) |
| Foreign Born, Citizen | 57 (100.0%) | 0 (0.0%) |
| Foreign Born, not a Citizen | 145 (61.2%) | 92 (38.8%) |
Health Insurance Coverage by Household Income in East Newnan
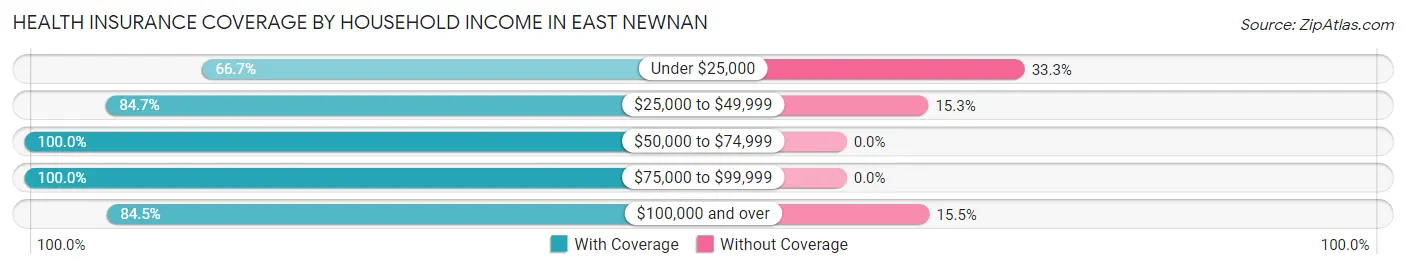
| Household Income | With Coverage | Without Coverage |
| Under $25,000 | 222 (66.7%) | 111 (33.3%) |
| $25,000 to $49,999 | 166 (84.7%) | 30 (15.3%) |
| $50,000 to $74,999 | 131 (100.0%) | 0 (0.0%) |
| $75,000 to $99,999 | 83 (100.0%) | 0 (0.0%) |
| $100,000 and over | 147 (84.5%) | 27 (15.5%) |
Public vs Private Health Insurance Coverage by Age in East Newnan
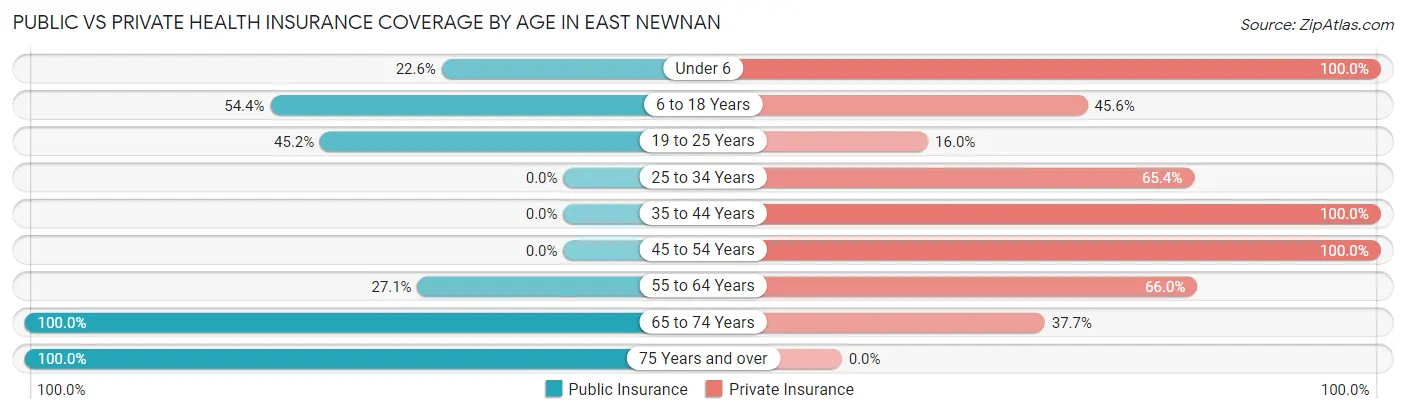
| Age Bracket | Public Insurance | Private Insurance |
| Under 6 | 7 (22.6%) | 31 (100.0%) |
| 6 to 18 Years | 31 (54.4%) | 26 (45.6%) |
| 19 to 25 Years | 107 (45.2%) | 38 (16.0%) |
| 25 to 34 Years | 0 (0.0%) | 51 (65.4%) |
| 35 to 44 Years | 0 (0.0%) | 24 (100.0%) |
| 45 to 54 Years | 0 (0.0%) | 172 (100.0%) |
| 55 to 64 Years | 39 (27.1%) | 95 (66.0%) |
| 65 to 74 Years | 138 (100.0%) | 52 (37.7%) |
| 75 Years and over | 36 (100.0%) | 0 (0.0%) |
| Total | 358 (39.0%) | 489 (53.3%) |
Disability Status by Sex by Age in East Newnan
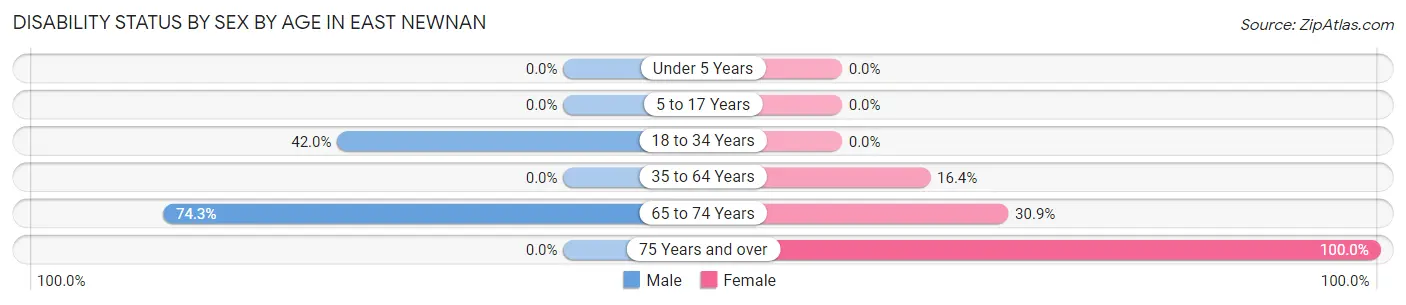
| Age Bracket | Male | Female |
| Under 5 Years | 0 (0.0%) | 0 (0.0%) |
| 5 to 17 Years | 0 (0.0%) | 0 (0.0%) |
| 18 to 34 Years | 107 (42.0%) | 0 (0.0%) |
| 35 to 64 Years | 0 (0.0%) | 39 (16.4%) |
| 65 to 74 Years | 52 (74.3%) | 21 (30.9%) |
| 75 Years and over | 0 (0.0%) | 36 (100.0%) |
Disability Class by Sex by Age in East Newnan
Disability Class: Hearing Difficulty
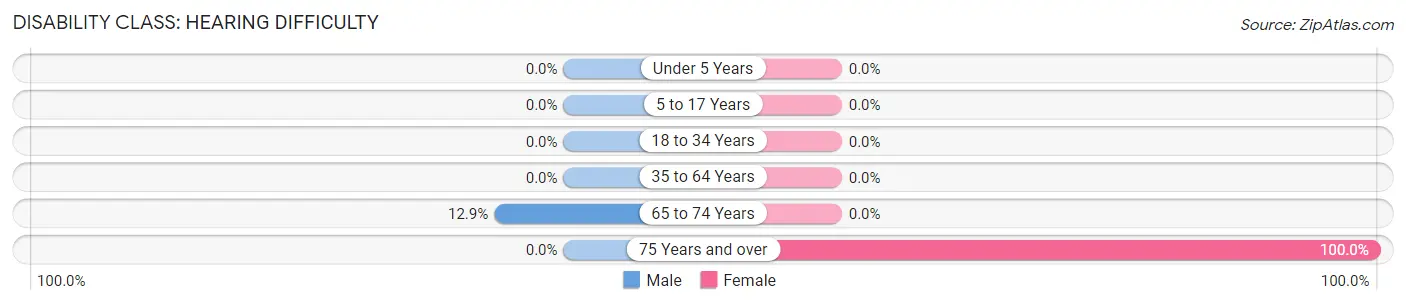
| Age Bracket | Male | Female |
| Under 5 Years | 0 (0.0%) | 0 (0.0%) |
| 5 to 17 Years | 0 (0.0%) | 0 (0.0%) |
| 18 to 34 Years | 0 (0.0%) | 0 (0.0%) |
| 35 to 64 Years | 0 (0.0%) | 0 (0.0%) |
| 65 to 74 Years | 9 (12.9%) | 0 (0.0%) |
| 75 Years and over | 0 (0.0%) | 36 (100.0%) |
Disability Class: Vision Difficulty
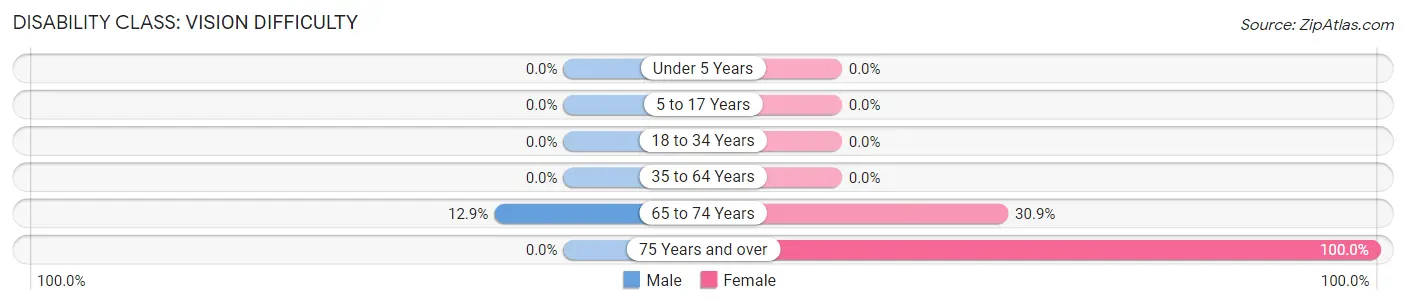
| Age Bracket | Male | Female |
| Under 5 Years | 0 (0.0%) | 0 (0.0%) |
| 5 to 17 Years | 0 (0.0%) | 0 (0.0%) |
| 18 to 34 Years | 0 (0.0%) | 0 (0.0%) |
| 35 to 64 Years | 0 (0.0%) | 0 (0.0%) |
| 65 to 74 Years | 9 (12.9%) | 21 (30.9%) |
| 75 Years and over | 0 (0.0%) | 36 (100.0%) |
Disability Class: Cognitive Difficulty
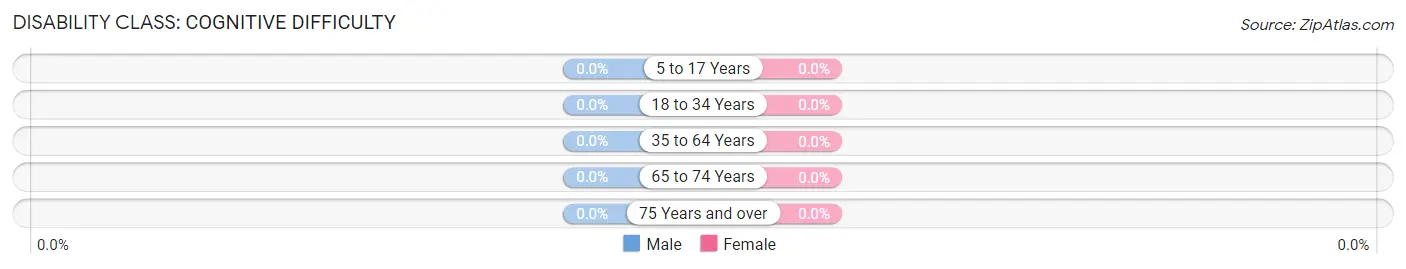
| Age Bracket | Male | Female |
| 5 to 17 Years | 0 (0.0%) | 0 (0.0%) |
| 18 to 34 Years | 0 (0.0%) | 0 (0.0%) |
| 35 to 64 Years | 0 (0.0%) | 0 (0.0%) |
| 65 to 74 Years | 0 (0.0%) | 0 (0.0%) |
| 75 Years and over | 0 (0.0%) | 0 (0.0%) |
Disability Class: Ambulatory Difficulty
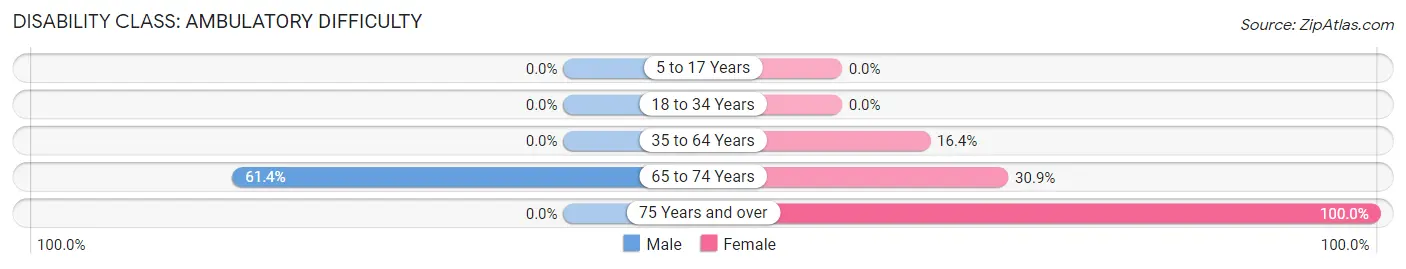
| Age Bracket | Male | Female |
| 5 to 17 Years | 0 (0.0%) | 0 (0.0%) |
| 18 to 34 Years | 0 (0.0%) | 0 (0.0%) |
| 35 to 64 Years | 0 (0.0%) | 39 (16.4%) |
| 65 to 74 Years | 43 (61.4%) | 21 (30.9%) |
| 75 Years and over | 0 (0.0%) | 36 (100.0%) |
Disability Class: Self-Care Difficulty
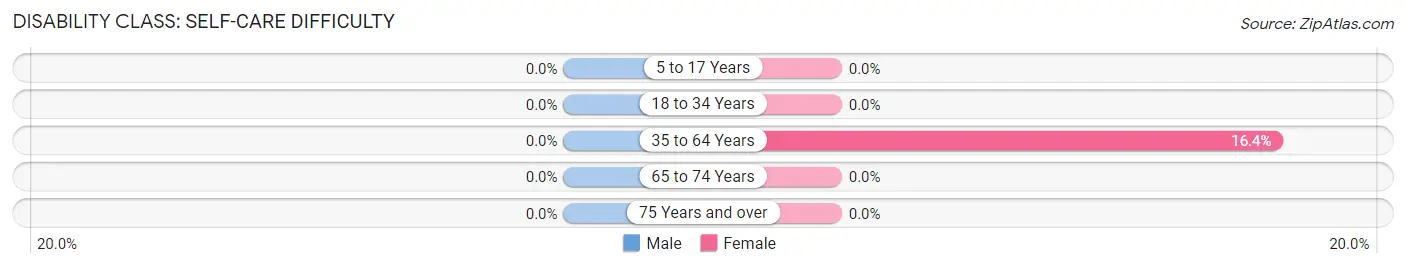
| Age Bracket | Male | Female |
| 5 to 17 Years | 0 (0.0%) | 0 (0.0%) |
| 18 to 34 Years | 0 (0.0%) | 0 (0.0%) |
| 35 to 64 Years | 0 (0.0%) | 39 (16.4%) |
| 65 to 74 Years | 0 (0.0%) | 0 (0.0%) |
| 75 Years and over | 0 (0.0%) | 0 (0.0%) |
Technology Access in East Newnan
Computing Device Access in East Newnan
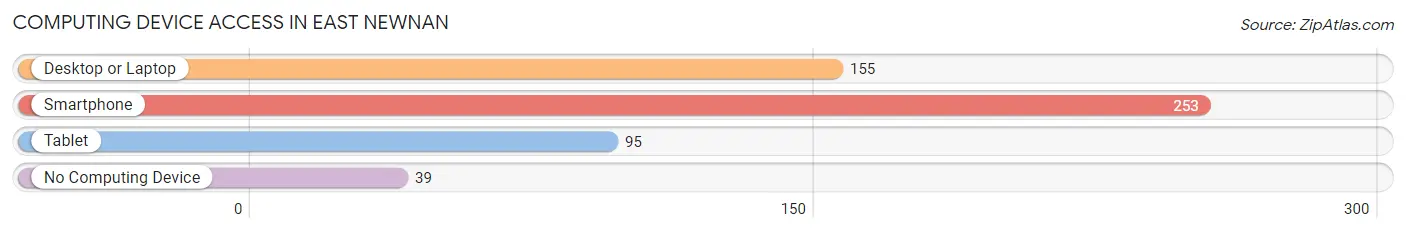
| Device Type | # Households | % Households |
| Desktop or Laptop | 155 | 45.2% |
| Smartphone | 253 | 73.8% |
| Tablet | 95 | 27.7% |
| No Computing Device | 39 | 11.4% |
| Total | 343 | 100.0% |
Internet Access in East Newnan
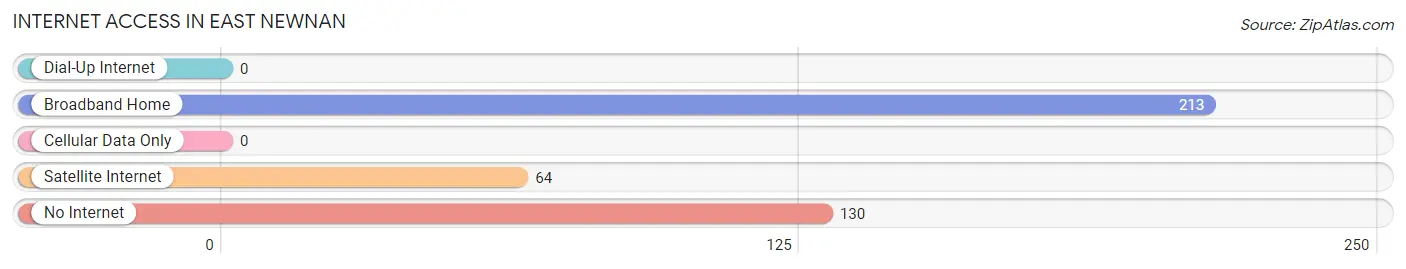
| Internet Type | # Households | % Households |
| Dial-Up Internet | 0 | 0.0% |
| Broadband Home | 213 | 62.1% |
| Cellular Data Only | 0 | 0.0% |
| Satellite Internet | 64 | 18.7% |
| No Internet | 130 | 37.9% |
| Total | 343 | 100.0% |
East Newnan Summary
East Newnan is a small city located in Coweta County, Georgia, United States. It is part of the Atlanta metropolitan area and is located approximately 30 miles southwest of downtown Atlanta. The population of East Newnan was estimated to be 8,845 in 2019.
History
East Newnan was founded in 1828 by a group of settlers from Newnan, Georgia. The town was originally known as "Newnan East" and was located on the east side of the Chattahoochee River. The town was incorporated in 1854 and was renamed East Newnan.
East Newnan was a major center of the cotton industry in the 19th century. The town was home to several cotton mills, including the East Newnan Cotton Mill, which was established in 1872. The mill was one of the largest in the state and employed hundreds of workers.
In the early 20th century, East Newnan experienced a period of growth and development. The town was home to several businesses, including a bank, a hotel, a movie theater, and a variety of stores.
Geography
East Newnan is located in the foothills of the Appalachian Mountains in the Piedmont region of Georgia. The city is situated on the east side of the Chattahoochee River, which forms the border between Georgia and Alabama. The city is located approximately 30 miles southwest of downtown Atlanta.
The city has a total area of 4.3 square miles, all of which is land. The city is located at an elevation of 845 feet above sea level.
Economy
East Newnan's economy is largely based on manufacturing and retail. The city is home to several manufacturing companies, including a paper mill, a plastics factory, and a metal fabrication plant. The city is also home to several retail stores, including a Walmart Supercenter, a Home Depot, and a variety of other stores.
The city is also home to several medical facilities, including a hospital, a nursing home, and a variety of medical offices.
Demographics
As of the 2019 census, the population of East Newnan was estimated to be 8,845. The racial makeup of the city was 79.3% White, 15.2% African American, 0.7% Asian, 0.2% Native American, and 4.6% from other races. The median household income was $45,945 and the median family income was $54,945.
The city has a large Hispanic population, with approximately 15.2% of the population identifying as Hispanic or Latino. The city also has a large number of foreign-born residents, with approximately 8.3% of the population born outside of the United States.
Conclusion
East Newnan is a small city located in Coweta County, Georgia, United States. It is part of the Atlanta metropolitan area and is located approximately 30 miles southwest of downtown Atlanta. The population of East Newnan was estimated to be 8,845 in 2019. The city has a diverse economy, with a focus on manufacturing and retail. The city also has a large Hispanic population, with approximately 15.2% of the population identifying as Hispanic or Latino. East Newnan is a vibrant city with a rich history and a bright future.
Common Questions
What is the Total Population of East Newnan?
Total Population of East Newnan is 917.
What is the Total Male Population of East Newnan?
Total Male Population of East Newnan is 451.
What is the Total Female Population of East Newnan?
Total Female Population of East Newnan is 466.
What is the Ratio of Males per 100 Females in East Newnan?
There are 96.78 Males per 100 Females in East Newnan.
What is the Ratio of Females per 100 Males in East Newnan?
There are 103.33 Females per 100 Males in East Newnan.
What is the Median Population Age in East Newnan?
Median Population Age in East Newnan is 45.9 Years.
What is the Average Family Size in East Newnan
Average Family Size in East Newnan is 3.1 People.
What is the Average Household Size in East Newnan
Average Household Size in East Newnan is 2.7 People.
What is Per Capita Income in East Newnan?
Per Capita income in East Newnan is $17,494.
What is the Median Family Income in East Newnan?
Median Family Income in East Newnan is $40,833.
What is the Median Household income in East Newnan?
Median Household Income in East Newnan is $36,192.
What is Inequality or Gini Index in East Newnan?
Inequality or Gini Index in East Newnan is 0.42.
How Large is the Labor Force in East Newnan?
There are 364 People in the Labor Forcein in East Newnan.
What is the Percentage of People in the Labor Force in East Newnan?
43.9% of People are in the Labor Force in East Newnan.
What is the Unemployment Rate in East Newnan?
Unemployment Rate in East Newnan is 11.5%.