Tiger, GA
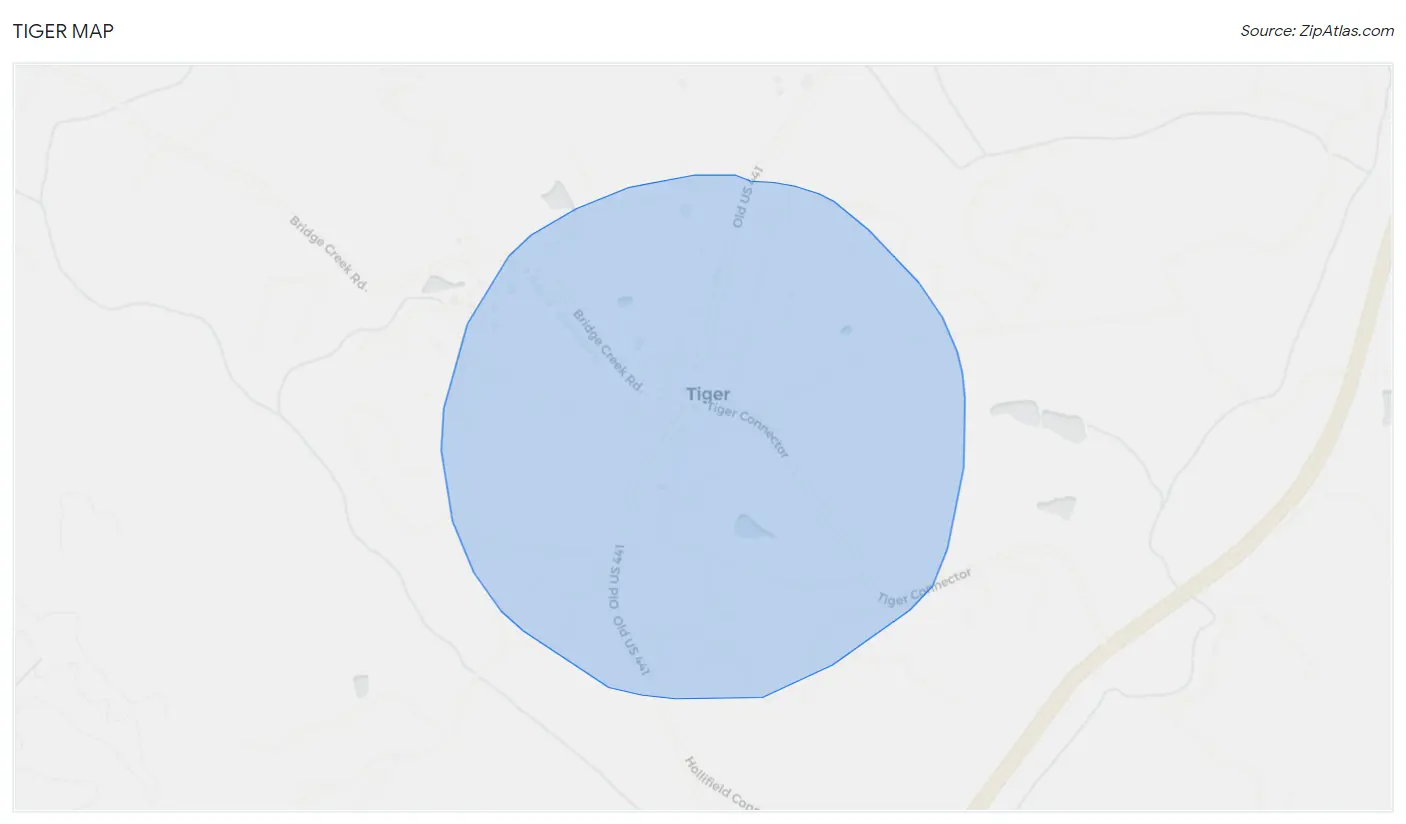
Tiger Map
Tiger Overview
549
TOTAL POPULATION
194
MALE POPULATION
355
FEMALE POPULATION
54.65
MALES / 100 FEMALES
182.99
FEMALES / 100 MALES
47.5
MEDIAN AGE
3.3
AVG FAMILY SIZE
2.3
AVG HOUSEHOLD SIZE
$20,334
PER CAPITA INCOME
$48,304
AVG FAMILY INCOME
$43,594
AVG HOUSEHOLD INCOME
39.1%
WAGE / INCOME GAP [ % ]
60.9¢/ $1
WAGE / INCOME GAP [ $ ]
0.36
INEQUALITY / GINI INDEX
181
LABOR FORCE [ PEOPLE ]
38.9%
PERCENT IN LABOR FORCE
1.7%
UNEMPLOYMENT RATE
Tiger Zip Codes
Tiger Area Codes
Race in Tiger
The most populous races in Tiger are White / Caucasian (515 | 93.8%), Hispanic or Latino (58 | 10.6%), and Some other Race (15 | 2.7%).
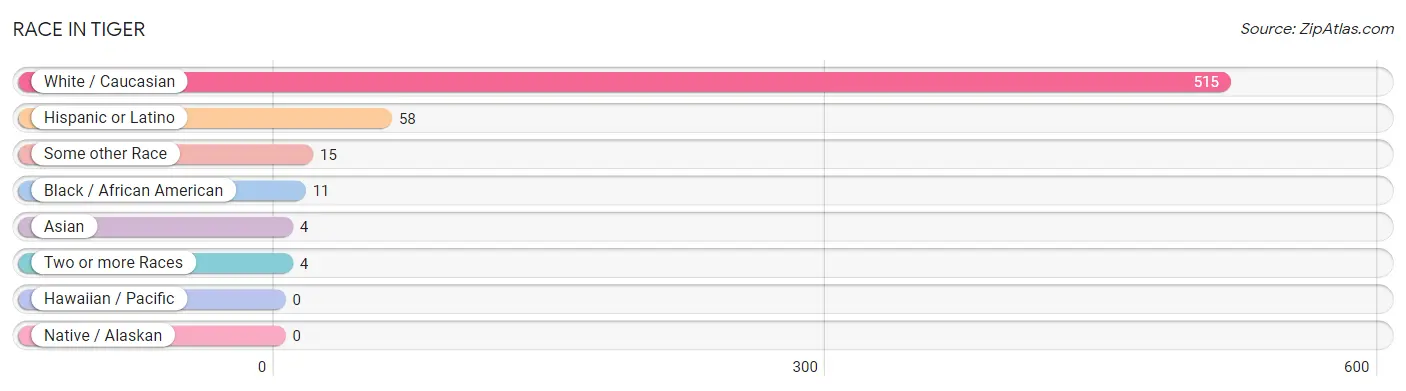
| Race | # Population | % Population |
| Asian | 4 | 0.7% |
| Black / African American | 11 | 2.0% |
| Hawaiian / Pacific | 0 | 0.0% |
| Hispanic or Latino | 58 | 10.6% |
| Native / Alaskan | 0 | 0.0% |
| White / Caucasian | 515 | 93.8% |
| Two or more Races | 4 | 0.7% |
| Some other Race | 15 | 2.7% |
| Total | 549 | 100.0% |
Ancestry in Tiger
The most populous ancestries reported in Tiger are American (165 | 30.0%), Irish (83 | 15.1%), English (63 | 11.5%), Mexican (58 | 10.6%), and German (6 | 1.1%), together accounting for 68.3% of all Tiger residents.
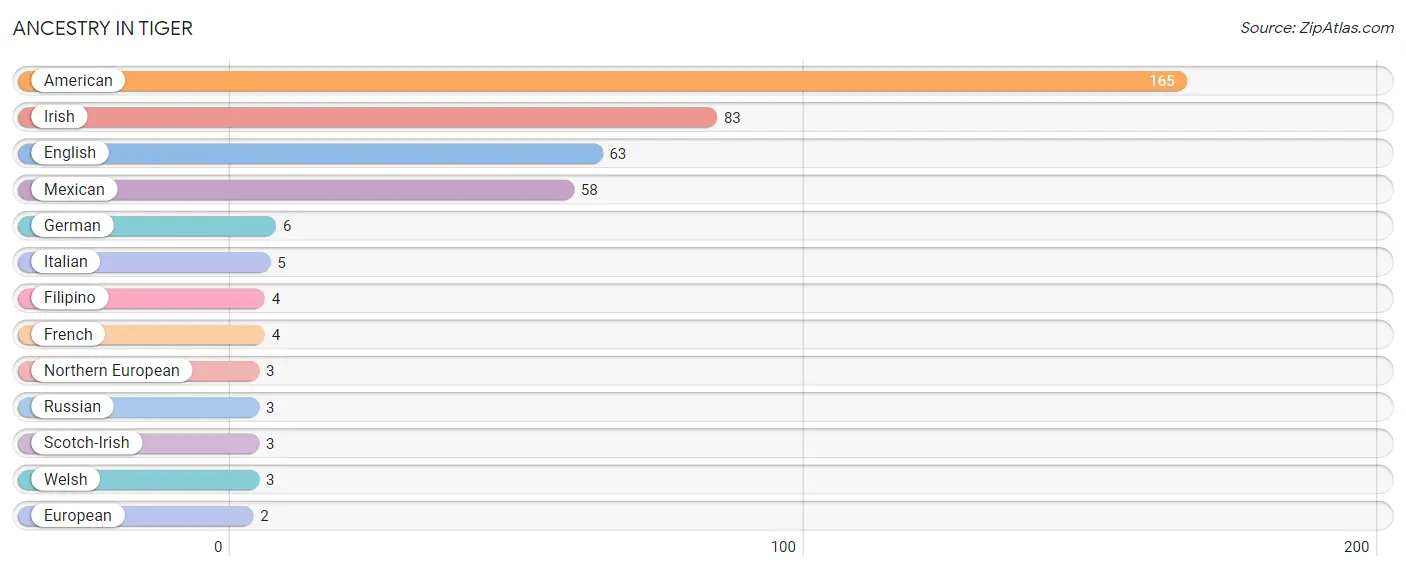
| Ancestry | # Population | % Population |
| American | 165 | 30.0% |
| English | 63 | 11.5% |
| European | 2 | 0.4% |
| Filipino | 4 | 0.7% |
| French | 4 | 0.7% |
| German | 6 | 1.1% |
| Irish | 83 | 15.1% |
| Italian | 5 | 0.9% |
| Mexican | 58 | 10.6% |
| Northern European | 3 | 0.5% |
| Russian | 3 | 0.5% |
| Scotch-Irish | 3 | 0.5% |
| Welsh | 3 | 0.5% | View All 13 Rows |
Immigrants in Tiger
The most numerous immigrant groups reported in Tiger came from Central America (4 | 0.7%), Latin America (4 | 0.7%), and Mexico (4 | 0.7%), together accounting for 2.2% of all Tiger residents.
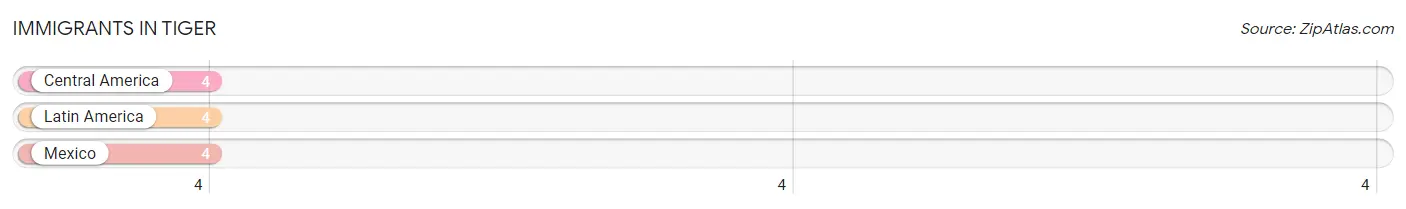
| Immigration Origin | # Population | % Population |
| Central America | 4 | 0.7% |
| Latin America | 4 | 0.7% |
| Mexico | 4 | 0.7% | View All 3 Rows |
Sex and Age in Tiger
Sex and Age in Tiger
The most populous age groups in Tiger are Under 5 Years (44 | 22.7%) for men and 85 Years and over (60 | 16.9%) for women.
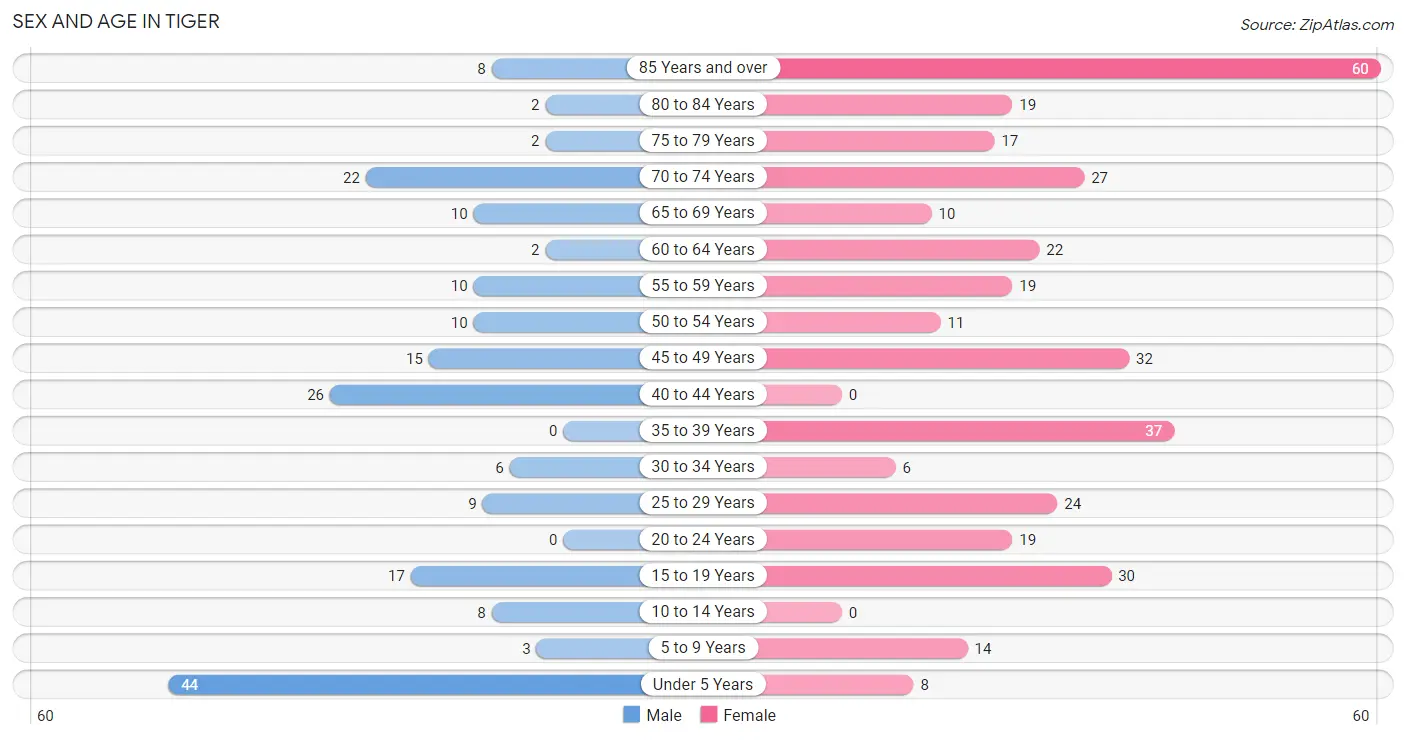
| Age Bracket | Male | Female |
| Under 5 Years | 44 (22.7%) | 8 (2.2%) |
| 5 to 9 Years | 3 (1.5%) | 14 (3.9%) |
| 10 to 14 Years | 8 (4.1%) | 0 (0.0%) |
| 15 to 19 Years | 17 (8.8%) | 30 (8.5%) |
| 20 to 24 Years | 0 (0.0%) | 19 (5.3%) |
| 25 to 29 Years | 9 (4.6%) | 24 (6.8%) |
| 30 to 34 Years | 6 (3.1%) | 6 (1.7%) |
| 35 to 39 Years | 0 (0.0%) | 37 (10.4%) |
| 40 to 44 Years | 26 (13.4%) | 0 (0.0%) |
| 45 to 49 Years | 15 (7.7%) | 32 (9.0%) |
| 50 to 54 Years | 10 (5.1%) | 11 (3.1%) |
| 55 to 59 Years | 10 (5.1%) | 19 (5.3%) |
| 60 to 64 Years | 2 (1.0%) | 22 (6.2%) |
| 65 to 69 Years | 10 (5.1%) | 10 (2.8%) |
| 70 to 74 Years | 22 (11.3%) | 27 (7.6%) |
| 75 to 79 Years | 2 (1.0%) | 17 (4.8%) |
| 80 to 84 Years | 2 (1.0%) | 19 (5.3%) |
| 85 Years and over | 8 (4.1%) | 60 (16.9%) |
| Total | 194 (100.0%) | 355 (100.0%) |
Families and Households in Tiger
Median Family Size in Tiger
The median family size in Tiger is 3.29 persons per family, with single male/father families (5 | 5.5%) accounting for the largest median family size of 4.8 persons per family. On the other hand, single female/mother families (6 | 6.6%) represent the smallest median family size with 2.83 persons per family.
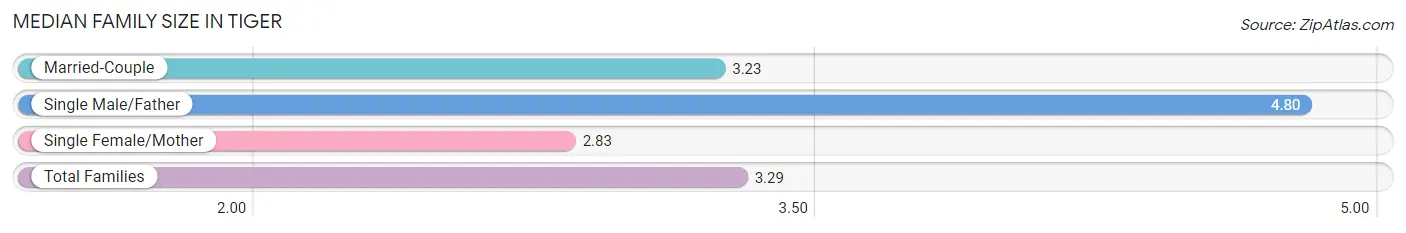
| Family Type | # Families | Family Size |
| Married-Couple | 80 (87.9%) | 3.23 |
| Single Male/Father | 5 (5.5%) | 4.80 |
| Single Female/Mother | 6 (6.6%) | 2.83 |
| Total Families | 91 (100.0%) | 3.29 |
Median Household Size in Tiger
The median household size in Tiger is 2.32 persons per household, with single male/father households (5 | 2.6%) accounting for the largest median household size of 6 persons per household. non-family households (104 | 53.3%) represent the smallest median household size with 1.42 persons per household.
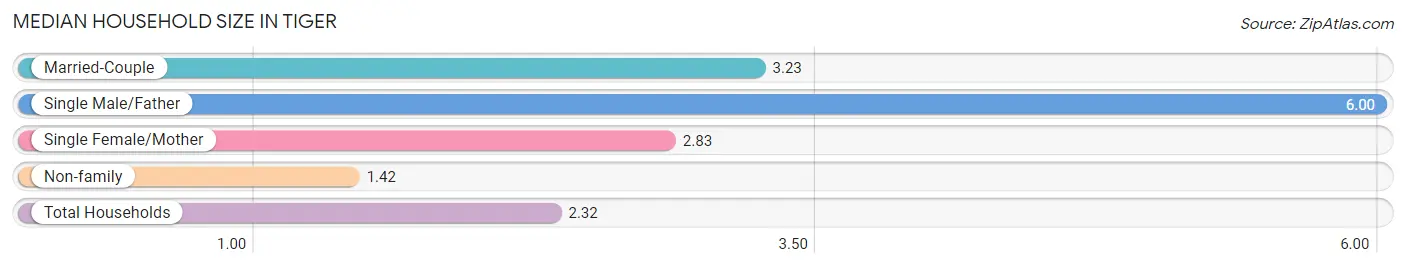
| Household Type | # Households | Household Size |
| Married-Couple | 80 (41.0%) | 3.23 |
| Single Male/Father | 5 (2.6%) | 6.00 |
| Single Female/Mother | 6 (3.1%) | 2.83 |
| Non-family | 104 (53.3%) | 1.42 |
| Total Households | 195 (100.0%) | 2.32 |
Household Size by Marriage Status in Tiger
Out of a total of 195 households in Tiger, 91 (46.7%) are family households, while 104 (53.3%) are nonfamily households. The most numerous type of family households are 4-person households, comprising 41, and the most common type of nonfamily households are 1-person households, comprising 82.
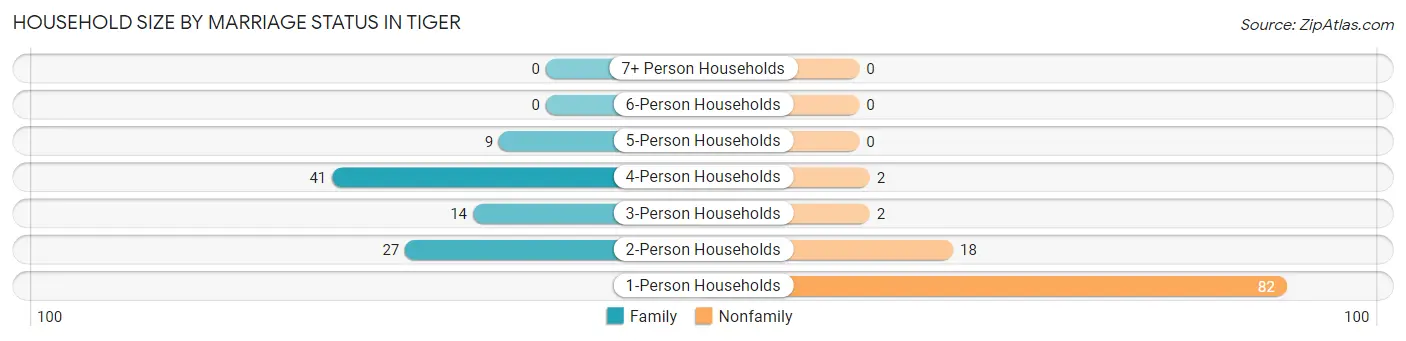
| Household Size | Family Households | Nonfamily Households |
| 1-Person Households | - | 82 (42.0%) |
| 2-Person Households | 27 (13.9%) | 18 (9.2%) |
| 3-Person Households | 14 (7.2%) | 2 (1.0%) |
| 4-Person Households | 41 (21.0%) | 2 (1.0%) |
| 5-Person Households | 9 (4.6%) | 0 (0.0%) |
| 6-Person Households | 0 (0.0%) | 0 (0.0%) |
| 7+ Person Households | 0 (0.0%) | 0 (0.0%) |
| Total | 91 (46.7%) | 104 (53.3%) |
Female Fertility in Tiger
Fertility by Age in Tiger
Average fertility rate in Tiger is 33.0 births per 1,000 women. Women in the age bracket of 20 to 34 years have the highest fertility rate with 102.0 births per 1,000 women. Women in the age bracket of 20 to 34 years acount for 100.0% of all women with births.
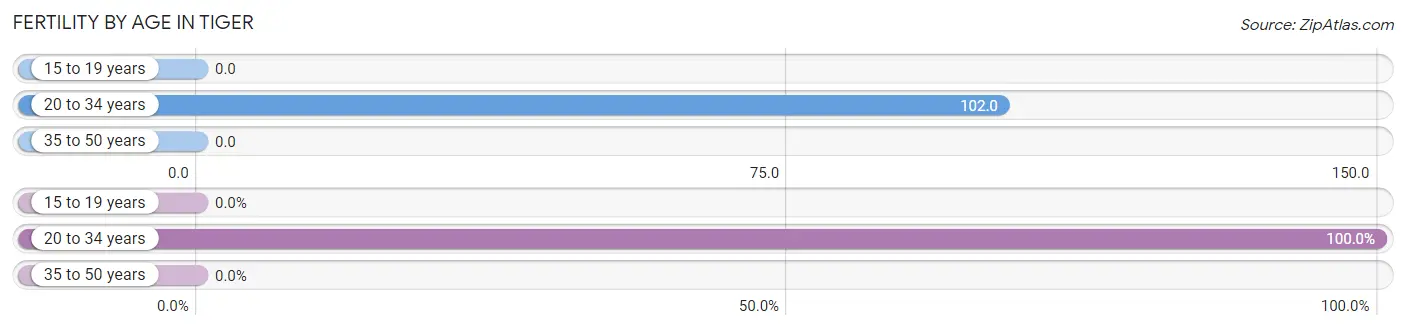
| Age Bracket | Women with Births | Births / 1,000 Women |
| 15 to 19 years | 0 (0.0%) | 0.0 |
| 20 to 34 years | 5 (100.0%) | 102.0 |
| 35 to 50 years | 0 (0.0%) | 0.0 |
| Total | 5 (100.0%) | 33.0 |
Fertility by Age by Marriage Status in Tiger
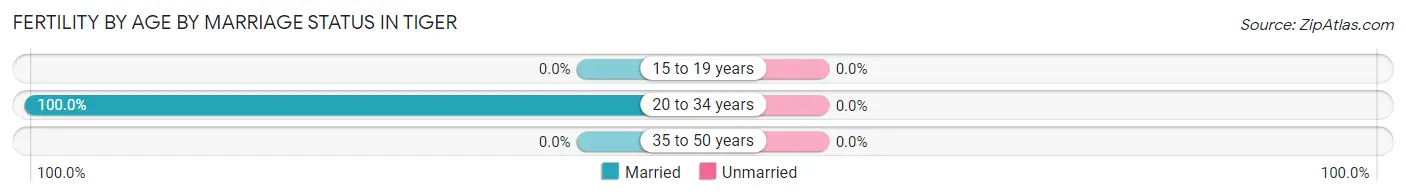
| Age Bracket | Married | Unmarried |
| 15 to 19 years | 0 (0.0%) | 0 (0.0%) |
| 20 to 34 years | 5 (100.0%) | 0 (0.0%) |
| 35 to 50 years | 0 (0.0%) | 0 (0.0%) |
| Total | 5 (100.0%) | 0 (0.0%) |
Fertility by Education in Tiger
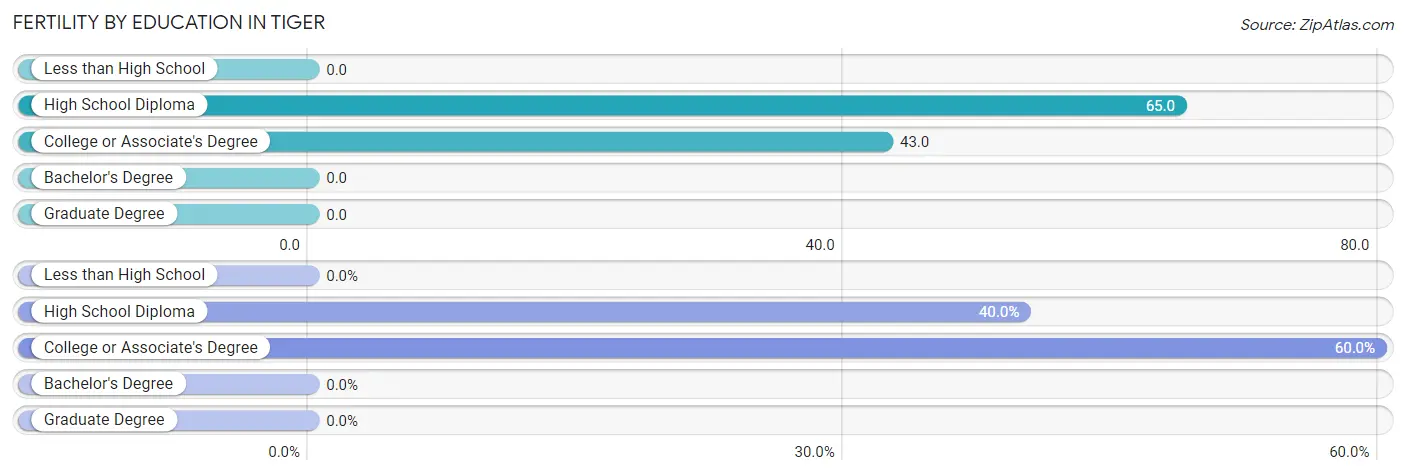
| Educational Attainment | Women with Births | Births / 1,000 Women |
| Less than High School | 0 (0.0%) | 0.0 |
| High School Diploma | 2 (40.0%) | 65.0 |
| College or Associate's Degree | 3 (60.0%) | 43.0 |
| Bachelor's Degree | 0 (0.0%) | 0.0 |
| Graduate Degree | 0 (0.0%) | 0.0 |
| Total | 5 (100.0%) | 33.0 |
Fertility by Education by Marriage Status in Tiger
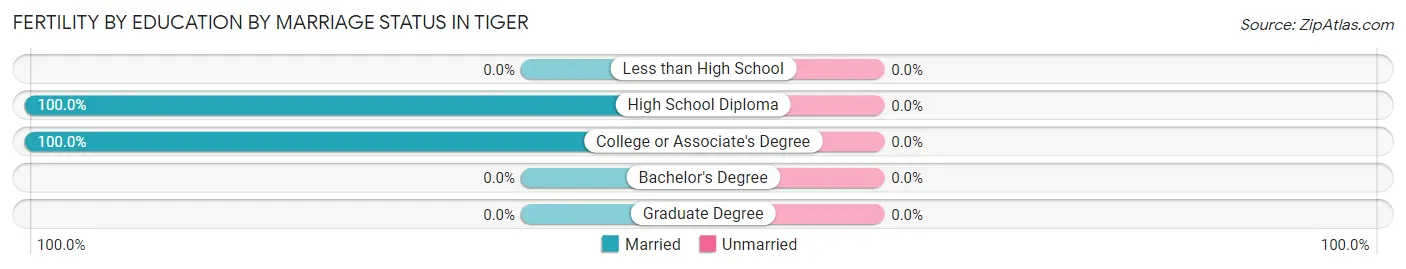
| Educational Attainment | Married | Unmarried |
| Less than High School | 0 (0.0%) | 0 (0.0%) |
| High School Diploma | 2 (100.0%) | 0 (0.0%) |
| College or Associate's Degree | 3 (100.0%) | 0 (0.0%) |
| Bachelor's Degree | 0 (0.0%) | 0 (0.0%) |
| Graduate Degree | 0 (0.0%) | 0 (0.0%) |
| Total | 5 (100.0%) | 0 (0.0%) |
Income in Tiger
Income Overview in Tiger
Per Capita Income in Tiger is $20,334, while median incomes of families and households are $48,304 and $43,594 respectively.
| Characteristic | Number | Measure |
| Per Capita Income | 549 | $20,334 |
| Median Family Income | 91 | $48,304 |
| Mean Family Income | 91 | $63,568 |
| Median Household Income | 195 | $43,594 |
| Mean Household Income | 195 | $54,534 |
| Income Deficit | 91 | $0 |
| Wage / Income Gap (%) | 549 | 39.08% |
| Wage / Income Gap ($) | 549 | 60.92¢ per $1 |
| Gini / Inequality Index | 549 | 0.36 |
Earnings by Sex in Tiger
Average Earnings in Tiger are $28,239, $40,833 for men and $24,875 for women, a difference of 39.1%.
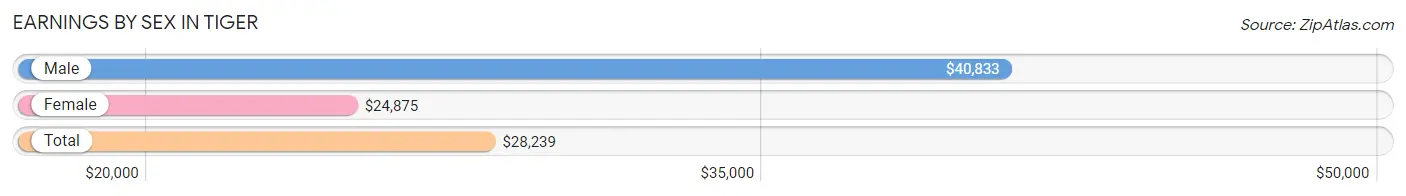
| Sex | Number | Average Earnings |
| Male | 78 (35.9%) | $40,833 |
| Female | 139 (64.1%) | $24,875 |
| Total | 217 (100.0%) | $28,239 |
Earnings by Sex by Income Bracket in Tiger
The most common earnings brackets in Tiger are $25,000 to $29,999 for men (22 | 28.2%) and $25,000 to $29,999 for women (24 | 17.3%).
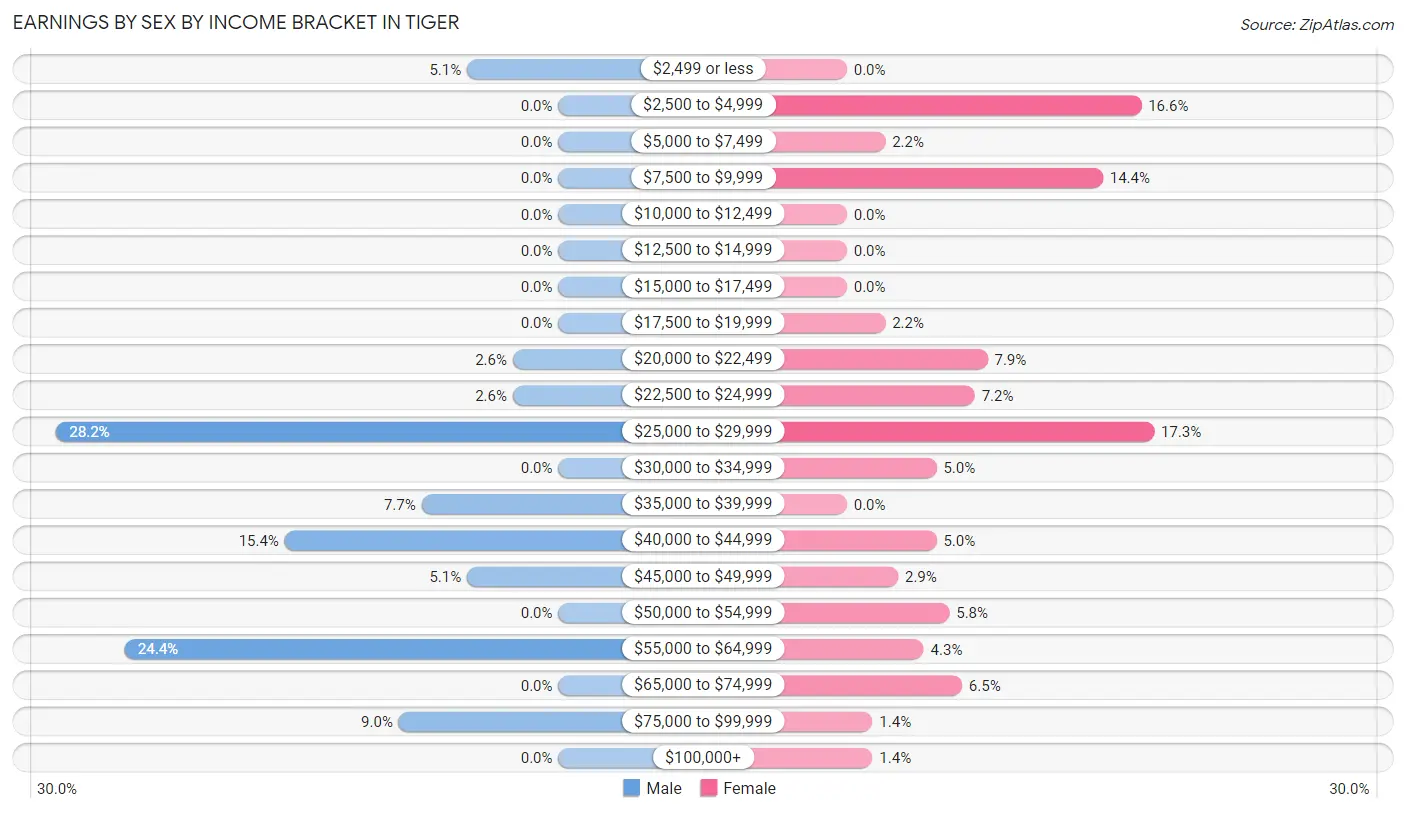
| Income | Male | Female |
| $2,499 or less | 4 (5.1%) | 0 (0.0%) |
| $2,500 to $4,999 | 0 (0.0%) | 23 (16.6%) |
| $5,000 to $7,499 | 0 (0.0%) | 3 (2.2%) |
| $7,500 to $9,999 | 0 (0.0%) | 20 (14.4%) |
| $10,000 to $12,499 | 0 (0.0%) | 0 (0.0%) |
| $12,500 to $14,999 | 0 (0.0%) | 0 (0.0%) |
| $15,000 to $17,499 | 0 (0.0%) | 0 (0.0%) |
| $17,500 to $19,999 | 0 (0.0%) | 3 (2.2%) |
| $20,000 to $22,499 | 2 (2.6%) | 11 (7.9%) |
| $22,500 to $24,999 | 2 (2.6%) | 10 (7.2%) |
| $25,000 to $29,999 | 22 (28.2%) | 24 (17.3%) |
| $30,000 to $34,999 | 0 (0.0%) | 7 (5.0%) |
| $35,000 to $39,999 | 6 (7.7%) | 0 (0.0%) |
| $40,000 to $44,999 | 12 (15.4%) | 7 (5.0%) |
| $45,000 to $49,999 | 4 (5.1%) | 4 (2.9%) |
| $50,000 to $54,999 | 0 (0.0%) | 8 (5.8%) |
| $55,000 to $64,999 | 19 (24.4%) | 6 (4.3%) |
| $65,000 to $74,999 | 0 (0.0%) | 9 (6.5%) |
| $75,000 to $99,999 | 7 (9.0%) | 2 (1.4%) |
| $100,000+ | 0 (0.0%) | 2 (1.4%) |
| Total | 78 (100.0%) | 139 (100.0%) |
Earnings by Sex by Educational Attainment in Tiger
Average earnings in Tiger are $40,833 for men and $26,667 for women, a difference of 34.7%. Men with an educational attainment of high school diploma enjoy the highest average annual earnings of $55,313, while those with college or associate's degree education earn the least with $27,333. Women with an educational attainment of bachelor's degree earn the most with the average annual earnings of $53,333, while those with college or associate's degree education have the smallest earnings of $28,333.
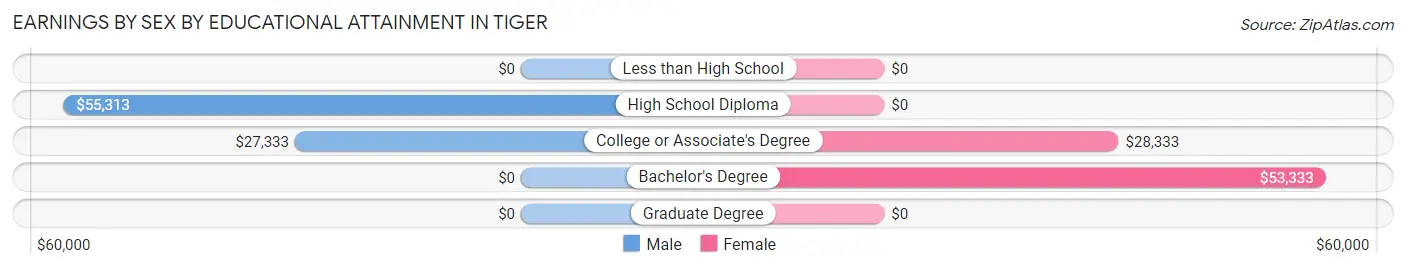
| Educational Attainment | Male Income | Female Income |
| Less than High School | - | - |
| High School Diploma | $55,313 | $0 |
| College or Associate's Degree | $27,333 | $28,333 |
| Bachelor's Degree | - | - |
| Graduate Degree | - | - |
| Total | $40,833 | $26,667 |
Family Income in Tiger
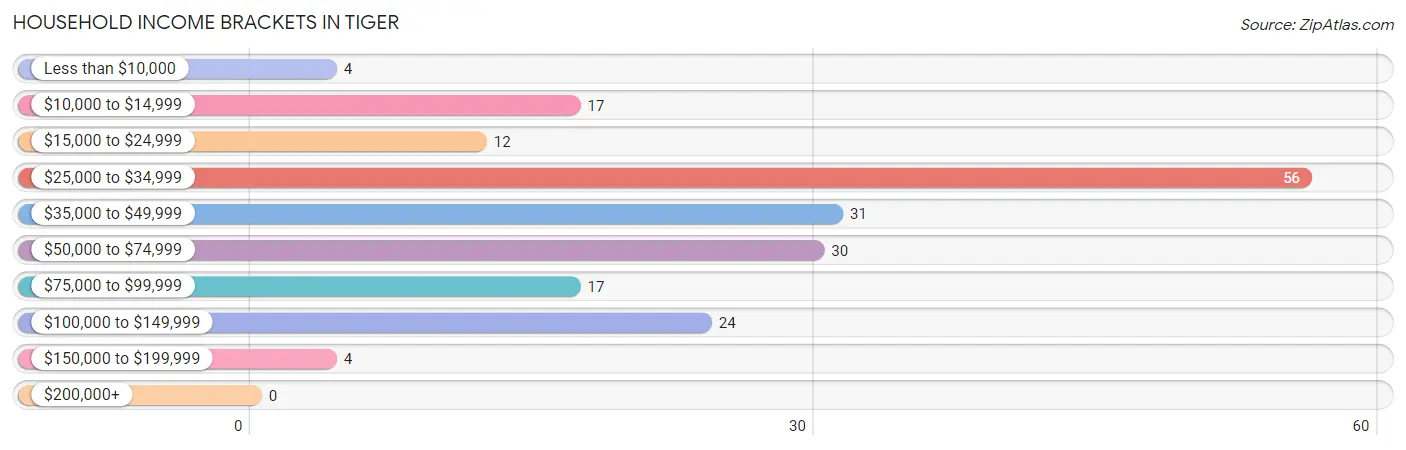
Family Income Brackets in Tiger
According to the Tiger family income data, there are 30 families falling into the $35,000 to $49,999 income range, which is the most common income bracket and makes up 33.0% of all families.
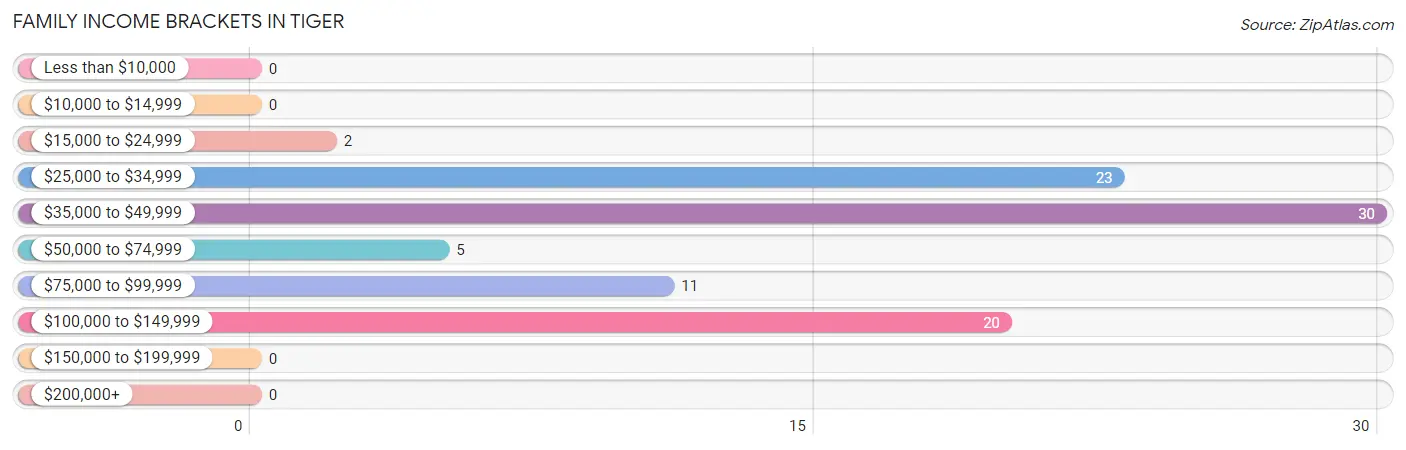
| Income Bracket | # Families | % Families |
| Less than $10,000 | 0 | 0.0% |
| $10,000 to $14,999 | 0 | 0.0% |
| $15,000 to $24,999 | 2 | 2.2% |
| $25,000 to $34,999 | 23 | 25.3% |
| $35,000 to $49,999 | 30 | 33.0% |
| $50,000 to $74,999 | 5 | 5.5% |
| $75,000 to $99,999 | 11 | 12.1% |
| $100,000 to $149,999 | 20 | 22.0% |
| $150,000 to $199,999 | 0 | 0.0% |
| $200,000+ | 0 | 0.0% |
Family Income by Famaliy Size in Tiger
3-person families (15 | 16.5%) account for the highest median family income in Tiger with $116,607 per family, while 3-person families (15 | 16.5%) have the highest median income of $38,869 per family member.
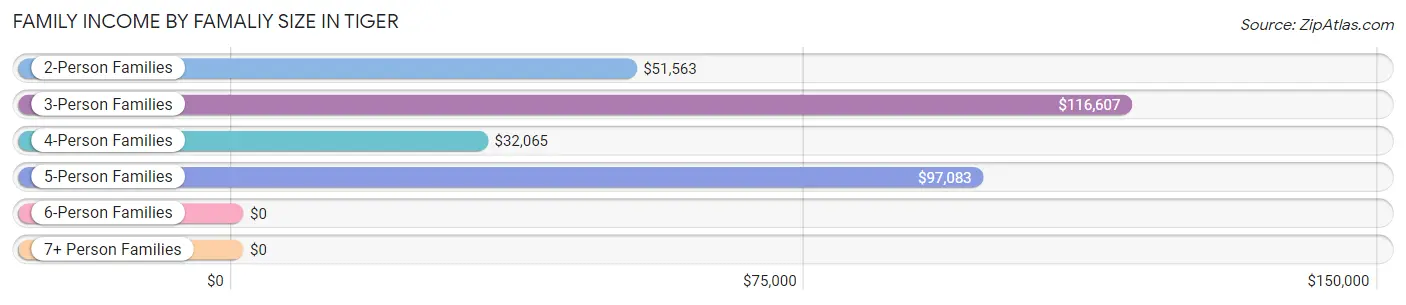
| Income Bracket | # Families | Median Income |
| 2-Person Families | 29 (31.9%) | $51,563 |
| 3-Person Families | 15 (16.5%) | $116,607 |
| 4-Person Families | 38 (41.8%) | $32,065 |
| 5-Person Families | 9 (9.9%) | $97,083 |
| 6-Person Families | 0 (0.0%) | $0 |
| 7+ Person Families | 0 (0.0%) | $0 |
| Total | 91 (100.0%) | $48,304 |
Family Income by Number of Earners in Tiger
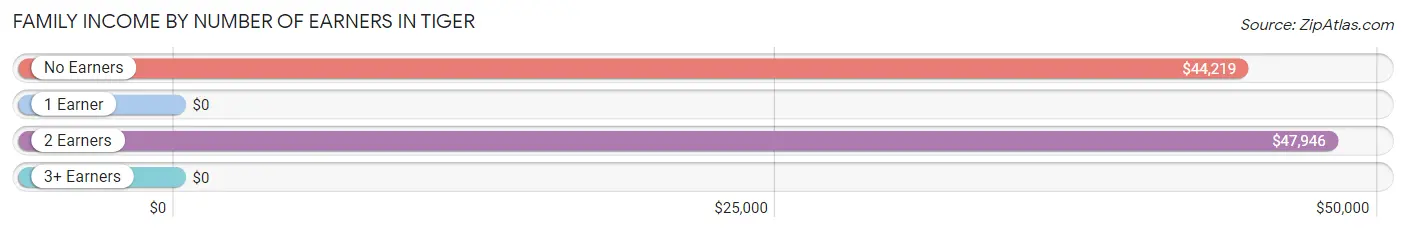
| Number of Earners | # Families | Median Income |
| No Earners | 13 (14.3%) | $44,219 |
| 1 Earner | 16 (17.6%) | $0 |
| 2 Earners | 55 (60.4%) | $47,946 |
| 3+ Earners | 7 (7.7%) | $0 |
| Total | 91 (100.0%) | $48,304 |
Household Income in Tiger
Household Income Brackets in Tiger
With 56 households falling in the category, the $25,000 to $34,999 income range is the most frequent in Tiger, accounting for 28.7% of all households.
| Income Bracket | # Households | % Households |
| Less than $10,000 | 4 | 2.1% |
| $10,000 to $14,999 | 17 | 8.7% |
| $15,000 to $24,999 | 12 | 6.2% |
| $25,000 to $34,999 | 56 | 28.7% |
| $35,000 to $49,999 | 31 | 15.9% |
| $50,000 to $74,999 | 30 | 15.4% |
| $75,000 to $99,999 | 17 | 8.7% |
| $100,000 to $149,999 | 24 | 12.3% |
| $150,000 to $199,999 | 4 | 2.1% |
| $200,000+ | 0 | 0.0% |
Household Income by Householder Age in Tiger
The median household income in Tiger is $43,594, with the highest median household income of $74,583 found in the 45 to 64 years age bracket for the primary householder. A total of 50 households (25.6%) fall into this category. Meanwhile, the 15 to 24 years age bracket for the primary householder has the lowest median household income of $0, with 5 households (2.6%) in this group.
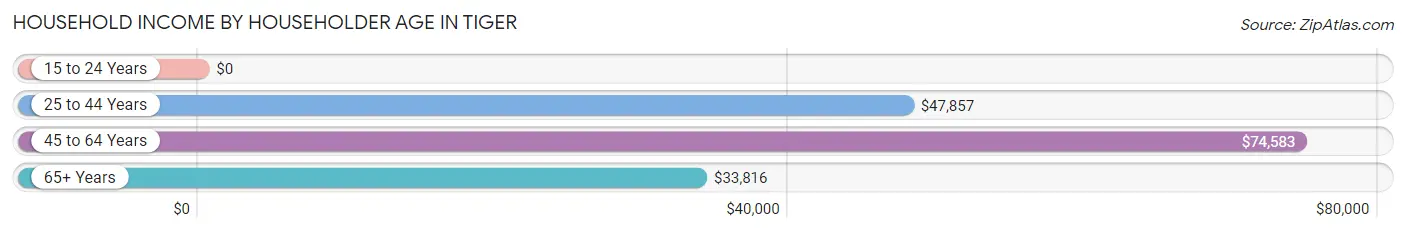
| Income Bracket | # Households | Median Income |
| 15 to 24 Years | 5 (2.6%) | $0 |
| 25 to 44 Years | 54 (27.7%) | $47,857 |
| 45 to 64 Years | 50 (25.6%) | $74,583 |
| 65+ Years | 86 (44.1%) | $33,816 |
| Total | 195 (100.0%) | $43,594 |
Poverty in Tiger
Income Below Poverty by Sex and Age in Tiger
With 8.1% poverty level for males and 14.6% for females among the residents of Tiger, 55 to 64 year old males and 25 to 34 year old females are the most vulnerable to poverty, with 7 males (58.3%) and 12 females (40.0%) in their respective age groups living below the poverty level.
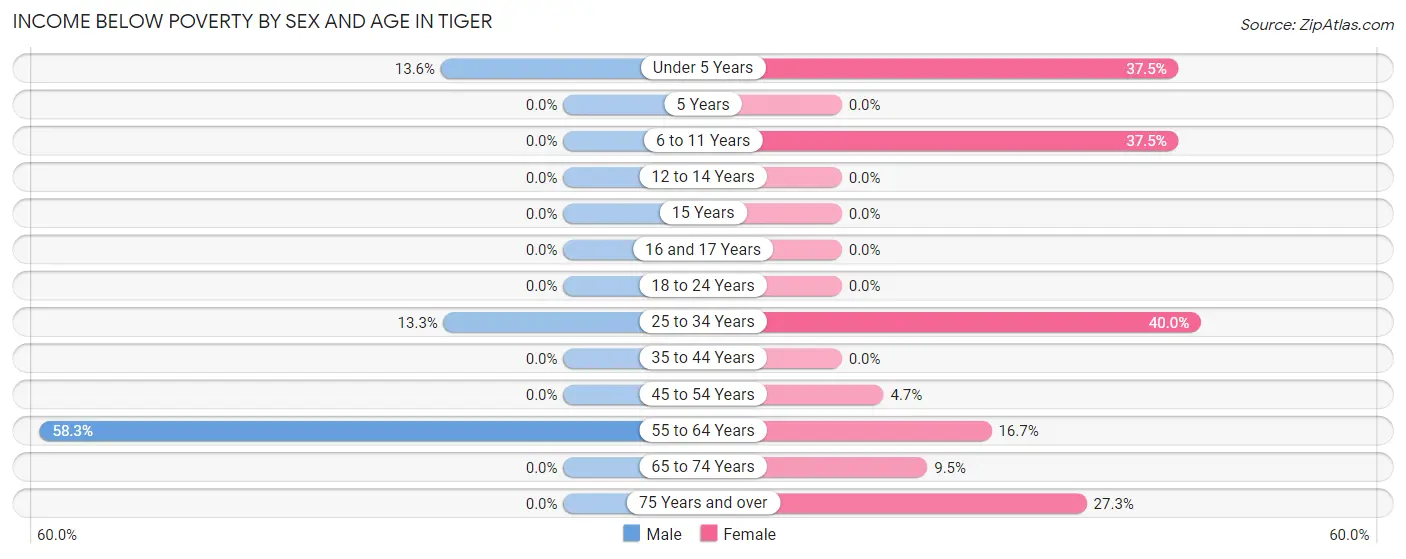
| Age Bracket | Male | Female |
| Under 5 Years | 6 (13.6%) | 3 (37.5%) |
| 5 Years | 0 (0.0%) | 0 (0.0%) |
| 6 to 11 Years | 0 (0.0%) | 3 (37.5%) |
| 12 to 14 Years | 0 (0.0%) | 0 (0.0%) |
| 15 Years | 0 (0.0%) | 0 (0.0%) |
| 16 and 17 Years | 0 (0.0%) | 0 (0.0%) |
| 18 to 24 Years | 0 (0.0%) | 0 (0.0%) |
| 25 to 34 Years | 2 (13.3%) | 12 (40.0%) |
| 35 to 44 Years | 0 (0.0%) | 0 (0.0%) |
| 45 to 54 Years | 0 (0.0%) | 2 (4.6%) |
| 55 to 64 Years | 7 (58.3%) | 4 (16.7%) |
| 65 to 74 Years | 0 (0.0%) | 2 (9.5%) |
| 75 Years and over | 0 (0.0%) | 15 (27.3%) |
| Total | 15 (8.1%) | 41 (14.6%) |
Income Above Poverty by Sex and Age in Tiger
According to the poverty statistics in Tiger, males aged 6 to 11 years and females aged 5 years are the age groups that are most secure financially, with 100.0% of males and 100.0% of females in these age groups living above the poverty line.
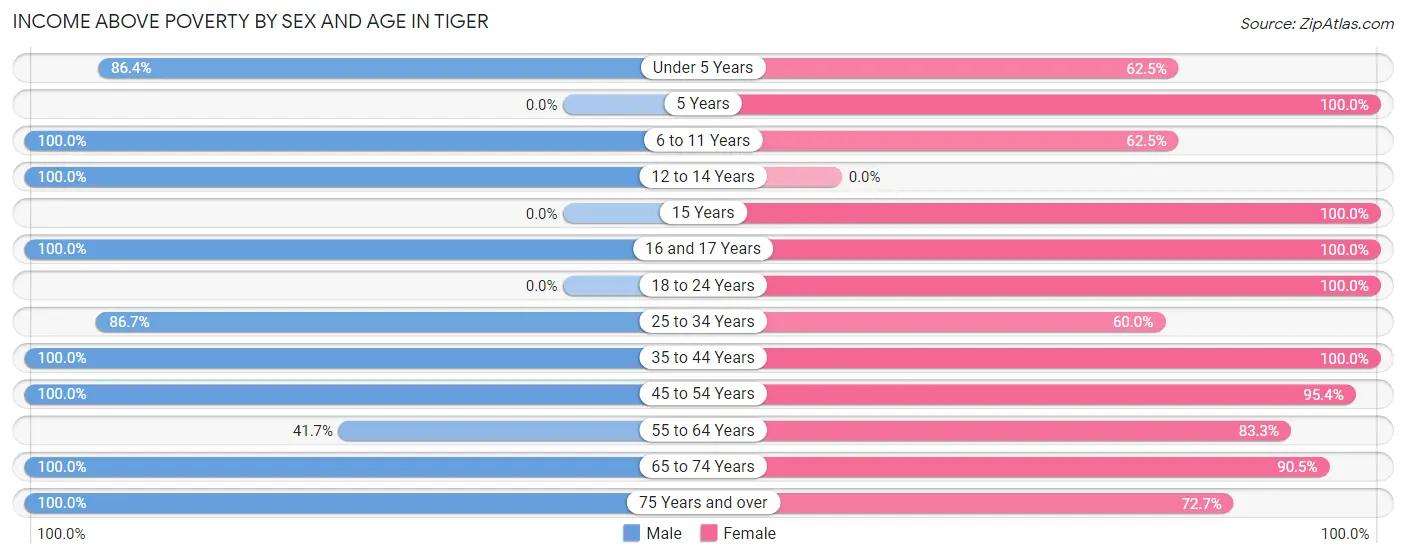
| Age Bracket | Male | Female |
| Under 5 Years | 38 (86.4%) | 5 (62.5%) |
| 5 Years | 0 (0.0%) | 6 (100.0%) |
| 6 to 11 Years | 6 (100.0%) | 5 (62.5%) |
| 12 to 14 Years | 5 (100.0%) | 0 (0.0%) |
| 15 Years | 0 (0.0%) | 7 (100.0%) |
| 16 and 17 Years | 17 (100.0%) | 17 (100.0%) |
| 18 to 24 Years | 0 (0.0%) | 25 (100.0%) |
| 25 to 34 Years | 13 (86.7%) | 18 (60.0%) |
| 35 to 44 Years | 26 (100.0%) | 37 (100.0%) |
| 45 to 54 Years | 25 (100.0%) | 41 (95.4%) |
| 55 to 64 Years | 5 (41.7%) | 20 (83.3%) |
| 65 to 74 Years | 32 (100.0%) | 19 (90.5%) |
| 75 Years and over | 4 (100.0%) | 40 (72.7%) |
| Total | 171 (91.9%) | 240 (85.4%) |
Income Below Poverty Among Married-Couple Families in Tiger
The poverty statistics for married-couple families in Tiger show that 2.5% or 2 of the total 80 families live below the poverty line. Families with 3 or 4 children have the highest poverty rate of 22.2%, comprising of 2 families. On the other hand, families with no children have the lowest poverty rate of 0.0%, which includes 0 families.
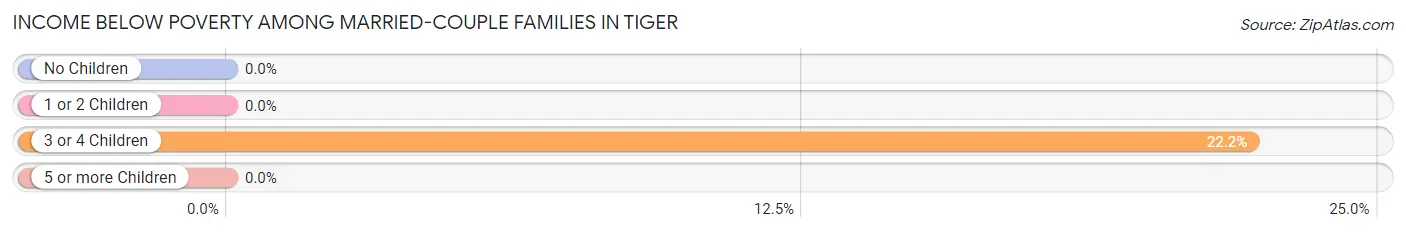
| Children | Above Poverty | Below Poverty |
| No Children | 29 (100.0%) | 0 (0.0%) |
| 1 or 2 Children | 42 (100.0%) | 0 (0.0%) |
| 3 or 4 Children | 7 (77.8%) | 2 (22.2%) |
| 5 or more Children | 0 (0.0%) | 0 (0.0%) |
| Total | 78 (97.5%) | 2 (2.5%) |
Income Below Poverty Among Single-Parent Households in Tiger
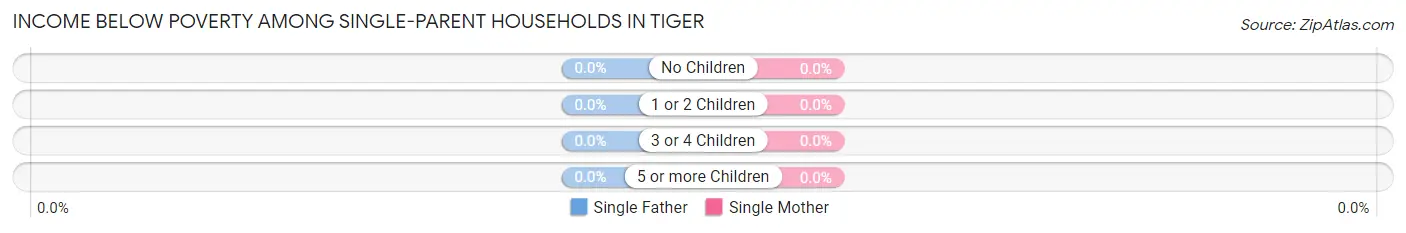
| Children | Single Father | Single Mother |
| No Children | 0 (0.0%) | 0 (0.0%) |
| 1 or 2 Children | 0 (0.0%) | 0 (0.0%) |
| 3 or 4 Children | 0 (0.0%) | 0 (0.0%) |
| 5 or more Children | 0 (0.0%) | 0 (0.0%) |
| Total | 0 (0.0%) | 0 (0.0%) |
Income Below Poverty Among Married-Couple vs Single-Parent Households in Tiger
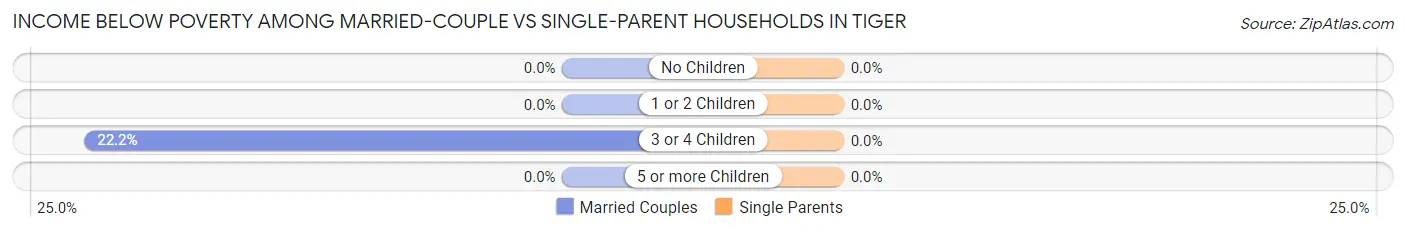
| Children | Married-Couple Families | Single-Parent Households |
| No Children | 0 (0.0%) | 0 (0.0%) |
| 1 or 2 Children | 0 (0.0%) | 0 (0.0%) |
| 3 or 4 Children | 2 (22.2%) | 0 (0.0%) |
| 5 or more Children | 0 (0.0%) | 0 (0.0%) |
| Total | 2 (2.5%) | 0 (0.0%) |
Employment Characteristics in Tiger
Employment by Class of Employer in Tiger
Among the 178 employed individuals in Tiger, private company employees (105 | 59.0%), self-employed (not incorporated) (29 | 16.3%), and local government employees (16 | 9.0%) make up the most common classes of employment.
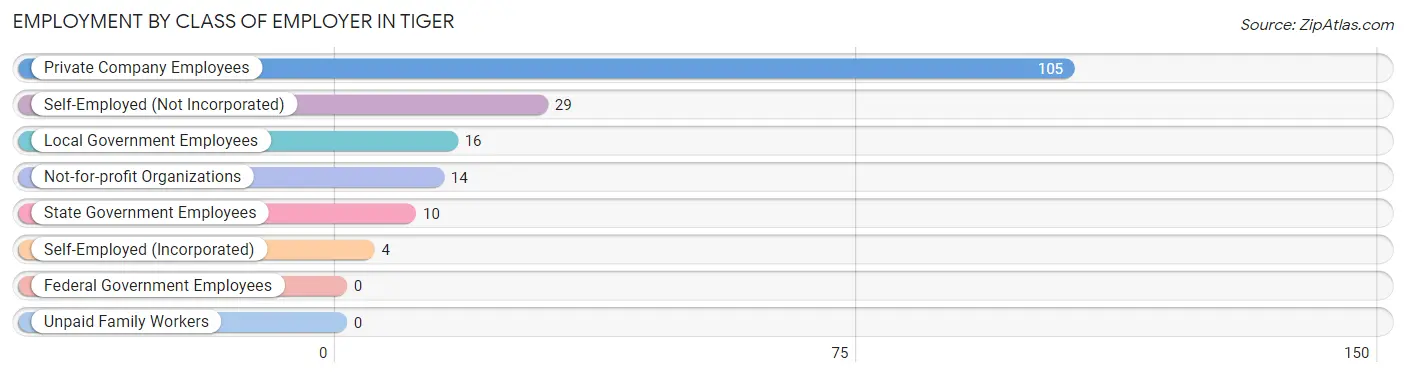
| Employer Class | # Employees | % Employees |
| Private Company Employees | 105 | 59.0% |
| Self-Employed (Incorporated) | 4 | 2.2% |
| Self-Employed (Not Incorporated) | 29 | 16.3% |
| Not-for-profit Organizations | 14 | 7.9% |
| Local Government Employees | 16 | 9.0% |
| State Government Employees | 10 | 5.6% |
| Federal Government Employees | 0 | 0.0% |
| Unpaid Family Workers | 0 | 0.0% |
| Total | 178 | 100.0% |
Employment Status by Age in Tiger
According to the labor force statistics for Tiger, out of the total population over 16 years of age (465), 38.9% or 181 individuals are in the labor force, with 1.7% or 3 of them unemployed. The age group with the highest labor force participation rate is 20 to 24 years, with 100.0% or 19 individuals in the labor force. Within the labor force, the 25 to 29 years age range has the highest percentage of unemployed individuals, with 14.3% or 3 of them being unemployed.
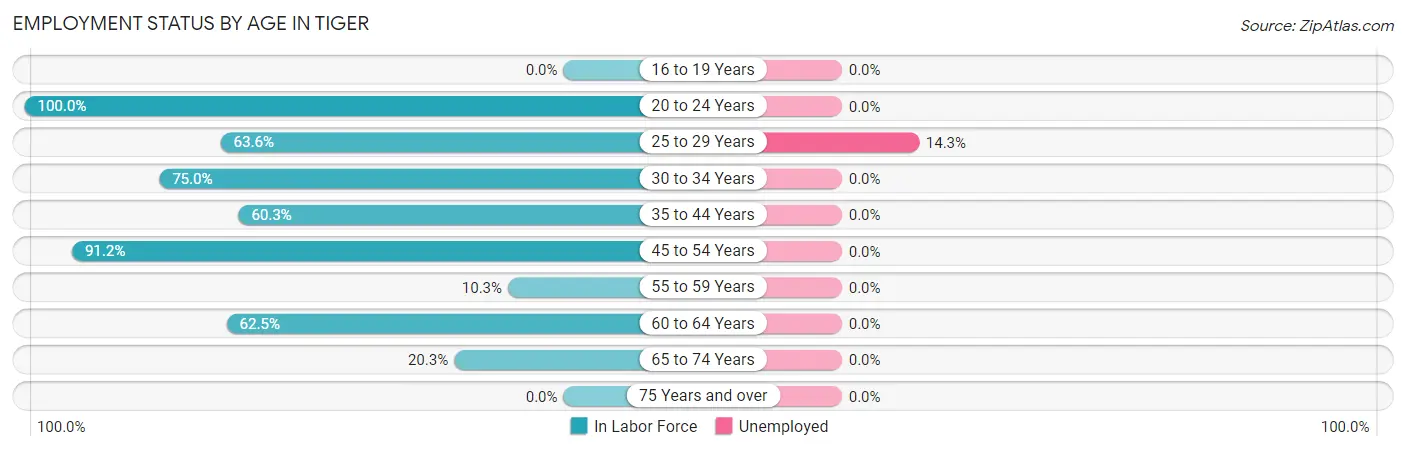
| Age Bracket | In Labor Force | Unemployed |
| 16 to 19 Years | 0 (0.0%) | 0 (0.0%) |
| 20 to 24 Years | 19 (100.0%) | 0 (0.0%) |
| 25 to 29 Years | 21 (63.6%) | 3 (14.3%) |
| 30 to 34 Years | 9 (75.0%) | 0 (0.0%) |
| 35 to 44 Years | 38 (60.3%) | 0 (0.0%) |
| 45 to 54 Years | 62 (91.2%) | 0 (0.0%) |
| 55 to 59 Years | 3 (10.3%) | 0 (0.0%) |
| 60 to 64 Years | 15 (62.5%) | 0 (0.0%) |
| 65 to 74 Years | 14 (20.3%) | 0 (0.0%) |
| 75 Years and over | 0 (0.0%) | 0 (0.0%) |
| Total | 181 (38.9%) | 3 (1.7%) |
Employment Status by Educational Attainment in Tiger
According to labor force statistics for Tiger, 64.6% of individuals (148) out of the total population between 25 and 64 years of age (229) are in the labor force, with 2.0% or 3 of them being unemployed. The group with the highest labor force participation rate are those with the educational attainment of college / associate degree, with 87.6% or 85 individuals in the labor force. Within the labor force, individuals with college / associate degree education have the highest percentage of unemployment, with 3.5% or 3 of them being unemployed.
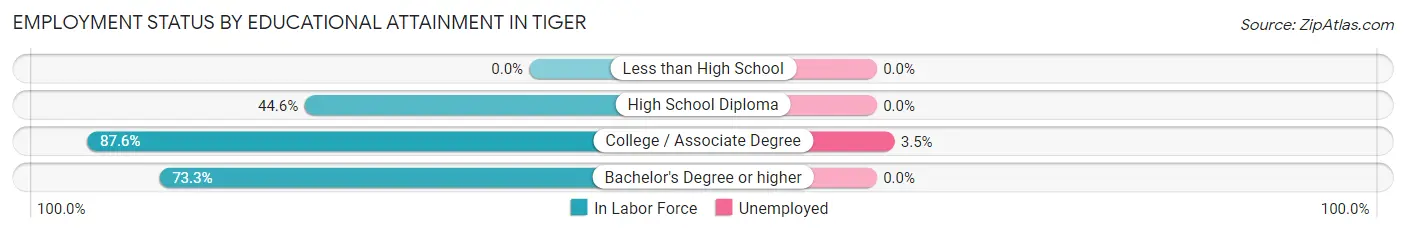
| Educational Attainment | In Labor Force | Unemployed |
| Less than High School | 0 (0.0%) | 0 (0.0%) |
| High School Diploma | 41 (44.6%) | 0 (0.0%) |
| College / Associate Degree | 85 (87.6%) | 3 (3.5%) |
| Bachelor's Degree or higher | 22 (73.3%) | 0 (0.0%) |
| Total | 148 (64.6%) | 5 (2.0%) |
Employment Occupations by Sex in Tiger
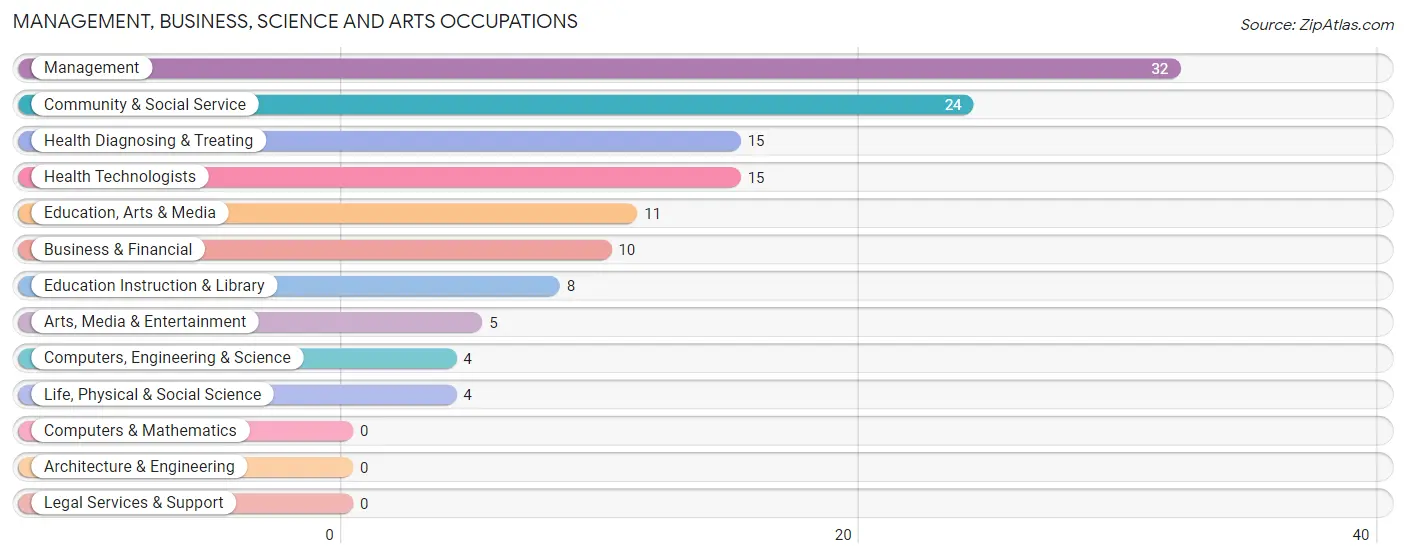
Management, Business, Science and Arts Occupations
The most common Management, Business, Science and Arts occupations in Tiger are Management (32 | 18.0%), Community & Social Service (24 | 13.5%), Health Diagnosing & Treating (15 | 8.4%), Health Technologists (15 | 8.4%), and Education, Arts & Media (11 | 6.2%).
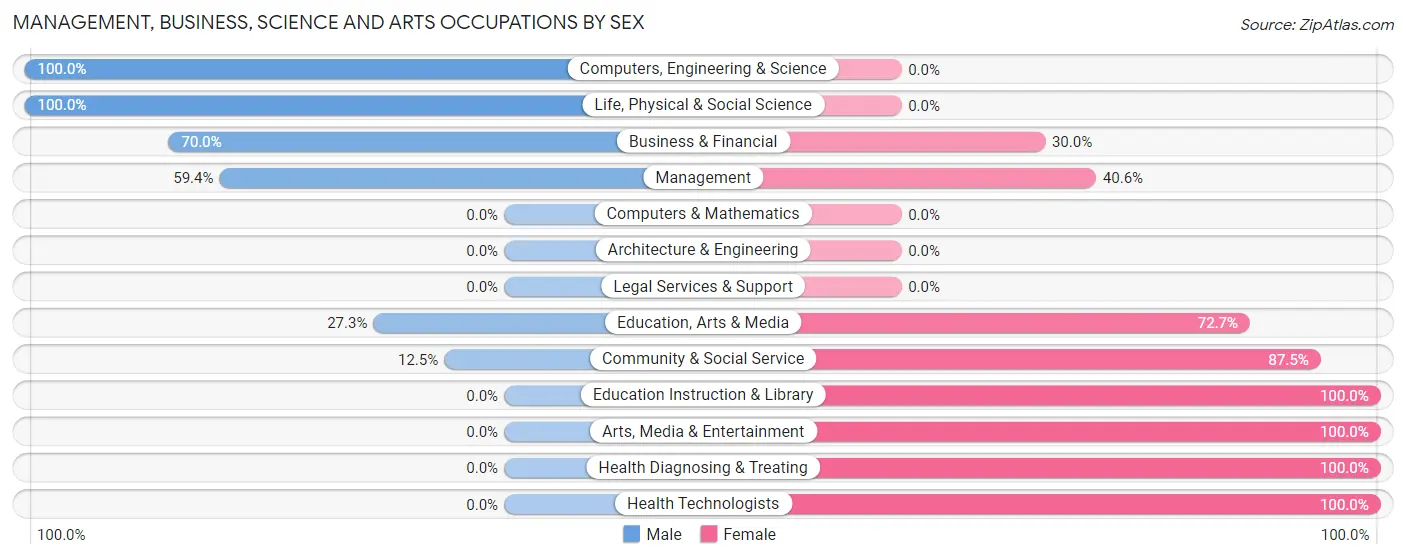
Management, Business, Science and Arts Occupations by Sex
Within the Management, Business, Science and Arts occupations in Tiger, the most male-oriented occupations are Computers, Engineering & Science (100.0%), Life, Physical & Social Science (100.0%), and Business & Financial (70.0%), while the most female-oriented occupations are Education Instruction & Library (100.0%), Arts, Media & Entertainment (100.0%), and Health Diagnosing & Treating (100.0%).
| Occupation | Male | Female |
| Management | 19 (59.4%) | 13 (40.6%) |
| Business & Financial | 7 (70.0%) | 3 (30.0%) |
| Computers, Engineering & Science | 4 (100.0%) | 0 (0.0%) |
| Computers & Mathematics | 0 (0.0%) | 0 (0.0%) |
| Architecture & Engineering | 0 (0.0%) | 0 (0.0%) |
| Life, Physical & Social Science | 4 (100.0%) | 0 (0.0%) |
| Community & Social Service | 3 (12.5%) | 21 (87.5%) |
| Education, Arts & Media | 3 (27.3%) | 8 (72.7%) |
| Legal Services & Support | 0 (0.0%) | 0 (0.0%) |
| Education Instruction & Library | 0 (0.0%) | 8 (100.0%) |
| Arts, Media & Entertainment | 0 (0.0%) | 5 (100.0%) |
| Health Diagnosing & Treating | 0 (0.0%) | 15 (100.0%) |
| Health Technologists | 0 (0.0%) | 15 (100.0%) |
| Total (Category) | 33 (38.8%) | 52 (61.2%) |
| Total (Overall) | 75 (42.1%) | 103 (57.9%) |
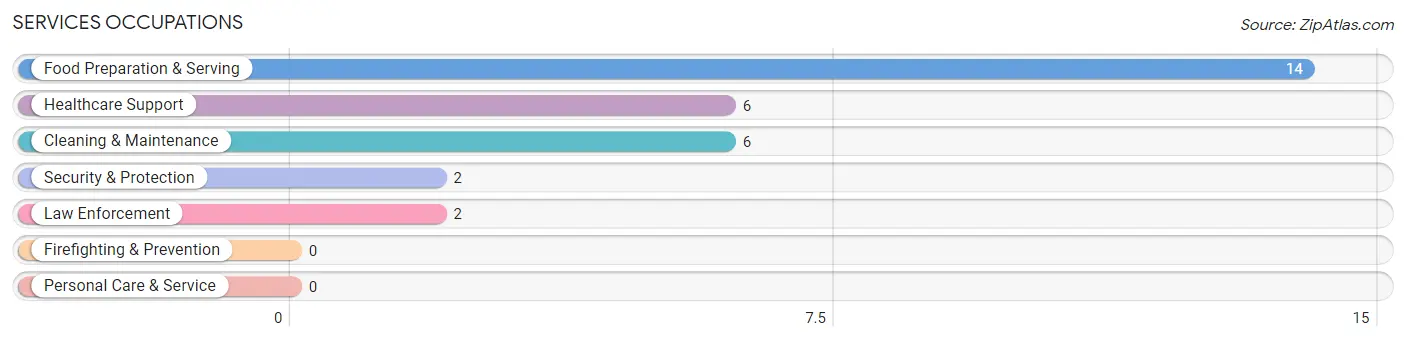
Services Occupations
The most common Services occupations in Tiger are Food Preparation & Serving (14 | 7.9%), Healthcare Support (6 | 3.4%), Cleaning & Maintenance (6 | 3.4%), Security & Protection (2 | 1.1%), and Law Enforcement (2 | 1.1%).
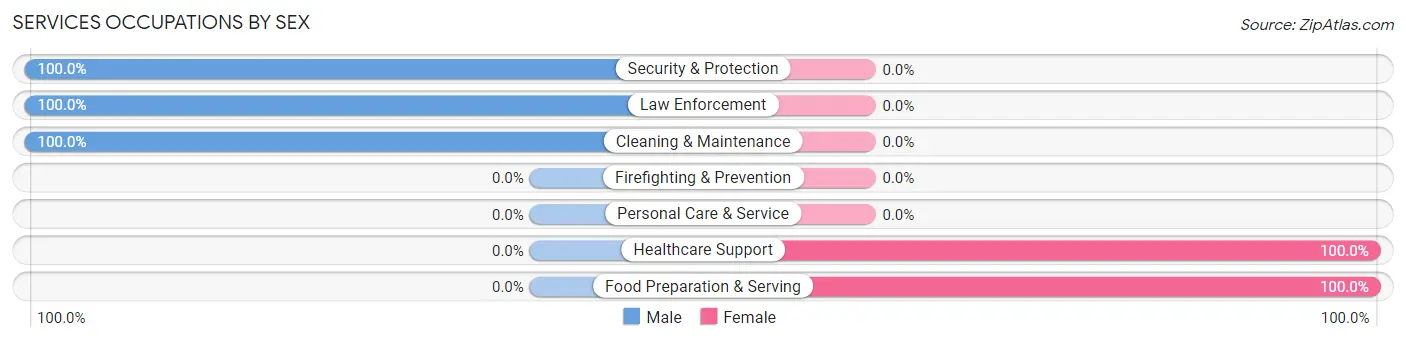
Services Occupations by Sex
Within the Services occupations in Tiger, the most male-oriented occupations are Security & Protection (100.0%), Law Enforcement (100.0%), and Cleaning & Maintenance (100.0%), while the most female-oriented occupations are Healthcare Support (100.0%), and Food Preparation & Serving (100.0%).
| Occupation | Male | Female |
| Healthcare Support | 0 (0.0%) | 6 (100.0%) |
| Security & Protection | 2 (100.0%) | 0 (0.0%) |
| Firefighting & Prevention | 0 (0.0%) | 0 (0.0%) |
| Law Enforcement | 2 (100.0%) | 0 (0.0%) |
| Food Preparation & Serving | 0 (0.0%) | 14 (100.0%) |
| Cleaning & Maintenance | 6 (100.0%) | 0 (0.0%) |
| Personal Care & Service | 0 (0.0%) | 0 (0.0%) |
| Total (Category) | 8 (28.6%) | 20 (71.4%) |
| Total (Overall) | 75 (42.1%) | 103 (57.9%) |
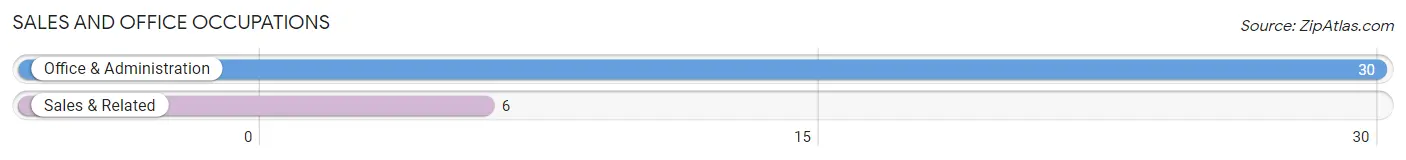
Sales and Office Occupations
The most common Sales and Office occupations in Tiger are Office & Administration (30 | 16.9%), and Sales & Related (6 | 3.4%).
Sales and Office Occupations by Sex
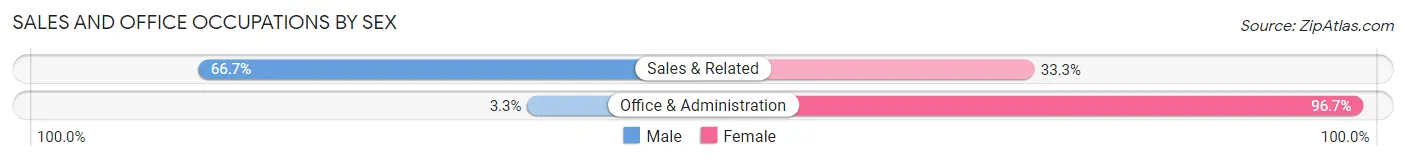
| Occupation | Male | Female |
| Sales & Related | 4 (66.7%) | 2 (33.3%) |
| Office & Administration | 1 (3.3%) | 29 (96.7%) |
| Total (Category) | 5 (13.9%) | 31 (86.1%) |
| Total (Overall) | 75 (42.1%) | 103 (57.9%) |
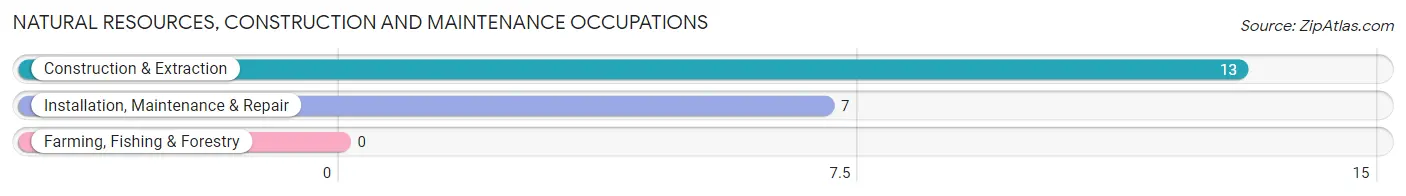
Natural Resources, Construction and Maintenance Occupations
The most common Natural Resources, Construction and Maintenance occupations in Tiger are Construction & Extraction (13 | 7.3%), and Installation, Maintenance & Repair (7 | 3.9%).
Natural Resources, Construction and Maintenance Occupations by Sex
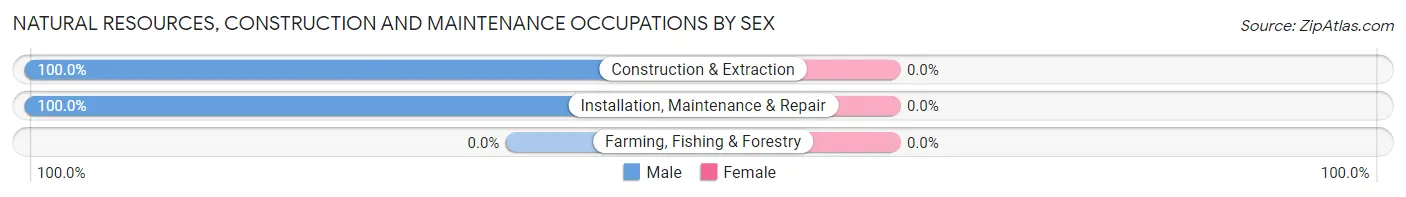
| Occupation | Male | Female |
| Farming, Fishing & Forestry | 0 (0.0%) | 0 (0.0%) |
| Construction & Extraction | 13 (100.0%) | 0 (0.0%) |
| Installation, Maintenance & Repair | 7 (100.0%) | 0 (0.0%) |
| Total (Category) | 20 (100.0%) | 0 (0.0%) |
| Total (Overall) | 75 (42.1%) | 103 (57.9%) |
Production, Transportation and Moving Occupations
The most common Production, Transportation and Moving occupations in Tiger are Production (6 | 3.4%), and Material Moving (3 | 1.7%).
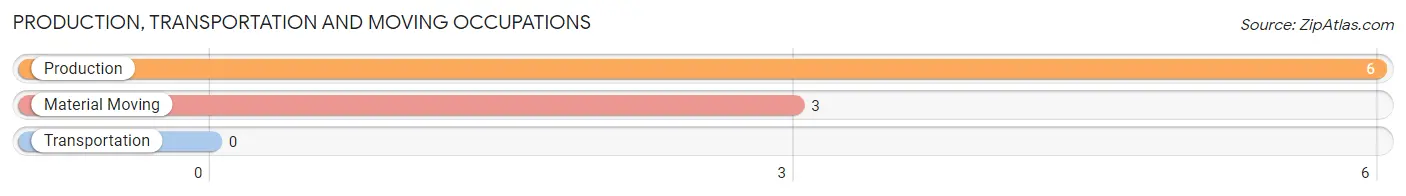
Production, Transportation and Moving Occupations by Sex
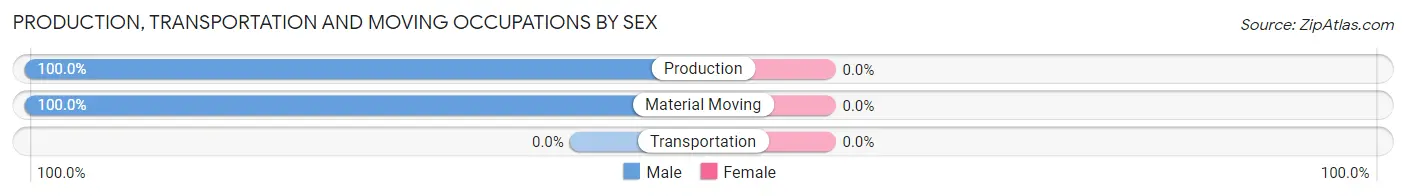
| Occupation | Male | Female |
| Production | 6 (100.0%) | 0 (0.0%) |
| Transportation | 0 (0.0%) | 0 (0.0%) |
| Material Moving | 3 (100.0%) | 0 (0.0%) |
| Total (Category) | 9 (100.0%) | 0 (0.0%) |
| Total (Overall) | 75 (42.1%) | 103 (57.9%) |
Employment Industries by Sex in Tiger
Employment Industries in Tiger
The major employment industries in Tiger include Health Care & Social Assistance (43 | 24.2%), Construction (28 | 15.7%), Accommodation & Food Services (16 | 9.0%), Manufacturing (15 | 8.4%), and Retail Trade (15 | 8.4%).
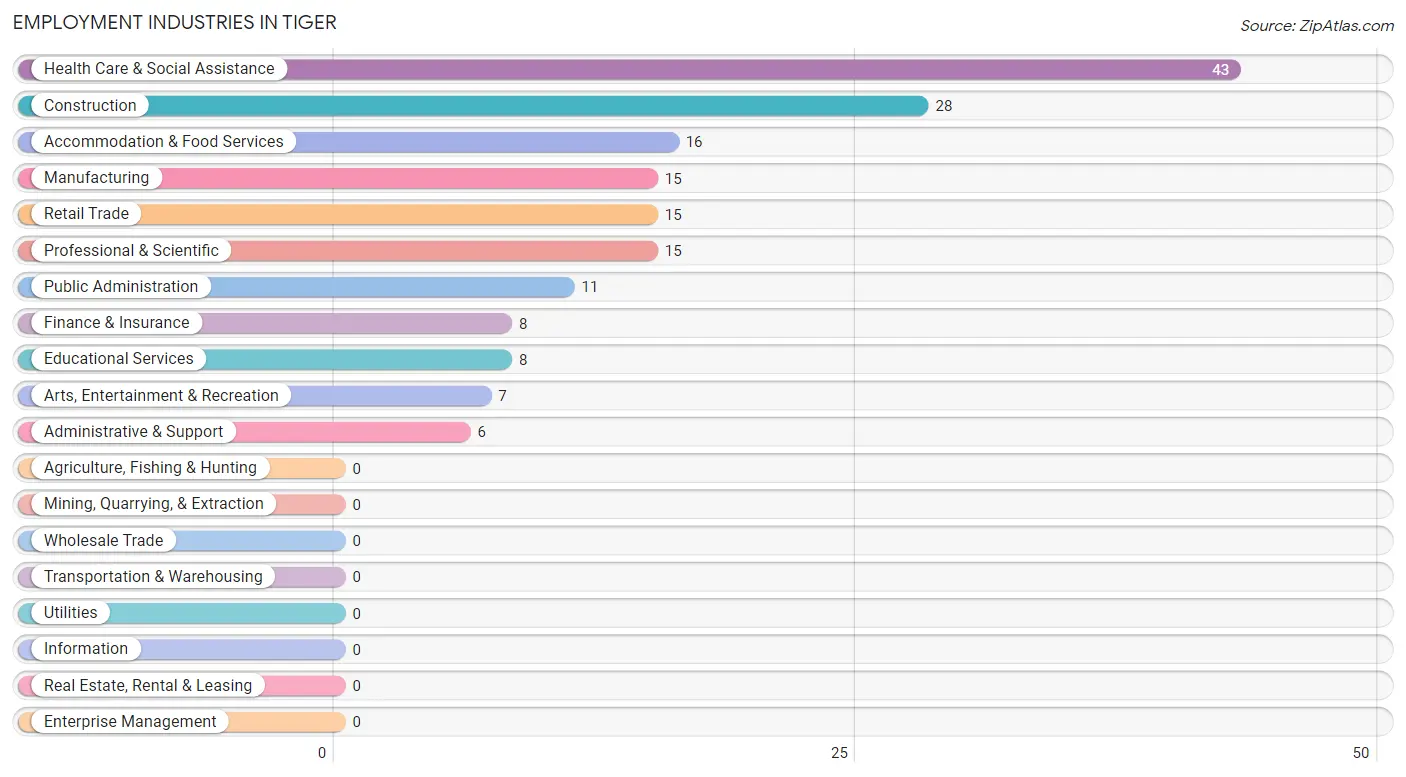
Employment Industries by Sex in Tiger
The Tiger industries that see more men than women are Construction (100.0%), Professional & Scientific (100.0%), and Manufacturing (86.7%), whereas the industries that tend to have a higher number of women are Finance & Insurance (100.0%), Educational Services (100.0%), and Health Care & Social Assistance (100.0%).
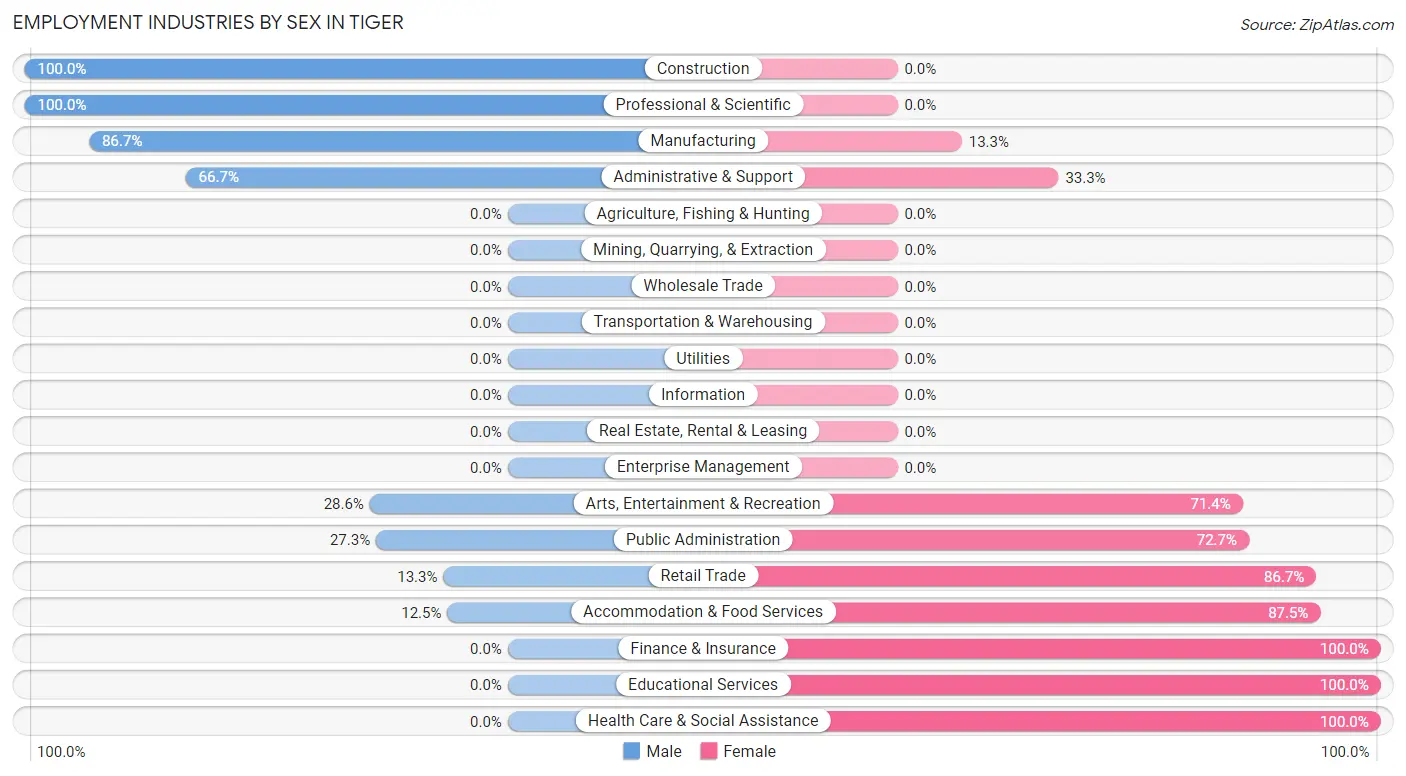
| Industry | Male | Female |
| Agriculture, Fishing & Hunting | 0 (0.0%) | 0 (0.0%) |
| Mining, Quarrying, & Extraction | 0 (0.0%) | 0 (0.0%) |
| Construction | 28 (100.0%) | 0 (0.0%) |
| Manufacturing | 13 (86.7%) | 2 (13.3%) |
| Wholesale Trade | 0 (0.0%) | 0 (0.0%) |
| Retail Trade | 2 (13.3%) | 13 (86.7%) |
| Transportation & Warehousing | 0 (0.0%) | 0 (0.0%) |
| Utilities | 0 (0.0%) | 0 (0.0%) |
| Information | 0 (0.0%) | 0 (0.0%) |
| Finance & Insurance | 0 (0.0%) | 8 (100.0%) |
| Real Estate, Rental & Leasing | 0 (0.0%) | 0 (0.0%) |
| Professional & Scientific | 15 (100.0%) | 0 (0.0%) |
| Enterprise Management | 0 (0.0%) | 0 (0.0%) |
| Administrative & Support | 4 (66.7%) | 2 (33.3%) |
| Educational Services | 0 (0.0%) | 8 (100.0%) |
| Health Care & Social Assistance | 0 (0.0%) | 43 (100.0%) |
| Arts, Entertainment & Recreation | 2 (28.6%) | 5 (71.4%) |
| Accommodation & Food Services | 2 (12.5%) | 14 (87.5%) |
| Public Administration | 3 (27.3%) | 8 (72.7%) |
| Total | 75 (42.1%) | 103 (57.9%) |
Education in Tiger
School Enrollment in Tiger
The most common levels of schooling among the 98 students in Tiger are high school (41 | 41.8%), nursery / preschool (16 | 16.3%), and college / undergraduate (12 | 12.2%).
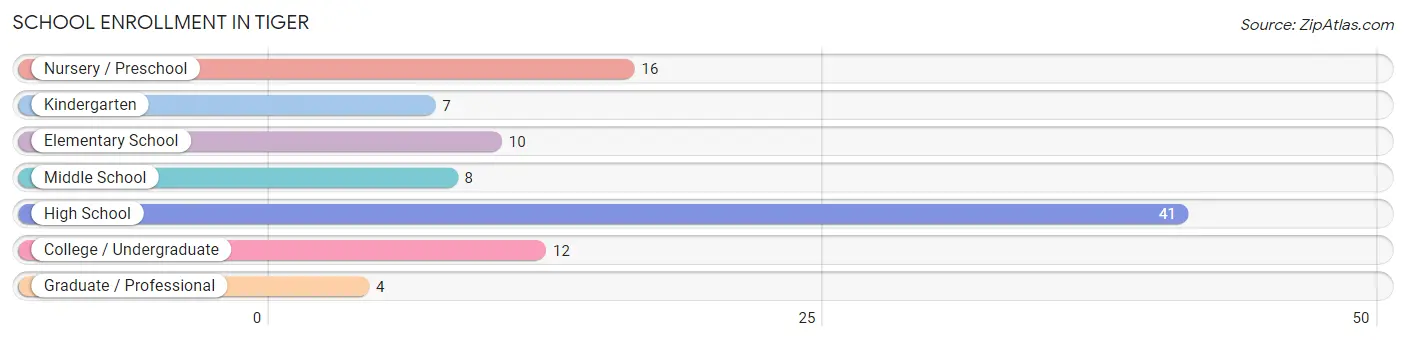
| School Level | # Students | % Students |
| Nursery / Preschool | 16 | 16.3% |
| Kindergarten | 7 | 7.1% |
| Elementary School | 10 | 10.2% |
| Middle School | 8 | 8.2% |
| High School | 41 | 41.8% |
| College / Undergraduate | 12 | 12.2% |
| Graduate / Professional | 4 | 4.1% |
| Total | 98 | 100.0% |
School Enrollment by Age by Funding Source in Tiger
Out of a total of 98 students who are enrolled in schools in Tiger, 12 (12.2%) attend a private institution, while the remaining 86 (87.8%) are enrolled in public schools. The age group of 25 to 34 year olds has the highest likelihood of being enrolled in private schools, with 10 (100.0% in the age bracket) enrolled. Conversely, the age group of 3 to 4 year olds has the lowest likelihood of being enrolled in a private school, with 16 (100.0% in the age bracket) attending a public institution.
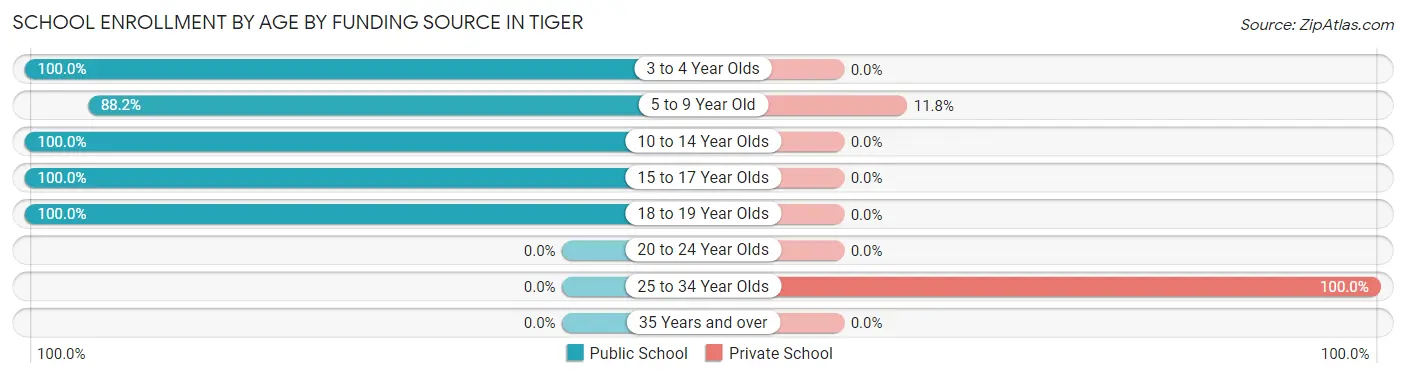
| Age Bracket | Public School | Private School |
| 3 to 4 Year Olds | 16 (100.0%) | 0 (0.0%) |
| 5 to 9 Year Old | 15 (88.2%) | 2 (11.8%) |
| 10 to 14 Year Olds | 8 (100.0%) | 0 (0.0%) |
| 15 to 17 Year Olds | 41 (100.0%) | 0 (0.0%) |
| 18 to 19 Year Olds | 6 (100.0%) | 0 (0.0%) |
| 20 to 24 Year Olds | 0 (0.0%) | 0 (0.0%) |
| 25 to 34 Year Olds | 0 (0.0%) | 10 (100.0%) |
| 35 Years and over | 0 (0.0%) | 0 (0.0%) |
| Total | 86 (87.8%) | 12 (12.2%) |
Educational Attainment by Field of Study in Tiger
Education (20 | 22.0%), science & technology (19 | 20.9%), computers & mathematics (16 | 17.6%), visual & performing arts (8 | 8.8%), and psychology (7 | 7.7%) are the most common fields of study among 91 individuals in Tiger who have obtained a bachelor's degree or higher.
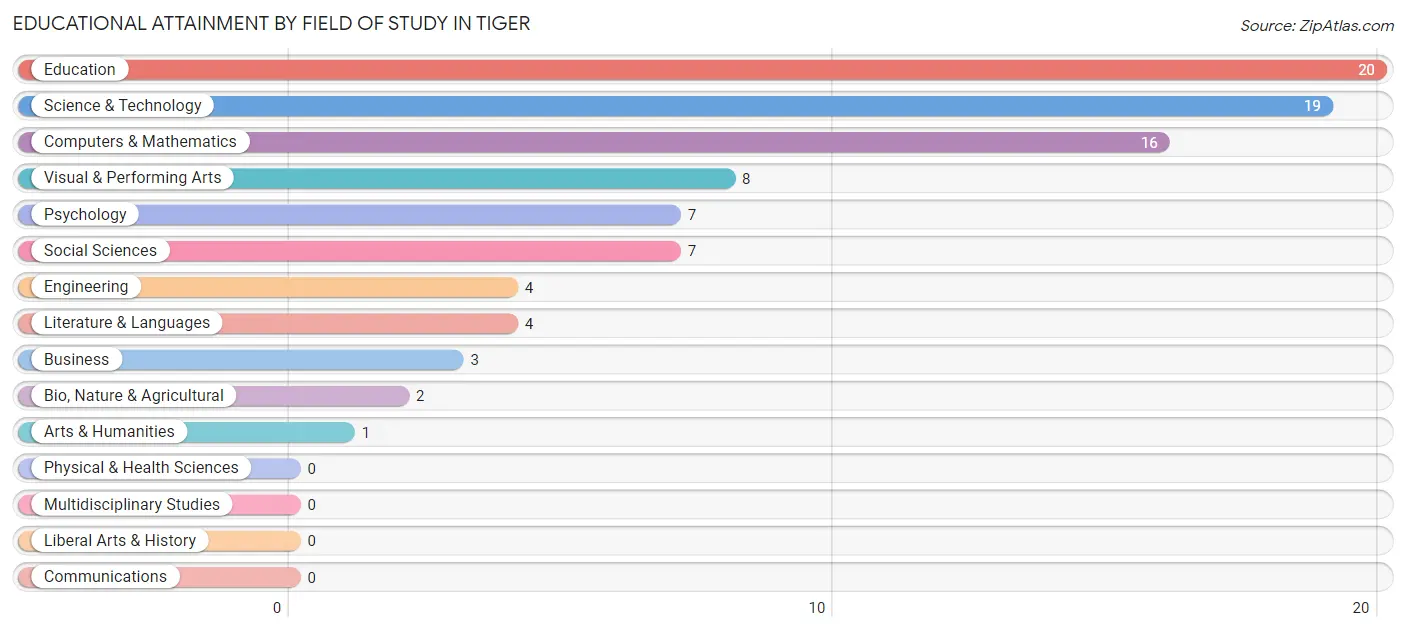
| Field of Study | # Graduates | % Graduates |
| Computers & Mathematics | 16 | 17.6% |
| Bio, Nature & Agricultural | 2 | 2.2% |
| Physical & Health Sciences | 0 | 0.0% |
| Psychology | 7 | 7.7% |
| Social Sciences | 7 | 7.7% |
| Engineering | 4 | 4.4% |
| Multidisciplinary Studies | 0 | 0.0% |
| Science & Technology | 19 | 20.9% |
| Business | 3 | 3.3% |
| Education | 20 | 22.0% |
| Literature & Languages | 4 | 4.4% |
| Liberal Arts & History | 0 | 0.0% |
| Visual & Performing Arts | 8 | 8.8% |
| Communications | 0 | 0.0% |
| Arts & Humanities | 1 | 1.1% |
| Total | 91 | 100.0% |
Transportation & Commute in Tiger
Vehicle Availability by Sex in Tiger
The most prevalent vehicle ownership categories in Tiger are males with 2 vehicles (34, accounting for 45.3%) and females with 2 vehicles (36, making up 33.0%).
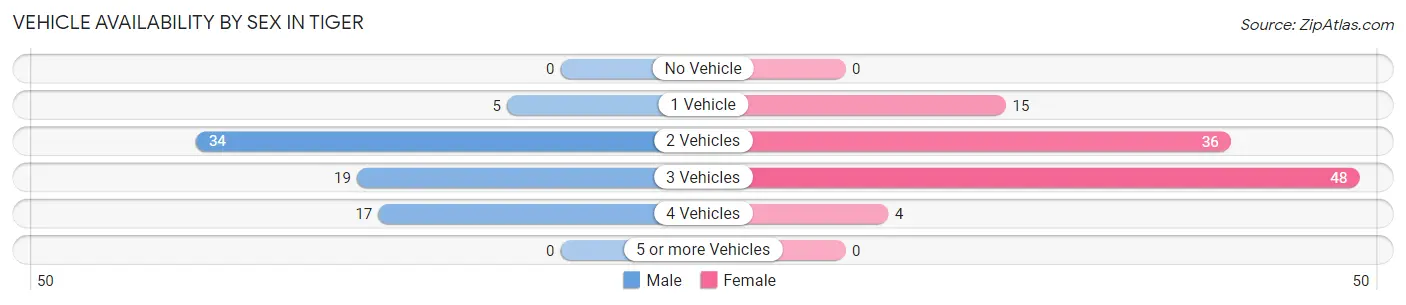
| Vehicles Available | Male | Female |
| No Vehicle | 0 (0.0%) | 0 (0.0%) |
| 1 Vehicle | 5 (6.7%) | 15 (14.6%) |
| 2 Vehicles | 34 (45.3%) | 36 (34.9%) |
| 3 Vehicles | 19 (25.3%) | 48 (46.6%) |
| 4 Vehicles | 17 (22.7%) | 4 (3.9%) |
| 5 or more Vehicles | 0 (0.0%) | 0 (0.0%) |
| Total | 75 (100.0%) | 103 (100.0%) |
Commute Time in Tiger
The most frequently occuring commute durations in Tiger are 10 to 14 minutes (60 commuters, 35.1%), 15 to 19 minutes (49 commuters, 28.6%), and 5 to 9 minutes (20 commuters, 11.7%).
| Commute Time | # Commuters | % Commuters |
| Less than 5 Minutes | 17 | 9.9% |
| 5 to 9 Minutes | 20 | 11.7% |
| 10 to 14 Minutes | 60 | 35.1% |
| 15 to 19 Minutes | 49 | 28.6% |
| 20 to 24 Minutes | 8 | 4.7% |
| 25 to 29 Minutes | 2 | 1.2% |
| 30 to 34 Minutes | 6 | 3.5% |
| 35 to 39 Minutes | 6 | 3.5% |
| 40 to 44 Minutes | 3 | 1.8% |
| 45 to 59 Minutes | 0 | 0.0% |
| 60 to 89 Minutes | 0 | 0.0% |
| 90 or more Minutes | 0 | 0.0% |
Commute Time by Sex in Tiger
The most common commute times in Tiger are 15 to 19 minutes (38 commuters, 53.5%) for males and 10 to 14 minutes (53 commuters, 53.0%) for females.
| Commute Time | Male | Female |
| Less than 5 Minutes | 3 (4.2%) | 14 (14.0%) |
| 5 to 9 Minutes | 9 (12.7%) | 11 (11.0%) |
| 10 to 14 Minutes | 7 (9.9%) | 53 (53.0%) |
| 15 to 19 Minutes | 38 (53.5%) | 11 (11.0%) |
| 20 to 24 Minutes | 6 (8.5%) | 2 (2.0%) |
| 25 to 29 Minutes | 2 (2.8%) | 0 (0.0%) |
| 30 to 34 Minutes | 0 (0.0%) | 6 (6.0%) |
| 35 to 39 Minutes | 6 (8.5%) | 0 (0.0%) |
| 40 to 44 Minutes | 0 (0.0%) | 3 (3.0%) |
| 45 to 59 Minutes | 0 (0.0%) | 0 (0.0%) |
| 60 to 89 Minutes | 0 (0.0%) | 0 (0.0%) |
| 90 or more Minutes | 0 (0.0%) | 0 (0.0%) |
Time of Departure to Work by Sex in Tiger
The most frequent times of departure to work in Tiger are 6:00 AM to 6:29 AM (22, 31.0%) for males and 10:00 AM to 10:59 AM (26, 26.0%) for females.
| Time of Departure | Male | Female |
| 12:00 AM to 4:59 AM | 0 (0.0%) | 10 (10.0%) |
| 5:00 AM to 5:29 AM | 0 (0.0%) | 0 (0.0%) |
| 5:30 AM to 5:59 AM | 11 (15.5%) | 0 (0.0%) |
| 6:00 AM to 6:29 AM | 22 (31.0%) | 0 (0.0%) |
| 6:30 AM to 6:59 AM | 2 (2.8%) | 6 (6.0%) |
| 7:00 AM to 7:29 AM | 7 (9.9%) | 10 (10.0%) |
| 7:30 AM to 7:59 AM | 5 (7.0%) | 10 (10.0%) |
| 8:00 AM to 8:29 AM | 6 (8.5%) | 19 (19.0%) |
| 8:30 AM to 8:59 AM | 3 (4.2%) | 0 (0.0%) |
| 9:00 AM to 9:59 AM | 9 (12.7%) | 9 (9.0%) |
| 10:00 AM to 10:59 AM | 0 (0.0%) | 26 (26.0%) |
| 11:00 AM to 11:59 AM | 0 (0.0%) | 0 (0.0%) |
| 12:00 PM to 3:59 PM | 0 (0.0%) | 4 (4.0%) |
| 4:00 PM to 11:59 PM | 6 (8.5%) | 6 (6.0%) |
| Total | 71 (100.0%) | 100 (100.0%) |
Housing Occupancy in Tiger
Occupancy by Ownership in Tiger
Of the total 195 dwellings in Tiger, owner-occupied units account for 128 (65.6%), while renter-occupied units make up 67 (34.4%).
| Occupancy | # Housing Units | % Housing Units |
| Owner Occupied Housing Units | 128 | 65.6% |
| Renter-Occupied Housing Units | 67 | 34.4% |
| Total Occupied Housing Units | 195 | 100.0% |
Occupancy by Household Size in Tiger
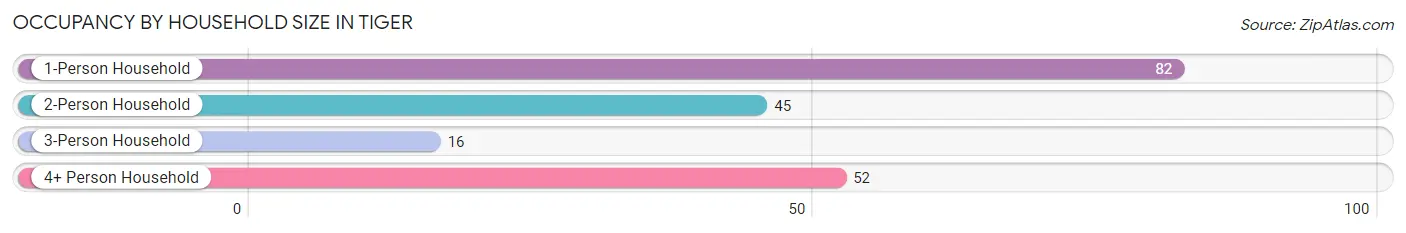
| Household Size | # Housing Units | % Housing Units |
| 1-Person Household | 82 | 42.0% |
| 2-Person Household | 45 | 23.1% |
| 3-Person Household | 16 | 8.2% |
| 4+ Person Household | 52 | 26.7% |
| Total Housing Units | 195 | 100.0% |
Occupancy by Ownership by Household Size in Tiger
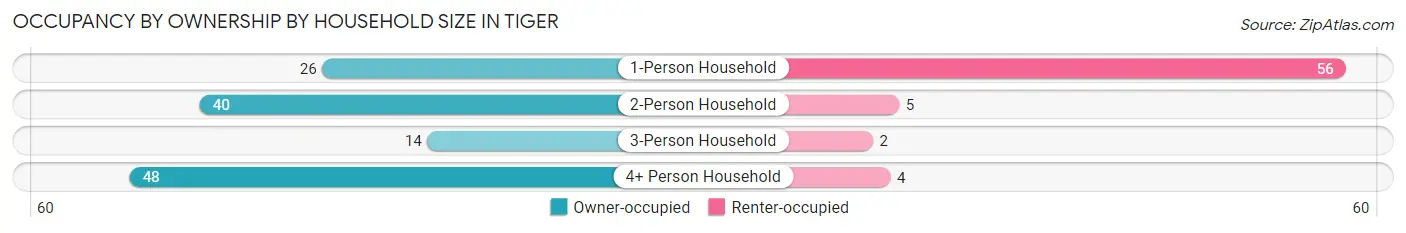
| Household Size | Owner-occupied | Renter-occupied |
| 1-Person Household | 26 (31.7%) | 56 (68.3%) |
| 2-Person Household | 40 (88.9%) | 5 (11.1%) |
| 3-Person Household | 14 (87.5%) | 2 (12.5%) |
| 4+ Person Household | 48 (92.3%) | 4 (7.7%) |
| Total Housing Units | 128 (65.6%) | 67 (34.4%) |
Occupancy by Educational Attainment in Tiger
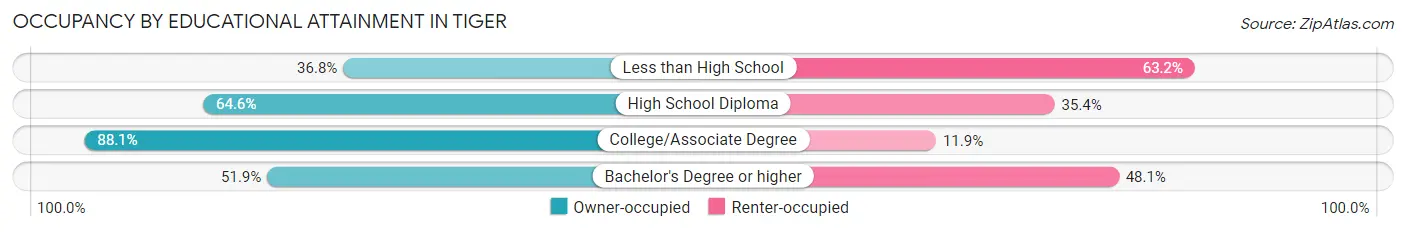
| Household Size | Owner-occupied | Renter-occupied |
| Less than High School | 7 (36.8%) | 12 (63.2%) |
| High School Diploma | 42 (64.6%) | 23 (35.4%) |
| College/Associate Degree | 52 (88.1%) | 7 (11.9%) |
| Bachelor's Degree or higher | 27 (51.9%) | 25 (48.1%) |
Occupancy by Age of Householder in Tiger
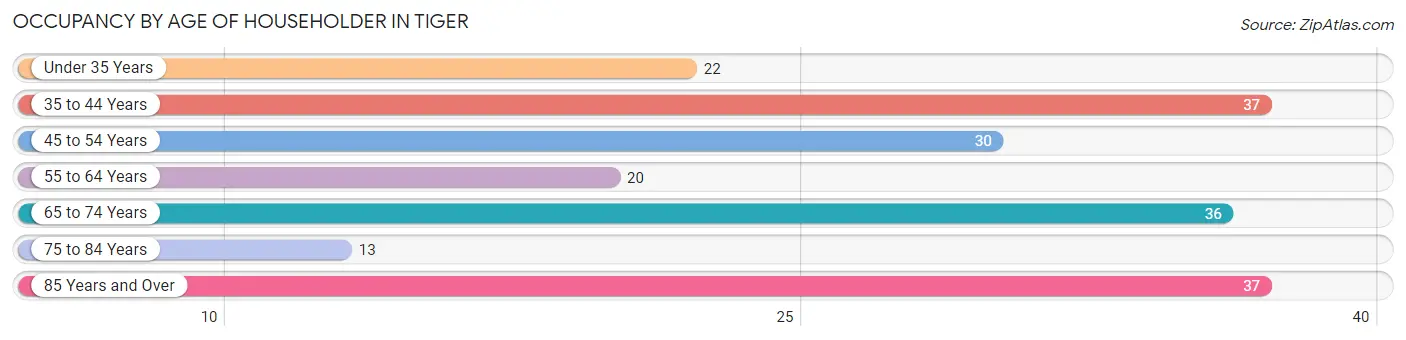
| Age Bracket | # Households | % Households |
| Under 35 Years | 22 | 11.3% |
| 35 to 44 Years | 37 | 19.0% |
| 45 to 54 Years | 30 | 15.4% |
| 55 to 64 Years | 20 | 10.3% |
| 65 to 74 Years | 36 | 18.5% |
| 75 to 84 Years | 13 | 6.7% |
| 85 Years and Over | 37 | 19.0% |
| Total | 195 | 100.0% |
Housing Finances in Tiger
Median Income by Occupancy in Tiger
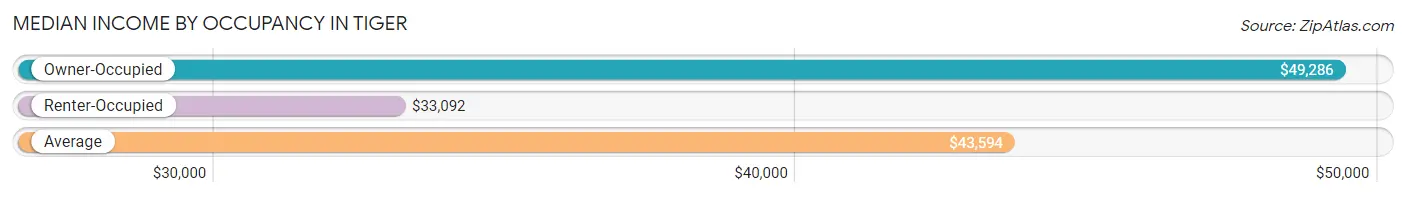
| Occupancy Type | # Households | Median Income |
| Owner-Occupied | 128 (65.6%) | $49,286 |
| Renter-Occupied | 67 (34.4%) | $33,092 |
| Average | 195 (100.0%) | $43,594 |
Occupancy by Householder Income Bracket in Tiger
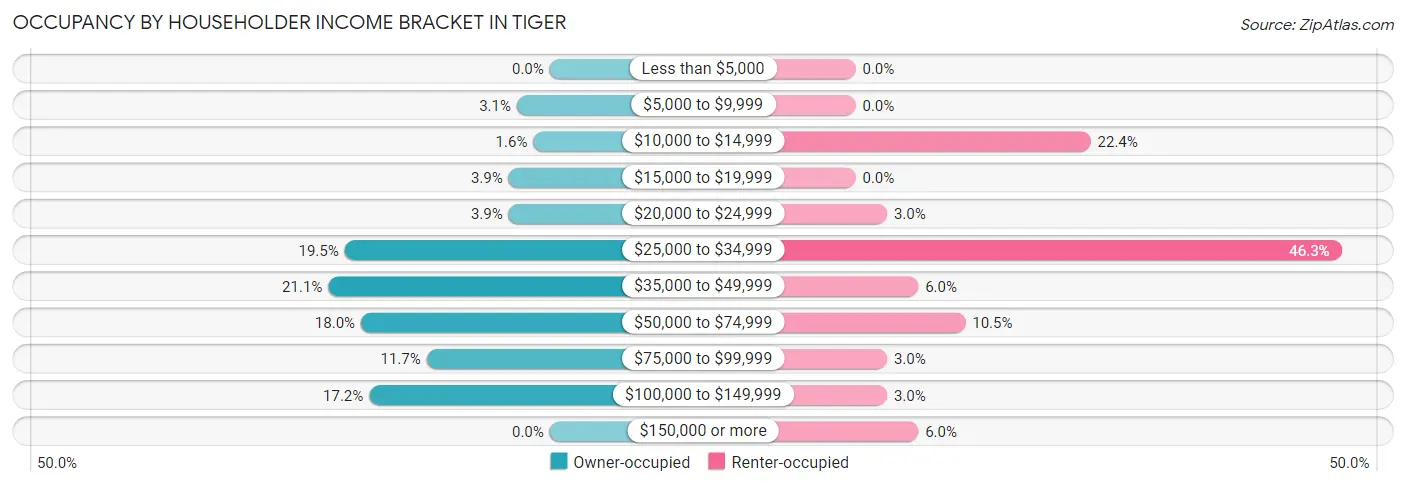
| Income Bracket | Owner-occupied | Renter-occupied |
| Less than $5,000 | 0 (0.0%) | 0 (0.0%) |
| $5,000 to $9,999 | 4 (3.1%) | 0 (0.0%) |
| $10,000 to $14,999 | 2 (1.6%) | 15 (22.4%) |
| $15,000 to $19,999 | 5 (3.9%) | 0 (0.0%) |
| $20,000 to $24,999 | 5 (3.9%) | 2 (3.0%) |
| $25,000 to $34,999 | 25 (19.5%) | 31 (46.3%) |
| $35,000 to $49,999 | 27 (21.1%) | 4 (6.0%) |
| $50,000 to $74,999 | 23 (18.0%) | 7 (10.4%) |
| $75,000 to $99,999 | 15 (11.7%) | 2 (3.0%) |
| $100,000 to $149,999 | 22 (17.2%) | 2 (3.0%) |
| $150,000 or more | 0 (0.0%) | 4 (6.0%) |
| Total | 128 (100.0%) | 67 (100.0%) |
Monthly Housing Cost Tiers in Tiger
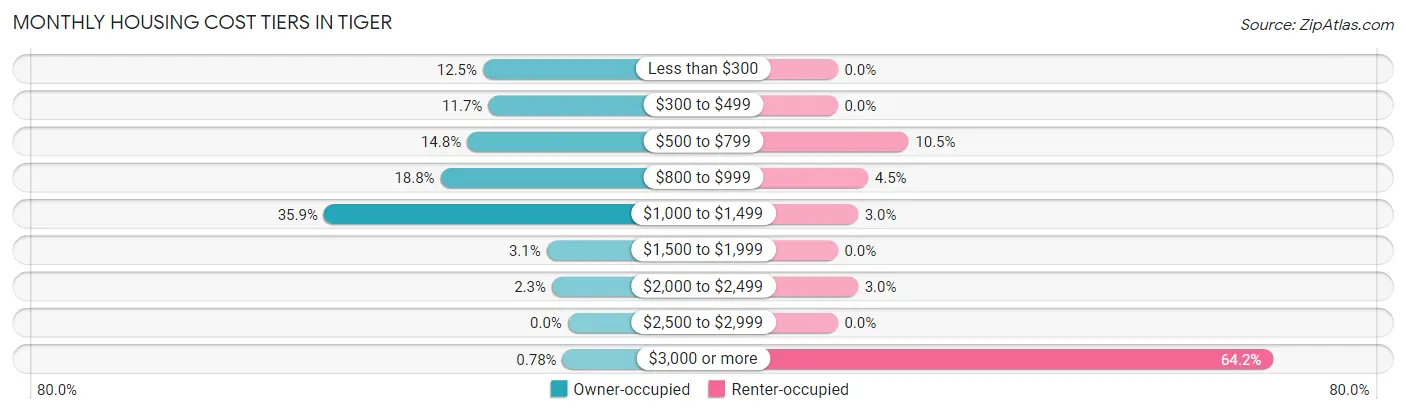
| Monthly Cost | Owner-occupied | Renter-occupied |
| Less than $300 | 16 (12.5%) | 0 (0.0%) |
| $300 to $499 | 15 (11.7%) | 0 (0.0%) |
| $500 to $799 | 19 (14.8%) | 7 (10.4%) |
| $800 to $999 | 24 (18.8%) | 3 (4.5%) |
| $1,000 to $1,499 | 46 (35.9%) | 2 (3.0%) |
| $1,500 to $1,999 | 4 (3.1%) | 0 (0.0%) |
| $2,000 to $2,499 | 3 (2.3%) | 2 (3.0%) |
| $2,500 to $2,999 | 0 (0.0%) | 0 (0.0%) |
| $3,000 or more | 1 (0.8%) | 43 (64.2%) |
| Total | 128 (100.0%) | 67 (100.0%) |
Physical Housing Characteristics in Tiger
Housing Structures in Tiger
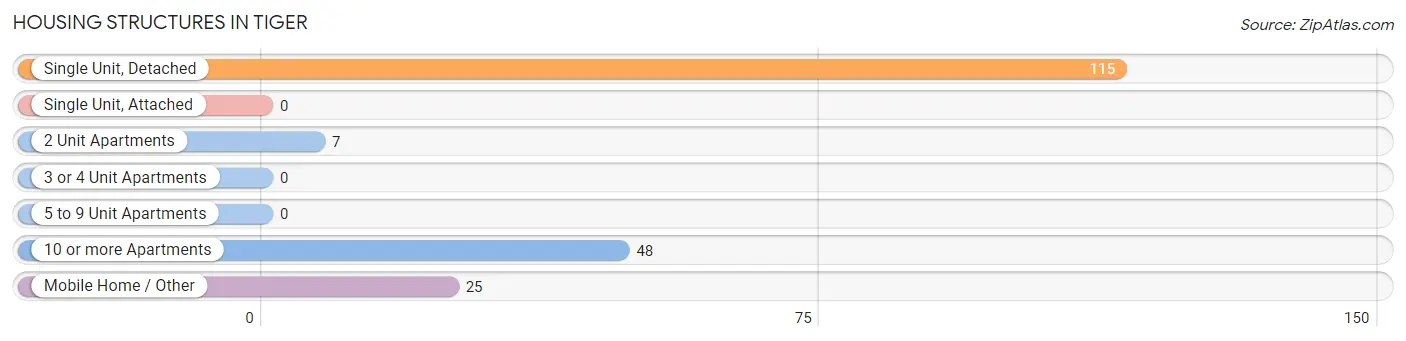
| Structure Type | # Housing Units | % Housing Units |
| Single Unit, Detached | 115 | 59.0% |
| Single Unit, Attached | 0 | 0.0% |
| 2 Unit Apartments | 7 | 3.6% |
| 3 or 4 Unit Apartments | 0 | 0.0% |
| 5 to 9 Unit Apartments | 0 | 0.0% |
| 10 or more Apartments | 48 | 24.6% |
| Mobile Home / Other | 25 | 12.8% |
| Total | 195 | 100.0% |
Housing Structures by Occupancy in Tiger
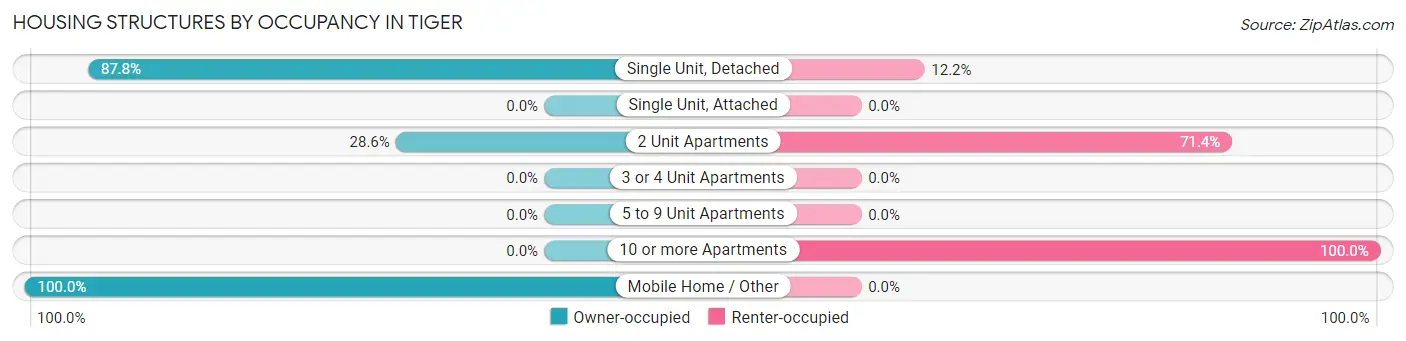
| Structure Type | Owner-occupied | Renter-occupied |
| Single Unit, Detached | 101 (87.8%) | 14 (12.2%) |
| Single Unit, Attached | 0 (0.0%) | 0 (0.0%) |
| 2 Unit Apartments | 2 (28.6%) | 5 (71.4%) |
| 3 or 4 Unit Apartments | 0 (0.0%) | 0 (0.0%) |
| 5 to 9 Unit Apartments | 0 (0.0%) | 0 (0.0%) |
| 10 or more Apartments | 0 (0.0%) | 48 (100.0%) |
| Mobile Home / Other | 25 (100.0%) | 0 (0.0%) |
| Total | 128 (65.6%) | 67 (34.4%) |
Housing Structures by Number of Rooms in Tiger
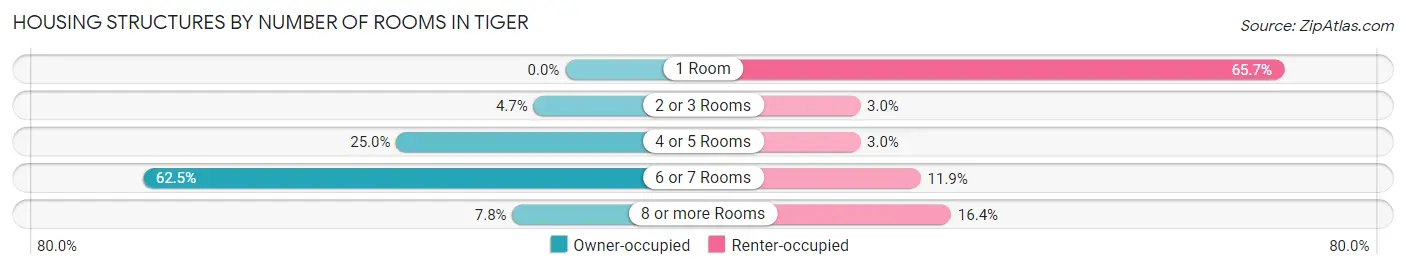
| Number of Rooms | Owner-occupied | Renter-occupied |
| 1 Room | 0 (0.0%) | 44 (65.7%) |
| 2 or 3 Rooms | 6 (4.7%) | 2 (3.0%) |
| 4 or 5 Rooms | 32 (25.0%) | 2 (3.0%) |
| 6 or 7 Rooms | 80 (62.5%) | 8 (11.9%) |
| 8 or more Rooms | 10 (7.8%) | 11 (16.4%) |
| Total | 128 (100.0%) | 67 (100.0%) |
Housing Structure by Heating Type in Tiger
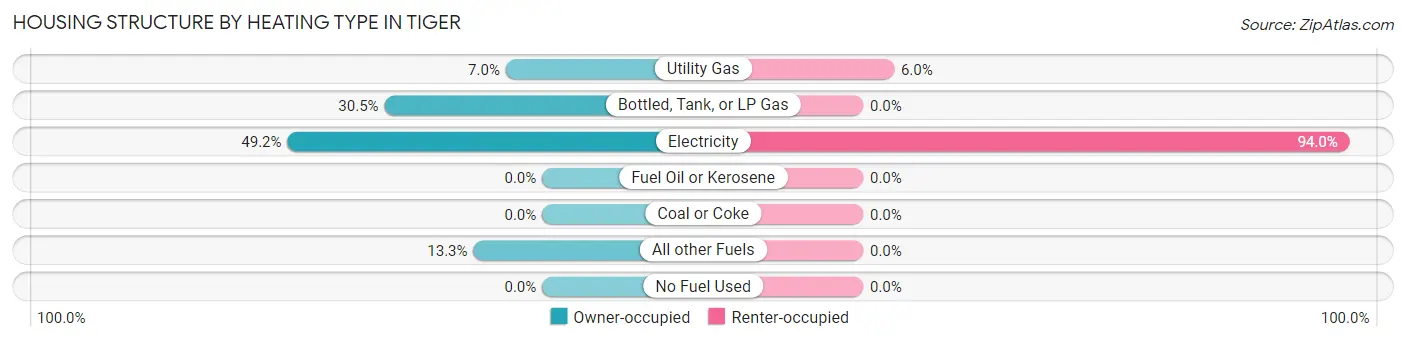
| Heating Type | Owner-occupied | Renter-occupied |
| Utility Gas | 9 (7.0%) | 4 (6.0%) |
| Bottled, Tank, or LP Gas | 39 (30.5%) | 0 (0.0%) |
| Electricity | 63 (49.2%) | 63 (94.0%) |
| Fuel Oil or Kerosene | 0 (0.0%) | 0 (0.0%) |
| Coal or Coke | 0 (0.0%) | 0 (0.0%) |
| All other Fuels | 17 (13.3%) | 0 (0.0%) |
| No Fuel Used | 0 (0.0%) | 0 (0.0%) |
| Total | 128 (100.0%) | 67 (100.0%) |
Household Vehicle Usage in Tiger
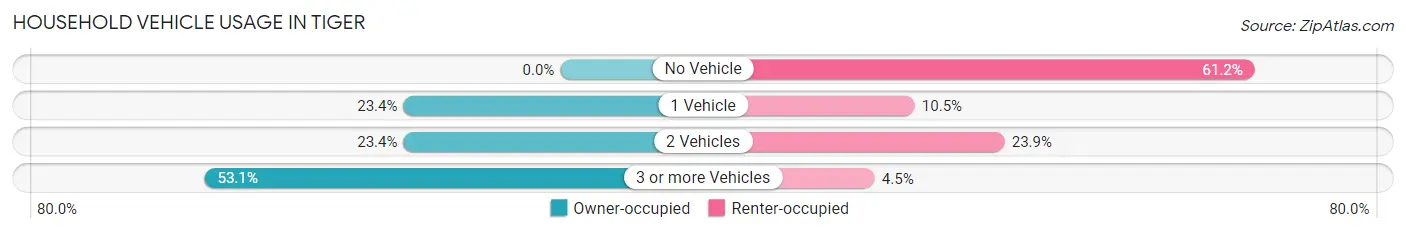
| Vehicles per Household | Owner-occupied | Renter-occupied |
| No Vehicle | 0 (0.0%) | 41 (61.2%) |
| 1 Vehicle | 30 (23.4%) | 7 (10.4%) |
| 2 Vehicles | 30 (23.4%) | 16 (23.9%) |
| 3 or more Vehicles | 68 (53.1%) | 3 (4.5%) |
| Total | 128 (100.0%) | 67 (100.0%) |
Real Estate & Mortgages in Tiger
Real Estate and Mortgage Overview in Tiger
| Characteristic | Without Mortgage | With Mortgage |
| Housing Units | 45 | 83 |
| Median Property Value | $122,900 | $198,200 |
| Median Household Income | $59,107 | $0 |
| Monthly Housing Costs | $384 | $1 |
| Real Estate Taxes | $933 | $0 |
Property Value by Mortgage Status in Tiger
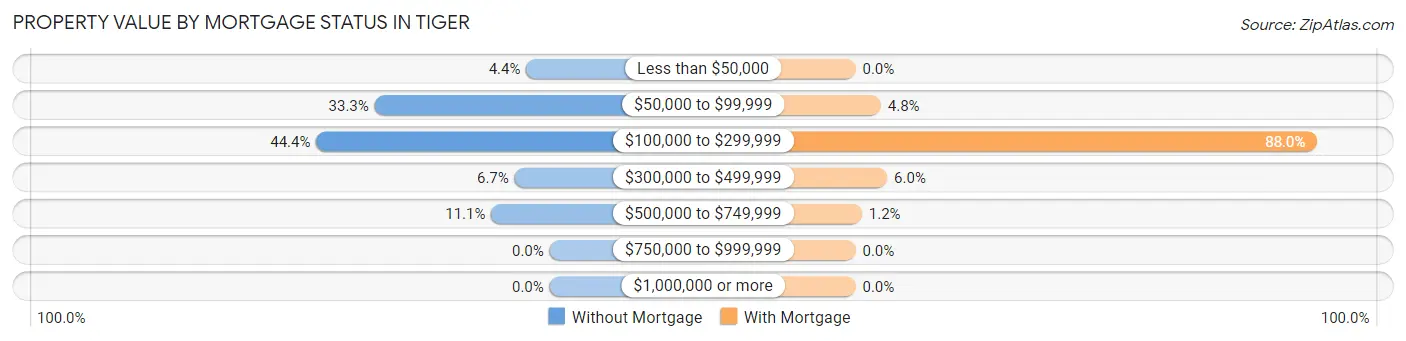
| Property Value | Without Mortgage | With Mortgage |
| Less than $50,000 | 2 (4.4%) | 0 (0.0%) |
| $50,000 to $99,999 | 15 (33.3%) | 4 (4.8%) |
| $100,000 to $299,999 | 20 (44.4%) | 73 (87.9%) |
| $300,000 to $499,999 | 3 (6.7%) | 5 (6.0%) |
| $500,000 to $749,999 | 5 (11.1%) | 1 (1.2%) |
| $750,000 to $999,999 | 0 (0.0%) | 0 (0.0%) |
| $1,000,000 or more | 0 (0.0%) | 0 (0.0%) |
| Total | 45 (100.0%) | 83 (100.0%) |
Household Income by Mortgage Status in Tiger
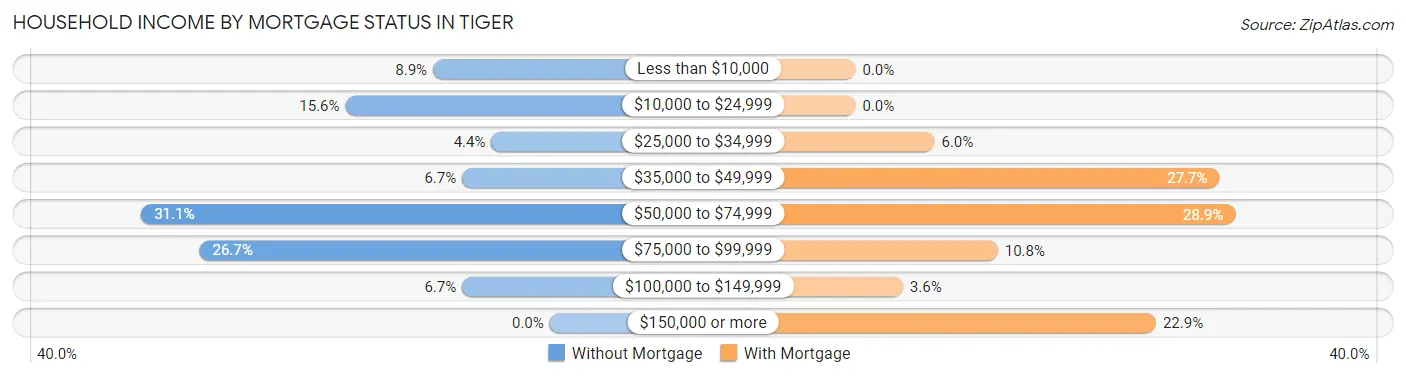
| Household Income | Without Mortgage | With Mortgage |
| Less than $10,000 | 4 (8.9%) | 0 (0.0%) |
| $10,000 to $24,999 | 7 (15.6%) | 0 (0.0%) |
| $25,000 to $34,999 | 2 (4.4%) | 5 (6.0%) |
| $35,000 to $49,999 | 3 (6.7%) | 23 (27.7%) |
| $50,000 to $74,999 | 14 (31.1%) | 24 (28.9%) |
| $75,000 to $99,999 | 12 (26.7%) | 9 (10.8%) |
| $100,000 to $149,999 | 3 (6.7%) | 3 (3.6%) |
| $150,000 or more | 0 (0.0%) | 19 (22.9%) |
| Total | 45 (100.0%) | 83 (100.0%) |
Property Value to Household Income Ratio in Tiger
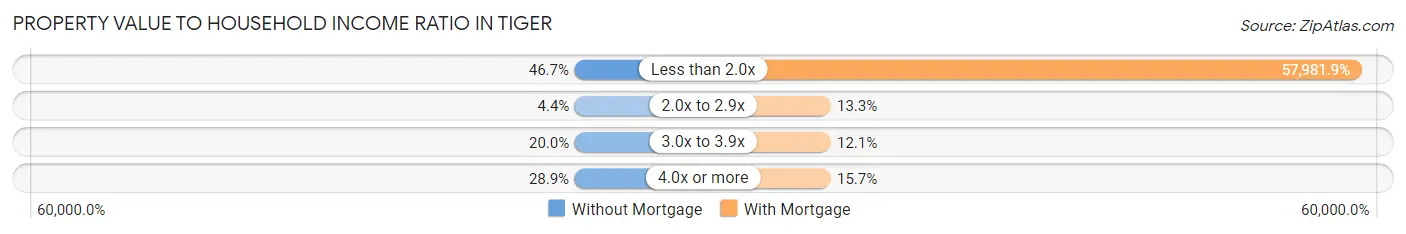
| Value-to-Income Ratio | Without Mortgage | With Mortgage |
| Less than 2.0x | 21 (46.7%) | 48,125 (57,981.9%) |
| 2.0x to 2.9x | 2 (4.4%) | 11 (13.3%) |
| 3.0x to 3.9x | 9 (20.0%) | 10 (12.0%) |
| 4.0x or more | 13 (28.9%) | 13 (15.7%) |
| Total | 45 (100.0%) | 83 (100.0%) |
Real Estate Taxes by Mortgage Status in Tiger
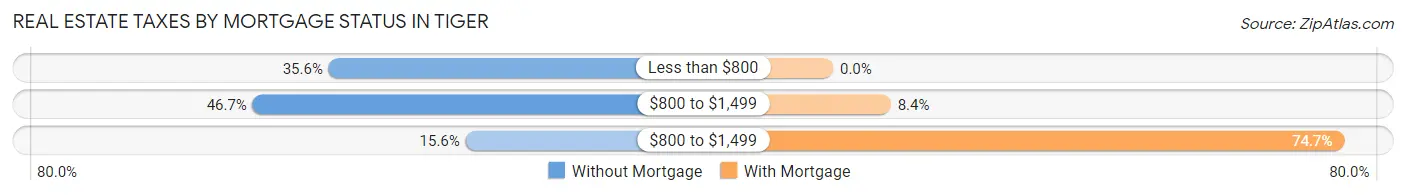
| Property Taxes | Without Mortgage | With Mortgage |
| Less than $800 | 16 (35.6%) | 0 (0.0%) |
| $800 to $1,499 | 21 (46.7%) | 7 (8.4%) |
| $800 to $1,499 | 7 (15.6%) | 62 (74.7%) |
| Total | 45 (100.0%) | 83 (100.0%) |
Health & Disability in Tiger
Health Insurance Coverage by Age in Tiger
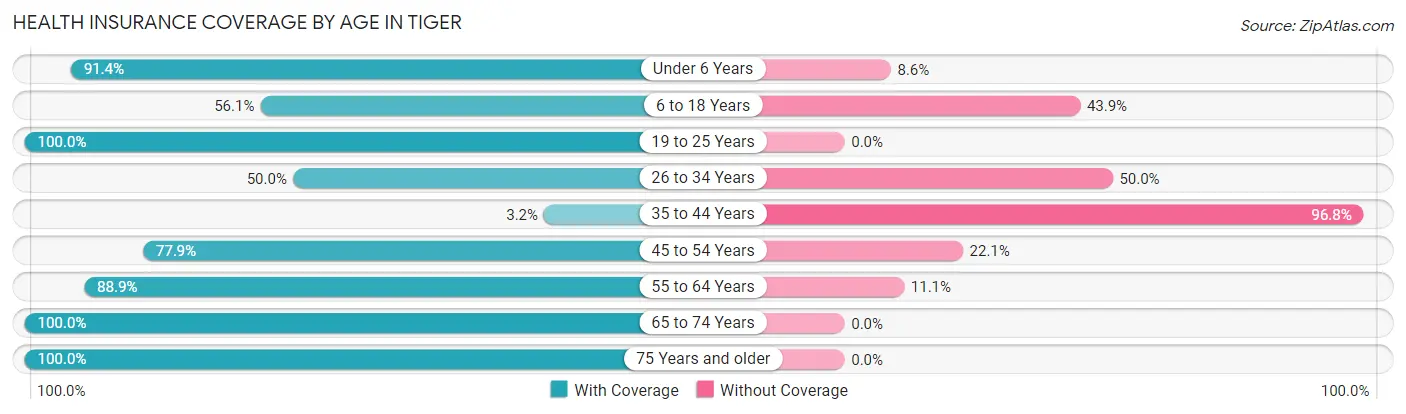
| Age Bracket | With Coverage | Without Coverage |
| Under 6 Years | 53 (91.4%) | 5 (8.6%) |
| 6 to 18 Years | 37 (56.1%) | 29 (43.9%) |
| 19 to 25 Years | 30 (100.0%) | 0 (0.0%) |
| 26 to 34 Years | 17 (50.0%) | 17 (50.0%) |
| 35 to 44 Years | 2 (3.2%) | 61 (96.8%) |
| 45 to 54 Years | 53 (77.9%) | 15 (22.1%) |
| 55 to 64 Years | 32 (88.9%) | 4 (11.1%) |
| 65 to 74 Years | 53 (100.0%) | 0 (0.0%) |
| 75 Years and older | 59 (100.0%) | 0 (0.0%) |
| Total | 336 (72.0%) | 131 (28.1%) |
Health Insurance Coverage by Citizenship Status in Tiger
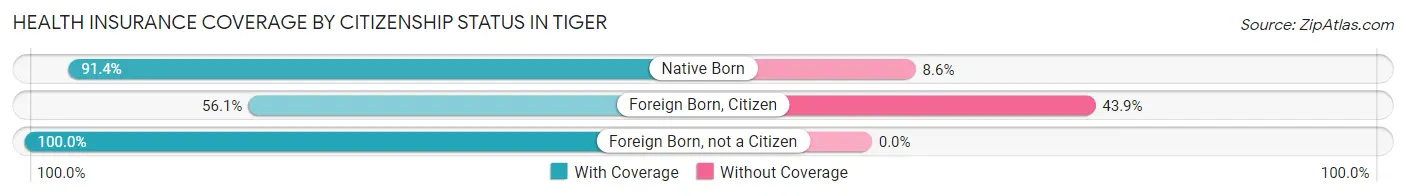
| Citizenship Status | With Coverage | Without Coverage |
| Native Born | 53 (91.4%) | 5 (8.6%) |
| Foreign Born, Citizen | 37 (56.1%) | 29 (43.9%) |
| Foreign Born, not a Citizen | 30 (100.0%) | 0 (0.0%) |
Health Insurance Coverage by Household Income in Tiger
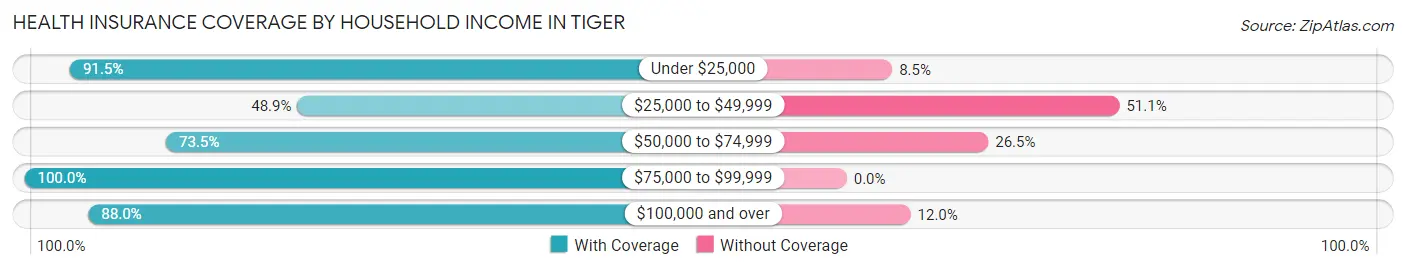
| Household Income | With Coverage | Without Coverage |
| Under $25,000 | 43 (91.5%) | 4 (8.5%) |
| $25,000 to $49,999 | 90 (48.9%) | 94 (51.1%) |
| $50,000 to $74,999 | 61 (73.5%) | 22 (26.5%) |
| $75,000 to $99,999 | 47 (100.0%) | 0 (0.0%) |
| $100,000 and over | 81 (88.0%) | 11 (12.0%) |
Public vs Private Health Insurance Coverage by Age in Tiger
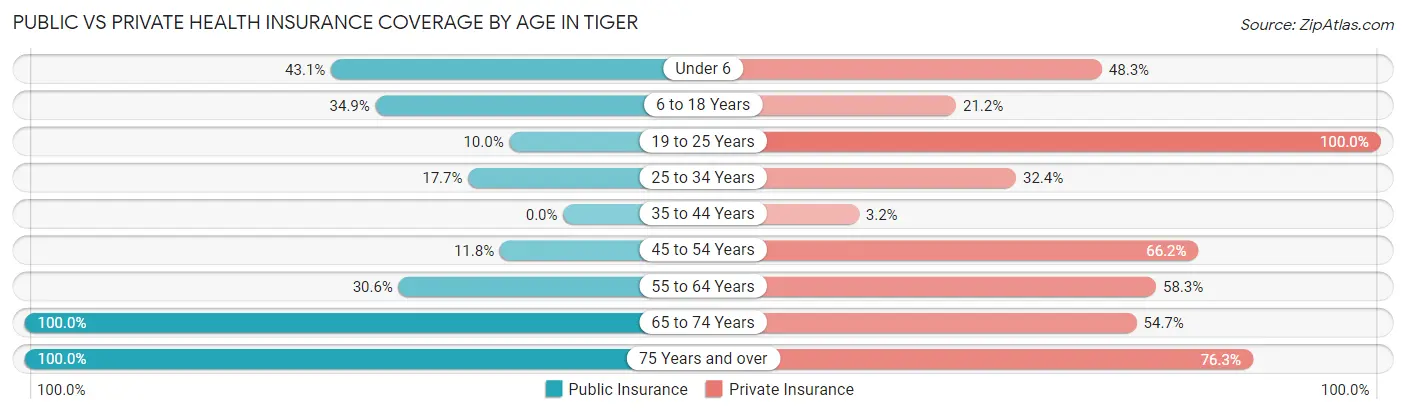
| Age Bracket | Public Insurance | Private Insurance |
| Under 6 | 25 (43.1%) | 28 (48.3%) |
| 6 to 18 Years | 23 (34.8%) | 14 (21.2%) |
| 19 to 25 Years | 3 (10.0%) | 30 (100.0%) |
| 25 to 34 Years | 6 (17.6%) | 11 (32.4%) |
| 35 to 44 Years | 0 (0.0%) | 2 (3.2%) |
| 45 to 54 Years | 8 (11.8%) | 45 (66.2%) |
| 55 to 64 Years | 11 (30.6%) | 21 (58.3%) |
| 65 to 74 Years | 53 (100.0%) | 29 (54.7%) |
| 75 Years and over | 59 (100.0%) | 45 (76.3%) |
| Total | 188 (40.3%) | 225 (48.2%) |
Disability Status by Sex by Age in Tiger
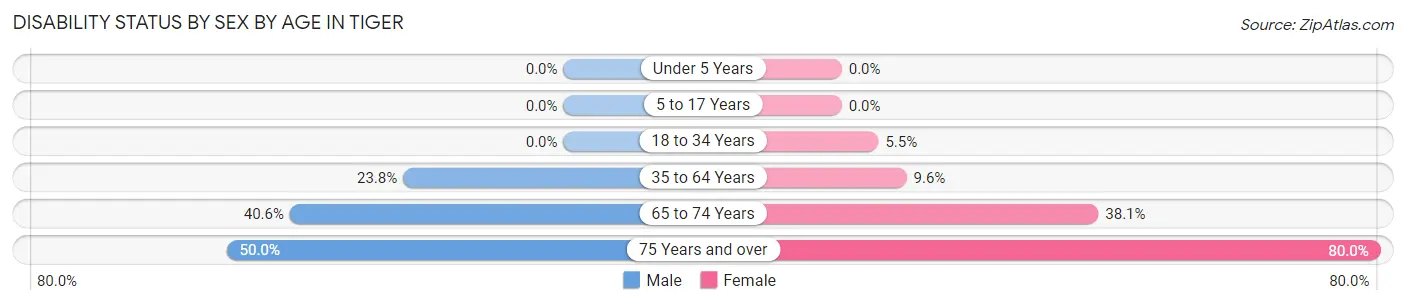
| Age Bracket | Male | Female |
| Under 5 Years | 0 (0.0%) | 0 (0.0%) |
| 5 to 17 Years | 0 (0.0%) | 0 (0.0%) |
| 18 to 34 Years | 0 (0.0%) | 3 (5.4%) |
| 35 to 64 Years | 15 (23.8%) | 10 (9.6%) |
| 65 to 74 Years | 13 (40.6%) | 8 (38.1%) |
| 75 Years and over | 2 (50.0%) | 44 (80.0%) |
Disability Class by Sex by Age in Tiger
Disability Class: Hearing Difficulty
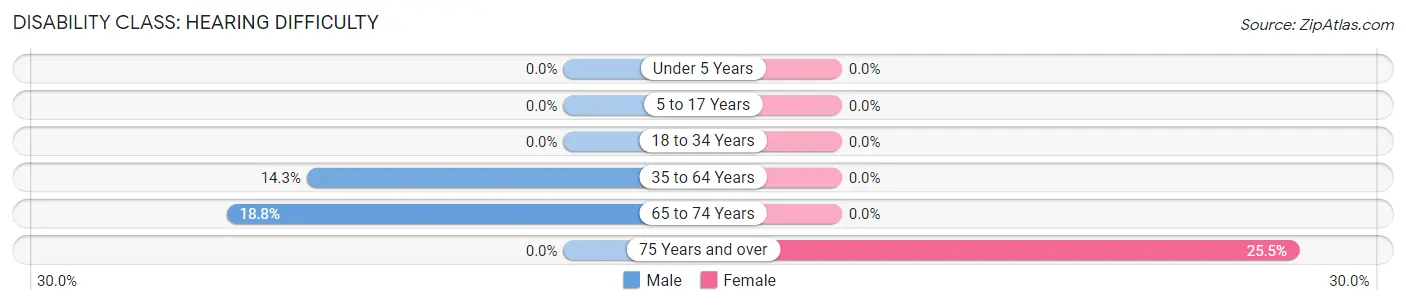
| Age Bracket | Male | Female |
| Under 5 Years | 0 (0.0%) | 0 (0.0%) |
| 5 to 17 Years | 0 (0.0%) | 0 (0.0%) |
| 18 to 34 Years | 0 (0.0%) | 0 (0.0%) |
| 35 to 64 Years | 9 (14.3%) | 0 (0.0%) |
| 65 to 74 Years | 6 (18.8%) | 0 (0.0%) |
| 75 Years and over | 0 (0.0%) | 14 (25.5%) |
Disability Class: Vision Difficulty
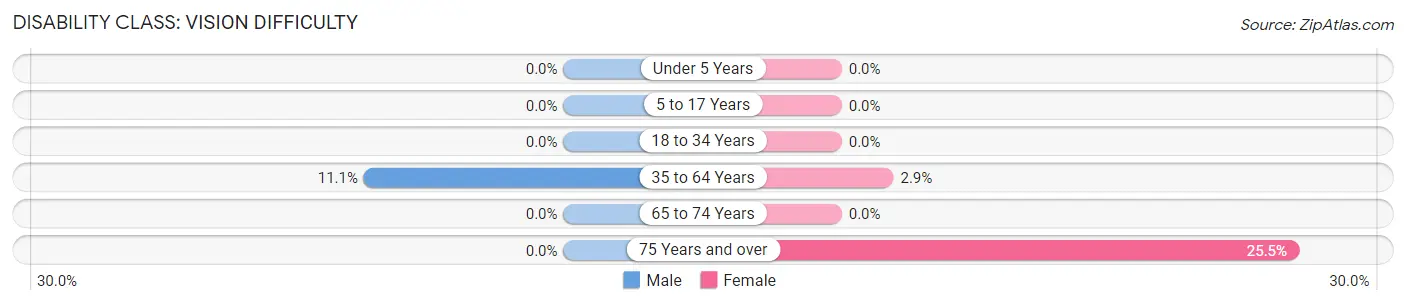
| Age Bracket | Male | Female |
| Under 5 Years | 0 (0.0%) | 0 (0.0%) |
| 5 to 17 Years | 0 (0.0%) | 0 (0.0%) |
| 18 to 34 Years | 0 (0.0%) | 0 (0.0%) |
| 35 to 64 Years | 7 (11.1%) | 3 (2.9%) |
| 65 to 74 Years | 0 (0.0%) | 0 (0.0%) |
| 75 Years and over | 0 (0.0%) | 14 (25.5%) |
Disability Class: Cognitive Difficulty
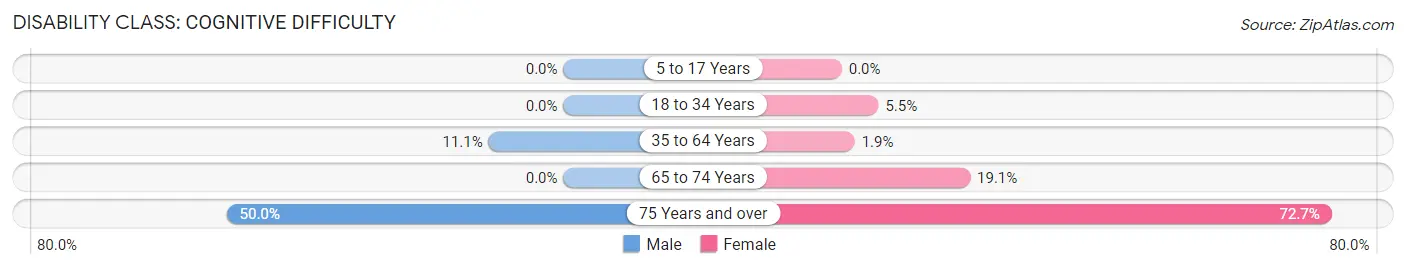
| Age Bracket | Male | Female |
| 5 to 17 Years | 0 (0.0%) | 0 (0.0%) |
| 18 to 34 Years | 0 (0.0%) | 3 (5.4%) |
| 35 to 64 Years | 7 (11.1%) | 2 (1.9%) |
| 65 to 74 Years | 0 (0.0%) | 4 (19.1%) |
| 75 Years and over | 2 (50.0%) | 40 (72.7%) |
Disability Class: Ambulatory Difficulty
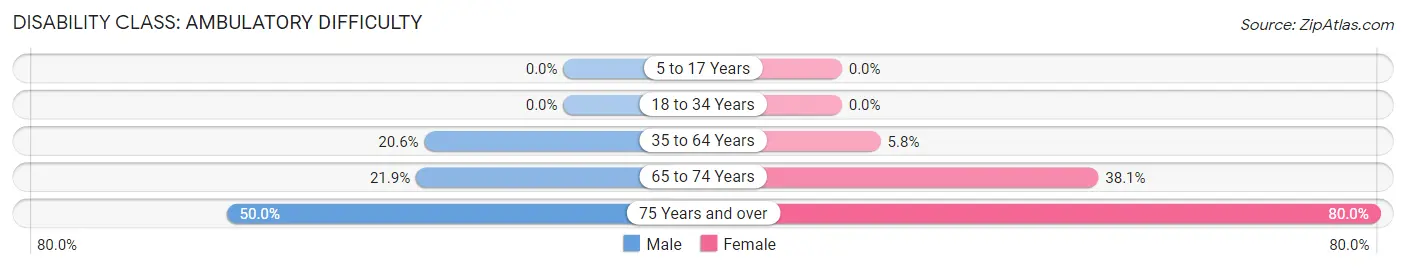
| Age Bracket | Male | Female |
| 5 to 17 Years | 0 (0.0%) | 0 (0.0%) |
| 18 to 34 Years | 0 (0.0%) | 0 (0.0%) |
| 35 to 64 Years | 13 (20.6%) | 6 (5.8%) |
| 65 to 74 Years | 7 (21.9%) | 8 (38.1%) |
| 75 Years and over | 2 (50.0%) | 44 (80.0%) |
Disability Class: Self-Care Difficulty
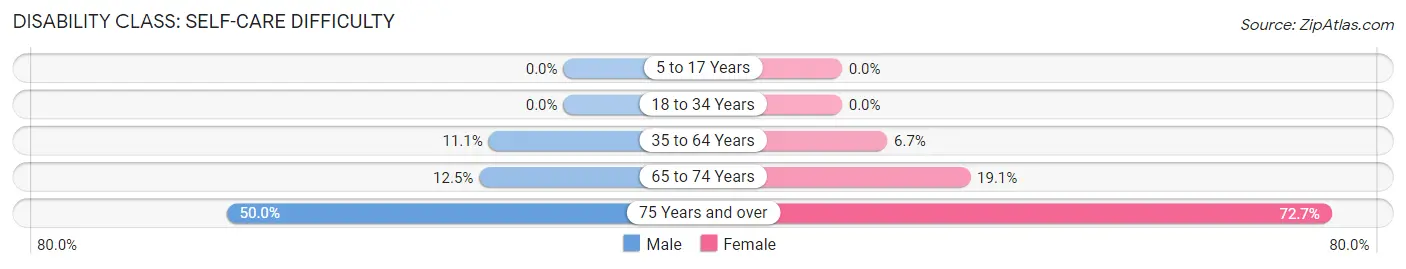
| Age Bracket | Male | Female |
| 5 to 17 Years | 0 (0.0%) | 0 (0.0%) |
| 18 to 34 Years | 0 (0.0%) | 0 (0.0%) |
| 35 to 64 Years | 7 (11.1%) | 7 (6.7%) |
| 65 to 74 Years | 4 (12.5%) | 4 (19.1%) |
| 75 Years and over | 2 (50.0%) | 40 (72.7%) |
Technology Access in Tiger
Computing Device Access in Tiger
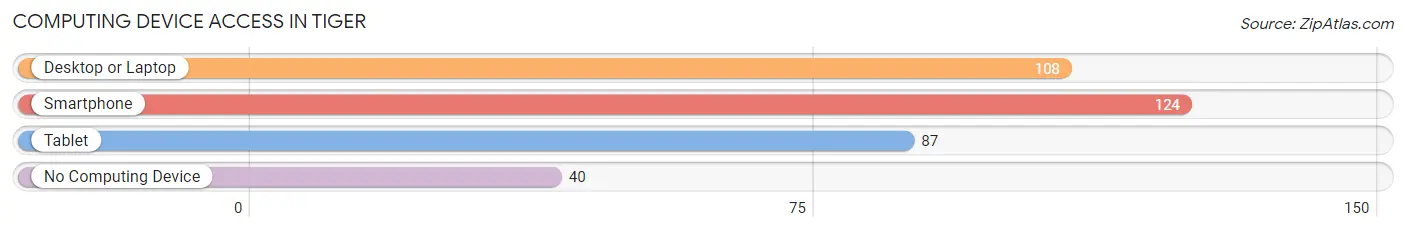
| Device Type | # Households | % Households |
| Desktop or Laptop | 108 | 55.4% |
| Smartphone | 124 | 63.6% |
| Tablet | 87 | 44.6% |
| No Computing Device | 40 | 20.5% |
| Total | 195 | 100.0% |
Internet Access in Tiger
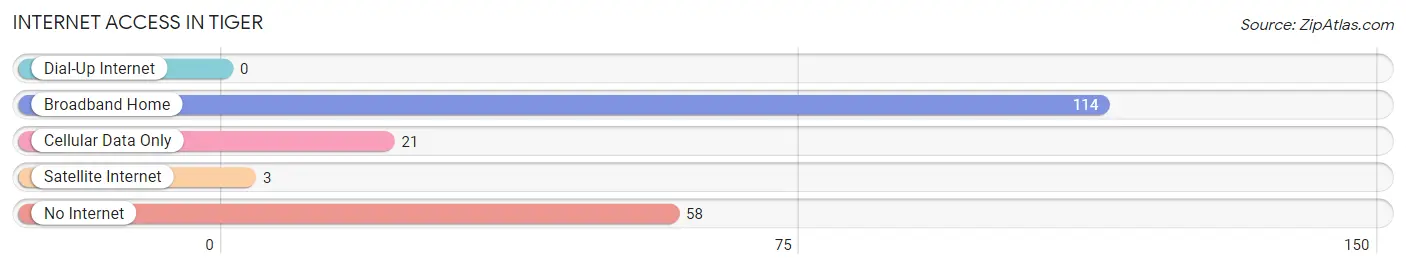
| Internet Type | # Households | % Households |
| Dial-Up Internet | 0 | 0.0% |
| Broadband Home | 114 | 58.5% |
| Cellular Data Only | 21 | 10.8% |
| Satellite Internet | 3 | 1.5% |
| No Internet | 58 | 29.7% |
| Total | 195 | 100.0% |
Tiger Summary
Tiger, Georgia is a small town located in Rabun County in the northeastern corner of the state. It is situated in the foothills of the Blue Ridge Mountains and is surrounded by the Chattahoochee National Forest. The town was founded in 1883 and was named after the nearby Tiger Creek. The population of Tiger was estimated to be around 1,000 people in 2000.
History
Tiger was founded in 1883 by a group of settlers from North Carolina. The town was named after the nearby Tiger Creek, which was named for the wild tigers that were once found in the area. The town was originally a farming community, but it soon became a popular tourist destination due to its proximity to the Chattahoochee National Forest.
In the early 1900s, the town began to grow and develop. The first school was built in 1910 and the first post office was established in 1911. The town also had a general store, a blacksmith shop, and a grist mill.
In the 1920s, the town began to experience a period of growth and prosperity. The population increased from around 200 people in 1920 to over 1,000 people in 1930. During this time, the town was home to several businesses, including a sawmill, a furniture factory, and a canning factory.
Geography
Tiger is located in the foothills of the Blue Ridge Mountains in Rabun County. The town is situated at an elevation of 1,400 feet and is surrounded by the Chattahoochee National Forest. The town is located near the headwaters of the Chattooga River, which is a popular destination for whitewater rafting and kayaking.
The town is located approximately 30 miles from the city of Clayton and is about an hour and a half drive from Atlanta. The nearest major airport is the Hartsfield-Jackson Atlanta International Airport, which is located about two hours away.
Economy
The economy of Tiger is largely based on tourism. The town is a popular destination for outdoor activities such as hiking, camping, fishing, and whitewater rafting. The town is also home to several businesses, including a sawmill, a furniture factory, and a canning factory.
The town is also home to several small businesses, including restaurants, shops, and galleries. The town is also home to several bed and breakfasts, which attract visitors from all over the world.
Demographics
The population of Tiger was estimated to be around 1,000 people in 2000. The town is predominantly white, with around 95% of the population being Caucasian. The median household income in the town is around $30,000, which is slightly lower than the state average. The town has a low unemployment rate and a high rate of home ownership.
Common Questions
What is the Total Population of Tiger?
Total Population of Tiger is 549.
What is the Total Male Population of Tiger?
Total Male Population of Tiger is 194.
What is the Total Female Population of Tiger?
Total Female Population of Tiger is 355.
What is the Ratio of Males per 100 Females in Tiger?
There are 54.65 Males per 100 Females in Tiger.
What is the Ratio of Females per 100 Males in Tiger?
There are 182.99 Females per 100 Males in Tiger.
What is the Median Population Age in Tiger?
Median Population Age in Tiger is 47.5 Years.
What is the Average Family Size in Tiger
Average Family Size in Tiger is 3.3 People.
What is the Average Household Size in Tiger
Average Household Size in Tiger is 2.3 People.
What is Per Capita Income in Tiger?
Per Capita income in Tiger is $20,334.
What is the Median Family Income in Tiger?
Median Family Income in Tiger is $48,304.
What is the Median Household income in Tiger?
Median Household Income in Tiger is $43,594.
What is Income or Wage Gap in Tiger?
Income or Wage Gap in Tiger is 39.1%.
Women in Tiger earn 60.9 cents for every dollar earned by a man.
What is Inequality or Gini Index in Tiger?
Inequality or Gini Index in Tiger is 0.36.
How Large is the Labor Force in Tiger?
There are 181 People in the Labor Forcein in Tiger.
What is the Percentage of People in the Labor Force in Tiger?
38.9% of People are in the Labor Force in Tiger.
What is the Unemployment Rate in Tiger?
Unemployment Rate in Tiger is 1.7%.