Scotch-Irish vs Russian Disability Age 18 to 34
COMPARE
Scotch-Irish
Russian
Disability Age 18 to 34
Disability Age 18 to 34 Comparison
Scotch-Irish
Russians
7.8%
DISABILITY AGE 18 TO 34
0.0/ 100
METRIC RATING
307th/ 347
METRIC RANK
6.5%
DISABILITY AGE 18 TO 34
60.2/ 100
METRIC RATING
169th/ 347
METRIC RANK
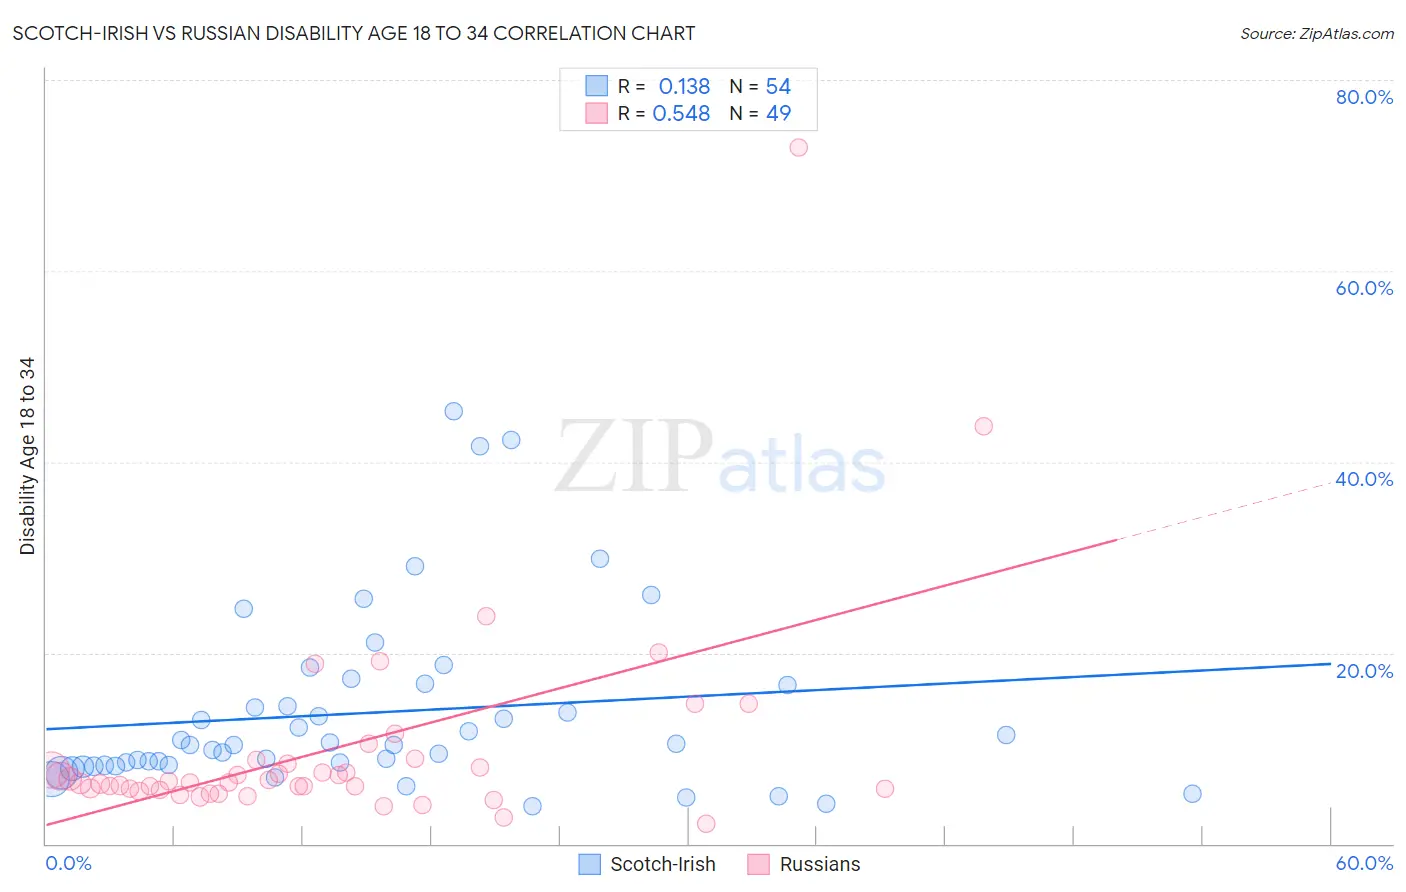
Scotch-Irish vs Russian Disability Age 18 to 34 Correlation Chart
The statistical analysis conducted on geographies consisting of 544,079,261 people shows a poor positive correlation between the proportion of Scotch-Irish and percentage of population with a disability between the ages 18 and 35 in the United States with a correlation coefficient (R) of 0.138 and weighted average of 7.8%. Similarly, the statistical analysis conducted on geographies consisting of 509,184,365 people shows a substantial positive correlation between the proportion of Russians and percentage of population with a disability between the ages 18 and 35 in the United States with a correlation coefficient (R) of 0.548 and weighted average of 6.5%, a difference of 19.2%.
Disability Age 18 to 34 Correlation Summary
| Measurement | Scotch-Irish | Russian |
| Minimum | 3.9% | 2.1% |
| Maximum | 45.2% | 72.9% |
| Range | 41.3% | 70.8% |
| Mean | 13.7% | 10.0% |
| Median | 10.4% | 6.4% |
| Interquartile 25% (IQ1) | 8.2% | 5.7% |
| Interquartile 75% (IQ3) | 16.7% | 8.6% |
| Interquartile Range (IQR) | 8.4% | 2.9% |
| Standard Deviation (Sample) | 9.4% | 11.4% |
| Standard Deviation (Population) | 9.4% | 11.3% |
Similar Demographics by Disability Age 18 to 34
Demographics Similar to Scotch-Irish by Disability Age 18 to 34
In terms of disability age 18 to 34, the demographic groups most similar to Scotch-Irish are Pennsylvania German (7.8%, a difference of 0.030%), Alaska Native (7.8%, a difference of 0.040%), Finnish (7.8%, a difference of 0.10%), English (7.8%, a difference of 0.26%), and Menominee (7.8%, a difference of 0.34%).
| Demographics | Rating | Rank | Disability Age 18 to 34 |
| Scottish | 0.0 /100 | #300 | Tragic 7.7% |
| Pima | 0.0 /100 | #301 | Tragic 7.7% |
| Welsh | 0.0 /100 | #302 | Tragic 7.7% |
| Cheyenne | 0.0 /100 | #303 | Tragic 7.7% |
| Shoshone | 0.0 /100 | #304 | Tragic 7.8% |
| Menominee | 0.0 /100 | #305 | Tragic 7.8% |
| English | 0.0 /100 | #306 | Tragic 7.8% |
| Scotch-Irish | 0.0 /100 | #307 | Tragic 7.8% |
| Pennsylvania Germans | 0.0 /100 | #308 | Tragic 7.8% |
| Alaska Natives | 0.0 /100 | #309 | Tragic 7.8% |
| Finns | 0.0 /100 | #310 | Tragic 7.8% |
| French | 0.0 /100 | #311 | Tragic 7.9% |
| Spanish Americans | 0.0 /100 | #312 | Tragic 7.9% |
| Iroquois | 0.0 /100 | #313 | Tragic 7.9% |
| Colville | 0.0 /100 | #314 | Tragic 7.9% |
Demographics Similar to Russians by Disability Age 18 to 34
In terms of disability age 18 to 34, the demographic groups most similar to Russians are Immigrants from Bahamas (6.6%, a difference of 0.17%), Immigrants from Moldova (6.5%, a difference of 0.21%), Immigrants from Northern Europe (6.5%, a difference of 0.29%), Bahamian (6.6%, a difference of 0.34%), and Eastern European (6.5%, a difference of 0.37%).
| Demographics | Rating | Rank | Disability Age 18 to 34 |
| South Africans | 71.7 /100 | #162 | Good 6.5% |
| Immigrants | Denmark | 71.7 /100 | #163 | Good 6.5% |
| Immigrants | Nigeria | 70.4 /100 | #164 | Good 6.5% |
| Immigrants | Hungary | 69.6 /100 | #165 | Good 6.5% |
| Eastern Europeans | 65.1 /100 | #166 | Good 6.5% |
| Immigrants | Northern Europe | 64.1 /100 | #167 | Good 6.5% |
| Immigrants | Moldova | 63.1 /100 | #168 | Good 6.5% |
| Russians | 60.2 /100 | #169 | Good 6.5% |
| Immigrants | Bahamas | 57.9 /100 | #170 | Average 6.6% |
| Bahamians | 55.5 /100 | #171 | Average 6.6% |
| Ghanaians | 54.7 /100 | #172 | Average 6.6% |
| Immigrants | Mexico | 54.1 /100 | #173 | Average 6.6% |
| Native Hawaiians | 50.0 /100 | #174 | Average 6.6% |
| Immigrants | Cambodia | 46.5 /100 | #175 | Average 6.6% |
| Immigrants | Africa | 45.9 /100 | #176 | Average 6.6% |