Cities with the Highest Percentage of Population with a Degree in Communications in North Dakota
RELATED REPORTS & OPTIONS
Communications
North Dakota
Compare Cities
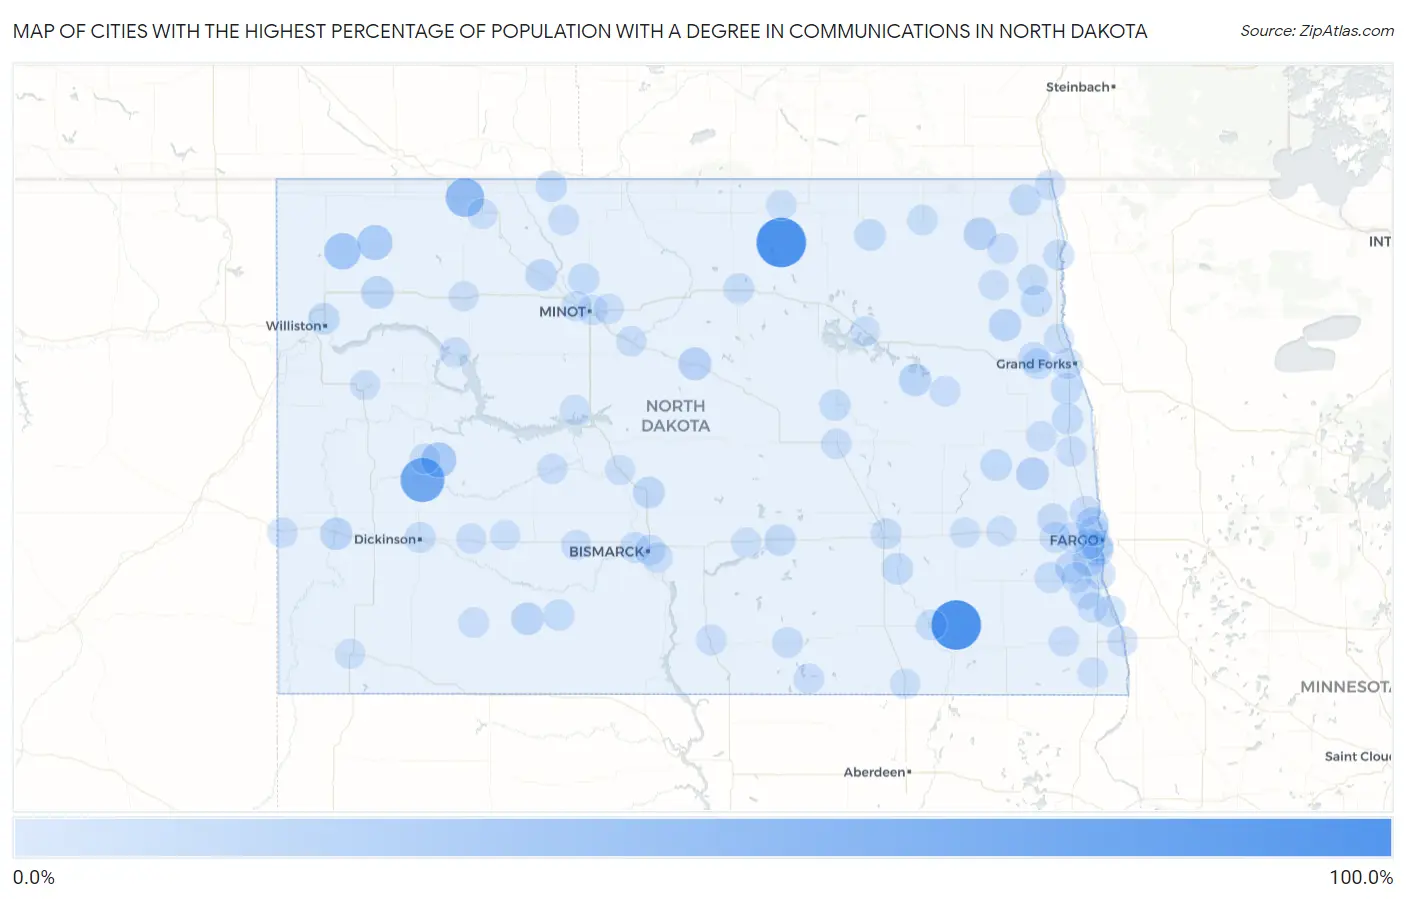
Map of Cities with the Highest Percentage of Population with a Degree in Communications in North Dakota
0.0%
100.0%
Cities with the Highest Percentage of Population with a Degree in Communications in North Dakota
| City | % Graduates | vs State | vs National | |
| 1. | Verona | 100.0% | 3.4%(+96.6)#1 | 4.1%(+95.9)#15 |
| 2. | Mylo | 100.0% | 3.4%(+96.6)#2 | 4.1%(+95.9)#25 |
| 3. | Manning | 70.6% | 3.4%(+67.2)#3 | 4.1%(+66.5)#39 |
| 4. | Flaxton | 42.9% | 3.4%(+39.5)#4 | 4.1%(+38.7)#124 |
| 5. | Alamo | 30.8% | 3.4%(+27.4)#5 | 4.1%(+26.6)#218 |
| 6. | Dunn Center | 25.0% | 3.4%(+21.6)#6 | 4.1%(+20.9)#307 |
| 7. | Wildrose | 24.0% | 3.4%(+20.6)#7 | 4.1%(+19.9)#340 |
| 8. | Drake | 14.3% | 3.4%(+10.9)#8 | 4.1%(+10.2)#828 |
| 9. | Mountain | 13.3% | 3.4%(+9.96)#9 | 4.1%(+9.20)#939 |
| 10. | Galesburg | 13.3% | 3.4%(+9.96)#10 | 4.1%(+9.20)#940 |
| 11. | Ray | 12.6% | 3.4%(+9.27)#11 | 4.1%(+8.51)#1,032 |
| 12. | Harwood | 12.2% | 3.4%(+8.83)#12 | 4.1%(+8.07)#1,108 |
| 13. | Elgin | 12.0% | 3.4%(+8.66)#13 | 4.1%(+7.90)#1,125 |
| 14. | Medora | 11.4% | 3.4%(+8.05)#14 | 4.1%(+7.29)#1,248 |
| 15. | Tolna | 11.1% | 3.4%(+7.74)#15 | 4.1%(+6.98)#1,311 |
| 16. | Inkster | 11.1% | 3.4%(+7.74)#16 | 4.1%(+6.98)#1,322 |
| 17. | Prairie Rose | 10.0% | 3.4%(+6.63)#17 | 4.1%(+5.86)#1,601 |
| 18. | Horace | 9.2% | 3.4%(+5.79)#18 | 4.1%(+5.03)#1,846 |
| 19. | Davenport | 8.3% | 3.4%(+4.96)#19 | 4.1%(+4.20)#2,203 |
| 20. | Carpio | 8.3% | 3.4%(+4.96)#20 | 4.1%(+4.20)#2,211 |
| 21. | Wilton | 8.3% | 3.4%(+4.88)#21 | 4.1%(+4.12)#2,238 |
| 22. | Hope | 7.4% | 3.4%(+4.03)#22 | 4.1%(+3.27)#2,709 |
| 23. | Montpelier | 7.4% | 3.4%(+4.03)#23 | 4.1%(+3.27)#2,716 |
| 24. | Williston | 7.3% | 3.4%(+3.95)#24 | 4.1%(+3.19)#2,777 |
| 25. | Munich | 6.9% | 3.4%(+3.57)#25 | 4.1%(+2.81)#3,084 |
| 26. | Tappen | 6.7% | 3.4%(+3.29)#26 | 4.1%(+2.53)#3,349 |
| 27. | Bathgate | 6.7% | 3.4%(+3.29)#27 | 4.1%(+2.53)#3,364 |
| 28. | Minot Afb | 6.3% | 3.4%(+2.89)#28 | 4.1%(+2.13)#3,728 |
| 29. | Abercrombie | 6.2% | 3.4%(+2.88)#29 | 4.1%(+2.11)#3,773 |
| 30. | Buxton | 5.9% | 3.4%(+2.51)#30 | 4.1%(+1.75)#4,173 |
| 31. | Carson | 5.7% | 3.4%(+2.34)#31 | 4.1%(+1.58)#4,388 |
| 32. | Sherwood | 5.7% | 3.4%(+2.29)#32 | 4.1%(+1.53)#4,456 |
| 33. | Minto | 5.6% | 3.4%(+2.18)#33 | 4.1%(+1.42)#4,604 |
| 34. | New Rockford | 5.4% | 3.4%(+1.98)#34 | 4.1%(+1.22)#4,894 |
| 35. | Thompson | 5.3% | 3.4%(+1.89)#35 | 4.1%(+1.13)#5,031 |
| 36. | Fargo | 5.0% | 3.4%(+1.64)#36 | 4.1%(+0.876)#5,438 |
| 37. | Dickinson | 4.6% | 3.4%(+1.26)#37 | 4.1%(+0.502)#6,146 |
| 38. | Lamoure | 4.4% | 3.4%(+1.06)#38 | 4.1%(+0.295)#6,591 |
| 39. | Jamestown | 4.4% | 3.4%(+0.990)#39 | 4.1%(+0.229)#6,734 |
| 40. | Casselton | 4.4% | 3.4%(+0.980)#40 | 4.1%(+0.219)#6,750 |
| 41. | Drayton | 4.3% | 3.4%(+0.942)#41 | 4.1%(+0.182)#6,840 |
| 42. | Grafton | 4.1% | 3.4%(+0.775)#42 | 4.1%(+0.014)#7,237 |
| 43. | Oxbow | 4.0% | 3.4%(+0.599)#43 | 4.1%(-0.161)#7,629 |
| 44. | Mandan | 3.8% | 3.4%(+0.439)#44 | 4.1%(-0.322)#7,998 |
| 45. | West Fargo | 3.6% | 3.4%(+0.223)#45 | 4.1%(-0.538)#8,478 |
| 46. | Grand Forks Afb | 3.5% | 3.4%(+0.169)#46 | 4.1%(-0.592)#8,618 |
| 47. | Leonard | 3.5% | 3.4%(+0.134)#47 | 4.1%(-0.626)#8,716 |
| 48. | Amenia | 3.4% | 3.4%(+0.074)#48 | 4.1%(-0.687)#8,880 |
| 49. | Wishek | 3.4% | 3.4%(-0.019)#49 | 4.1%(-0.779)#9,093 |
| 50. | Emerado | 3.3% | 3.4%(-0.041)#50 | 4.1%(-0.802)#9,160 |
| 51. | Rugby | 3.2% | 3.4%(-0.154)#51 | 4.1%(-0.914)#9,455 |
| 52. | Grand Forks | 3.2% | 3.4%(-0.179)#52 | 4.1%(-0.940)#9,514 |
| 53. | Crystal | 3.1% | 3.4%(-0.249)#53 | 4.1%(-1.01)#9,688 |
| 54. | Bismarck | 3.1% | 3.4%(-0.282)#54 | 4.1%(-1.04)#9,757 |
| 55. | Argusville | 3.0% | 3.4%(-0.331)#55 | 4.1%(-1.09)#9,883 |
| 56. | Langdon | 3.0% | 3.4%(-0.416)#56 | 4.1%(-1.18)#10,111 |
| 57. | Kindred | 2.9% | 3.4%(-0.433)#57 | 4.1%(-1.19)#10,168 |
| 58. | Linton | 2.9% | 3.4%(-0.504)#58 | 4.1%(-1.26)#10,349 |
| 59. | Mohall | 2.8% | 3.4%(-0.544)#59 | 4.1%(-1.30)#10,465 |
| 60. | Pembina | 2.8% | 3.4%(-0.597)#60 | 4.1%(-1.36)#10,599 |
| 61. | Hillsboro | 2.7% | 3.4%(-0.638)#61 | 4.1%(-1.40)#10,706 |
| 62. | Mcville | 2.7% | 3.4%(-0.672)#62 | 4.1%(-1.43)#10,792 |
| 63. | Walcott | 2.5% | 3.4%(-0.874)#63 | 4.1%(-1.64)#11,295 |
| 64. | Minot | 2.2% | 3.4%(-1.17)#64 | 4.1%(-1.93)#12,049 |
| 65. | Wahpeton | 2.2% | 3.4%(-1.19)#65 | 4.1%(-1.95)#12,092 |
| 66. | New Town | 2.1% | 3.4%(-1.29)#66 | 4.1%(-2.05)#12,332 |
| 67. | Killdeer | 2.1% | 3.4%(-1.29)#67 | 4.1%(-2.05)#12,351 |
| 68. | Lincoln | 2.1% | 3.4%(-1.32)#68 | 4.1%(-2.08)#12,424 |
| 69. | Ashley | 2.0% | 3.4%(-1.35)#69 | 4.1%(-2.11)#12,505 |
| 70. | Beach | 2.0% | 3.4%(-1.38)#70 | 4.1%(-2.14)#12,579 |
| 71. | Carrington | 2.0% | 3.4%(-1.39)#71 | 4.1%(-2.15)#12,605 |
| 72. | Mott | 2.0% | 3.4%(-1.41)#72 | 4.1%(-2.17)#12,643 |
| 73. | Mapleton | 2.0% | 3.4%(-1.42)#73 | 4.1%(-2.18)#12,652 |
| 74. | Bowbells | 1.8% | 3.4%(-1.56)#74 | 4.1%(-2.32)#12,978 |
| 75. | Hazen | 1.8% | 3.4%(-1.57)#75 | 4.1%(-2.33)#12,995 |
| 76. | Velva | 1.8% | 3.4%(-1.60)#76 | 4.1%(-2.36)#13,074 |
| 77. | Richardton | 1.7% | 3.4%(-1.66)#77 | 4.1%(-2.43)#13,192 |
| 78. | Mayville | 1.7% | 3.4%(-1.69)#78 | 4.1%(-2.45)#13,253 |
| 79. | New Salem | 1.6% | 3.4%(-1.74)#79 | 4.1%(-2.50)#13,346 |
| 80. | Wyndmere | 1.6% | 3.4%(-1.82)#80 | 4.1%(-2.58)#13,548 |
| 81. | Burlington | 1.5% | 3.4%(-1.88)#81 | 4.1%(-2.64)#13,662 |
| 82. | Ellendale | 1.5% | 3.4%(-1.91)#82 | 4.1%(-2.67)#13,702 |
| 83. | Steele | 1.4% | 3.4%(-1.99)#83 | 4.1%(-2.75)#13,847 |
| 84. | Manvel | 1.4% | 3.4%(-1.99)#84 | 4.1%(-2.75)#13,849 |
| 85. | Stanley | 1.4% | 3.4%(-1.99)#85 | 4.1%(-2.75)#13,858 |
| 86. | Reile S Acres | 1.4% | 3.4%(-2.01)#86 | 4.1%(-2.77)#13,889 |
| 87. | Tower City | 1.1% | 3.4%(-2.26)#87 | 4.1%(-3.02)#14,358 |
| 88. | Colfax | 1.1% | 3.4%(-2.29)#88 | 4.1%(-3.05)#14,403 |
| 89. | Bowman | 1.0% | 3.4%(-2.33)#89 | 4.1%(-3.09)#14,485 |
| 90. | Hebron | 1.0% | 3.4%(-2.33)#90 | 4.1%(-3.09)#14,488 |
| 91. | Devils Lake | 1.0% | 3.4%(-2.34)#91 | 4.1%(-3.10)#14,497 |
| 92. | Surrey | 1.0% | 3.4%(-2.35)#92 | 4.1%(-3.11)#14,505 |
| 93. | Park River | 0.94% | 3.4%(-2.43)#93 | 4.1%(-3.19)#14,621 |
| 94. | Valley City | 0.89% | 3.4%(-2.48)#94 | 4.1%(-3.24)#14,704 |
| 95. | Garrison | 0.88% | 3.4%(-2.49)#95 | 4.1%(-3.25)#14,722 |
| 96. | Watford City | 0.74% | 3.4%(-2.63)#96 | 4.1%(-3.39)#14,900 |
| 97. | Washburn | 0.73% | 3.4%(-2.64)#97 | 4.1%(-3.40)#14,908 |
| 98. | Hankinson | 0.69% | 3.4%(-2.68)#98 | 4.1%(-3.44)#14,946 |
| 99. | Rolla | 0.67% | 3.4%(-2.71)#99 | 4.1%(-3.47)#14,972 |
Common Questions
What are the Top 10 Cities with the Highest Percentage of Population with a Degree in Communications in North Dakota?
Top 10 Cities with the Highest Percentage of Population with a Degree in Communications in North Dakota are:
What city has the Highest Percentage of Population with a Degree in Communications in North Dakota?
Verona has the Highest Percentage of Population with a Degree in Communications in North Dakota with 100.0%.
What is the Percentage of Population with a Degree in Communications in the State of North Dakota?
Percentage of Population with a Degree in Communications in North Dakota is 3.4%.
What is the Percentage of Population with a Degree in Communications in the United States?
Percentage of Population with a Degree in Communications in the United States is 4.1%.