Cities with the Highest Percentage of Population with a Degree in Communications in Mississippi
RELATED REPORTS & OPTIONS
Communications
Mississippi
Compare Cities
Map of Cities with the Highest Percentage of Population with a Degree in Communications in Mississippi
0.0%
60.0%
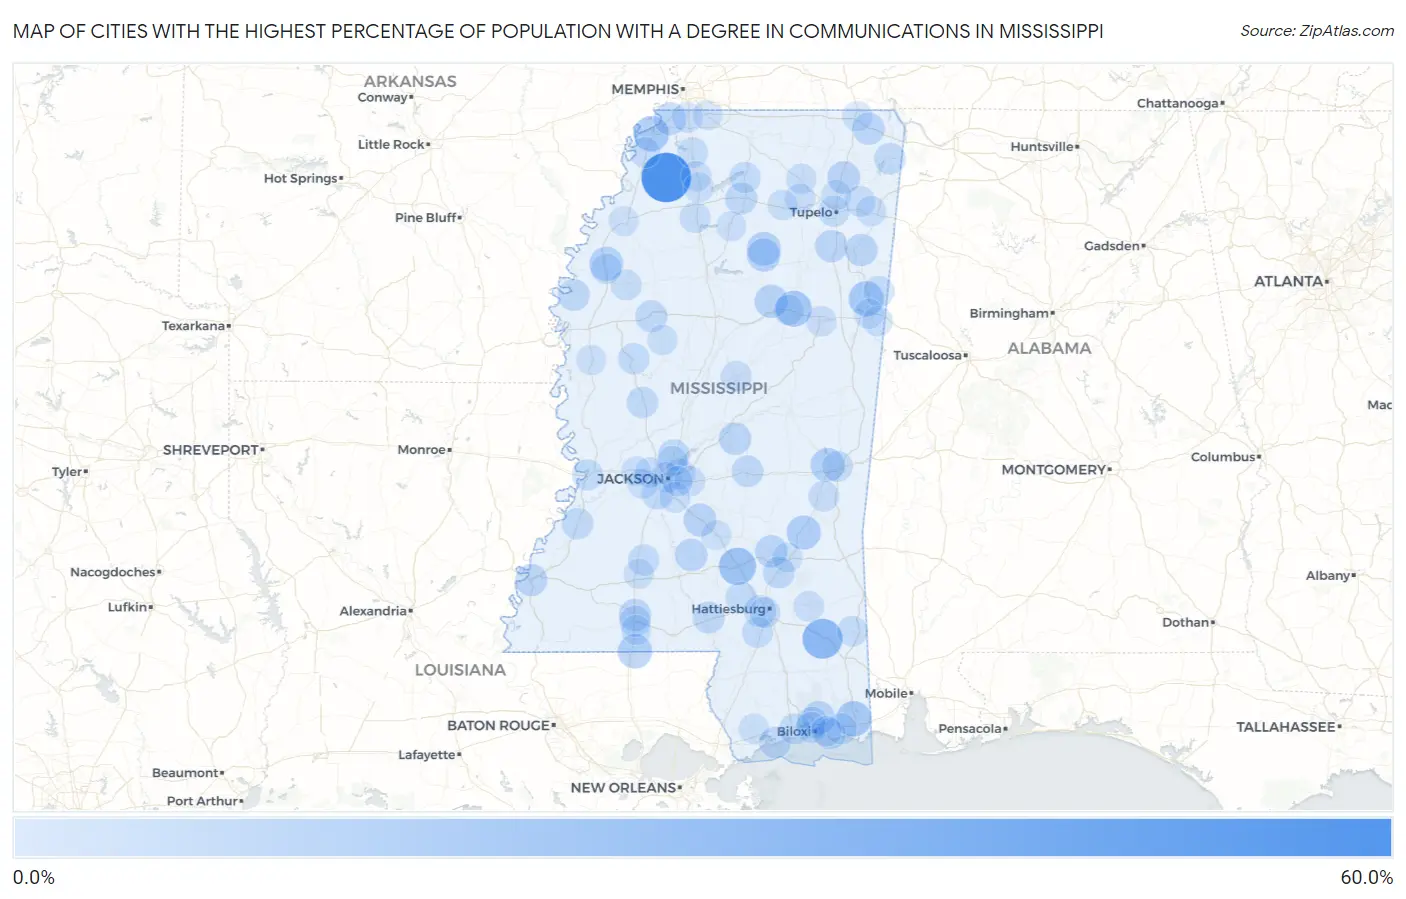
Cities with the Highest Percentage of Population with a Degree in Communications in Mississippi
| City | % Graduates | vs State | vs National | |
| 1. | Crenshaw | 54.5% | 2.4%(+52.2)#1 | 4.1%(+50.4)#62 |
| 2. | Mclain | 27.6% | 2.4%(+25.2)#2 | 4.1%(+23.5)#263 |
| 3. | Collins | 20.3% | 2.4%(+17.9)#3 | 4.1%(+16.1)#443 |
| 4. | Maben | 16.7% | 2.4%(+14.3)#4 | 4.1%(+12.5)#602 |
| 5. | Escatawpa | 15.5% | 2.4%(+13.1)#5 | 4.1%(+11.4)#708 |
| 6. | Tunica Resorts | 15.5% | 2.4%(+13.1)#6 | 4.1%(+11.4)#709 |
| 7. | Columbus Afb | 14.7% | 2.4%(+12.3)#7 | 4.1%(+10.5)#780 |
| 8. | Osyka | 12.5% | 2.4%(+10.1)#8 | 4.1%(+8.36)#1,050 |
| 9. | Heidelberg | 11.9% | 2.4%(+9.52)#9 | 4.1%(+7.77)#1,151 |
| 10. | Mound Bayou | 11.7% | 2.4%(+9.32)#10 | 4.1%(+7.56)#1,202 |
| 11. | Nellieburg | 11.5% | 2.4%(+9.09)#11 | 4.1%(+7.34)#1,236 |
| 12. | Bruce | 10.9% | 2.4%(+8.52)#12 | 4.1%(+6.77)#1,359 |
| 13. | Walthall | 9.8% | 2.4%(+7.38)#13 | 4.1%(+5.62)#1,655 |
| 14. | Pittsboro | 9.5% | 2.4%(+7.14)#14 | 4.1%(+5.39)#1,741 |
| 15. | D Lo | 9.1% | 2.4%(+6.71)#15 | 4.1%(+4.96)#1,874 |
| 16. | Latimer | 8.8% | 2.4%(+6.45)#16 | 4.1%(+4.70)#1,976 |
| 17. | Baldwyn | 8.3% | 2.4%(+5.91)#17 | 4.1%(+4.16)#2,219 |
| 18. | New Hebron | 8.2% | 2.4%(+5.82)#18 | 4.1%(+4.06)#2,270 |
| 19. | Walls | 8.1% | 2.4%(+5.67)#19 | 4.1%(+3.92)#2,328 |
| 20. | Lena | 7.7% | 2.4%(+5.31)#20 | 4.1%(+3.56)#2,546 |
| 21. | Soso | 7.5% | 2.4%(+5.12)#21 | 4.1%(+3.36)#2,652 |
| 22. | Amory | 7.4% | 2.4%(+5.00)#22 | 4.1%(+3.24)#2,732 |
| 23. | Summit | 7.3% | 2.4%(+4.90)#23 | 4.1%(+3.14)#2,815 |
| 24. | Okolona | 7.2% | 2.4%(+4.80)#24 | 4.1%(+3.05)#2,882 |
| 25. | Natchez | 6.7% | 2.4%(+4.34)#25 | 4.1%(+2.59)#3,290 |
| 26. | Glen | 6.7% | 2.4%(+4.29)#26 | 4.1%(+2.53)#3,344 |
| 27. | Oxford | 6.5% | 2.4%(+4.09)#27 | 4.1%(+2.34)#3,525 |
| 28. | Itta Bena | 6.5% | 2.4%(+4.07)#28 | 4.1%(+2.32)#3,544 |
| 29. | Columbia | 6.4% | 2.4%(+3.98)#29 | 4.1%(+2.23)#3,626 |
| 30. | West Hattiesburg | 6.3% | 2.4%(+3.95)#30 | 4.1%(+2.20)#3,661 |
| 31. | Benoit | 6.1% | 2.4%(+3.68)#31 | 4.1%(+1.93)#3,966 |
| 32. | Ellisville | 5.9% | 2.4%(+3.48)#32 | 4.1%(+1.73)#4,201 |
| 33. | Forest | 5.8% | 2.4%(+3.46)#33 | 4.1%(+1.71)#4,228 |
| 34. | Tishomingo | 5.5% | 2.4%(+3.07)#34 | 4.1%(+1.32)#4,760 |
| 35. | Pass Christian | 5.2% | 2.4%(+2.87)#35 | 4.1%(+1.11)#5,078 |
| 36. | D Iberville | 5.0% | 2.4%(+2.61)#36 | 4.1%(+0.857)#5,479 |
| 37. | Madison | 5.0% | 2.4%(+2.61)#37 | 4.1%(+0.853)#5,486 |
| 38. | Port Gibson | 5.0% | 2.4%(+2.60)#38 | 4.1%(+0.847)#5,495 |
| 39. | Byram | 5.0% | 2.4%(+2.57)#39 | 4.1%(+0.818)#5,543 |
| 40. | Oak Grove | 4.9% | 2.4%(+2.53)#40 | 4.1%(+0.778)#5,624 |
| 41. | Gulf Park Estates | 4.8% | 2.4%(+2.44)#41 | 4.1%(+0.686)#5,792 |
| 42. | Belzoni | 4.8% | 2.4%(+2.40)#42 | 4.1%(+0.643)#5,853 |
| 43. | Yazoo City | 4.8% | 2.4%(+2.39)#43 | 4.1%(+0.640)#5,859 |
| 44. | Mccomb | 4.7% | 2.4%(+2.34)#44 | 4.1%(+0.589)#5,972 |
| 45. | Gulfport | 4.6% | 2.4%(+2.20)#45 | 4.1%(+0.447)#6,258 |
| 46. | Sumrall | 4.6% | 2.4%(+2.19)#46 | 4.1%(+0.435)#6,287 |
| 47. | Abbeville | 4.5% | 2.4%(+2.16)#47 | 4.1%(+0.410)#6,343 |
| 48. | Wesson | 4.4% | 2.4%(+2.03)#48 | 4.1%(+0.277)#6,621 |
| 49. | Vicksburg | 3.9% | 2.4%(+1.51)#49 | 4.1%(-0.241)#7,795 |
| 50. | Purvis | 3.9% | 2.4%(+1.51)#50 | 4.1%(-0.244)#7,802 |
| 51. | Tupelo | 3.9% | 2.4%(+1.50)#51 | 4.1%(-0.250)#7,817 |
| 52. | Pope | 3.8% | 2.4%(+1.41)#52 | 4.1%(-0.347)#8,057 |
| 53. | Flowood | 3.7% | 2.4%(+1.35)#53 | 4.1%(-0.404)#8,170 |
| 54. | Biloxi | 3.7% | 2.4%(+1.31)#54 | 4.1%(-0.443)#8,273 |
| 55. | Gautier | 3.7% | 2.4%(+1.30)#55 | 4.1%(-0.457)#8,305 |
| 56. | Hattiesburg | 3.6% | 2.4%(+1.25)#56 | 4.1%(-0.503)#8,412 |
| 57. | Caledonia | 3.4% | 2.4%(+1.05)#57 | 4.1%(-0.706)#8,915 |
| 58. | Kosciusko | 3.4% | 2.4%(+1.01)#58 | 4.1%(-0.749)#9,017 |
| 59. | Meridian | 3.3% | 2.4%(+0.962)#59 | 4.1%(-0.793)#9,128 |
| 60. | Mantachie | 3.3% | 2.4%(+0.953)#60 | 4.1%(-0.802)#9,147 |
| 61. | Enterprise | 3.3% | 2.4%(+0.953)#61 | 4.1%(-0.802)#9,158 |
| 62. | Ruleville | 3.2% | 2.4%(+0.857)#62 | 4.1%(-0.898)#9,403 |
| 63. | Jackson | 3.2% | 2.4%(+0.788)#63 | 4.1%(-0.966)#9,577 |
| 64. | Ridgeland | 3.2% | 2.4%(+0.780)#64 | 4.1%(-0.974)#9,589 |
| 65. | Leakesville | 3.1% | 2.4%(+0.691)#65 | 4.1%(-1.06)#9,808 |
| 66. | Coldwater | 3.1% | 2.4%(+0.680)#66 | 4.1%(-1.07)#9,834 |
| 67. | Tunica | 3.0% | 2.4%(+0.638)#67 | 4.1%(-1.12)#9,949 |
| 68. | Richton | 2.9% | 2.4%(+0.539)#68 | 4.1%(-1.22)#10,218 |
| 69. | Merigold | 2.9% | 2.4%(+0.476)#69 | 4.1%(-1.28)#10,380 |
| 70. | Ocean Springs | 2.8% | 2.4%(+0.426)#70 | 4.1%(-1.33)#10,514 |
| 71. | Starkville | 2.6% | 2.4%(+0.181)#71 | 4.1%(-1.57)#11,153 |
| 72. | Gluckstadt | 2.4% | 2.4%(+0.024)#72 | 4.1%(-1.73)#11,545 |
| 73. | Southaven | 2.4% | 2.4%(+0.016)#73 | 4.1%(-1.74)#11,564 |
| 74. | Como | 2.4% | 2.4%(-0.028)#74 | 4.1%(-1.78)#11,679 |
| 75. | Brandon | 2.3% | 2.4%(-0.035)#75 | 4.1%(-1.79)#11,702 |
| 76. | Florence | 2.3% | 2.4%(-0.088)#76 | 4.1%(-1.84)#11,829 |
| 77. | New Albany | 2.3% | 2.4%(-0.090)#77 | 4.1%(-1.84)#11,840 |
| 78. | New Hope | 2.2% | 2.4%(-0.155)#78 | 4.1%(-1.91)#11,996 |
| 79. | Cruger | 2.2% | 2.4%(-0.159)#79 | 4.1%(-1.91)#12,008 |
| 80. | Clinton | 2.2% | 2.4%(-0.160)#80 | 4.1%(-1.91)#12,011 |
| 81. | Pearl | 2.2% | 2.4%(-0.205)#81 | 4.1%(-1.96)#12,114 |
| 82. | Fulton | 2.2% | 2.4%(-0.207)#82 | 4.1%(-1.96)#12,118 |
| 83. | Ecru | 2.2% | 2.4%(-0.207)#83 | 4.1%(-1.96)#12,125 |
| 84. | Raymond | 2.1% | 2.4%(-0.276)#84 | 4.1%(-2.03)#12,289 |
| 85. | Thaxton | 2.1% | 2.4%(-0.283)#85 | 4.1%(-2.04)#12,315 |
| 86. | Mathiston | 2.1% | 2.4%(-0.312)#86 | 4.1%(-2.07)#12,390 |
| 87. | Clarksdale | 2.0% | 2.4%(-0.337)#87 | 4.1%(-2.09)#12,450 |
| 88. | Corinth | 2.0% | 2.4%(-0.372)#88 | 4.1%(-2.13)#12,529 |
| 89. | Laurel | 2.0% | 2.4%(-0.396)#89 | 4.1%(-2.15)#12,593 |
| 90. | Sardis | 2.0% | 2.4%(-0.407)#90 | 4.1%(-2.16)#12,617 |
| 91. | Kiln | 2.0% | 2.4%(-0.430)#91 | 4.1%(-2.18)#12,662 |
| 92. | Brookhaven | 1.9% | 2.4%(-0.517)#92 | 4.1%(-2.27)#12,867 |
| 93. | Hollandale | 1.8% | 2.4%(-0.536)#93 | 4.1%(-2.29)#12,910 |
| 94. | Columbus | 1.8% | 2.4%(-0.573)#94 | 4.1%(-2.33)#12,992 |
| 95. | Magee | 1.8% | 2.4%(-0.586)#95 | 4.1%(-2.34)#13,023 |
| 96. | Water Valley | 1.8% | 2.4%(-0.626)#96 | 4.1%(-2.38)#13,107 |
| 97. | Bolton | 1.8% | 2.4%(-0.626)#97 | 4.1%(-2.38)#13,110 |
| 98. | Magnolia | 1.7% | 2.4%(-0.686)#98 | 4.1%(-2.44)#13,216 |
| 99. | Saltillo | 1.7% | 2.4%(-0.689)#99 | 4.1%(-2.44)#13,229 |
| 100. | Olive Branch | 1.6% | 2.4%(-0.733)#100 | 4.1%(-2.49)#13,324 |
Common Questions
What are the Top 10 Cities with the Highest Percentage of Population with a Degree in Communications in Mississippi?
Top 10 Cities with the Highest Percentage of Population with a Degree in Communications in Mississippi are:
#1
54.5%
#2
27.6%
#3
20.3%
#4
16.7%
#5
15.5%
#6
15.5%
#7
14.7%
#8
12.5%
#9
11.9%
#10
11.7%
What city has the Highest Percentage of Population with a Degree in Communications in Mississippi?
Crenshaw has the Highest Percentage of Population with a Degree in Communications in Mississippi with 54.5%.
What is the Percentage of Population with a Degree in Communications in the State of Mississippi?
Percentage of Population with a Degree in Communications in Mississippi is 2.4%.
What is the Percentage of Population with a Degree in Communications in the United States?
Percentage of Population with a Degree in Communications in the United States is 4.1%.