Zip Codes with the Highest Percentage of Population Employed in Administrative & Support Services in Round Rock, TX
RELATED REPORTS & OPTIONS
Administrative & Support Services
Round Rock
Compare Zip Codes
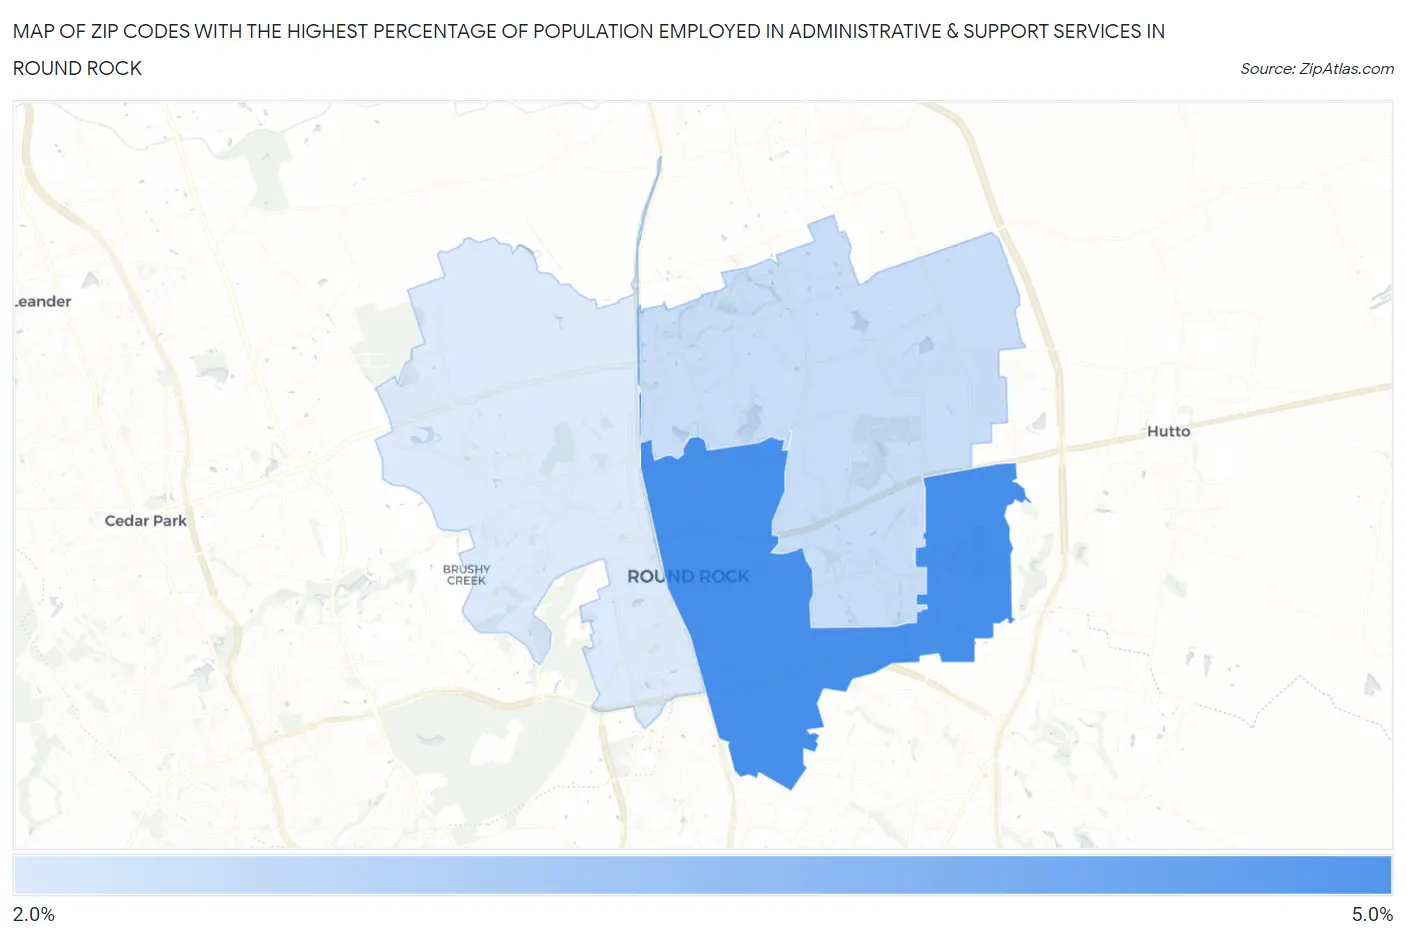
Map of Zip Codes with the Highest Percentage of Population Employed in Administrative & Support Services in Round Rock
0.0%
5.0%
Zip Codes with the Highest Percentage of Population Employed in Administrative & Support Services in Round Rock, TX
| Zip Code | % Employed | vs State | vs National | |
| 1. | 78664 | 4.9% | 4.4%(+0.483)#541 | 4.1%(+0.749)#7,413 |
| 2. | 78665 | 2.8% | 4.4%(-1.61)#1,085 | 4.1%(-1.35)#16,538 |
| 3. | 78681 | 2.4% | 4.4%(-1.97)#1,175 | 4.1%(-1.70)#18,393 |
1
Common Questions
What are the Top Zip Codes with the Highest Percentage of Population Employed in Administrative & Support Services in Round Rock, TX?
Top Zip Codes with the Highest Percentage of Population Employed in Administrative & Support Services in Round Rock, TX are:
What zip code has the Highest Percentage of Population Employed in Administrative & Support Services in Round Rock, TX?
78664 has the Highest Percentage of Population Employed in Administrative & Support Services in Round Rock, TX with 4.9%.
What is the Percentage of Population Employed in Administrative & Support Services in Round Rock, TX?
Percentage of Population Employed in Administrative & Support Services in Round Rock is 3.8%.
What is the Percentage of Population Employed in Administrative & Support Services in Texas?
Percentage of Population Employed in Administrative & Support Services in Texas is 4.4%.
What is the Percentage of Population Employed in Administrative & Support Services in the United States?
Percentage of Population Employed in Administrative & Support Services in the United States is 4.1%.