Zip Codes with the Highest Percentage of Population Employed in Administrative & Support Services in Brownsville, TX
RELATED REPORTS & OPTIONS
Administrative & Support Services
Brownsville
Compare Zip Codes
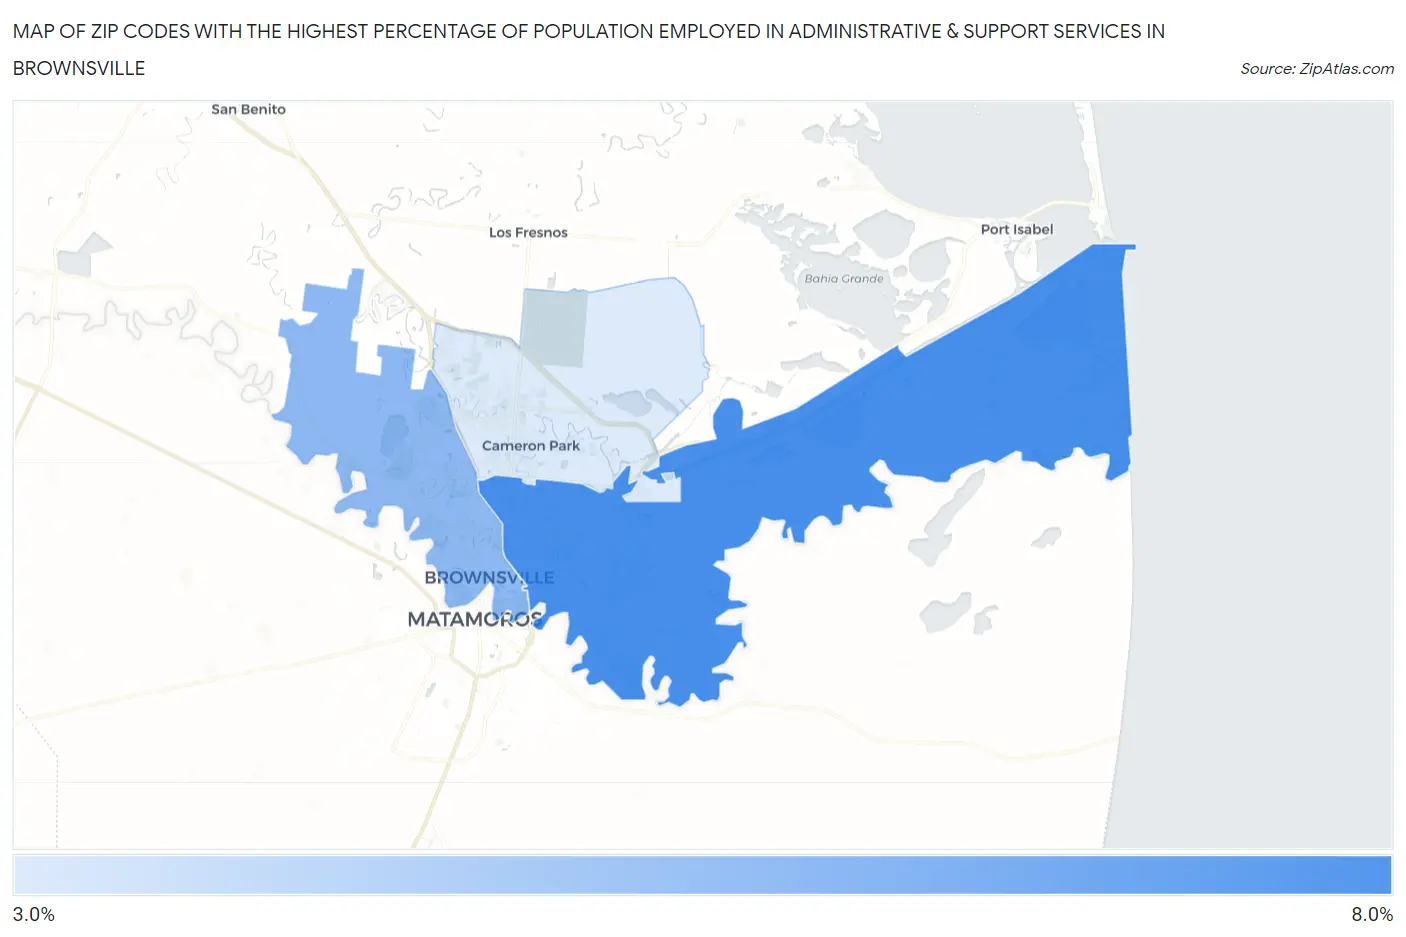
Map of Zip Codes with the Highest Percentage of Population Employed in Administrative & Support Services in Brownsville
0.0%
8.0%
Zip Codes with the Highest Percentage of Population Employed in Administrative & Support Services in Brownsville, TX
| Zip Code | % Employed | vs State | vs National | |
| 1. | 78521 | 6.6% | 4.4%(+2.18)#278 | 4.1%(+2.45)#3,768 |
| 2. | 78520 | 5.0% | 4.4%(+0.620)#513 | 4.1%(+0.886)#7,011 |
| 3. | 78526 | 3.3% | 4.4%(-1.15)#947 | 4.1%(-0.884)#14,121 |
1
Common Questions
What are the Top Zip Codes with the Highest Percentage of Population Employed in Administrative & Support Services in Brownsville, TX?
Top Zip Codes with the Highest Percentage of Population Employed in Administrative & Support Services in Brownsville, TX are:
What zip code has the Highest Percentage of Population Employed in Administrative & Support Services in Brownsville, TX?
78521 has the Highest Percentage of Population Employed in Administrative & Support Services in Brownsville, TX with 6.6%.
What is the Percentage of Population Employed in Administrative & Support Services in Brownsville, TX?
Percentage of Population Employed in Administrative & Support Services in Brownsville is 5.1%.
What is the Percentage of Population Employed in Administrative & Support Services in Texas?
Percentage of Population Employed in Administrative & Support Services in Texas is 4.4%.
What is the Percentage of Population Employed in Administrative & Support Services in the United States?
Percentage of Population Employed in Administrative & Support Services in the United States is 4.1%.