Zip Codes with the Highest Percentage of Population Employed in Administrative & Support Services in Georgetown, TX
RELATED REPORTS & OPTIONS
Administrative & Support Services
Georgetown
Compare Zip Codes
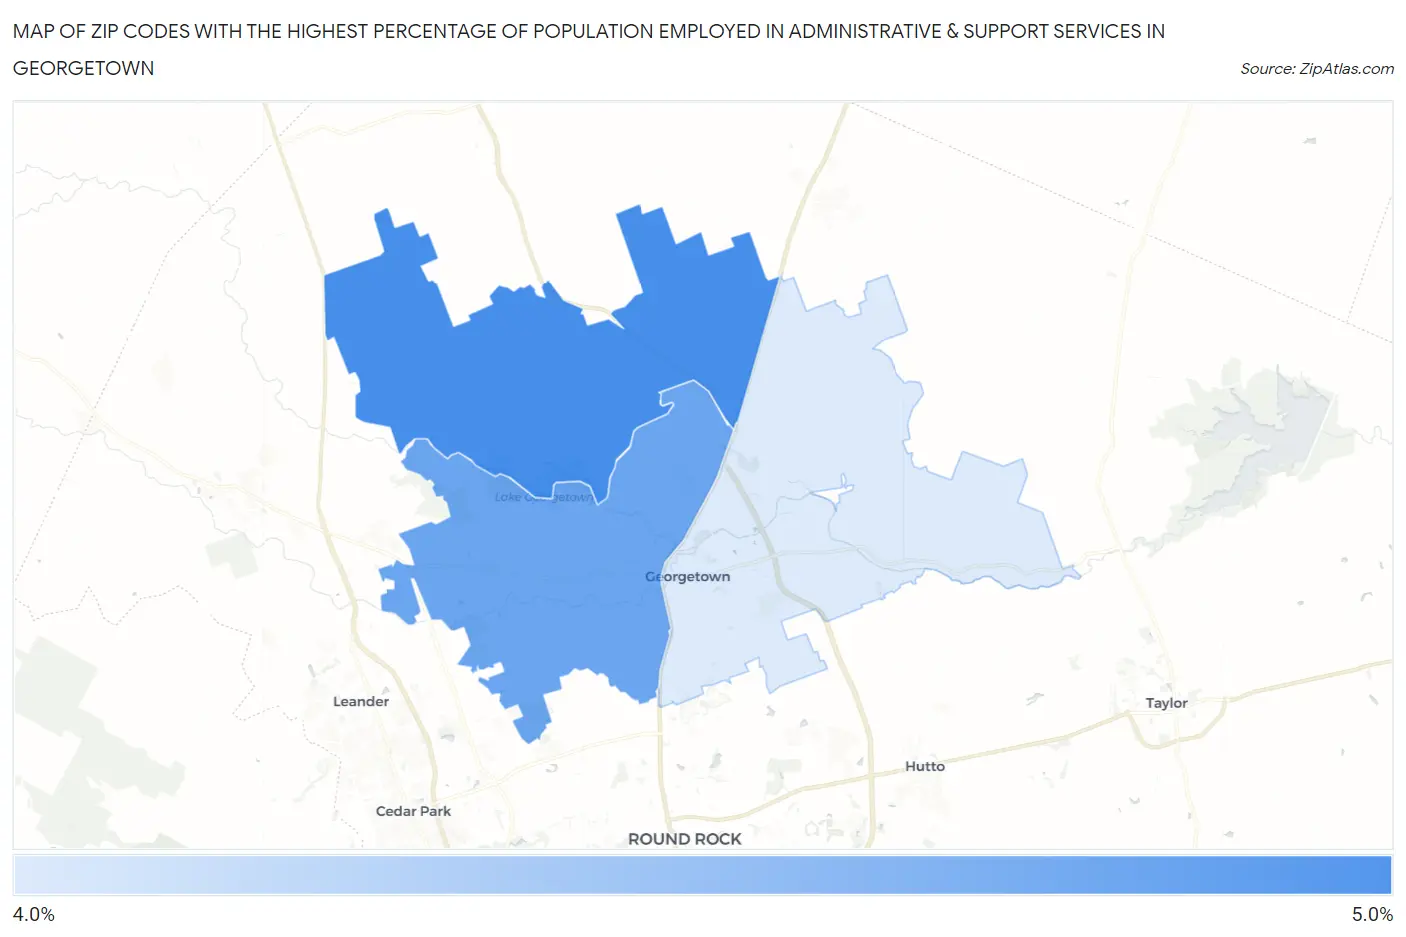
Map of Zip Codes with the Highest Percentage of Population Employed in Administrative & Support Services in Georgetown
0.0%
5.0%
Zip Codes with the Highest Percentage of Population Employed in Administrative & Support Services in Georgetown, TX
| Zip Code | % Employed | vs State | vs National | |
| 1. | 78633 | 4.8% | 4.4%(+0.369)#572 | 4.1%(+0.635)#7,774 |
| 2. | 78628 | 4.6% | 4.4%(+0.183)#605 | 4.1%(+0.449)#8,380 |
| 3. | 78626 | 4.0% | 4.4%(-0.388)#738 | 4.1%(-0.122)#10,570 |
1
Common Questions
What are the Top Zip Codes with the Highest Percentage of Population Employed in Administrative & Support Services in Georgetown, TX?
Top Zip Codes with the Highest Percentage of Population Employed in Administrative & Support Services in Georgetown, TX are:
What zip code has the Highest Percentage of Population Employed in Administrative & Support Services in Georgetown, TX?
78633 has the Highest Percentage of Population Employed in Administrative & Support Services in Georgetown, TX with 4.8%.
What is the Percentage of Population Employed in Administrative & Support Services in Georgetown, TX?
Percentage of Population Employed in Administrative & Support Services in Georgetown is 4.6%.
What is the Percentage of Population Employed in Administrative & Support Services in Texas?
Percentage of Population Employed in Administrative & Support Services in Texas is 4.4%.
What is the Percentage of Population Employed in Administrative & Support Services in the United States?
Percentage of Population Employed in Administrative & Support Services in the United States is 4.1%.