Zip Codes with the Highest Percentage of Population Employed in Administrative & Support Services in Richmond, TX
RELATED REPORTS & OPTIONS
Administrative & Support Services
Richmond
Compare Zip Codes
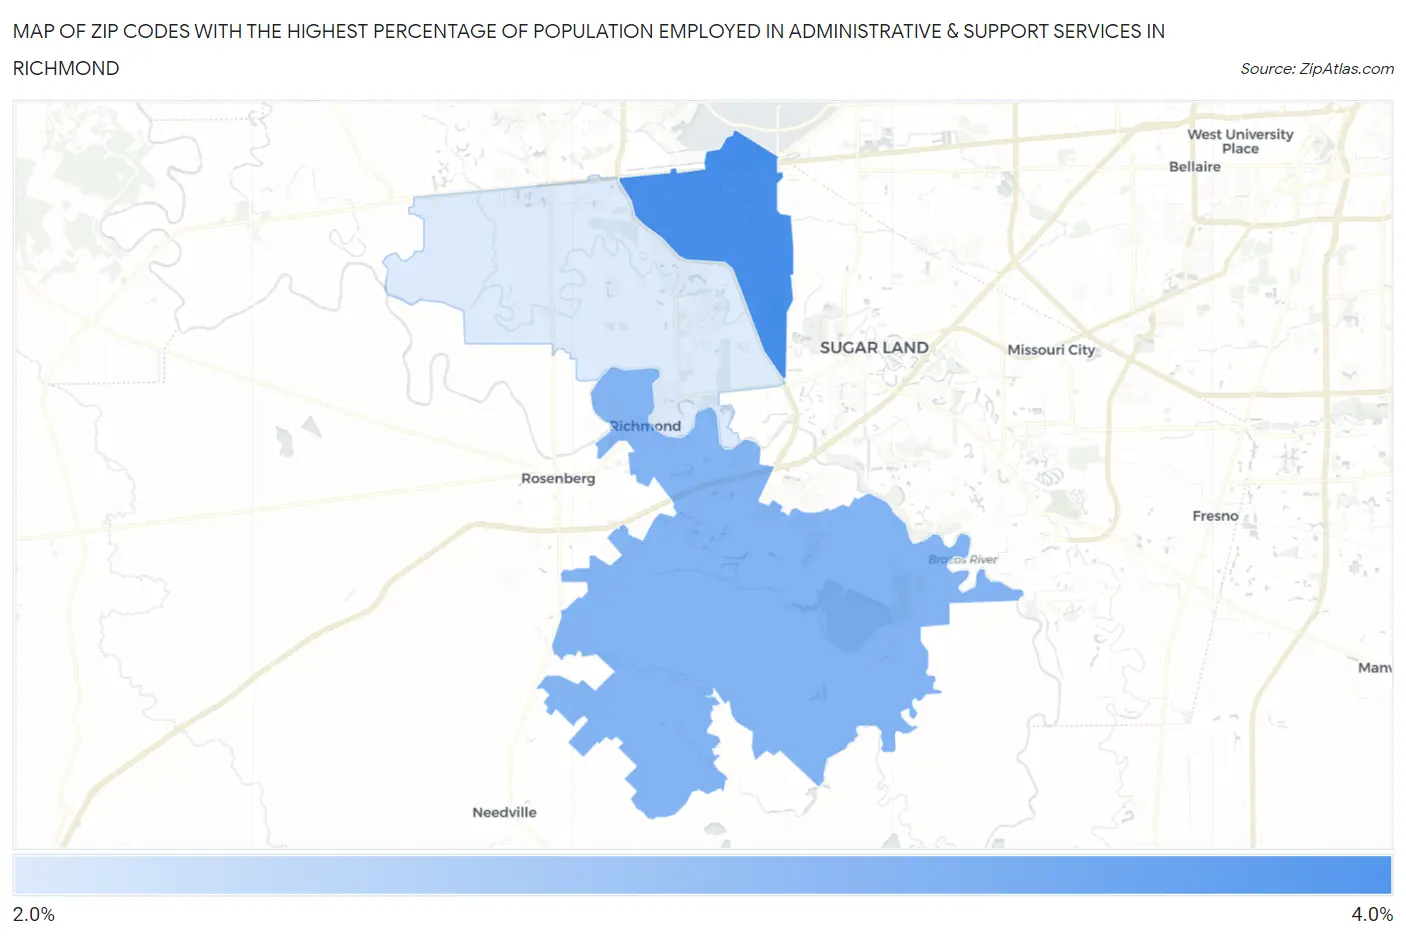
Map of Zip Codes with the Highest Percentage of Population Employed in Administrative & Support Services in Richmond
0.0%
4.0%
Zip Codes with the Highest Percentage of Population Employed in Administrative & Support Services in Richmond, TX
| Zip Code | % Employed | vs State | vs National | |
| 1. | 77407 | 3.6% | 4.4%(-0.834)#856 | 4.1%(-0.568)#12,559 |
| 2. | 77469 | 3.0% | 4.4%(-1.39)#1,024 | 4.1%(-1.12)#15,322 |
| 3. | 77406 | 2.1% | 4.4%(-2.27)#1,242 | 4.1%(-2.00)#19,916 |
1
Common Questions
What are the Top Zip Codes with the Highest Percentage of Population Employed in Administrative & Support Services in Richmond, TX?
Top Zip Codes with the Highest Percentage of Population Employed in Administrative & Support Services in Richmond, TX are:
What zip code has the Highest Percentage of Population Employed in Administrative & Support Services in Richmond, TX?
77407 has the Highest Percentage of Population Employed in Administrative & Support Services in Richmond, TX with 3.6%.
What is the Percentage of Population Employed in Administrative & Support Services in Richmond, TX?
Percentage of Population Employed in Administrative & Support Services in Richmond is 5.3%.
What is the Percentage of Population Employed in Administrative & Support Services in Texas?
Percentage of Population Employed in Administrative & Support Services in Texas is 4.4%.
What is the Percentage of Population Employed in Administrative & Support Services in the United States?
Percentage of Population Employed in Administrative & Support Services in the United States is 4.1%.