Zip Codes with the Highest Percentage of Population Employed in Administrative & Support Services in Missouri City, TX
RELATED REPORTS & OPTIONS
Administrative & Support Services
Missouri City
Compare Zip Codes
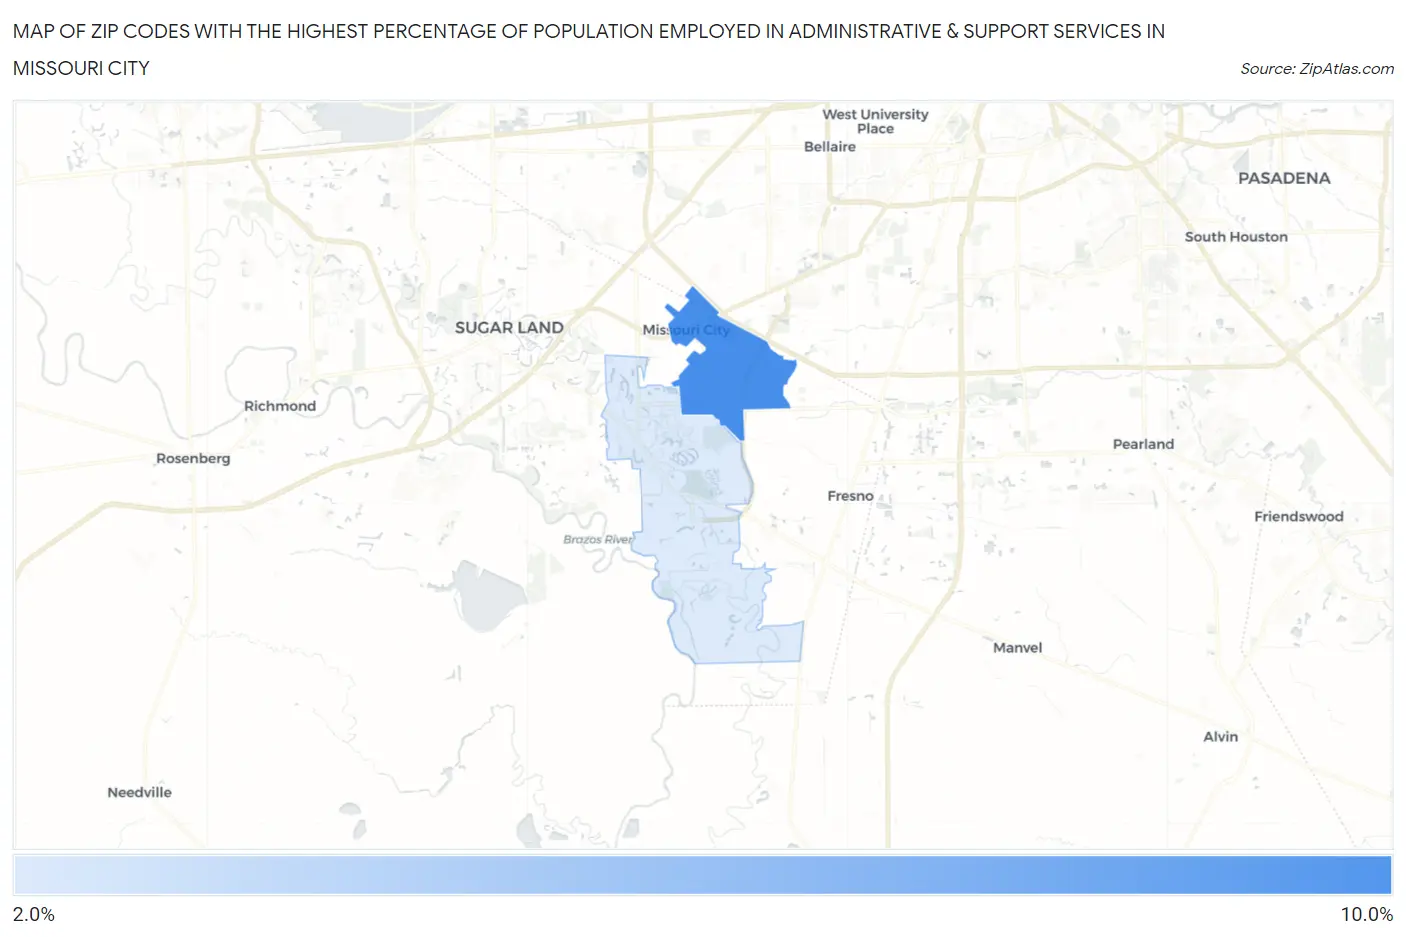
Map of Zip Codes with the Highest Percentage of Population Employed in Administrative & Support Services in Missouri City
0.0%
10.0%
Zip Codes with the Highest Percentage of Population Employed in Administrative & Support Services in Missouri City, TX
| Zip Code | % Employed | vs State | vs National | |
| 1. | 77489 | 8.3% | 4.4%(+3.86)#142 | 4.1%(+4.12)#2,103 |
| 2. | 77459 | 2.8% | 4.4%(-1.58)#1,073 | 4.1%(-1.31)#16,339 |
1
Common Questions
What are the Top Zip Codes with the Highest Percentage of Population Employed in Administrative & Support Services in Missouri City, TX?
Top Zip Codes with the Highest Percentage of Population Employed in Administrative & Support Services in Missouri City, TX are:
What zip code has the Highest Percentage of Population Employed in Administrative & Support Services in Missouri City, TX?
77489 has the Highest Percentage of Population Employed in Administrative & Support Services in Missouri City, TX with 8.3%.
What is the Percentage of Population Employed in Administrative & Support Services in Missouri City, TX?
Percentage of Population Employed in Administrative & Support Services in Missouri City is 4.1%.
What is the Percentage of Population Employed in Administrative & Support Services in Texas?
Percentage of Population Employed in Administrative & Support Services in Texas is 4.4%.
What is the Percentage of Population Employed in Administrative & Support Services in the United States?
Percentage of Population Employed in Administrative & Support Services in the United States is 4.1%.