Zip Codes with the Highest Percentage of Population Employed in Administrative & Support Services in Sugar Land, TX
RELATED REPORTS & OPTIONS
Administrative & Support Services
Sugar Land
Compare Zip Codes
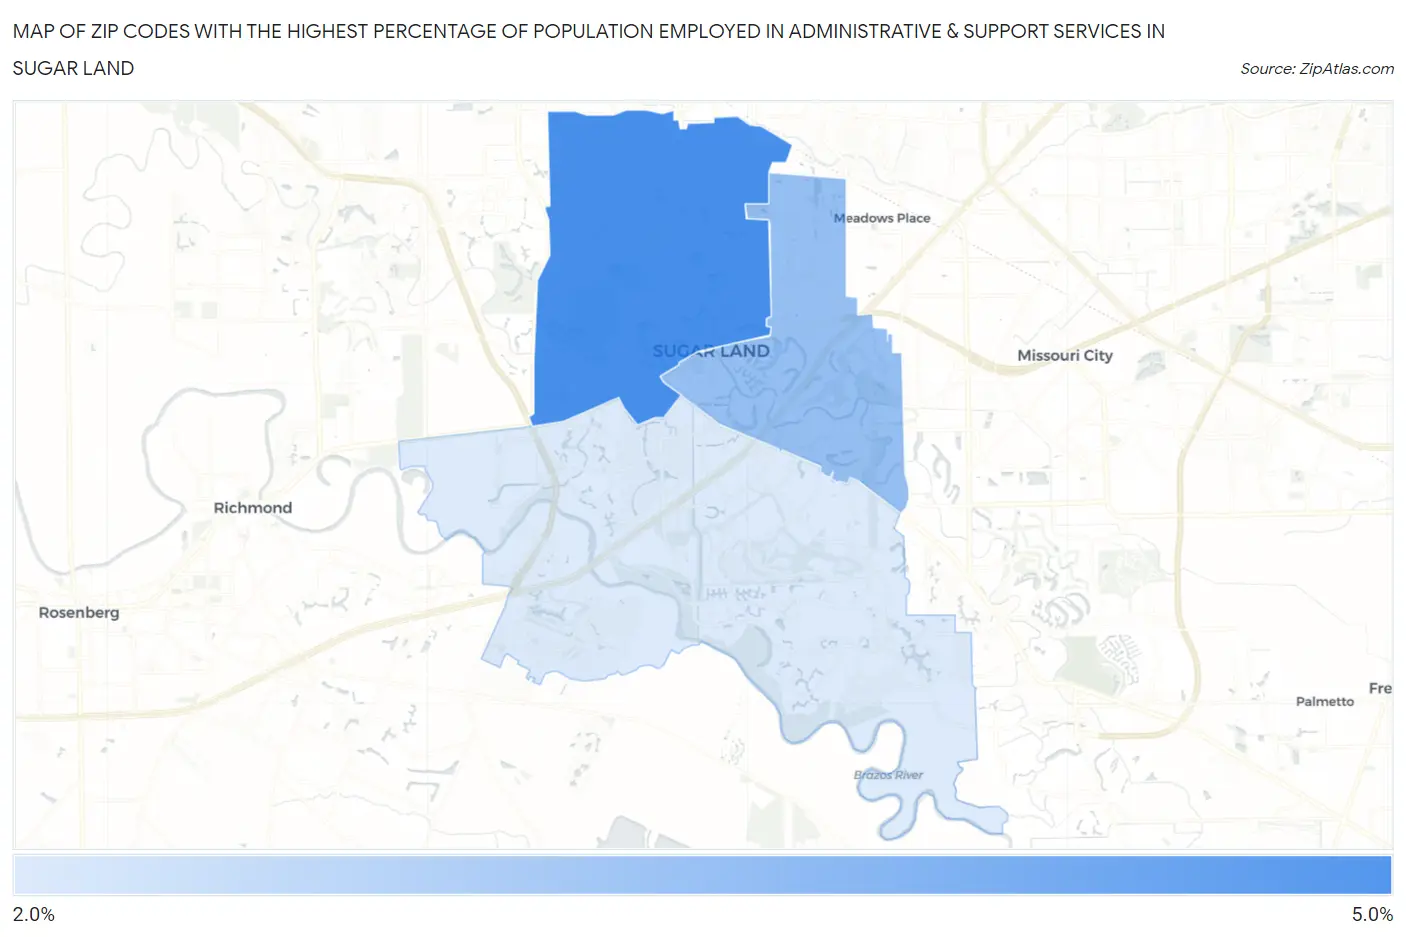
Map of Zip Codes with the Highest Percentage of Population Employed in Administrative & Support Services in Sugar Land
0.0%
5.0%
Zip Codes with the Highest Percentage of Population Employed in Administrative & Support Services in Sugar Land, TX
| Zip Code | % Employed | vs State | vs National | |
| 1. | 77498 | 4.3% | 4.4%(-0.144)#672 | 4.1%(+0.122)#9,552 |
| 2. | 77478 | 3.1% | 4.4%(-1.31)#1,000 | 4.1%(-1.04)#14,954 |
| 3. | 77479 | 2.0% | 4.4%(-2.39)#1,274 | 4.1%(-2.12)#20,489 |
1
Common Questions
What are the Top Zip Codes with the Highest Percentage of Population Employed in Administrative & Support Services in Sugar Land, TX?
Top Zip Codes with the Highest Percentage of Population Employed in Administrative & Support Services in Sugar Land, TX are:
What zip code has the Highest Percentage of Population Employed in Administrative & Support Services in Sugar Land, TX?
77498 has the Highest Percentage of Population Employed in Administrative & Support Services in Sugar Land, TX with 4.3%.
What is the Percentage of Population Employed in Administrative & Support Services in Sugar Land, TX?
Percentage of Population Employed in Administrative & Support Services in Sugar Land is 2.6%.
What is the Percentage of Population Employed in Administrative & Support Services in Texas?
Percentage of Population Employed in Administrative & Support Services in Texas is 4.4%.
What is the Percentage of Population Employed in Administrative & Support Services in the United States?
Percentage of Population Employed in Administrative & Support Services in the United States is 4.1%.