Zip Codes with the Highest Percentage of Population Employed in Administrative & Support Services in Irving, TX
RELATED REPORTS & OPTIONS
Administrative & Support Services
Irving
Compare Zip Codes
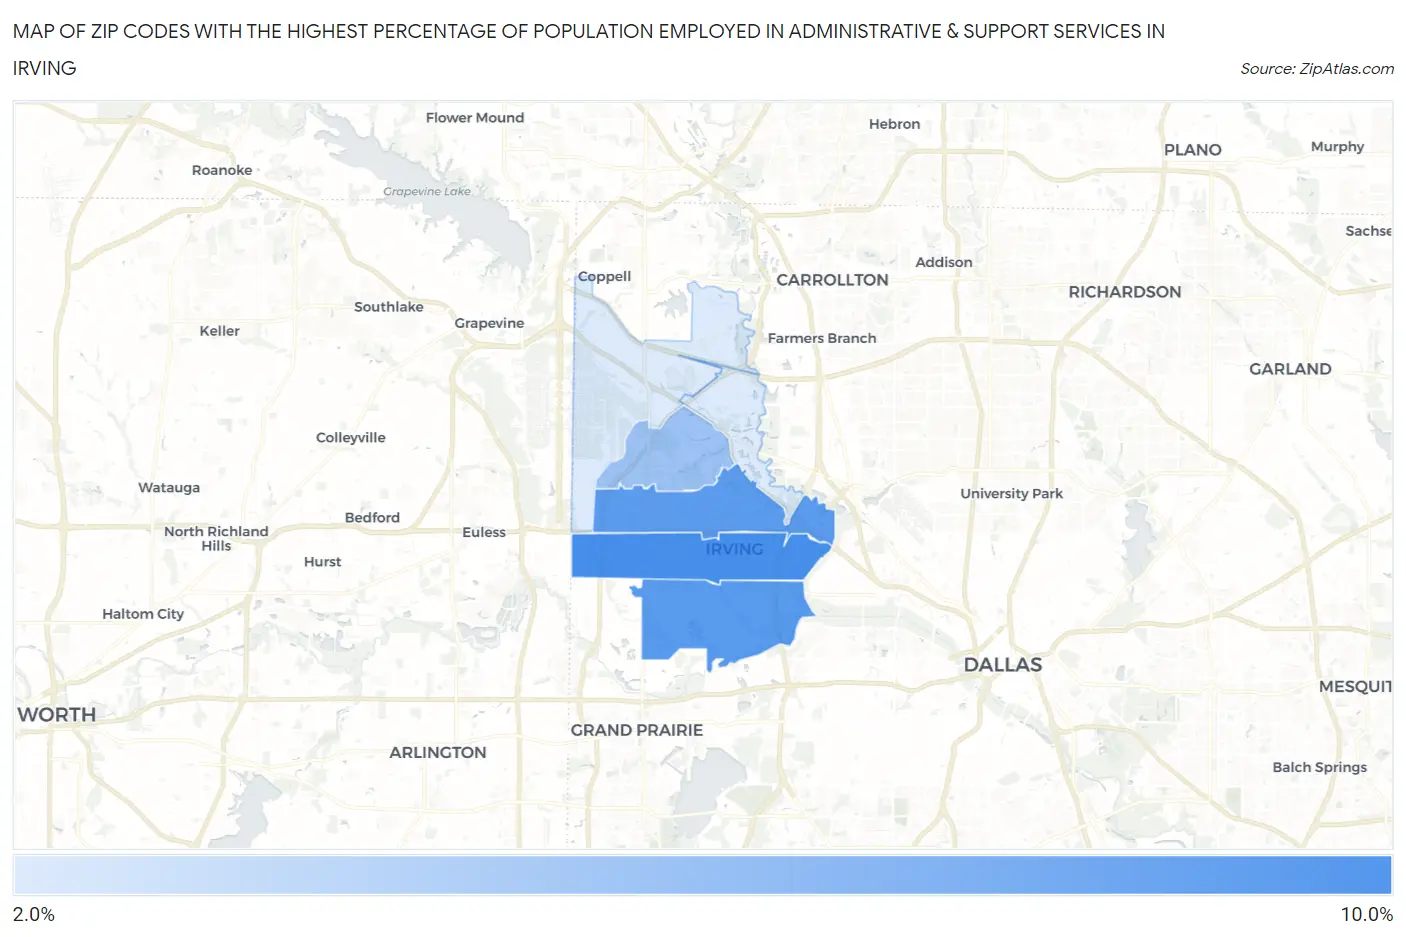
Map of Zip Codes with the Highest Percentage of Population Employed in Administrative & Support Services in Irving
0.0%
10.0%
Zip Codes with the Highest Percentage of Population Employed in Administrative & Support Services in Irving, TX
| Zip Code | % Employed | vs State | vs National | |
| 1. | 75061 | 8.7% | 4.4%(+4.24)#124 | 4.1%(+4.51)#1,874 |
| 2. | 75060 | 8.0% | 4.4%(+3.58)#154 | 4.1%(+3.84)#2,282 |
| 3. | 75062 | 7.8% | 4.4%(+3.40)#168 | 4.1%(+3.67)#2,406 |
| 4. | 75038 | 5.2% | 4.4%(+0.801)#483 | 4.1%(+1.07)#6,558 |
| 5. | 75039 | 2.7% | 4.4%(-1.76)#1,119 | 4.1%(-1.49)#17,296 |
| 6. | 75063 | 2.6% | 4.4%(-1.78)#1,127 | 4.1%(-1.52)#17,427 |
1
Common Questions
What are the Top 5 Zip Codes with the Highest Percentage of Population Employed in Administrative & Support Services in Irving, TX?
Top 5 Zip Codes with the Highest Percentage of Population Employed in Administrative & Support Services in Irving, TX are:
What zip code has the Highest Percentage of Population Employed in Administrative & Support Services in Irving, TX?
75061 has the Highest Percentage of Population Employed in Administrative & Support Services in Irving, TX with 8.7%.
What is the Percentage of Population Employed in Administrative & Support Services in Irving, TX?
Percentage of Population Employed in Administrative & Support Services in Irving is 6.1%.
What is the Percentage of Population Employed in Administrative & Support Services in Texas?
Percentage of Population Employed in Administrative & Support Services in Texas is 4.4%.
What is the Percentage of Population Employed in Administrative & Support Services in the United States?
Percentage of Population Employed in Administrative & Support Services in the United States is 4.1%.